Introduction
Preoperative chemoradiotherapy (preop-CRT) is
considered as the standard treatment option for locally advanced
rectal cancer (1). Following reports
on the favorable long-term oncological outcome of patients with
pathologic complete response (pCR) (2–4),
investigation into potentially useful clinicopathological factors
for predicting pCR was conducted, with various factors proposed to
be associated with pCR (5,6). Delaying surgery for patients who
presented with good clinical outcomes has gained popularity
recently (7,8). It was reported that following preop-CRT
in rectal cancer, persistent lymph node metastasis (LNM) was the
most indicative factor of poor prognosis (9,10). In
addition, yp node (ypN) positivity (metastatic lymph node detection
after surgery) was revealed to be the most important prognostic
factor to predict the survival of patients harboring no residual
tumor (ypT0) following surgical resection (2). There is still some controversy
regarding this topic, and one of the main concerns with delaying
the surgery or the local excision approach is the difficulty of
predicting LNM even in the case of good clinical response.
Swellengrebel et al (11)
reported that 28.5% of patients with no residual tumor in the
rectal wall had persistent regional LNM and 41% of near-complete
response patients had ypT3 stage. Although several researchers have
investigated predictors of ypN-positive status following preop-CRT,
the studies are limited, as the factors used in the nomograms are
often difficult to obtain prior to radical resections (12–14).
Considering the low predictive rate of the current imaging
techniques for restaging LNM (15,16),
novel strategies to predict LNM more accurately following preop-CRT
are still warranted.
The 3D cell culture system has been widely used, as
cells in 3D environments may be more similar to cells in living
organisms (in vivo) compared to the flat, unnaturally thin
and single-layer cells grown in 2D environments (17). Typical cells in 3D systems are
ellipsoids with dimensions of 10–30 µm; in contrast, cells in 2D
are flat with a typical thickness of 3 µm (18). With regards to environmental
comparison, typical cells in 3D have ~100% of their surface area
exposed to other cells or matrix, whereas cells in 2D have ~50% of
their surface area exposed to fluid, ~50% exposed to the flat
culture surface or intermediate, and very little surface area
exposed to other cells. A previous data analysis of spheroid-based
drug screening systems revealed that tumor spheroid size and
morphology in a 3D culture system was associated with in
vivo drug sensitivity (19).
Previous studies demonstrated significantly increased resistance to
radiation in tumor cells in 3D cell culture, in comparison with
that of 2D culture (20,21). Storch et al (21) reported increased levels of
heterochromatin in 3D cell cultures that led to increased survival,
and a decreased number of DNA double-strand breaks and lethal
chromosome aberrations in response to radiation, compared with
those in monolayer cell cultures. These data suggest potential
clinical benefits of 3D cell culture for predicting tumor responses
to radiation. Nevertheless, the predictive potential of 3D cell
culture and cytotoxicity analysis has not been widely assessed in
patients with rectal cancer who have undergone preop-CRT.
Thus, the aim of the present study was to evaluate
the clinical potential of the 3D cell culture method for predicting
tumor response to preoperative chemoradiotherapy in patients with
rectal cancer.
Materials and methods
Patient enrolment
A total of 49 individuals (29 males, aged 22–82
years) suffering from locally advanced rectal cancer that underwent
preop-CRT were prospectively enrolled at the Severance Hospital,
Yonsei University College of Medicine (Seoul, Republic of Korea)
between August 2015 and March 2017. Patients with
histopathologically confirmed adenocarcinoma of the rectum at
clinical stage II or III were enrolled for the present study
(22). All enrolled patients
underwent preoperative biopsy, for the cytotoxicity assay, prior to
the initiation of preop-CRT. The protocol used for the preop-CRT
was described in previous studies (23,24).
Briefly, the preoperative radiation therapy consisted of a total
dose of 45 Gy in 25 fractions delivered to the pelvis, followed by
a 5.4 Gy boost to the primary tumor, over a period of 5 weeks (1.8
Gy for 5 days). The pelvic radiation volume was as follows: The
superior border 1.5 cm above the sacral promontory (L5 level); the
inferior border at the inferior margin of the obturator foramen or
3 cm below the lower tumor margin; the lateral border 1.5 cm
lateral to the bony pelvis; the anterior border 3 cm anterior to
the tumor; and the posterior border 0.5 cm posterior to the sacral
surface. The prescription dose was specified at the isocenter; the
three-field treatment plan comprised a 6-MV photon
posterior-anterior field and 6- or 10-MV photon opposed lateral
fields with wedges of 45°. For the boost treatment, five ports were
used. Intravenous bolus injections of 5-fluorouracil/leucovorin
(425/20 mg/m2 once per day during weeks 1 and 5) or
capecitabine (825 mg/m2, twice daily during the
radiation therapy period) were administered to the patients during
preop-CRT. Total mesorectal excision (TME) was performed 6–12 weeks
after the completion of preop-CRT. The protocol of the present
study was approved by the institutional review board of the
Severance Hospital, Yonsei University College of Medicine (Seoul,
Republic of Korea) (approval no. 4-2011-0445). Written informed
consent was obtained from all participants.
3D cell culture
Tissue harvest
Tissue was collected prior the initiation of
preop-CRT using rigid sigmoidoscopy and forceps biopsy. The tissues
were placed into 25-cm2 flasks, filled with RPMI culture
medium supplemented with 1% penicillin-streptomycin HyClone; GE
Healthcare Life Sciences). Before tissue dissociation, harvested
tissues were maintained at 37°C in a 5% CO2
incubator.
Cancer tissue dissociation and 2D
culture
Following the removal of media from the
25-cm2 flasks, the tissue samples were transferred to
1.5-ml micro tubes, and the weight was measured. The samples were
subsequently transferred to 60-mm2 dishes filled with 5
ml RPMI culture medium supplemented with 1% penicillin-streptomycin
and washed by pipetting; this procedure was repeated twice. The
tissue was then transferred to 60-mm2 dishes filled with
5 ml trypsin EDTA (HyClone; GE Healthcare Life Sciences), cut into
smaller pieces using a blade (Nopa Instruments), and incubated for
20 min at 37°C in a 5% CO2 incubator. Subsequently, the
tissue was harvested using 5 ml RPMI medium supplemented with 1%
penicillin-streptomycin and 10% FBS (HyClone; GE Healthcare Life
Sciences), transferred to 15-ml conical tubes, and the solution was
centrifuged at 260 g for 2 min at room temperature. The supernatant
was removed, and the pellets were resuspended in 10 ml RPMI
supplemented with 1% penicillin-streptomycin and 10% FBS, followed
by transferring the tissues to 100-mm2 2D culture dishes
(Thermo Fisher Scientific, Inc.) and incubating at 37°C for 2–3
days.
Cancer cell 3D culture
Cells were harvested by pipetting and transferred to
15-ml conical tubes. The tissue was then transferred to
60-mm2 dishes filled with 5 ml trypsin EDTA (HyClone; GE
Healthcare Life Sciences), cut into smaller pieces using a blade
(Nopa Instruments Medizintechnik GmbH), and incubated for 20 min at
37°C in a 5% CO2 incubator. Subsequently, the tissue was
harvested using 5 ml RPMI medium supplemented with 1%
penicillin-streptomycin and 10% FBS (HyClone; GE Healthcare Life
Sciences), transferred to 15-ml conical tubes, and the solution was
centrifuged at 260 g for 2 min at room temperature. The 2D-cultured
cells were detached using Accumax (EMD Millipore). The dissociated
cells were counted using a C-Chip disposable hemocytometer
(INCYTO). The cells were diluted in 1 ml RPMI medium supplemented
with 1% penicillin-streptomycin and 10% FBS to a concentration of
5,000 cells/100 µl and seeded onto ultra-low attachment 96-well
3D-culture plates (Corning Inc.).
Radiation treatment
Defining the day on which the cells were reseeded
for 3D culture as day 0, the 3D-cultured cells were treated with 5
Gy radiation at day 3 (Gammacell low dose-rate irradiator; Nordion,
Inc.). The control group did not receive any radiation. The
cultured cells were incubated at 37°C for 2 days.
Imaging before and after radiation
treatment
Images of 3D-cultured cells before and 2 days after
radiation treatment were acquired by Cell Scanner (MBD), equipped
with a ×4 objective lens. The cells and culture media were
transferred to 1.5-ml tubes, and centrifuged at 95 g for 2 min. The
supernatant and pellets in each tube were stored at −20°C.
Evaluation of 3D cell culture
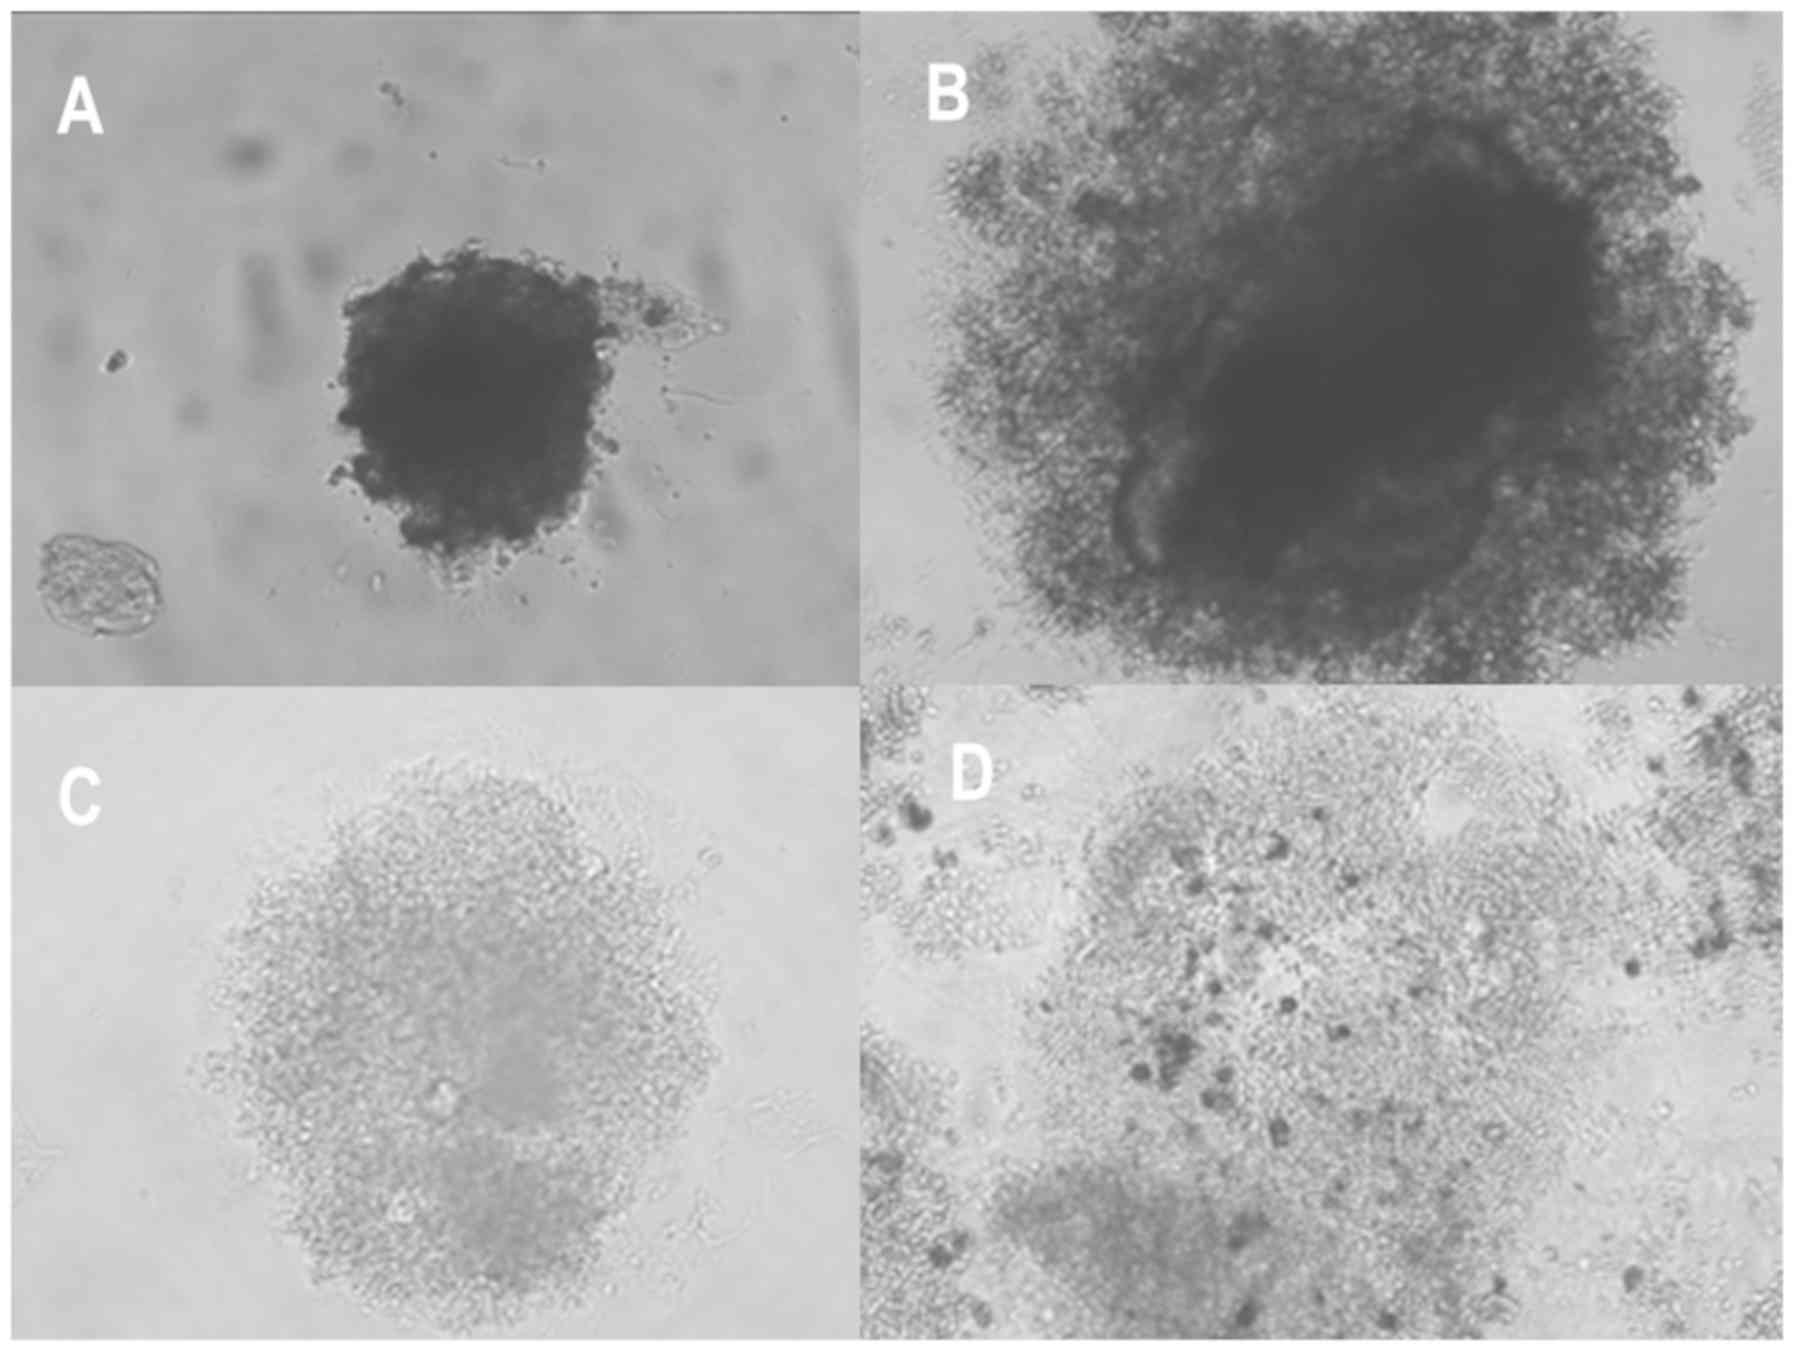
Morphological classification
Morphological assessment and classification were
performed prior to radiation treatment. The resulting spheroids
were classified into four distinct groups based on morphology as
‘round’, ‘mass’, ‘aggregate’ and ‘none’ (Fig. 1) (19). For further analysis, the ‘round’,
‘mass’, and ‘aggregate’ types were grouped into the category
‘mass-forming group’ for efficient statistical analysis. The
morphological classification was completed by an independent
researcher, who was unaware of the patients' clinicopathological
outcomes.
Cytotoxicity analysis
Defining the day on which the cells were reseeded
for 3D culture as day 0, the culture medium was harvested and
lactate dehydrogenase (LDH) enzyme activity was determined to check
cytotoxicity levels at day 5 (2 days of additional incubation
following radiation treatment). The cells were separated from the
harvested media by centrifugation at 1,000 g for 15 min at room
temperature. The supernatant was collected and the LDH enzyme
activity was measured using an LDH-cytotoxicity assay kit
(BioVision, Inc.) following the manufacturer's protocol. In order
to calculate the ratio between LDH enzyme activity in the media and
cells, the total cellular LDH enzyme activity from the cells was
also measured.
Measurements of endoscopy and magnetic
resonance imaging (MRI) parameters
All patients underwent endoscopies from 4–6 weeks
following completion of preop-CRT. All endoscopic regression
grading was estimated by endoscopists. Endoscopic grading was
classified into endoscopy_CR (normal mucosa, whitish scar only),
endoscopy_near CR (<1 cm ulcer without remaining visible tumor),
and endoscopy_non CR (ulcer >1 cm without remaining visible
tumor, remaining mass regardless of ulcer).
Patients underwent two stages of MRI examinations.
The first examination was performed before the initiation of
preop-CRT (pre-CRT MRI) and the MRI second was performed from 4–6
weeks following the completion of preop-CRT (post-CRT MRI). A 3.0 T
scanner [(Magnetom Tim Trio; Siemens Medical Solutions) or
(Ingenia; Philips Medical Systems)] was used for pre- and post-CRT
MRI examinations. In the present study, magnetic resonance (MR)
tumor regression grade (TRG), diffusion-weighted image (DWI) and MR
tumor volume reduction rate (TVRR) were evaluated and recorded for
each enrolled patient. These MRI-based parameters were evaluated
based on protocols from previous studies (23,25,26).
Tumor response assessment following
preop-CRT
The Mandard's classifications were used to evaluate
TRG (27). pCR was defined as no
viable tumor cells in the rectal wall along with no LNM. According
to the TRG classification, TRG 1 and TRG 2 were classified as ‘good
tumor response’, while TRG 3–5 were classified as ‘poor tumor
response’. With respect to tumor downstaging, T downstaging was
defined as smaller pathologic ypT compared with clinical T stage,
and N downstaging was defined as conversion of clinically positive
lymph nodes to pathologically negative status.
Statistical analysis
All statistical analyses were performed using SPSS
version 23.0 (IBM Corp.). Categorical variables were analyzed using
the χ2 test or Fisher's exact test, and continuous
variables were analyzed using Student's t-test or ANOVA. Receiver
operating characteristic (ROC) curve analysis was used to compare
the diagnostic performance of the parameter for predicting ypN
positivity. The cut-off values for the variables that provided the
best classification between the groups were determined. Factors
associated with ypN positivity were analyzed by logistic regression
analysis with forward stepwise selection of variables. All
variables with P<0.2 on univariate analysis were initially
entered into the multivariate analysis. P<0.05 was considered
statistically significant.
Results
A total of 49 patients were initially enrolled in
the present study for performing a cytotoxicity assay on
3D-cultured cells exposed to radiation. Finally, the results from
26 patients (53%) were available for further analysis. The reasons
for failure in obtaining results from the remaining patients
comprised cell culture contamination for 15 (65%) patients and
insufficient specimens from the biopsy for 8 (35%) patients. There
was no difference in clinicopathological characteristics between
the success group (n=26) and the failure group (n=23; Table I). Among the 26 patients included in
the final analysis, cytotoxicity ranged from 25.5–72.6% (median,
47.6%).
 | Table I.Comparison of clinicopathological
factors according to the success or failure of patients that were
included in the cytotoxicity assay. |
Table I.
Comparison of clinicopathological
factors according to the success or failure of patients that were
included in the cytotoxicity assay.
| Clinicopathological
factor | Success group
(n=26), n (%) | Failure group
(n=23), n (%) | P-value |
|---|
| Sex |
|
| 0.562 |
|
Male | 14 (53.8) | 15 (65.2) |
|
|
Female | 12 (46.2) | 8 (34.8) |
|
| Age, years |
|
| 0.332 |
| <65 | 21 (80.8) | 15 (65.2) |
|
| ≥65 | 5 (19.2) | 8 (34.8) |
|
| BMI,
kg/m2 |
24.1±3.7a |
22.8±2.6a | 0.167 |
| Distance from anal
verge, cm |
6.2±2.1a |
5.9±2.3a | 0.661 |
| Tumor location |
|
| 0.394 |
| Low
(<5 cm) | 9 (34.6) | 11 (47.8) |
|
| Middle
(5–10 cm) | 17 (65.4) | 12 (52.2) |
|
| CEA (initial),
µg/l |
6.0±7.4a |
6.5±7.5a | 0.796 |
| cT stage |
|
| 0.286c |
|
cT2 | 0 | 2 (8.7) |
|
|
cT3 | 23 (88.5) | 20 (87) |
|
|
cT4 | 3 (11.5) | 1 (4.3) |
|
| cN stage |
|
| 0.4c |
|
Node-negative | 2 (7.7) | 4 (17.4) |
|
|
Node-positive | 24 (92.3) | 19 (82.6) |
|
| Cytotoxicity, %
(range) | 47.6b (25.5–72.6) | N/A |
|
By morphologic classifications, the ‘aggregate’ type
was the most common (57.7%), followed by the ‘none’ type (26.9%).
Mean and the standard deviation of cytotoxicity were 50.9 in
‘round’ type, 51.2±10.7 in mass type, 52.4±16.8 in aggregate type
and 41.9±9.3 in none type respectively. With respect to
associations between cytotoxicity and 3D morphologic
classification, there were no differences in cytotoxicity among the
4 groups. Following the grouping of the ‘round’, ‘mass’ and
‘aggregate’ types into the ‘mass-forming’ group, there were no
differences in the cytotoxicity between the ‘mass-forming group’
and the ‘none group’ (Table
II).
| Table II.Association of cytotoxicity assay
with 3D morphologic classification before radiation. |
Table II.
Association of cytotoxicity assay
with 3D morphologic classification before radiation.
| Parameters | n=26, n (%) | Cytotoxicity, mean
± SD | P-value |
|---|
| 3D morphologic
classificationa |
|
| 0.490c |
|
Round | 1 (3.8) | 50.9 |
|
|
Mass | 3 (11.5) | 51.2±10.7 |
|
|
Aggregate | 15 (57.7) | 52.4±16.8 |
|
|
None | 7 (26.9) | 41.9±9.3 |
|
| Subgroup
analysis |
|
| 0.113 |
|
‘Mass-forming
group’b | 19 (73) | 52.1±15.3 |
|
| ‘None
group’ | 7 (26.9) | 41.9±9.3 |
|
With respect to the association between cytotoxicity
and pathologic tumor response (Table
III), there was no difference in cytotoxicity based on either
the TRGs 1–5, (P=0.940) or good tumor response (TRGs 1–2 vs. TRGs
3–5; P=0.729). There was a weak association between cytotoxicity
and N downstaging status (52.8±14.3 in the N downstaging-positive
group vs. 42.8±13.2 in the N downstaging-negative group; P=0.096).
In contrast, there was a significant difference in cytotoxicity
between the ypN-positive and the ypN-negative groups (53.2±14.1 vs.
38.7±10.1, respectively; P=0.021).
| Table III.Association of cytotoxicity with
pathologic tumor response. |
Table III.
Association of cytotoxicity with
pathologic tumor response.
| Parameters | N | Cytotoxicity, mean
± SD | P-value |
|---|
| TRG grade |
|
| 0.940a |
| 1 | 6 | 50±18.6 |
|
| 2 | 4 | 45.2±8.9 |
|
| 3 | 11 | 50.8±12.8 |
|
| 4 | 5 | 48.8±19.8 |
|
| 5 | 0 |
|
|
| TRG response |
|
| 0.729 |
| TRG
1–2 | 10 | 48.1±15 |
|
| TRG
3–5 | 16 | 50.1±14.6 |
|
| pCR |
|
| 0.909 |
|
Yes | 6 | 50±18.6 |
|
| No | 20 | 49.2±3.6 |
|
| T downstaging |
|
| 0.199 |
|
Positive | 16 | 52.3±14 |
|
|
Negative | 10 | 44.6±14.7 |
|
| N downstaging |
|
| 0.096 |
|
Positive | 17 | 52.8±14.3 |
|
|
Negative | 9 | 42.8±13.2 |
|
| yp T stage |
|
| 0.895a |
| 0 | 6 | 50±18.6 |
|
| 1 | 1 | 53.8 |
|
| 2 | 8 | 51.8±11.5 |
|
| 3 | 11 | 46.8±15.7 |
|
| yp N stage |
|
| 0.021 |
|
Node-negative | 19 | 53.2±14.1 |
|
|
Node-positive | 7 | 38.7±10.1 |
|
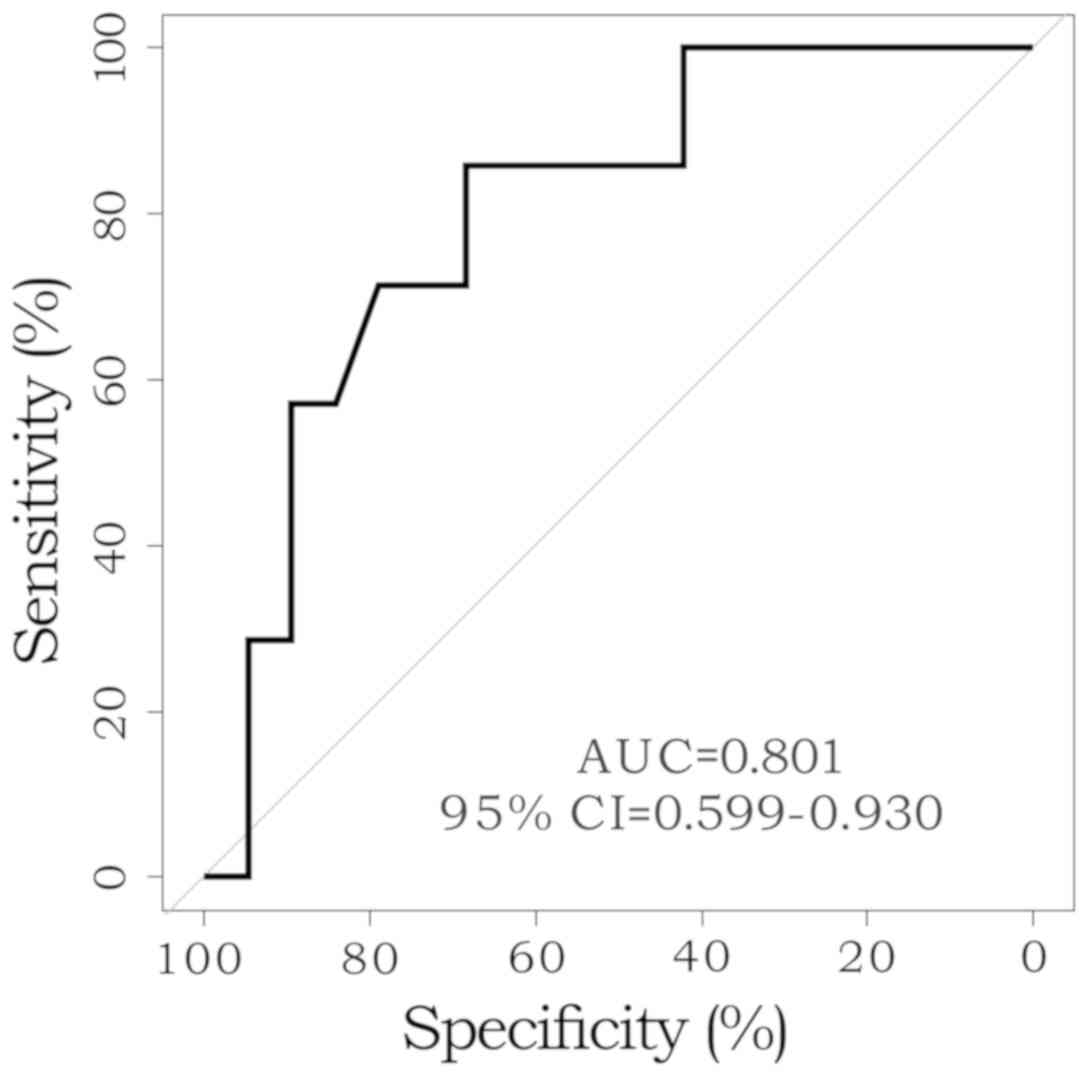
The morphological classifications were associated
with pathologic tumor response. The rate of T downstaging was
marginally higher in the ‘mass-forming group’ compared to that of
the ‘none group’ (73.7% vs. 28.6%, respectively; P=0.069). Although
the ypN-positive rate was lower in the ‘mass-forming group’ (15.8%)
compared with that in the ‘none group’ (57.1%), the difference was
not statistically significant (P=0.057; Table IV). The ROC curves were generated
for cytotoxicity in patients with ypN-positive status and the area
under the curve was 0.801. Using the ROC curves, the Youden's index
was calculated to be 45.05 (Fig.
2).
| Table IV.Association of 3D morphologic
classification with pathologic tumor response. |
Table IV.
Association of 3D morphologic
classification with pathologic tumor response.
| Parameters | N | Mass-forming group
(n=19), n (%) | None group (n=7), n
(%) | P-value |
|---|
| TRG grade |
|
|
| 0.292a |
| 1 | 6 | 6 (31.6) | 0 |
|
| 2 | 4 | 2 (10.5) | 2 (28.6) |
|
| 3 | 11 | 7 (36.8) | 4 (57.1) |
|
| 4 | 5 | 4 (21.1) | 1 (14.3) |
|
| 5 | 0 | 0 | 0 |
|
| TRG response |
|
|
| 0.668a |
| TRG
1–2 | 10 | 8 (42.1) | 2 (28.6) |
|
| TRG
3–5 | 16 | 11 (57.9) | 5 (71.4) |
|
| pCR |
|
|
| 0.146a |
|
Yes | 6 | 6 (31.6) | 0 |
|
| No | 20 | 13 (68.4) | 7 (100) |
|
| T downstaging |
|
|
| 0.069a |
|
Positive | 16 | 14 (73.7) | 2 (28.6) |
|
|
Negative | 10 | 5 (26.3) | 5 (71.4) |
|
| N downstaging |
|
|
| 0.188 |
|
Positive | 17 | 14 (73.7) | 3 (42.9) |
|
|
Negative | 9 | 5 (26.3) | 4 (57.1) |
|
| yp T stage |
|
|
| 0.252a |
| 0 | 6 | 6 (31.6) | 0 |
|
| 1 | 1 | 1 (5.3) | 0 |
|
| 2 | 8 | 6 (31.6) | 2 (28.6) |
|
| 3 | 11 | 6 (31.6) | 5 (71.4) |
|
| yp N stage |
|
|
| 0.057a |
|
Node-negative | 19 | 16 (84.2) | 3 (42.9) |
|
|
Node-positive | 7 | 3 (15.8) | 4 (57.1) |
|
Using the Youden's index value as the cut-off value,
the patients were dichotomized into low-cytotoxicity and
high-cytotoxicity groups. There were no differences in the
clinicopathological and radiological parameters between the high-
and low-cytotoxicity groups, except for the ypN-positivity
(Table V). The high-cytotoxicity
group showed significantly lower ypN-positivity (7.1%) than that of
the low-cytotoxicity group (50%; P=0.026).
| Table V.Clinicopathological characteristics
and magnetic resonance parameters according to the low- and
high-cytotoxicity groups. |
Table V.
Clinicopathological characteristics
and magnetic resonance parameters according to the low- and
high-cytotoxicity groups.
|
| Low-cytotoxicity
group (≤45; n=12), n (%) | High-cytotoxicity
group (>45; n=14), n (%) | P-value |
|---|
| Sex |
|
| >0.999 |
|
Male | 6 (50) | 8 (57.1) |
|
|
Female | 6 (50) | 6 (42.9) |
|
| Age, years |
51.4±10.8a |
54.9±16.2a | 0.530 |
| BMI,
kg/m2 |
23.7±3.5a | 24.5±4a | 0.575 |
| Distance from anal
verge, cm |
6.1±2.1a |
6.2±2.2a | 0.875 |
| CEA (initial),
µg/l | 6.5±7a | 5.6±8a | 0.759 |
| yp T stage |
|
| 0.933a |
| T0 | 3 (25) | 3 (21.4) |
|
| T1 | 0 | 1 (7.1) |
|
| T2 | 3 (25) | 5 (35.7) |
|
| T3 | 6 (50) | 5 (35.7) |
|
| yp N stage |
|
| 0.026b |
|
Node-negative | 6 (50) | 13 (92.9) |
|
|
Node-positive | 6 (50) | 1 (7.1) |
|
| pCR |
|
|
>0.999b |
|
Yes | 3 (25) | 3 (21.4) |
|
| No | 9 (75) | 11 (78.6) |
|
| Endoscopy |
|
| 0.190b |
|
Endoscopy_non CR | 7 (58.3) | 12 (85.7) |
|
|
Endoscopy_CR and
endoscopy_near CR | 5 (41.7) | 2 (14.3) |
|
| MR TRG |
|
| 0.683b |
| Grade I
and II | 7 (58.3) | 10 (71.4) |
|
| Grade
III–V | 5 (41.7) | 4 (28.6) |
|
| MR Tumor volume,
cm3 |
|
|
|
|
Pre-CRT |
17.2±10.0a |
25.6±14.1a | 0.098 |
|
Post-CRT |
6.9±5.4a |
8.6±6.0a | 0.467 |
| TVRR, % |
62.4±20.9a |
66.1±14.3a | 0.603 |
| MR DWI |
|
| 1.0b |
|
Negative | 4 (33.3) | 4 (28.6) |
|
|
Equivocal and positive | 8 (66.7) | 10 (71.4) |
|
3D morphologic classification and cytotoxicity assay
data were considered in the final multivariate analysis to predict
the ypN-positivity (Table VI). The
cytotoxicity (dichotomized as low vs. high) was the only factor
that predicted ypN-positivity in the multivariate analysis
(high-cytotoxicity vs. low-cytotoxicity; odds ratio, 13; 95%
confidence interval, 1.2–133.2; P=0.031).
| Table VI.Univariate and multivariate analysis
of factors associated with yp node positivity. |
Table VI.
Univariate and multivariate analysis
of factors associated with yp node positivity.
|
| Univariate
analysis | Multivariate
analysis |
|---|
|
|
|
|
|---|
| Parameters | N | N (%) | P-value | OR (95% CI) | P-value |
|---|
| Sex |
|
|
>0.999a |
|
|
|
Male | 14 | 4 (28.6) |
|
|
|
|
Female | 12 | 3 (25) |
|
|
|
| Age, years |
|
| 0.278a |
|
|
|
<65 | 21 | 7 (33.3) |
|
|
|
|
≥65 | 5 | 0 |
|
|
|
| cT |
|
|
>0.999a |
|
|
| T3 | 23 | 6 (26.1) |
|
|
|
| T4 | 3 | 1 (33.3) |
|
|
|
| cN |
|
|
>0.999a |
|
|
| Node
negative | 2 | 0 |
|
|
|
| Node
positive | 24 | 7 (29.2) |
|
|
|
| Endoscopy
grade |
|
| 0.629a |
|
|
|
Endoscopy_non-CR | 19 | 6 (31.6) |
|
|
|
|
Endoscopy_CR and
endoscopy_near CR | 7 | 1 (14.3) |
|
|
|
| MR TRG |
|
| 0.661a |
|
|
| Grade I
and II | 9 | 3 (33.3) |
|
|
|
| Grade
III–V | 17 | 4 (23.5) |
|
|
|
| MR TVRR (%) |
|
| 0.540a |
|
|
|
<83.6 | 23 | 7 (30.4) |
|
|
|
|
≥83.6 | 3 | 0 |
|
|
|
| MR DWI |
|
| 0.375a |
|
|
|
Negative | 8 | 1 (12.5) |
|
|
|
|
Equivocal and positive | 18 | 6 (33.3) |
|
|
|
| 3D morphologic
classification |
|
| 0.057a |
|
|
|
‘Mass-forming group’ | 19 | 3 (15.8) |
|
|
|
| ‘None
group’ | 7 | 4 (57.1) |
|
|
|
| Cytotoxicity
assay |
|
| 0.026a |
| 0.031 |
| High
(>45) | 14 | 1 (7.1) |
| 1 |
|
| Low
(≤45) | 12 | 6 (50) |
| 13 (1.2–133.2) |
|
Discussion
The present study demonstrated that the cytotoxicity
assay, using 3D cell culture with radiation, could be a novel
alternative for predicting lymph node positivity following
preop-CRT in rectal cancer.
Increasing evidence has suggested that good tumor
response following preop-CRT may warrant a decrease in radical
resection and promotion of an approach that involves either
delaying the surgery or local excision (28,29).
However, the basic prerequisite for these approaches is no or
minimal possibility of regional LNM. Accurate preoperative
assessment of LNM is crucial for effectively employing the delay in
surgery or radical resection approaches in patients suspected of
clinical complete response. Nevertheless, it was reported that
current imaging tools have low sensitivity or specificity for
defining LNM following preop-CRT (15). The reliability of imaging techniques
for evaluating lymph node positivity following preop-CRT in rectal
cancer is known to be poor, and there are no standard guidelines to
define lymph node positivity (30).
In order to overcome these inherent limitations of
imaging-based detection of lymph node positivity following
preop-CRT, a clinical outcome-based prediction model was
introduced. Jwa et al (12)
reported that patient age, ypT stage, tumor differentiation,
clinical N stage, lymphovascular invasion (LVI) and perineural
invasion (PNI) could reliably predict LNM following preop-CRT. A
nomogram using these parameters was developed and showed high
similarity between nomogram-predicted and real lymph node
positivity following preop-CRT. Although the nomogram was based on
a relatively large and homogeneously treated patient group from a
single center, this nomogram included pathological parameters such
as ypT stage, LVI and PNI that can be more accurately derived from
resected rectum, following definite TME, compared to preoperative
biopsy specimens. The use of this nomogram may therefore be limited
in deciding on proceeding for radical surgery.
In the present study, a cytotoxicity assay was
conducted to predict tumor response following preop-CRT. However,
the assay could not predict postoperative pCR or good tumor
response (TRGs 1–2). In contrast, low cytotoxicity, dichotomized by
a 45% cut-off in the cytotoxicity assay, was associated with ypN
positivity. Notably, most of the well-known possible predictors of
pCR, such as endoscopy grade, MR TRG, MR TVRR and MR DWI
demonstrated no associations with ypN positivity, which confirms
the difficulties in predicting lymph node status using clinical
variables. Nevertheless, the underlying mechanism of the
association between ypN positivity and the cytotoxicity assay
cannot be elucidated from the findings of the present study. It may
be associated with the difference between the radiation responses
of primary tumors and metastatic lymph nodes, considering the lack
of association between the cytotoxicity level and TRG. The current
practice of local excision following good clinical response
indicated that metastatic lymph nodes may regress at the same level
as the primary tumor following preop-CRT, which was supported by
the clinical observations (31,32). In
contrast, a study reported 28.5% lymph node positivity in patients
who exhibited pCR (ypT0) (11).
Moreover, Choi et al (33)
demonstrated that lymph node regression grade (LRG) following
preop-CRT was the only independent factor associated with
relapse-free survival in patients with ypN-positive rectal cancer,
who underwent preop-CRT. One of the interesting findings of this
study was that the distribution of LRG was not associated with the
TRG of the primary tumor, and that the LRG of each metastatic lymph
node differed from the other within the same patient. These
findings meant that the effects of radiation could differ between
the primary tumor and metastatic lymph nodes. These discrepancies
may be a possible reason for the different prediction powers of
primary tumor cells and lymph node positivity in the cytotoxicity
assays described in the present study. However, there was no ypN
positivity in patients with ypT0; thus, considering the relatively
low rate of ypN-positive results in patients with ypT0 in a
previous study (2), further
large-scale investigation may be required to elucidate the true
mechanisms underlying the observations of the present study.
The cytotoxicity assay, following 3D cell culture
and radiation, had certain advantages. Firstly, the 7-day
turnaround time for this procedure was acceptable, as long
turnaround times could hinder clinical decision-making. Secondly,
the assay can predict patients' tumor response before initiating
preop-CRT. Although preop-CRT decreased the local recurrence rate
more than postoperative adjuvant CRT, overall survival gain was not
anticipated. Rather, preop-CRT may be associated with delayed
adverse effects on long-term anorectal, sexual and urinary
dysfunction (34). In this regard, a
study demonstrated the efficacy of initiating chemotherapy in
conjugation with selective radiation treatments (35). One reason for employing this new
approach is the speculation that radiation-induced complications
may be decreased. Several tumor response assays currently used in
practice were considered as response evaluation tools rather than
prediction models. MRI-based tumor volumetric evaluation, DWI, MR
TRG, endoscopy grading, delay of surgery and other variables can be
evaluated post-preop-CRT; however, these cannot predict tumor
response before initiating preop-CRT. In this regard, the
cytotoxicity assay may be useful for predicting whether a patient
should undergo preop-CRT, although the actual clinical benefits
should be evaluated with further investigations.
Nevertheless, there were several potential
limitations of the present study. Immediate storage of fresh tissue
in 25-cm2 flasks, filled with RPMI culture medium
supplemented with 1% penicillin-streptomycin is mandatory for the
analysis. Although board-certified surgeons performed the
pre-treatment biopsies, it is not always possible to obtain
adequate tissue using rigid sigmoidoscopy. Another limitation was
cell contamination during the cell culture process. It is well
known that the intestinal and feces flora is mostly composed of
obligate anaerobes such as Bacteroides and
Bifidobacterium, and the accompanying bacteria during the
biopsy process may contaminate the culture. The failure rate, due
to cell contamination, cannot be ignored in the present study,
which may hinder this procedure and therefore, a modified protocol
is required to overcome this issue.
The main limitation of the present study was its
small sample size. In a previous study concerned with permeability,
based on the spheroid ‘round’-type morphological characteristic,
increased resistance to drug therapy was observed compared with
‘aggregate’, ‘mass’ or ‘none’ types, which was associated with the
Janus kinase-STAT signaling pathway (19). However, in the present study, the
‘mass’, ‘aggregate’ and ‘round’ types were grouped into the
‘mass-forming’ group, as the mean cytotoxicity level following
radiation was similar among the ‘round’, ‘mass’ and ‘aggregate’
types. Although the response of the 3D spheroids to radiation
treatment may be entirely different from the response to
chemotherapy, the limited number of enrolled patients may hinder
the detailed comparison. There are potential differences according
to the definitions of ypT stage and TRG. Even with the same ypT3,
some patients had small islets of viable cancer cells scattered in
the subserosa layer that showed predominant fibrosis (good TRG),
whereas other patients have ypT3 tumors in which most cancer cells
remain viable (poor TRG) (36). Due
to the small sample size in the present study, whether the
differences in TRG of the same ypT stage were associated with the
cytotoxicity assay could not be analyzed. Finally, it was also
possible that the cytotoxicity assay may not accurately reflect
humans' resistance to radiation and it does not accurately
reproduce the surrounding environments of patients with rectal
cancer. This needs to be validated in further studies.
In conclusion, a cytotoxicity assay following 3D
cell culture and radiation predicted ypN positivity in patients
with locally advanced rectal cancer that underwent preop-CRT. The
preliminary findings of the present study may be useful in
conducting further studies on this matter, which can potentially
lead to clinical application in decision-making prior to initiating
preoperative chemoradiotherapy.
Acknowledgements
The authors would like to thank Ms. Gamseoyun Lee
(Severance Hospital, Yonsei University College of Medicine) for the
support with patients' enrollment during the study.
Funding
No funding was received.
Availability of data and materials
The datasets used and/or analyzed during the present
study are available from the corresponding author on reasonable
request.
Authors' contributions
JKa provided the concept and idea of this study,
analyzed and interpreted the experimental and patients' clinical
data, and was a major contributor in writing the manuscript. MCP,
JKi, HH, BSM, SHB, KYL and NKK participated in the data
acquisition. NKK provided the concept and idea of the present study
and revised the manuscript. All authors read and approved the final
manuscript.
Ethics approval and consent to
participate
The protocol of the present study was approved by
the institutional review board of the Severance Hospital, Yonsei
University College of Medicine (Seoul, Republic of Korea) (approval
no. 4-2011-0445). Written informed consent was obtained from all
participants.
Patient consent for publication
Not applicable.
Competing interests
The authors declare that they have no competing
interests.
References
|
1
|
Sauer R, Becker H, Hohenberger W, Rödel C,
Wittekind C, Fietkau R, Martus P, Tschmelitsch J, Hager E, Hess CF,
et al: Preoperative versus postoperative chemoradiotherapy for
rectal cancer. N Engl J Med. 351:1731–1740. 2004. View Article : Google Scholar : PubMed/NCBI
|
|
2
|
Yeo SG, Kim DY, Kim TH, Chang HJ, Oh JH,
Park W, Choi DH, Nam H, Kim JS, Cho MJ, et al: Pathologic complete
response of primary tumor following preoperative chemoradiotherapy
for locally advanced rectal cancer: Long-term outcomes and
prognostic significance of pathologic nodal status (KROG 09-01).
Ann Surg. 252:998–1004. 2010. View Article : Google Scholar : PubMed/NCBI
|
|
3
|
Kim NK, Baik SH, Seong JS, Kim H, Roh JK,
Lee KY, Sohn SK and Cho CH: Oncologic outcomes after neoadjuvant
chemoradiation followed by curative resection with tumor-specific
mesorectal excision for fixed locally advanced rectal cancer:
Impact of postirradiated pathologic downstaging on local recurrence
and survival. Ann Surg. 244:1024–1030. 2006. View Article : Google Scholar : PubMed/NCBI
|
|
4
|
Zorcolo L, Rosman AS, Restivo A, Pisano M,
Nigri GR, Fancellu A and Melis M: Complete pathologic response
after combined modality treatment for rectal cancer and long-term
survival: A meta-analysis. Ann Surg Oncol. 19:2822–2832. 2012.
View Article : Google Scholar : PubMed/NCBI
|
|
5
|
Kim NK and Hur H: New Perspectives on
predictive biomarkers of tumor response and their clinical
application in preoperative chemoradiation therapy for rectal
cancer. Yonsei Med J. 56:1461–1477. 2015. View Article : Google Scholar : PubMed/NCBI
|
|
6
|
Ryan JE, Warrier SK, Lynch AC, Ramsay RG,
Phillips WA and Heriot AG: Predicting pathological complete
response to neoadjuvant chemoradiotherapy in locally advanced
rectal cancer: A systematic review. Colorectal Dis. 18:234–246.
2016. View Article : Google Scholar : PubMed/NCBI
|
|
7
|
Stijns RCH, Tromp MR, Hugen N and de Wilt
JHW: Advances in organ preserving strategies in rectal cancer
patients. Eur J Surg Oncol. 44:209–219. 2018. View Article : Google Scholar : PubMed/NCBI
|
|
8
|
Li J, Li L, Yang L, Yuan J, Lv B, Yao Y
and Xing S: Wait-and-see treatment strategies for rectal cancer
patients with clinical complete response after neoadjuvant
chemoradiotherapy: A systematic review and meta-analysis.
Oncotarget. 7:44857–44870. 2016.PubMed/NCBI
|
|
9
|
Chang GJ, Rodriguez-Bigas MA, Eng C and
Skibber JM: Lymph node status after neoadjuvant radiotherapy for
rectal cancer is a biologic predictor of outcome. Cancer.
115:5432–5440. 2009. View Article : Google Scholar : PubMed/NCBI
|
|
10
|
Duchalais E, Glyn Mullaney T, Spears GM,
Kelley SR, Mathis K, Harmsen WS and Larson DW: Prognostic value of
pathological node status after neoadjuvant radiotherapy for rectal
cancer. Br J Surg. 105:1501–1509. 2018. View Article : Google Scholar : PubMed/NCBI
|
|
11
|
Swellengrebel HA, Bosch SL, Cats A,
Vincent AD, Dewit LG, Verwaal VJ, Nagtegaal ID and Marijnen CA:
Tumour regression grading after chemoradiotherapy for locally
advanced rectal cancer: A near pathologic complete response does
not translate into good clinical outcome. Radiother Oncol.
112:44–51. 2014. View Article : Google Scholar : PubMed/NCBI
|
|
12
|
Jwa E, Kim JH, Han S, Park JH, Lim SB, Kim
JC, Hong YS, Kim TW and Yu CS: Nomogram to predict ypN status after
chemoradiation in patients with locally advanced rectal cancer. Br
J Cancer. 111:249–254. 2014. View Article : Google Scholar : PubMed/NCBI
|
|
13
|
Newton AD, Li J, Jeganathan AN, Mahmoud
NN, Epstein AJ and Paulson EC: A nomogram to predict lymph node
positivity following neoadjuvant chemoradiation in locally advanced
rectal cancer. Dis Colon Rectum. 59:710–717. 2016. View Article : Google Scholar : PubMed/NCBI
|
|
14
|
von den Grün JM, Hartmann A, Fietkau R,
Ghadimi M, Liersch T, Hohenberger W, Weitz J, Sauer R, Wittekind C,
Ströbel P, et al: Can clinicopathological parameters predict for
lymph node metastases in ypT0-2 rectal carcinoma? Results of the
CAO/ARO/AIO-94 and CAO/ARO/AIO-04 phase 3 trials. Radiother Oncol.
128:557–563. 2018. View Article : Google Scholar : PubMed/NCBI
|
|
15
|
Pomerri F, Pucciarelli S, Maretto I,
Zandoná M, Del Bianco P, Amadio L, Rugge M, Nitti D and Muzzio PC:
Prospective assessment of imaging after preoperative
chemoradiotherapy for rectal cancer. Surgery. 149:56–64. 2011.
View Article : Google Scholar : PubMed/NCBI
|
|
16
|
Ryu KH, Kim SH, Yoon JH, Lee Y, Paik JH,
Lim YJ and Lee KH: Diffusion-weighted imaging for evaluating lymph
node eradication after neoadjuvant chemoradiation therapy in
locally advanced rectal cancer. Acta Radiol. 57:133–141. 2016.
View Article : Google Scholar : PubMed/NCBI
|
|
17
|
Antoni D, Burckel H, Josset E and Noel G:
Three-dimensional cell culture: A breakthrough in vivo. Int J Mol
Sci. 16:5517–5527. 2015. View Article : Google Scholar : PubMed/NCBI
|
|
18
|
Gupta N, Liu JR, Patel B, Solomon DE,
Vaidya B and Gupta V: Microfluidics-based 3D cell culture models:
Utility in novel drug discovery and delivery research. Bioeng
Transl Med. 1:63–81. 2016. View Article : Google Scholar : PubMed/NCBI
|
|
19
|
Park MC, Jeong H, Son SH, Kim Y, Han D,
Goughnour PC, Kang T, Kwon NH, Moon HE, Paek SH, et al: Novel
morphologic and genetic analysis of cancer cells in a 3D
microenvironment identifies STAT3 as a regulator of tumor
permeability barrier function. Cancer Res. 76:1044–1054. 2016.
View Article : Google Scholar : PubMed/NCBI
|
|
20
|
Zschenker O, Streichert T, Hehlgans S and
Cordes N: Genome-wide gene expression analysis in cancer cells
reveals 3D growth to affect ECM and processes associated with cell
adhesion but not DNA repair. PLoS One. 7:e342792012. View Article : Google Scholar : PubMed/NCBI
|
|
21
|
Storch K, Eke I, Borgmann K, Krause M,
Richter C, Becker K, Schröck E and Cordes N: Three-dimensional cell
growth confers radioresistance by chromatin density modification.
Cancer Res. 70:3925–3934. 2010. View Article : Google Scholar : PubMed/NCBI
|
|
22
|
Amin MB, Edge S, Greene F, Byrd DR,
Brookland RK, Washington MK, Gershenwald JE, Compton CC, Hess KR,
Sullivan DC, et al: AJCC cancer staging manual. 8th. Springer; New
York: 2017, View Article : Google Scholar
|
|
23
|
Kang JH, Kim YC, Kim H, Kim YW, Hur H, Kim
JS, Min BS, Kim H, Lim JS, Seong J, et al: Tumor volume changes
assessed by three-dimensional magnetic resonance volumetry in
rectal cancer patients after preoperative chemoradiation: The
impact of the volume reduction ratio on the prediction of
pathologic complete response. Int J Radiat Oncol Biol Phys.
76:1018–1025. 2010. View Article : Google Scholar : PubMed/NCBI
|
|
24
|
Han YD, Kim WR, Park SW, Cho MS, Hur H,
Min BS, Baik SH, Lee KY and Kim NK: Predictors of pathologic
complete response in rectal cancer patients undergoing total
mesorectal excision after preoperative chemoradiation. Medicine
(Baltimore). 94:e19712015. View Article : Google Scholar : PubMed/NCBI
|
|
25
|
Kim H, Myoung S, Koom WS, Kim NK, Kim MJ,
Ahn JB, Hur H and Lim JS: MRI risk stratification for tumor relapse
in rectal cancer achieving pathological complete remission after
neoadjuvant chemoradiation therapy and curative resection. PLoS
One. 11:e01462352016. View Article : Google Scholar : PubMed/NCBI
|
|
26
|
An C, Huh H, Han KH, Kim MJ, Kim NK, Kim H
and Lim JS: Use of preoperative MRI to select candidates for local
excision of MRI-Staged T1 and T2 rectal cancer: Can MRI select
patients with N0 tumors? Dis Colon Rectum. 58:923–930. 2015.
View Article : Google Scholar : PubMed/NCBI
|
|
27
|
Mandard AM, Dalibard F, Mandard JC, Marnay
J, Henry-Amar M, Petiot JF, Roussel A, Jacob JH, Segol P, Samama G,
et al: Pathologic assessment of tumor regression after preoperative
chemoradiotherapy of esophageal carcinoma. Clinicopathologic
correlations. Cancer. 73:2680–2686. 1994. View Article : Google Scholar : PubMed/NCBI
|
|
28
|
Garcia-Aguilar J, Renfro LA, Chow OS, Shi
Q, Carrero XW, Lynn PB, Thomas CR Jr, Chan E, Cataldo PA, Marcet
JE, et al: Organ preservation for clinical T2N0 distal rectal
cancer using neoadjuvant chemoradiotherapy and local excision
(ACOSOG Z6041): Results of an open-label, single-arm,
multi-institutional, phase 2 trial. Lancet Oncol. 16:1537–1546.
2015. View Article : Google Scholar : PubMed/NCBI
|
|
29
|
Renehan AG, Malcomson L, Emsley R, Gollins
S, Maw A, Myint AS, Rooney PS, Susnerwala S, Blower A, Saunders MP,
et al: Watch-and-wait approach versus surgical resection after
chemoradiotherapy for patients with rectal cancer (the OnCoRe
project): A propensity-score matched cohort analysis. Lancet Oncol.
17:174–183. 2016. View Article : Google Scholar : PubMed/NCBI
|
|
30
|
De Nardi P and Carvello M: How reliable is
current imaging in restaging rectal cancer after neoadjuvant
therapy? World J Gastroenterol. 19:5964–5972. 2013. View Article : Google Scholar : PubMed/NCBI
|
|
31
|
Kim DW, Kim DY, Kim TH, Jung KH, Chang HJ,
Sohn DK, Lim SB, Choi HS, Jeong SY and Park JG: Is T classification
still correlated with lymph node status after preoperative
chemoradiotherapy for rectal cancer? Cancer. 106:1694–1700. 2006.
View Article : Google Scholar : PubMed/NCBI
|
|
32
|
Read TE, Andujar JE, Caushaj PF, Johnston
DR, Dietz DW, Myerson RJ, Fleshman JW, Birnbaum EH, Mutch MG and
Kodner IJ: Neoadjuvant therapy for rectal cancer: Histologic
response of the primary tumor predicts nodal status. Dis Colon
Rectum. 47:825–831. 2004. View Article : Google Scholar : PubMed/NCBI
|
|
33
|
Choi JP, Kim SJ, Park IJ, Hong SM, Lee JL,
Yoon YS, Kim CW, Lim SB, Lee JB, Yu CS and Kim JC: Is the
pathological regression level of metastatic lymph nodes associated
with oncologic outcomes following preoperative chemoradiotherapy in
rectal cancer? Oncotarget. 8:10375–10384. 2017.PubMed/NCBI
|
|
34
|
Loos M, Quentmeier P, Schuster T, Nitsche
U, Gertler R, Keerl A, Kocher T, Friess H and Rosenberg R: Effect
of preoperative radio(chemo)therapy on long-term functional outcome
in rectal cancer patients: A systematic review and meta-analysis.
Ann Surg Oncol. 20:1816–1828. 2013. View Article : Google Scholar : PubMed/NCBI
|
|
35
|
Schrag D, Weiser MR, Goodman KA, Gonen M,
Hollywood E, Cercek A, Reidy-Lagunes DL, Gollub MJ, Shia J, Guillem
JG, et al: Neoadjuvant chemotherapy without routine use of
radiation therapy for patients with locally advanced rectal cancer:
A pilot trial. J Clin Oncol. 32:513–518. 2014. View Article : Google Scholar : PubMed/NCBI
|
|
36
|
Min BS, Kim NK, Pyo JY, Kim H, Seong J,
Keum KC, Sohn SK and Cho CH: Clinical impact of tumor regression
grade after preoperative chemoradiation for locally advanced rectal
cancer: Subset analyses in lymph node negative patients. J Korean
Soc Coloproctol. 27:31–40. 2011. View Article : Google Scholar : PubMed/NCBI
|