Introduction
The incidence of melanoma is increasing worldwide
(1–3). A statistical fact sheet from the
Surveillance, Epidemiology, and End Results (SEER) program of the
National Cancer Institute (NCI) stated that the estimated number of
new melanoma cases in 2019 in the USA was 96,480, accounting for
5.5% of all new cancer cases, and that the estimated death toll was
7,230 (https://seer.cancer.gov/statfacts/html/melan.html).
Malignant melanoma (MM) is the most aggressive and deadly type of
skin cancer (4). MM has a rapid
development, high metastasis rate and poor prognosis; therefore,
its early diagnosis and treatment are particularly important
(5,6).
The SEER program of the NCI is a coordinated system
of population-based state cancer registries collecting demographic,
clinical and outcome information on all cancer cases diagnosed in
representative geographic regions and subpopulations (7,8). It
includes 18 registries that cover 30% of the population in the USA
(9).
Nomograms incorporating and demonstrating important
prognostic factors have been widely used in cancer prognosis
predictions, and have become reliable and convenient tools for
quantifying risk associated with diseases (10,11).
They can reduce statistical predictive models to a single numerical
estimate of the probability (PI) of an event (12,13).
Several authors have reported that nomograms are more accurate in
prognosis prediction than the traditional staging systems for
patients with prostate, colon, breast and stomach cancer (14–18).
Previous studies have reported a nomogram of melanoma at a site, or
a nomogram of lymph node status in patients with melanoma (19,20). Our
previous study also only reported a nomogram of nodular melanoma
(21). However, there is no nomogram
for predicting survival in patients with MM the from SEER
database.
The aim of the current study was to develop and
validate a nomogram based on a large population that could be used
to estimate the 3- and 5-year survival rates of patients with MM.
In addition to the American Joint Committee on Cancer (AJCC)
staging, predictors such as age, sex and insurance status were
included to provide a personalized and accurate assessment of
patient survival.
Materials and methods
Patient selection
A retrospective search of the SEER (seer.cancer.gov) database was performed for cases of
MM diagnosed between January 2007 and December 2015. The SEER
database was accessed using the SEER*Stat software (version 8.3.4,
http://seer.cancer.gov/seerstat/).
Patients were identified using the International Classification of
Diseases for Oncology-O-3 (22)
histological type codes of 8720/3-8723/3, 8726/3, 8727/3, 8730/3,
8740/3-8746/3, 8761/3, 8770-8773/3, 8780/3 and 8790/3, and primary
site codes of C44, C51.0, C60.9 and C63.2, and were used as the
inclusion criteria. Cases that were not confirmed by microscopy or
only by autopsy were excluded, as were those with unknown or
incomplete variables. Additionally, patients <18 years were
excluded. The selection criteria applied resulted in a total of
110,727 eligible patients. As data on cancer is reported by the
SEER database each year, informed patient consent was not required
to utilize the data released by the SEER database. The present
study was exempted from the requirement for ethical approval and
patient consent by the Institutional Research Committee of The
First Affiliated Hospital of Xi'an Jiaotong University.
Nomogram construction
For the construction and validation of the nomogram,
70% (n=77,508) of the patients were randomly assigned to the
training cohort and 30% (n=33,219) were assigned to the validation
cohort. The following variables were assessed: Age at diagnosis,
ethnicity, sex, marital status, tumor primary site, AJCC and SEER
stage, insurance status and median family income.
Validation of the nomogram
The nomogram was validated using discrimination and
calibration with the validation cohort. The predictive accuracy of
the nomogram was evaluated by the area under the time-dependent
receiver operating characteristic (ROC) curve. Concordance index
(C-index), proposed by Frank E. Harrell Jr, Professor of
biostatistics at Vanderbilt University in 1996 (23), is used to calculate the
discrimination between the predicted and real values of Cox models
in survival analysis. In general, a C-index >0.75 is considered
to represent relatively good discrimination (24). The agreement between the predicted PI
and the actual outcome was evaluated by calibration plotting.
Calibration represents the ability of a model to provide unbiased
estimates of outcome, and a perfectly accurate nomogram would
result in a plot on which predictions fall along a 45° diagonal
line. Discrimination and calibration were evaluated using
bootstrapping with 500 resamples. Bootstrapping is a random
sampling method and the sampling was repeated 500 times using R
software (https://www.r-project.org/; version
3.6.1), increasing the accuracy.
The specificity and sensitivity may be determined
from the ROC curve when evaluating a diagnostic method. Vickers and
Elkin (25) developed a method of
evaluation termed decision curve analysis (DCA), which was used to
test the clinical value of the predictive models in the present
study, in terms of the net benefit. DCA is a simple way to evaluate
clinical predictive models. Traditional models, such as ROC curves,
only measure the accuracy of predictive model diagnosis, in order
to consider the clinical utility of the model, while the DCA curve
considers clinical utility (26).
Statistical analysis
Cox regression, nomogram, C-index, AUC, calibration
plotting and DCA were performed using SPSS (version 24.0; IBM
Corp.) and R software. P<0.05 was considered to indicate a
statistically significant difference. The continuous variable, age,
was assessed for normal distribution using Shapiro-Wilk test.
Kaplan-Meier curves were generated using R software. Clinical
pathological characteristics of the training and validation cohorts
were selected using the backward stepwise selection method in the
Cox regression model. Only variables that were statistically
significant in the univariate Cox regression models were analyzed
in multivariate Coxregression models.
Results
Patient characteristics
The present study included 110,727 patients with MM.
The median age (25th-75th percentile: 52–74) at the time of
diagnosis of was 62 years in the two cohorts. The majority of the
patients were male (59.7% for the training cohort; 60.1% for the
validation cohort), white (98.5%) and married (68.5%). The most
common primary tumor site was the trunk (31.1%). The majority of
the patients were in AJCC stage I (69.7%). In both cohorts, 82.3%
patients had a localized tumor, 11.7% patients had regional
metastasis and 6.0% patients had distant metastasis. The majority
of the patients were insured (93.8%) and had a median family income
of USD 50,060-98,030 (82.2%; Table
I).
 | Table I.Clinical characteristics of patients
with malignant melanoma in the present study. |
Table I.
Clinical characteristics of patients
with malignant melanoma in the present study.
| Characteristic | Training cohort | Validation
cohort |
|---|
| Median age at
diagnosis, (25th-75th percentile) | 62 (52–74) | 62 (52–74) |
| Ethnicity, n
(%) |
|
|
|
White | 76,377 (98.5) | 32,735 (98.5) |
|
Black | 421
(0.5) | 163
(0.5) |
|
Other | 710
(1.0) | 321
(1.0) |
| Sex, (%) |
|
|
|
Male | 46,286 (59.7) | 19,949 (60.1) |
|
Female | 31,222 (40.3) | 13,270 (39.9) |
| Marital status, n
(%) |
|
|
|
Married | 52,970 (68.5) | 22,748 (68.5) |
|
Single | 11,739 (15.0) | 4,982
(15.0) |
|
Divorced, separated or
widowed | 12,799 (16.5) | 5,489 (16.5) |
| Site, n (%) |
|
|
| Head
and neck | 16,870 (21.8) | 7,202
(21.8) |
|
Trunk | 24,075 (31.1) | 10,407 (31.1) |
| Upper
Limbs | 19,472 (25.1) | 8,326
(25.1) |
| Lower
Limbs | 13,775 (17.8) | 5,905
(17.8) |
|
Other | 3,316
(4.2) | 1,379
(4.2) |
| AJCC stage, n
(%) |
|
|
| I | 53,935 (69.7) | 23,143 (69.7) |
| II | 12,163 (15.6) | 5,177
(15.6) |
|
III | 7,222
(9.3) | 3,070
(9.2) |
| IV | 4,188
(5.4) | 1,829
(5.5) |
| SEER stage, n
(%) |
|
|
|
Localized | 63,803 (82.3) | 27,355 (82.3) |
|
Regional | 9,076
(11.7) | 3,872
(11.7) |
|
Distant | 4,629
(6.0) | 1,992
(6.0) |
| Insurance status, n
(%) |
|
|
| Any
medicaid | 3,209
(4.1) | 1,413
(4.2) |
|
Insured | 72,713 (93.8) | 31,132 (93.8) |
|
Uninsured | 1,586
(2.1) | 674
(2.0) |
| Median family
income, USD, n (%) |
|
|
|
24,880-50,000 | 5,461
(7.2) | 2,385
(7.2) |
|
50,060-98,030 | 63,817 (82.2) | 27,311 (82.2) |
|
100,190-125,990 | 8,230
(10.6) | 3,523
(10.6) |
Cox regression analysis of the
training cohort
Following univariate Cox regression analysis, data
on age at diagnosis, ethnicity, sex, marital status, tumor primary
site, AJCC and SEER stage, insurance status and median family
income were entered into the multivariate Cox regression analysis.
The multivariate Cox regression analysis revealed that age [hazard
ratio (HR)=1.015; P<0.001], being single (HR=1.095 vs. married;
P=0.011), being divorced, separated or widowed (DSW) (HR=1.184 vs.
married; P<0.001), AJCC stage II (HR=5.759 vs. AJCC stage I;
P<0.001), AJCC stage III (HR=9.320 vs. AJCC stage I;
P<0.001), AJCC stage IV (HR=19.148 vs. AJCC stage I;
P<0.001), having regional metastasis (HR=1.592 vs. localized;
P<0.001), having distant metastasis (HR=1.858 vs. localized;
P<0.001), and not being insured (HR=1.201 vs. any medicaid
insurance; P=0.013) were significant risk factors for the overall
survival (OS) rate. Locations in the trunk (HR=0.893 vs. head and
neck; P=0.001), upper limbs (HR=0.753 vs. head and neck;
P<0.001) and lower limbs (HR=0.866 vs. head and neck;
P<0.001) were protective factors. Ethnicity was not
statistically significant in the multivariate Cox regression
(P>0.05). (Table II).
| Table II.Univariate and multivariate Cox
regression analysis (training cohort). |
Table II.
Univariate and multivariate Cox
regression analysis (training cohort).
|
| Univariate
analysis | Multivariate
analysis |
|---|
|
|
|
|
|---|
| Variable | HR | 95% CI | P-value | HR | 95% CI | P-value |
|---|
| Age at
diagnosis | 1.020 | 1.019–1.022 | <0.001 | 1.015 | 1.013–1.016 | <0.001 |
| Ethnicity | 1.477 | 1.357–1.609 | <0.001 |
|
|
|
|
White |
|
|
|
|
|
|
|
Black |
|
|
|
|
|
|
|
Other |
|
|
|
|
|
|
| Sex | 0.612 | 0.582–0.645 | <0.001 |
|
|
|
|
Male |
|
|
| Reference |
|
|
|
Female |
|
|
| 0.806 | 0.763–0.852 | <0.001 |
| Marital status | 1.260 | 1.225–1.297 | <0.001 |
|
|
|
|
Married |
|
|
| Reference |
|
|
|
Single |
|
|
| 1.095 | 1.021–1.174 | 0.011 |
|
DSW |
|
|
| 1.184 | 1.114–1.259 | <0.001 |
| Site | 1.393 | 1.365–1.423 | <0.001 |
|
|
|
| Head
and neck |
|
|
| Reference |
|
|
|
Trunk |
|
|
| 0.893 | 0.832–0.958 | 0.001 |
| Upper
limbs |
|
|
| 0.753 | 0.695–0.816 | <0.001 |
| Lower
limbs |
|
|
| 0.866 | 0.797–0.941 | <0.001 |
|
Other |
|
|
| 1.011 | 0.930–1.099 | 0.800 |
| AJCC stage | 3.249 | 3.183–3.316 | <0.001 |
|
|
|
| I |
|
|
| Reference |
|
|
| II |
|
|
| 5.759 | 5.300–6.258 | <0.001 |
|
III |
|
|
| 9.320 | 8.132–10.682 | <0.001 |
| IV |
|
|
| 19.148 | 15.089–24.299 | <0.001 |
| SEER stage | 4.719 | 4.594–4.847 | <0.001 |
|
|
|
|
Localized |
|
|
| Reference |
|
|
|
Regional |
|
|
| 1.592 | 1.420–1.785 | <0.001 |
|
Distant |
|
|
| 1.858 | 1.487–2.321 | <0.001 |
| Insurance
status | 0.612 | 0.560–0.670 | <0.001 |
|
|
|
| Any
medicaid |
|
|
| Reference |
|
|
|
Insured |
|
|
| 0.762 | 0.698–0.832 | <0.001 |
|
Uninsured |
|
|
| 1.201 | 1.039–1.388 | 0.013 |
| Median family
income, USD | 0.746 | 0.705–0.790 | <0.001 |
|
|
|
|
24,880-50,000 |
|
|
| Reference |
|
|
|
50,060-98,030 |
|
|
| 0.916 | 0.843–0.994 | 0.035 |
|
100,190-125,990 |
|
|
| 0.800 | 0.713–0.896 | <0.001 |
Nomogram validation
Independent prognostic factors associated with the
OS rate identified in the multivariate analysis were incorporated
into the nomogram internal validation. The nomogram was used by
first drawing a vertical line up to the points row to obtain the
points for each variable, adding up the points for all the
variables to obtain the total points, and drawing a vertical line
down from the total points row to obtain the 3- and 5-year OS rates
(Fig. 1).
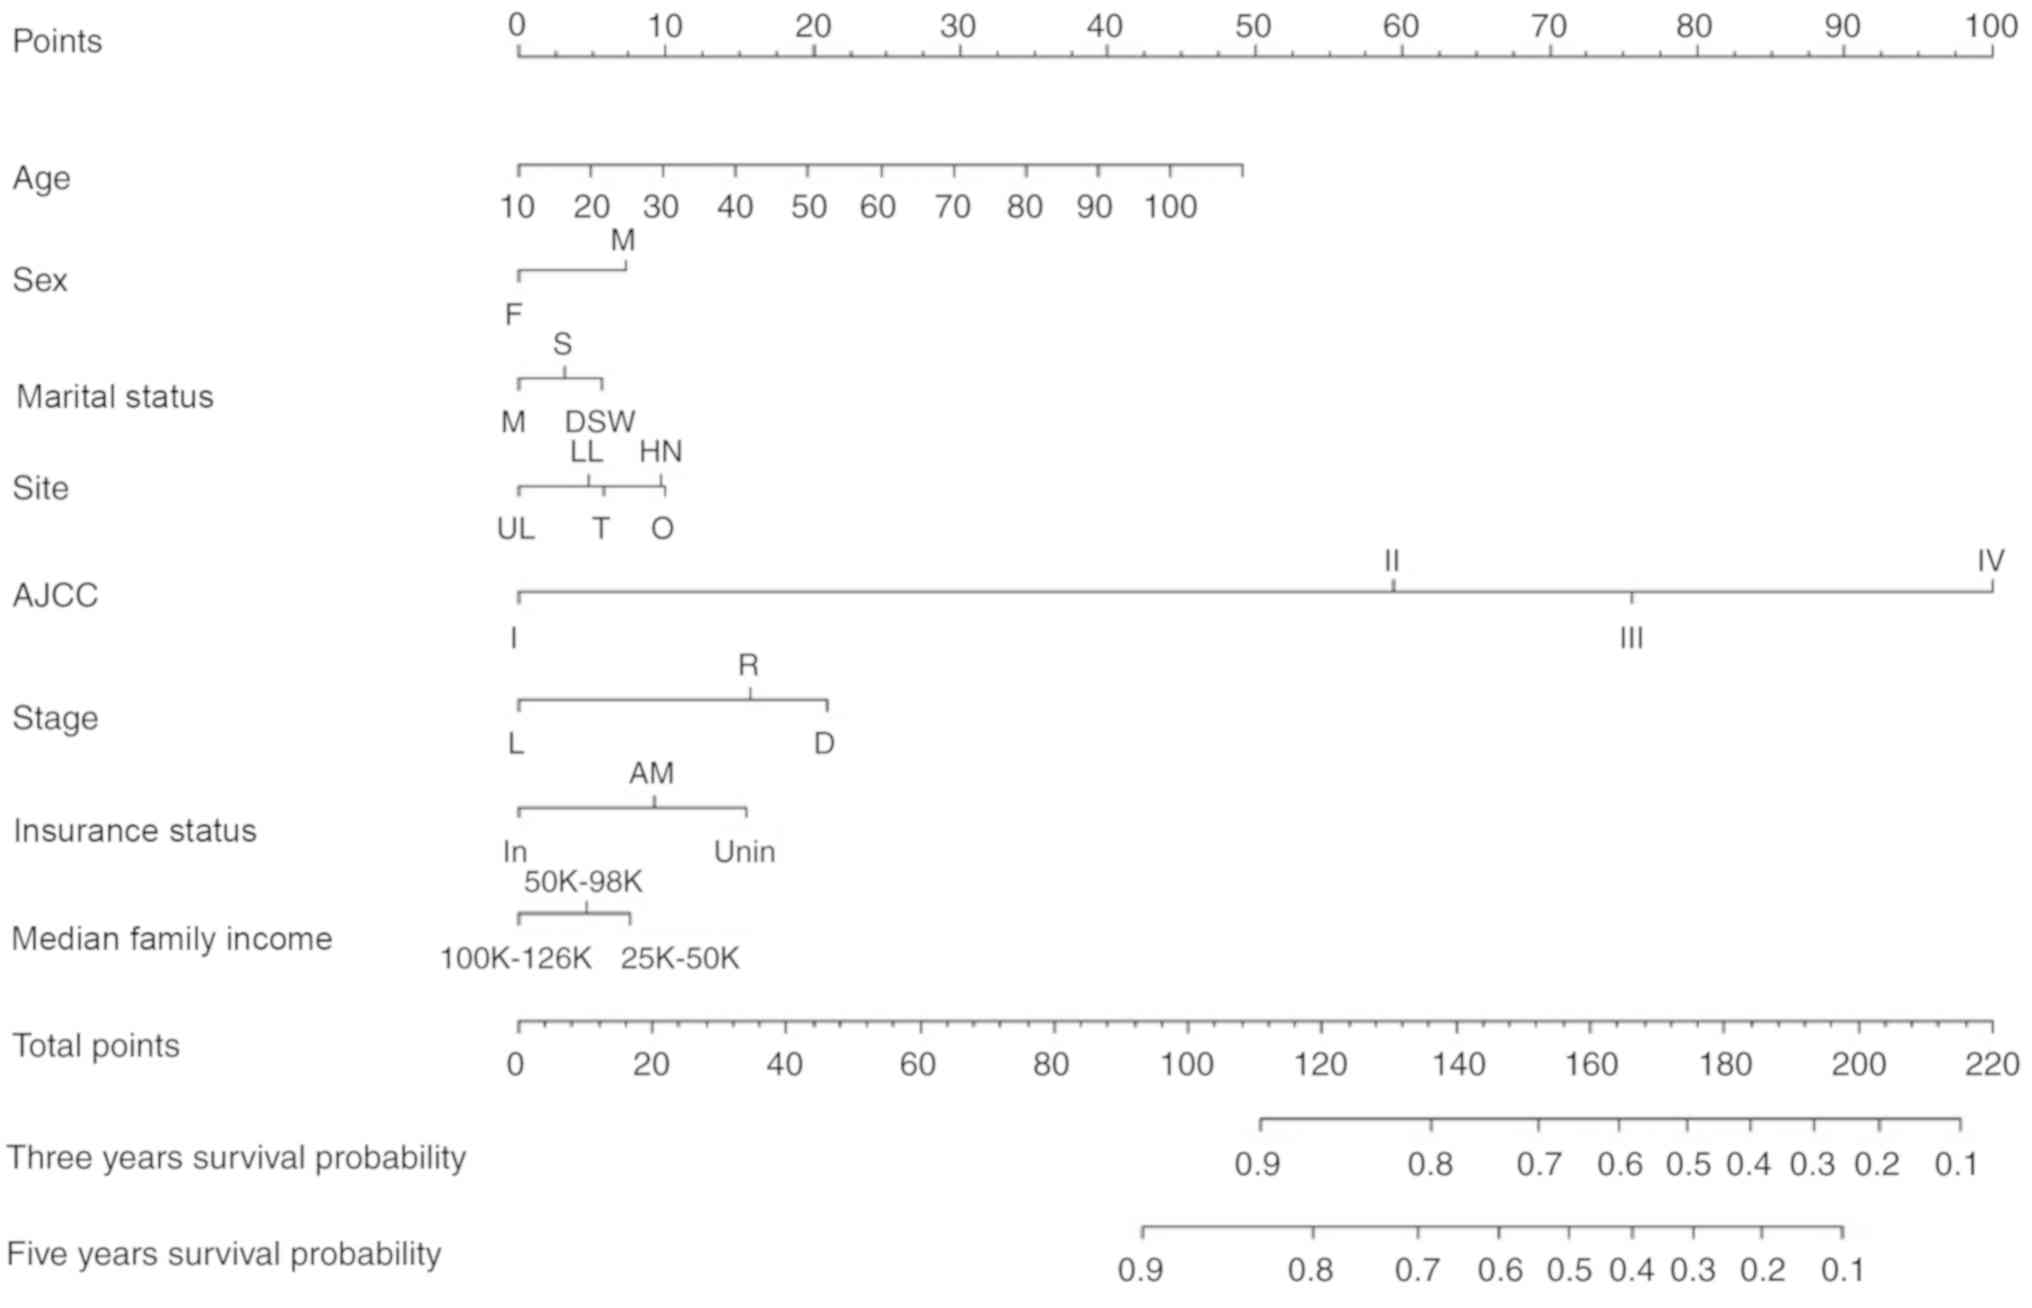 | Figure 1.Nomogram predicting 3- and 5-year
survival. F, female; M, male; M, married; S, single; DSW, divorced,
separated or widowed; UL, upper limbs; LL, lower limbs; T, trunk;
HN, head and neck; O, other; SEER, Surveillance, Epidemiology, and
End Results; L, localized; R, regional; D, distant. status: In,
insured; AM, any medicaid (Indian/Public Health Service; Medicaid,
Medicaid-Administered through a managed care plan; Medicare with
Medicaid eligibility); Unin, uninsured; AJCC, American Joint
Committee on Cancer. The nomogram is used by first giving each
variable a score on its points scale. The scores for all variables
are then added to obtain the total score and a vertical line is
drawn from the total-points row to estimate the 3-year and 5-year
survival rates. |
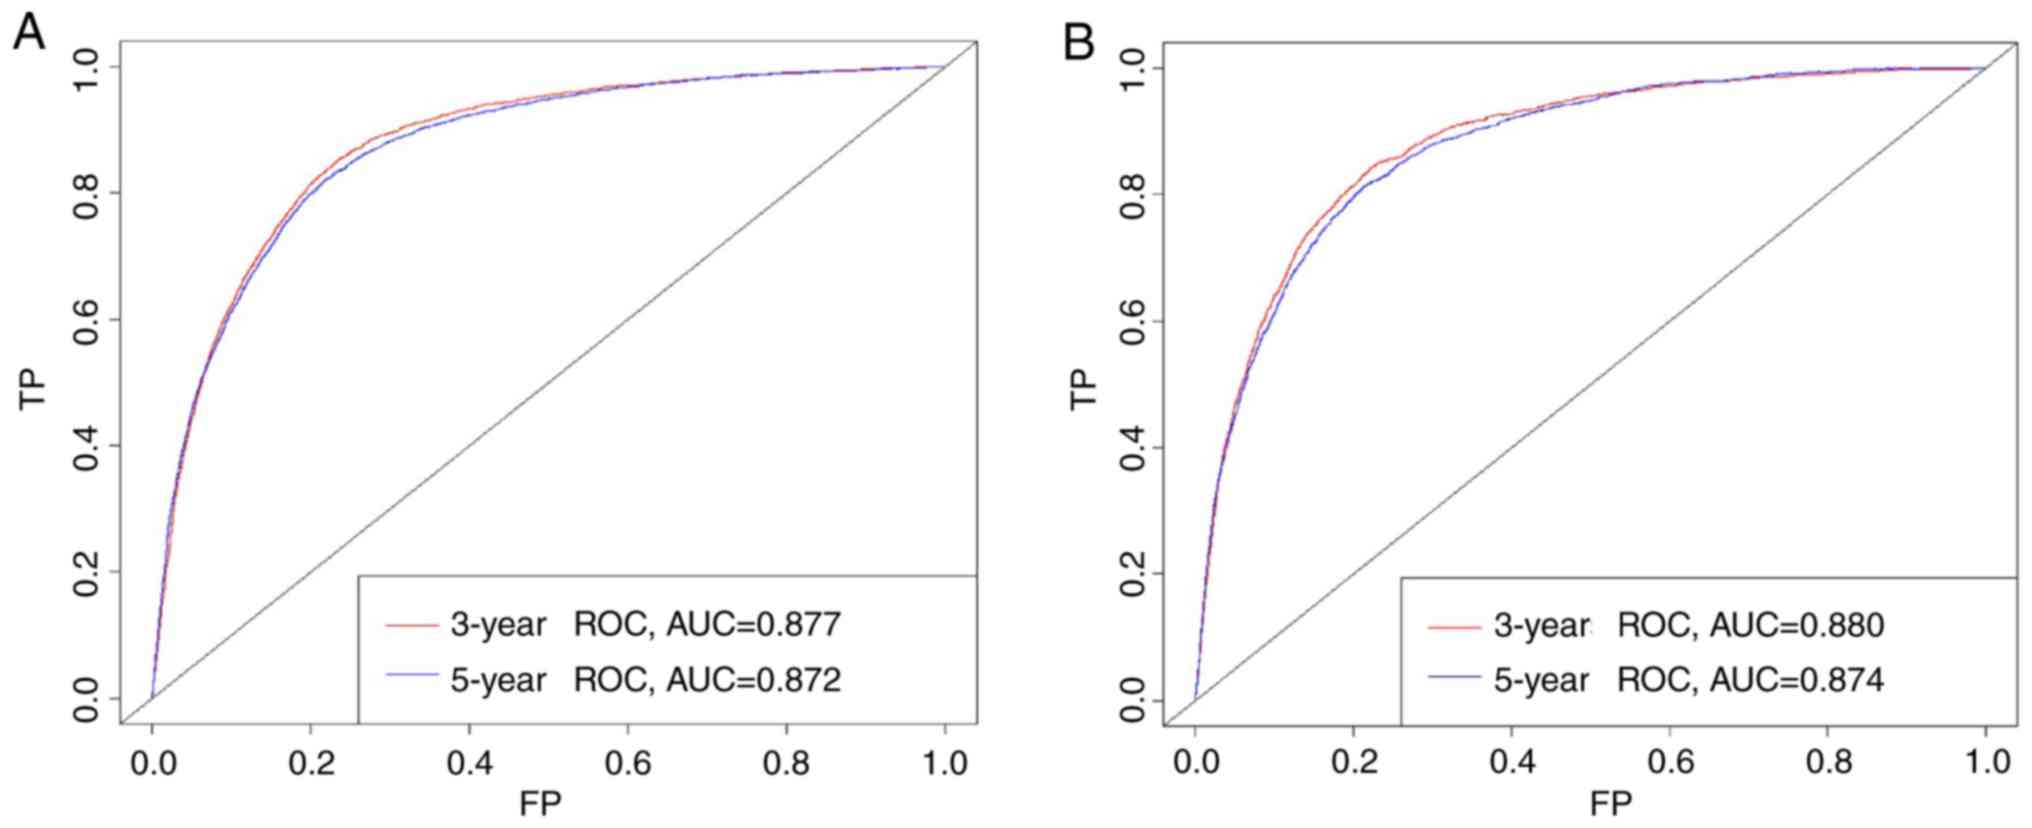
Performance of the nomogram
Based on the C-index analysis of the SEER training
cohort, the nomogram provided high C-indexes for the 3- and 5-year
OS rates, with AUCs of 0.877 and 0.872, respectively (Fig. 2A). Similarly, the corresponding
values for the validation cohort were high, 0.880 and 0.874,
respectively, indicating that the model had good discrimination
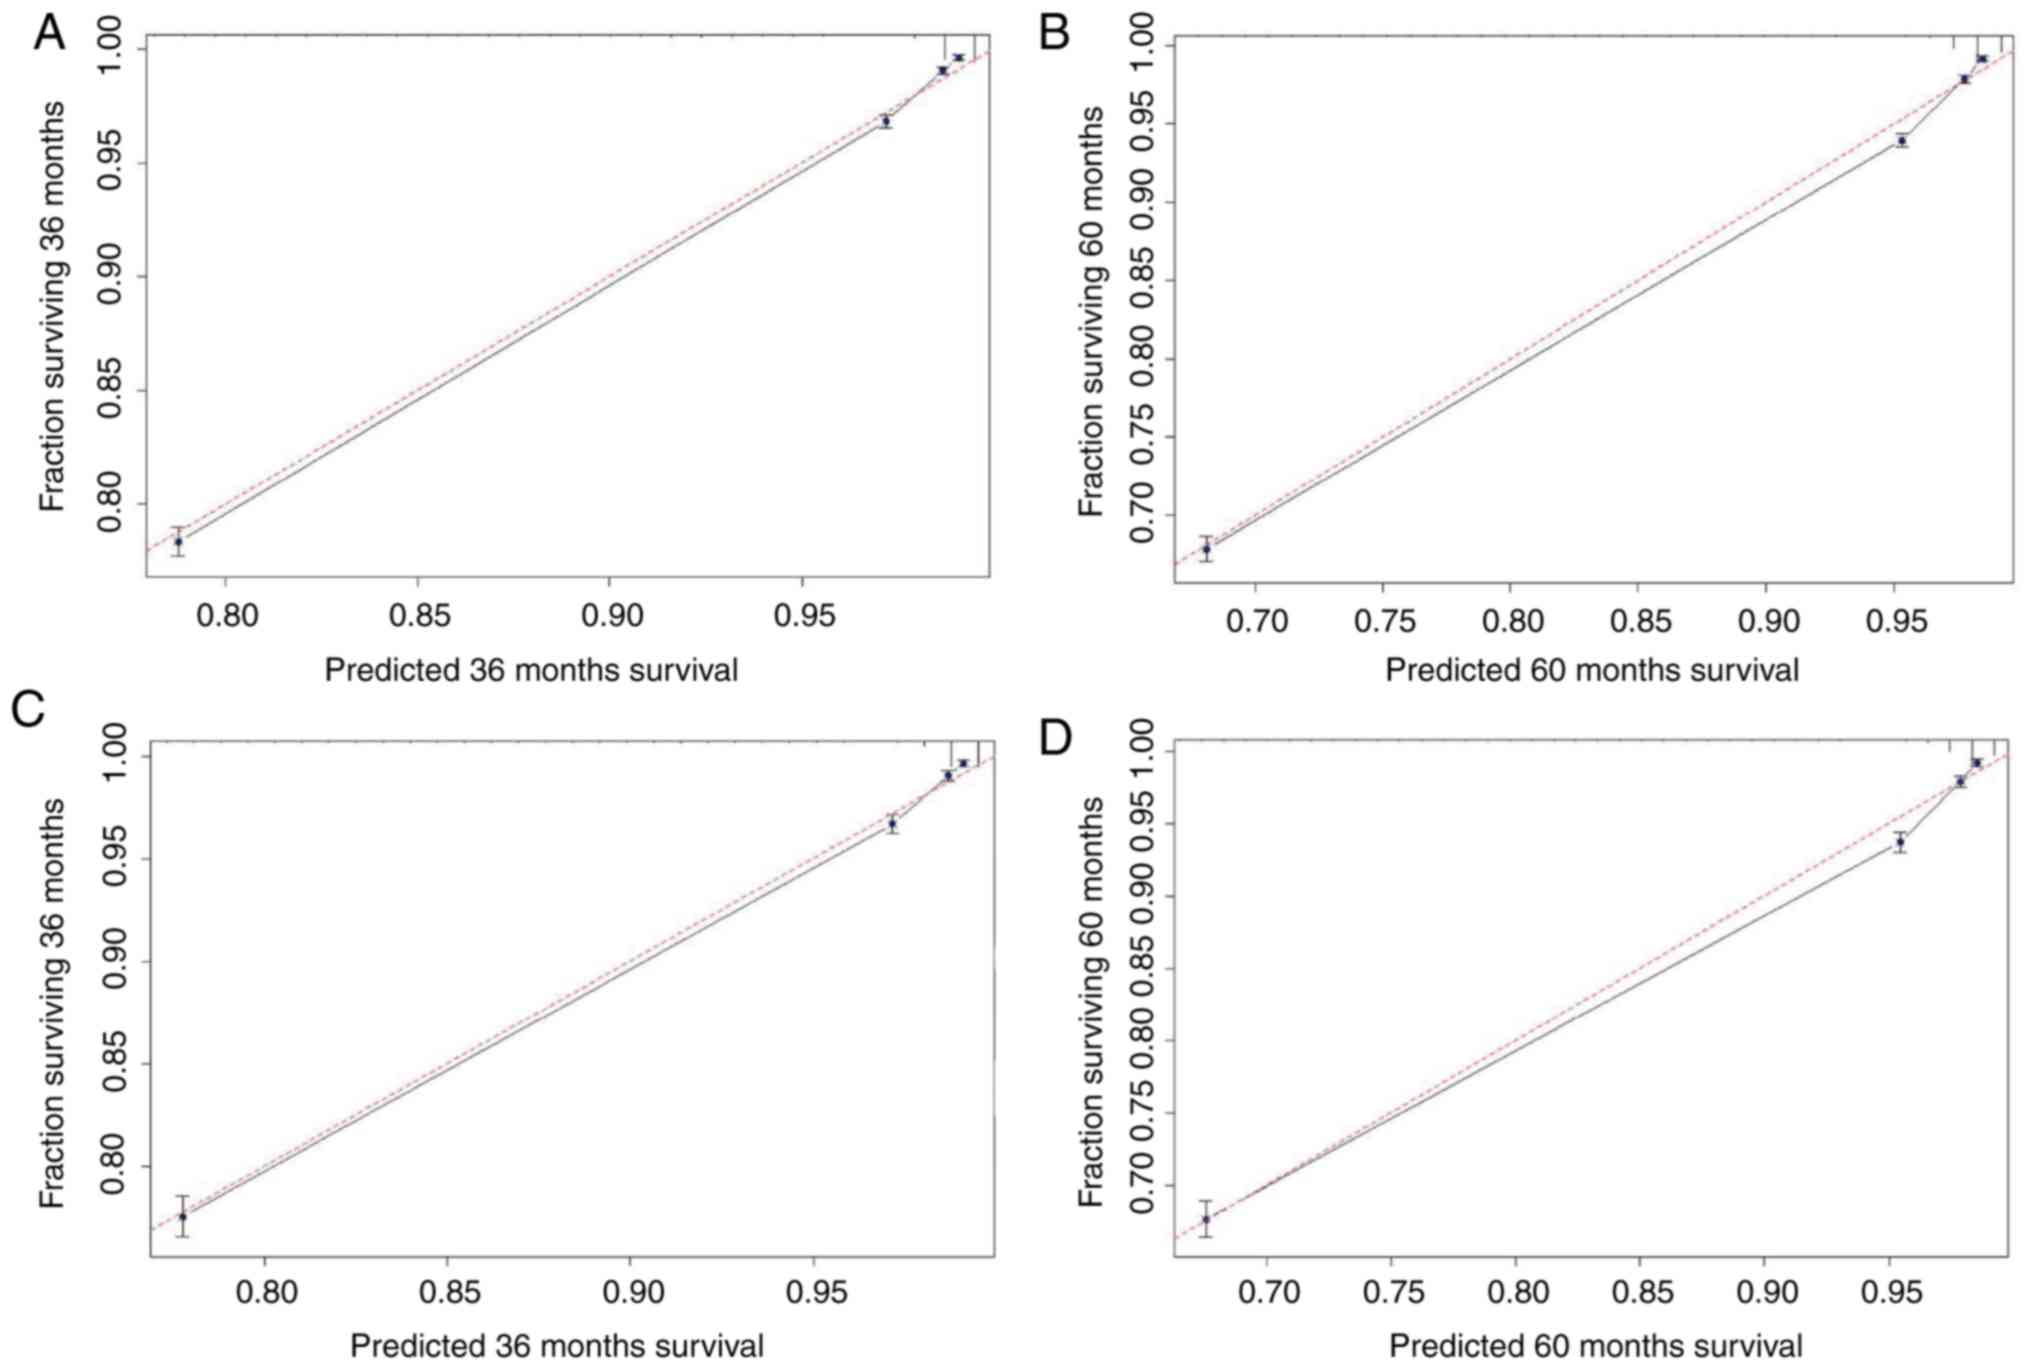
ability (Fig. 2B). As presented in
Fig. 3, the predicted 3- and 5-year
OS rate probabilities for the SEER training and validation groups
were almost identical to the actual observations.
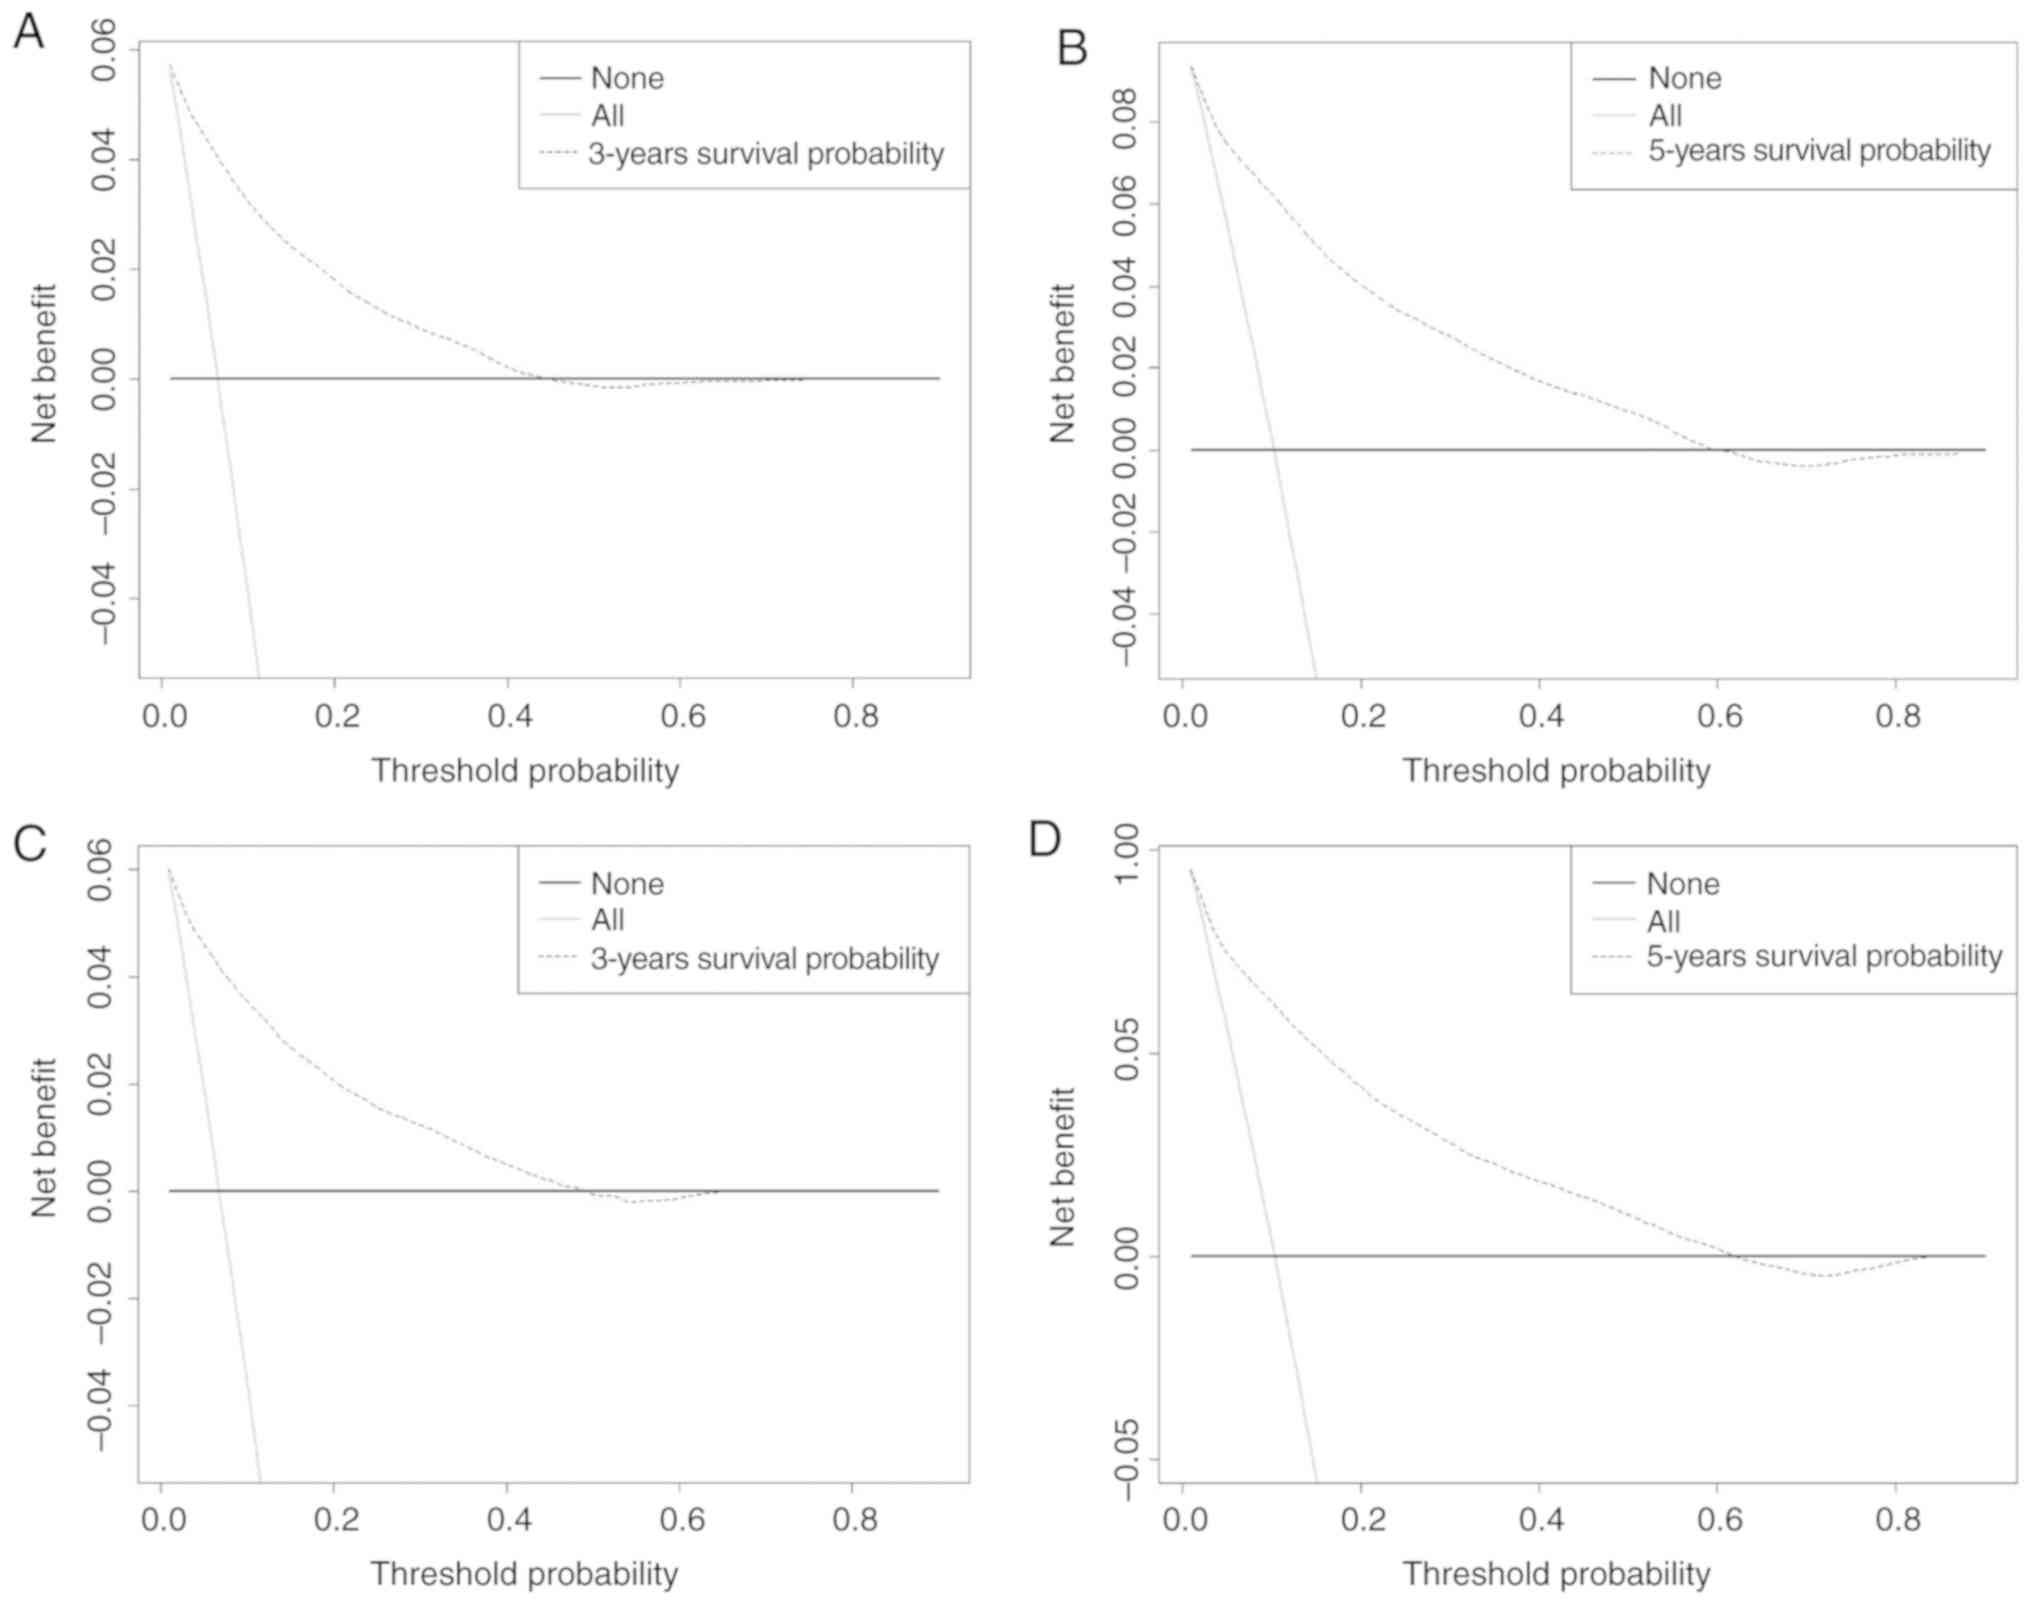
DCA
The abscissa of a decision curve is the threshold PI
and the ordinate is the net benefit rate. A horizontal line
indicates that all samples are negative and not treated (with a net
benefit of zero), i.e. these patients are disease-free and do not
require treatment. An oblique line, with a positive slope,
indicates that all samples are positive and the patients had
received treatment, and the net benefit is indicated by an oblique
line with a negative slope. In our model, the 3- and 5-year DCA
curves yielded net benefits for both the training and validation
cohorts (Fig. 4).
Discussion
The AJCC staging manual has become the benchmark for
classifying patients with cancer, predicting their prognosis and
selecting appropriate treatment approaches (27). However, the prognosis may differ in
patients at the same pathological stage due to other influencing
factors such as age, sex, histological type and adjuvant
chemotherapy, all of which may affect the OS rate (16). MM is one of the most aggressive forms
of cutaneous neoplasm, and its incidence is increasing (28). Therefore, a more individualized
approach for predicting the survival of patients with MM is
required. Nomograms may provide an accurate and informative
prognosis for individual patients (12,29,30), and
have already been applied for prognosis prediction of various tumor
types. For example, Cai et al (31) developed a nomogram for hepatic
functional reserve and tumor characteristics of hepatocellular
carcinoma following therapeutic hepatectomy. Zhang et al
(32) established a gallbladder
cancer-specific survival model to predict the prognosis of patients
with non-metastatic gallbladder cancer following non-surgical
treatment. Pietrantonio et al (33) established a nomogram for predicting
the survival PI of patients with advanced gastric cancer. The SEER
database provides a large number of samples for exploring risk
factors and developing accurate predictive models. The analysis of
data collected by the SEER database renders the results obtained in
the current study more generalizable than those from single-center
studies. Our group has recently published an article on nodular
melanoma, which is limited to nodular tumors (21). However, the present study
investigated the prognosis of all malignant melanomas and includes
more cases and is more comprehensive/accurate. To the best of our
knowledge, the present study is the first to use a nomogram to
develop a predictive model for predicting 3- and 5-year survival
rates in patients with MM.
The present study included 110,727 cases from the
SEER database, and 70 and 30% of the patients were randomly
assigned to the training and validation cohorts, respectively.
Factors that affect patient survival were assessed using the Cox
proportional-hazards model. Variables that were significant in the
univariate analysis were included in the final multivariate model.
The multivariate Cox regression analysis revealed that the age at
diagnosis was a risk factor for survival in patients with MM. As
for all types of cancer, the incidence of melanoma increases with
age (34), which is consistent with
the results obtained in the current study. Compared with being
married, being single and DSW were risk factors for survival, which
has also been observed in previous studies (35,36).
Being female was a protective factor, as was having localized
disease. McLaughlin et al (37) found that among married, single,
divorced or separated patients, the risk of a late diagnosis was
>50% higher in males than in females. A previous study
investigating head and neck MM found that the prognosis was better
in female patients compared with male patients (38).
Ethnicity was not statistically significant in the
multivariate Cox regression. Compared with the head and neck,
locations in the trunk, upper and lower limbs were protective
factors. The results of ethnicity and site remain to be
interpreted, but may be due to the use of different data and the
specific factors selected in the predictive model.
The present study included DCA, which is a recently
described analytical technique. Although novel, a previous study
has recommended the use of DCA (26). The present study revealed that the 3-
and 5-year DCA curves yielded net benefits for both the training
and validation cohorts, indicating that the model provides certain
clinical benefits. For example, in a validation set of three years
of survival, the PI of a patient diagnosed with MM is recorded as
PI, and when the threshold of PI reaches 20%, it is defined as
positive and treatment is received. At this point, there will be
patients benefiting, and there will be non-patients receiving
treatment, causing damage, and patients not receiving treatment,
which is a loss. The ordinate is the net benefit, and two of the
100 people would have a net benefit.
The present study was subject to some limitations.
Firstly, only patients for whom complete information was available
were included, which may have introduced selection bias. Secondly,
common variables associated with prognosis, such as smoking history
and genetic mutations (39), were
not included in the model as no relevant data was available in the
SEER database. Thirdly, an internal validation approach was used to
evaluate the model performance. Although the model exhibited good
performance, external verification is required to estimate its
accuracy and verify its utility for decision-making. Fourthly, the
values predicted by the nomogram should be considered as reference
values, rather than representing certain prognoses. Finally, the
current study was based on retrospective data, and so inherent bias
was inevitable.
The present study developed and internally validated
a nomogram for predicting the 3- and 5-year survival rates in
patients with MM. This nomogram predicted the survival rate of
individual patients with a high C-index, and was found to be well
calibrated and the DCA curves yielded net benefits. The results
obtained in the current study may aid clinicians to provide more
accurate prognosis predictions in patients with MM.
Acknowledgements
Not applicable.
Funding
This study was supported by the National Social
Science Foundation of China (grant no. 16BGL183) and the Research
Fund of Health Bureau of Xi'an (grant no. QFO1330).
Availability of data and materials
The datasets analyzed during the current study are
publicly available in the Surveillance, Epidemiology, and End
Results repository (https://seer.cancer.gov/).
Authors' contributions
JL conceived and designed the study. JY and QL
screened data from the database. JY, ZP and QZ analyzed the data.
QL, FZ, XF and JL participated in data interpretation. JY wrote the
paper. All authors read and approved the final manuscript.
Ethics approval and consent to
participate
Not applicable.
Patient consent for publication
Not applicable.
Competing interests
The authors declare that they have no competing
interests.
References
|
1
|
Bhandaru M, Ardekani GS, Zhang G, Martinka
M, McElwee KJ, Li G and Rotte A: A combination of p300 and Braf
expression in the diagnosis and prognosis of melanoma. BMC Cancer.
14:3982014. View Article : Google Scholar : PubMed/NCBI
|
|
2
|
Berrocal A, Cabañas L, Espinosa E,
Fernández-de-Misa R, Martín-Algarra S, Martínez-Cedres JC,
Ríos-Buceta L and Rodríguez-Peralto JL: Melanoma: Diagnosis,
staging, and treatment. consensus group recommendations. Adv Ther.
31:945–960. 2014. View Article : Google Scholar : PubMed/NCBI
|
|
3
|
Mishra H, Mishra PK, Ekielski A, Jaggi M,
Iqbal Z and Talegaonkar S: Melanoma treatment: From conventional to
nanotechnology. J Cancer Res Clin Oncol. 144:2283–2302. 2018.
View Article : Google Scholar : PubMed/NCBI
|
|
4
|
Zhang M and Zhang N: Clinical and
prognostic factors in 98 patients with malignant melanoma in China.
J Int Med Res. 45:1369–1377. 2017. View Article : Google Scholar : PubMed/NCBI
|
|
5
|
Wan X, Zhu Y, Zhang L and Hou W: Gefitinib
inhibits malignant melanoma cells through the VEGF/AKT signaling
pathway. Mol Med Rep. 17:7351–7355. 2018.PubMed/NCBI
|
|
6
|
Kang X, Zeng Y, Liang J, Li J, Ren D, Chai
L, Sun Z, Yu S, Wu X, Han W and Wang W: Aberrations and clinical
significance of BRAF in malignant melanoma. Medicine. 97:e95092018.
View Article : Google Scholar : PubMed/NCBI
|
|
7
|
You H, Yang J, Liu Q, Tang L, Bu Q, Pan Z
and Lyu J: The impact of the lymph node density on overall survival
in patients with Wilms' tumor: A SEER analysis. Cancer Manag Res.
10:671–677. 2018. View Article : Google Scholar : PubMed/NCBI
|
|
8
|
Duggan MA, Anderson WF, Altekruse S,
Penberthy L and Sherman ME: The surveillance, epidemiology, and end
results (SEER) program and pathology. Am J Surg Pathol.
40:e94–e102. 2016. View Article : Google Scholar : PubMed/NCBI
|
|
9
|
Healy MA, Morris AM, Abrahamse P, Ward KC,
Kato I and Veenstra CM: The accuracy of chemotherapy ascertainment
among colorectal cancer patients in the surveillance, epidemiology,
and end results registry program. BMC Cancer. 18:4812018.
View Article : Google Scholar : PubMed/NCBI
|
|
10
|
Cao J, Yuan P, Wang L, Wang Y, Ma H, Yuan
X, Lv W and Hu J: Clinical nomogram for predicting survival of
esophageal cancer patients after esophagectomy. Sci Rep.
6:266842016. View Article : Google Scholar : PubMed/NCBI
|
|
11
|
Sun W, Jiang YZ, Liu YR, Ma D and Shao ZM:
Nomograms to estimate long-term overall survival and breast
cancer-specific survival of patients with luminal breast cancer.
Oncotarget. 7:20496–20506. 2016.PubMed/NCBI
|
|
12
|
Abu-Rustum NR, Zhou Q, Gomez JD, Alektiar
KM, Hensley ML, Soslow RA, Levine DA, Chi DS, Barakat RR and
Iasonos A: A nomogram for predicting overall survival of women with
endometrial cancer following primary therapy: Toward improving
individualized cancer care. Gynecol Oncol. 116:399–403. 2010.
View Article : Google Scholar : PubMed/NCBI
|
|
13
|
Iasonos A, Schrag D, Raj GV and Panageas
KS: How to build and interpret a nomogram for cancer prognosis. J
Clin Oncol. 26:1364–1370. 2008. View Article : Google Scholar : PubMed/NCBI
|
|
14
|
Weiser MR, Landmann RG, Kattan MW, Gonen
M, Shia J, Chou J, Paty PB, Guillem JG, Temple LK, Schrag D, et al:
Individualized prediction of colon cancer recurrence using a
nomogram. J Clin Oncol. 26:380–385. 2008. View Article : Google Scholar : PubMed/NCBI
|
|
15
|
Ohori Tatsuo Gondo, Riu Hamada M, Gondo T
and Hamada R: Nomogram as predictive model in clinical practice.
Gan To Kagaku Ryoho. 6:901–906. 2009.(In Japanese).
|
|
16
|
Han DS, Suh YS, Kong SH, Lee HJ, Choi Y,
Aikou S, Sano T, Park BJ, Kim WH and Yang HK: Nomogram predicting
long-term survival after d2 gastrectomy for gastric cancer. J Clin
Oncol. 30:3834–3840. 2012. View Article : Google Scholar : PubMed/NCBI
|
|
17
|
Albert JM, Liu DD, Shen Y, Pan IW, Shih
YC, Hoffman KE, Buchholz TA, Giordano SH and Smith BD: Nomogram to
predict the benefit of radiation for older patients with breast
cancer treated with conservative surgery. J Clin Oncol.
30:2837–2843. 2012. View Article : Google Scholar : PubMed/NCBI
|
|
18
|
Wang Y, Li J, Xia Y, Gong R, Wang K, Yan
Z, Wan X, Liu G, Wu D, Shi L, et al: Prognostic nomogram for
intrahepatic cholangiocarcinoma after partial hepatectomy. J Clin
Oncol. 31:1188–1195. 2013. View Article : Google Scholar : PubMed/NCBI
|
|
19
|
Mariani P, Dureau S, Savignoni A, Rouic
LL, Levy-Gabriel C, Piperno-Neumann S, Rodrigues MJ, Desjardins L,
Cassoux N and Servois V: Development of a prognostic nomogram for
liver metastasis of uveal melanoma patients selected by liver MRI.
Cancers (Basel). 11(pii): E8632019. View Article : Google Scholar : PubMed/NCBI
|
|
20
|
Woods JF, De Marchi JA, Lowery AJ and Hill
AD: Validation of a nomogram predicting sentinel lymph node status
in melanoma in an Irish population. Ir J Med Sci. 184:769–773.
2015. View Article : Google Scholar : PubMed/NCBI
|
|
21
|
Yang J, Pan Z, Zhao F, Feng X, Liu Q, Li Y
and Lyu J: A nomogram for predicting survival in patients with
nodular melanoma: A population-based study. Medicine (Baltimore).
98:e160592019. View Article : Google Scholar : PubMed/NCBI
|
|
22
|
Kavuluru R, Hands I, Durbin EB and Witt L:
Automatic extraction of ICD-O-3 primary sites from cancer pathology
reports. AMIA Jt Summits Transl Sci Proc 2013. 112–116. 2013.
|
|
23
|
Harrell FE Jr, Lee KL and Mark DB:
Multivariable prognostic models: Issues in developing models,
evaluating assumptions and adequacy, and measuring and reducing
errors. Stat Med. 15:361–387. 1996. View Article : Google Scholar : PubMed/NCBI
|
|
24
|
Hu Y, You S, Yang Z and Cheng S: Nomogram
predicting survival of hepatocellular carcinoma with portal vein
tumour thrombus after curative resection. ANZ J Surg. 89:E20–E25.
2019. View Article : Google Scholar : PubMed/NCBI
|
|
25
|
Vickers AJ and Elkin EB: Decision curve
analysis: A novel method for evaluating prediction models. Med
Decis Making. 26:565–574. 2006. View Article : Google Scholar : PubMed/NCBI
|
|
26
|
Rousson V and Zumbrunn T: Decision curve
analysis revisited: Overall net benefit, relationships to ROC curve
analysis, and application to case-control studies. BMC Med Inform
Decis Mak. 11:452011. View Article : Google Scholar : PubMed/NCBI
|
|
27
|
Amin MB, Greene FL, Edge SB, Compton CC,
Gershenwald JE, Brookland RK, Meyer L, Gress DM, Byrd DR and
Winchester DP: The eighth edition AJCC cancer staging manual:
Continuing to build a bridge from a population-based to a more
‘personalized’ approach to cancer staging. CA Cancer J Clin.
67:93–99. 2017. View Article : Google Scholar : PubMed/NCBI
|
|
28
|
Mou K, Ding M, Han D, Zhou Y, Mu X, Liu W
and Wang L: miR-590-5p inhibits tumor growth in malignant melanoma
by suppressing YAP1 expression. Oncol Rep. 40:2056–2066.
2018.PubMed/NCBI
|
|
29
|
Shen W, Sakamoto N and Yang L:
Melanoma-specific mortality and competing mortality in patients
with non-metastatic malignant melanoma: A population-based
analysis. BMC Cancer. 16:4132016. View Article : Google Scholar : PubMed/NCBI
|
|
30
|
Xu XL, Cheng H, Tang MS, Zhang HL, Wu RY,
Yu Y, Li X, Wang XM, Mai J, Yang CL, et al: A novel nomogram based
on LODDS to predict the prognosis of epithelial ovarian cancer.
Oncotarget. 8:8120–8130. 2017.PubMed/NCBI
|
|
31
|
Cai BB, Shi KQ, Li P, Chen BC, Shi L,
Johnson PJ, Lai P, Toyoda H and Zhou MT: A nomogram integrating
hepatic reserve and tumor characteristics for hepatocellular
carcinoma following curative liver resection. Clin Chim Acta.
485:187–194. 2018. View Article : Google Scholar : PubMed/NCBI
|
|
32
|
Zhang W, Hong HJ and Chen YL:
Establishment of a gallbladder cancer-specific survival model to
predict prognosis in non-metastatic gallbladder cancer patients
after surgical resection. Dig Dis Sci. 63:2251–2258. 2018.
View Article : Google Scholar : PubMed/NCBI
|
|
33
|
Pietrantonio F, Barretta F, Fanotto V,
Park SH, Morano F, Fucà G, Niger M, Prisciandaro M, Silvestris N,
Bergamo F, et al: Estimating survival probabilities of advanced
gastric cancer patients in the second-line setting: The gastric
life nomogram. Oncology. 95:344–352. 2018. View Article : Google Scholar : PubMed/NCBI
|
|
34
|
Ribero S, Stucci LS, Marra E, Marconcini
R, Spagnolo F, Orgiano L, Picasso V, Queirolo P, Palmieri G,
Quaglino P and Bataille V: Effect of age on melanoma risk,
prognosis and treatment response. Acta Derm Venereol. 98:624–629.
2018. View Article : Google Scholar : PubMed/NCBI
|
|
35
|
Reyes Ortiz CA, Freeman JL, Kuo YF and
Goodwin JS: The influence of marital status on stage at diagnosis
and survival of older persons with melanoma. J Gerontol A Biol Sci
Med Sci. 62:892–898. 2007. View Article : Google Scholar : PubMed/NCBI
|
|
36
|
Jiang AJ, Rambhatla PV and Eide MJ: A
systematic review of socioeconomic and lifestyle factors and
melanoma. Br J Derm. 74:885–915. 2014.
|
|
37
|
McLaughlin JM, Fisher JL and Paskett ED:
Marital status and stage at diagnosis of cutaneous melanoma:
Results from the surveillance epidemiology and end results (SEER)
program, 1973–2006. Cancer. 117:1984–1993. 2011. View Article : Google Scholar : PubMed/NCBI
|
|
38
|
Arce PM, Camilon PR, Stokes WA, Nguyen SA
and Lentsch EJ: Is sex an independent prognostic factor in
cutaneous head and neck melanoma? Laryngoscope. 124:1363–1367.
2014. View Article : Google Scholar : PubMed/NCBI
|
|
39
|
Vaithinathan AG and Asokan V: Public
health and precision medicine share a goal. J Evid Based Med.
10:76–80. 2017. View Article : Google Scholar : PubMed/NCBI
|