Introduction
The adrenal glands reside above the kidneys and
produce multiple hormones essential for development (1). Each gland consists of an inner medulla
and an outer cortex that produce catecholamines and steroid
hormones, respectively (2).
Adrenocortical carcinoma (ACC) is a rare tumor of the adrenal
cortex with an estimated incidence of 1 patient per million/year
(3,4). There is a higher prevalence of ACC in
females and an increased incidence in the first and fourth to fifth
decades of life (5). There are no
notable clinical phenotypic characteristics in patients with ACC
during the early stage and the majority of patients are diagnosed
with advanced stage ACC in the first instance (6). Patients with ACC do not respond
favorably to chemotherapy and radiotherapy (7) and the patients frequently have to
undergo surgical resection where the 5-year survival rate is
>35%. Mitotane (o, p'-dichlorodiphe nyldichloroethane) has been
used since the 60s for treating patients with ACC, despite its
toxicity and narrow therapeutic index (8,9). An
improved understanding of the genes associated with ACC may improve
treatment options by identifying potential therapeutic targets.
Weighted gene co-expression network analysis (WGCNA) is a
frequently used method to explore the association between genes and
phenotypes (10). Gene expression
data are transformed into co-expression modules and provide
insights into the signaling networks that may underlie certain
phenotypes. WGCNA is widely used to improve understanding of
various biological processes such as cancer and its progression
(11,12). Yang et al (13) identified candidate biomarkers and
molecular mechanisms involved in glioblastoma multiforme using
WGCNA (13). WGCNA compares
differentially expressed genes and identifies key interactions
among different co-expression modules (12).
Next generation sequencing is used to detect genomic
alterations which could be used to guide targeted therapies for
treating patients with ACC and several targets have been discovered
(14,15). However, the molecular diagnostic
parameters are still not entirely known and there are only small
number of studies that have cataloged relevant expression modules
in patients with ACC, which has limited understanding of the
disease and its mechanisms (16–18).
Using WGCNA, it is possible to construct gene networks and analyze
the connectivity between genes and clinical traits (19). The master regulators identified in
the gene regulation network will typically exhibit important
functions.
In this study, it was hypothesized that distinct ACC
co-expression modules are associated with different clinical
outcomes and the highly connected genes in the modules can
represent the biological feature of this module and have the
potential as prognosis markers. Normalized-RNA-seq and clinical
data was downloaded from the TCGA database of 79 patients with ACC
at different stages. The candidate mRNAs related to tumor
progression were identified by co-expression analysis. Furthermore,
2,472 differentially expressed genes from ACC and normal tissues
were downloaded from the Gene expression profiling interactive
analysis (GEPIA) website (20), and
ACC and ACC co-expression modules were constructed (20). Gene Ontology (GO) and Kyoto
Encyclopedia of Genes and Genomes (KEGG) enrichment analyses were
performed on the selected modules, and the hub gene in each module
was identified, which assisted in determining the primary
function(s) of the genes in each module. These findings may play a
significant role in recognizing the malignant potential of these
genes as well as the prognosis of patients with ACC.
Materials and methods
Patients and TCGA data retrieval
The clinical and gene expression data of 79 patients
with ACC were obtained from TCGA (https://tcga-data.nci.nih.gov/tcga/) (21), where the expression profile was
obtained based on the IlluminaHiSeq RNA-seq platform (Illumina,
Inc.). The Bioconductor (22)
packages TCGAbiolinks (23) based on
the R software (24) (version 3.4.0)
were used to download and process the data collected from TCGA.
These data included the age, sex, survival status and the cancer
stage of the patients in addition to the vital status. The DEGs in
normal and ACC tissues were obtained from GEPIA (http://gepia.cancer-pku.cn/) (20). The screening standards for the
identification of DEGs were a log2 fold-change (log2FC)>1 and
Q<0.01.
WGCNA
Co-expression networks were constructed with the
identified DEGs. Pearson's correlation coefficients were calculated
for all the genes in the dataset and the correlation matrix of the
entire gene dataset was obtained. The power β was used to remove
weakly correlated genes, while retaining the strongly correlated
ones. The process produced an adjacent matrices weighted network
that was converted into a topological overlapping matrices (TOM)
network as previously described (10,25).
After constructing the TOM network, hierarchical clustering was
used to generate a cluster dendrogram with branches corresponding
to the gene co-expression modules. The WGCNA (10) algorithm was used to identify the
co-expression modules. WGCNA was implemented using R (10). The TOM representing the overlap in
shared neighbors and the soft thresholding power were calculated
according to a previous study (25).
Colored heatmaps were used to analyze the strength of the
interactions.
Construct module-trait associations of
ACC
Module-trait associations were estimated using the
association between the module signature and the phenotype
(clinical traits) as previously described (12), thus allowing easy identification of
the expression set (module) that strongly correlated with the
phenotype. For each expression profile, the gene significance (GS)
was calculated as the absolute value of the association between the
expression profile and each clinical trait, whereas the module
membership (MM) was defined as the correlation between the
expression profile and each module signature.
Functional analysis of network module
genes
To identify the underlying biological mechanisms
responsible for the progression of ACC, the DEGs derived from the
brown and yellow modules were used for GO and KEGG pathway
enrichment analyses, because the two modules are both correlated
with the patient clinical traits. The DEGs annotated in the GO
database were used to classify the GO functions in the
ClusterProfiler package (26), and
the DEGs for KEGG enrichment analysis were mapped to the KEGG
database. After the enrichment analysis, the significant KEGG
pathway and GO terms were selected according to the cut-off
criterion of adjusted P<0.05.
Protein-protein-interaction (PPI)
network construction
The PPI data was retrieved from a previous study,
which contained protein interaction associations from 15 databases
(27). The overall PPI network was
based on 16,081 nodes and 231,633 interactions in these databases.
The genes involved in the brown and yellow modules were mapped to
the overall PPI network to obtain the module specific interaction
network. Furthermore, the degree of each node was calculated using
the IGRAPH package (28). The widely
linked genes (hub genes) in the PPI network were more closely
related to most proteins.
Determination of the receiver
operating characteristic (ROC) curves and the area under the ROC
curve (AUC)
To validate whether the mRNA levels of the hub genes
exhibit excellent diagnostic efficiency for distinguishing the
tumor tissues from the normal tissues, the ROC curve analysis was
performed. Specifically, the normalized the mRNA expression profile
both for the normal adrenal gland tissue and the ACC tissue were
downloaded from Recount2 database (29), including 159 normal adrenal gland
samples and 79 ACC samples respectively. The ACC samples were
labeled as ‘positive’ and the normal adrenal gland sample were
labeled as ‘negative’. Subsequently, the ROCR (30) package based on the R (version 3.5.2)
software system was used to plot the ROC curve and calculated the
AUC for the hub genes.
Survival analysis
Survival analysis for all genes in the brown and
yellow modules was performed using the R survival package
(https://CRAN.R-project.org/package=survival; version
2.41–3). A log-rank test was performed to determine whether the
expression of a gene correlated with the overall survival. For the
overall survival rate, a log-rank test was used to test for
significance in the univariate analysis between each subgroup.
Unless otherwise specified, P<0.05 was considered to indicate a
statistically significant difference.
Results
Pre-processing of datasets and
construction of ACC co-expression modules
The clinical information, including the age, sex,
race, ethnicity and vital status, and the normalized RNA-seq data
of 79 patients were obtained from TCGA. The DEGs in normal and ACC
tissues were retrieved from GEPIA. A total of 2,472 DEGs were
identified with a Q-value <0.01 and a log2FC>1. The
expression values of the 2,472 genes in the 79 ACC samples were
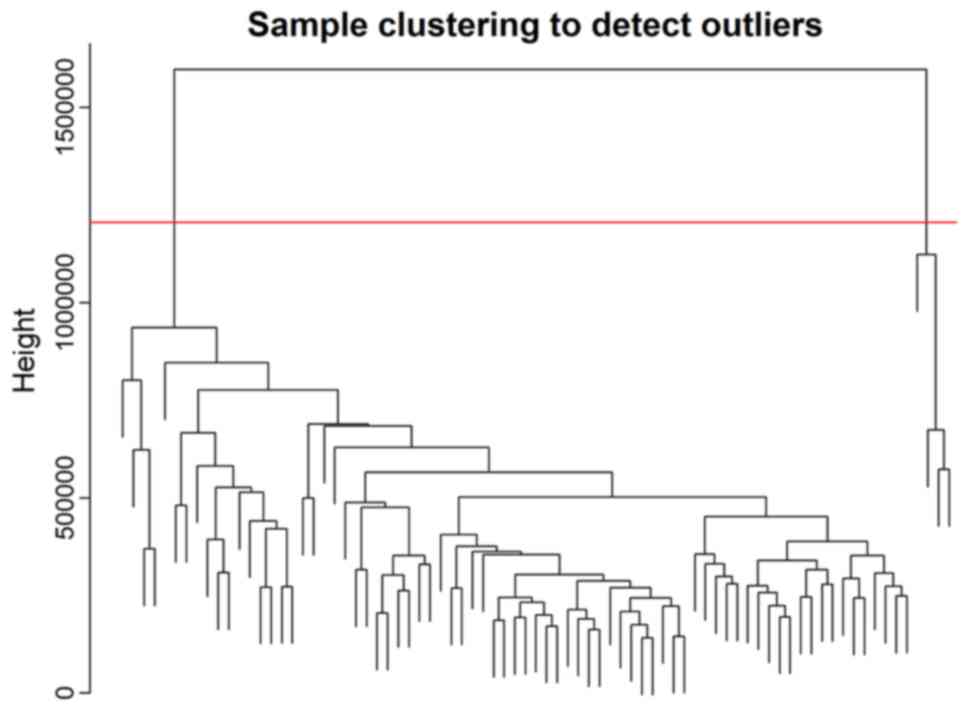
used to construct the co-expression module by WGCNA. The flashClust
package (31) was used to perform
the cluster analysis (Fig. 1). A
total of four abnormal samples were removed and 75 samples were
used for further analysis.
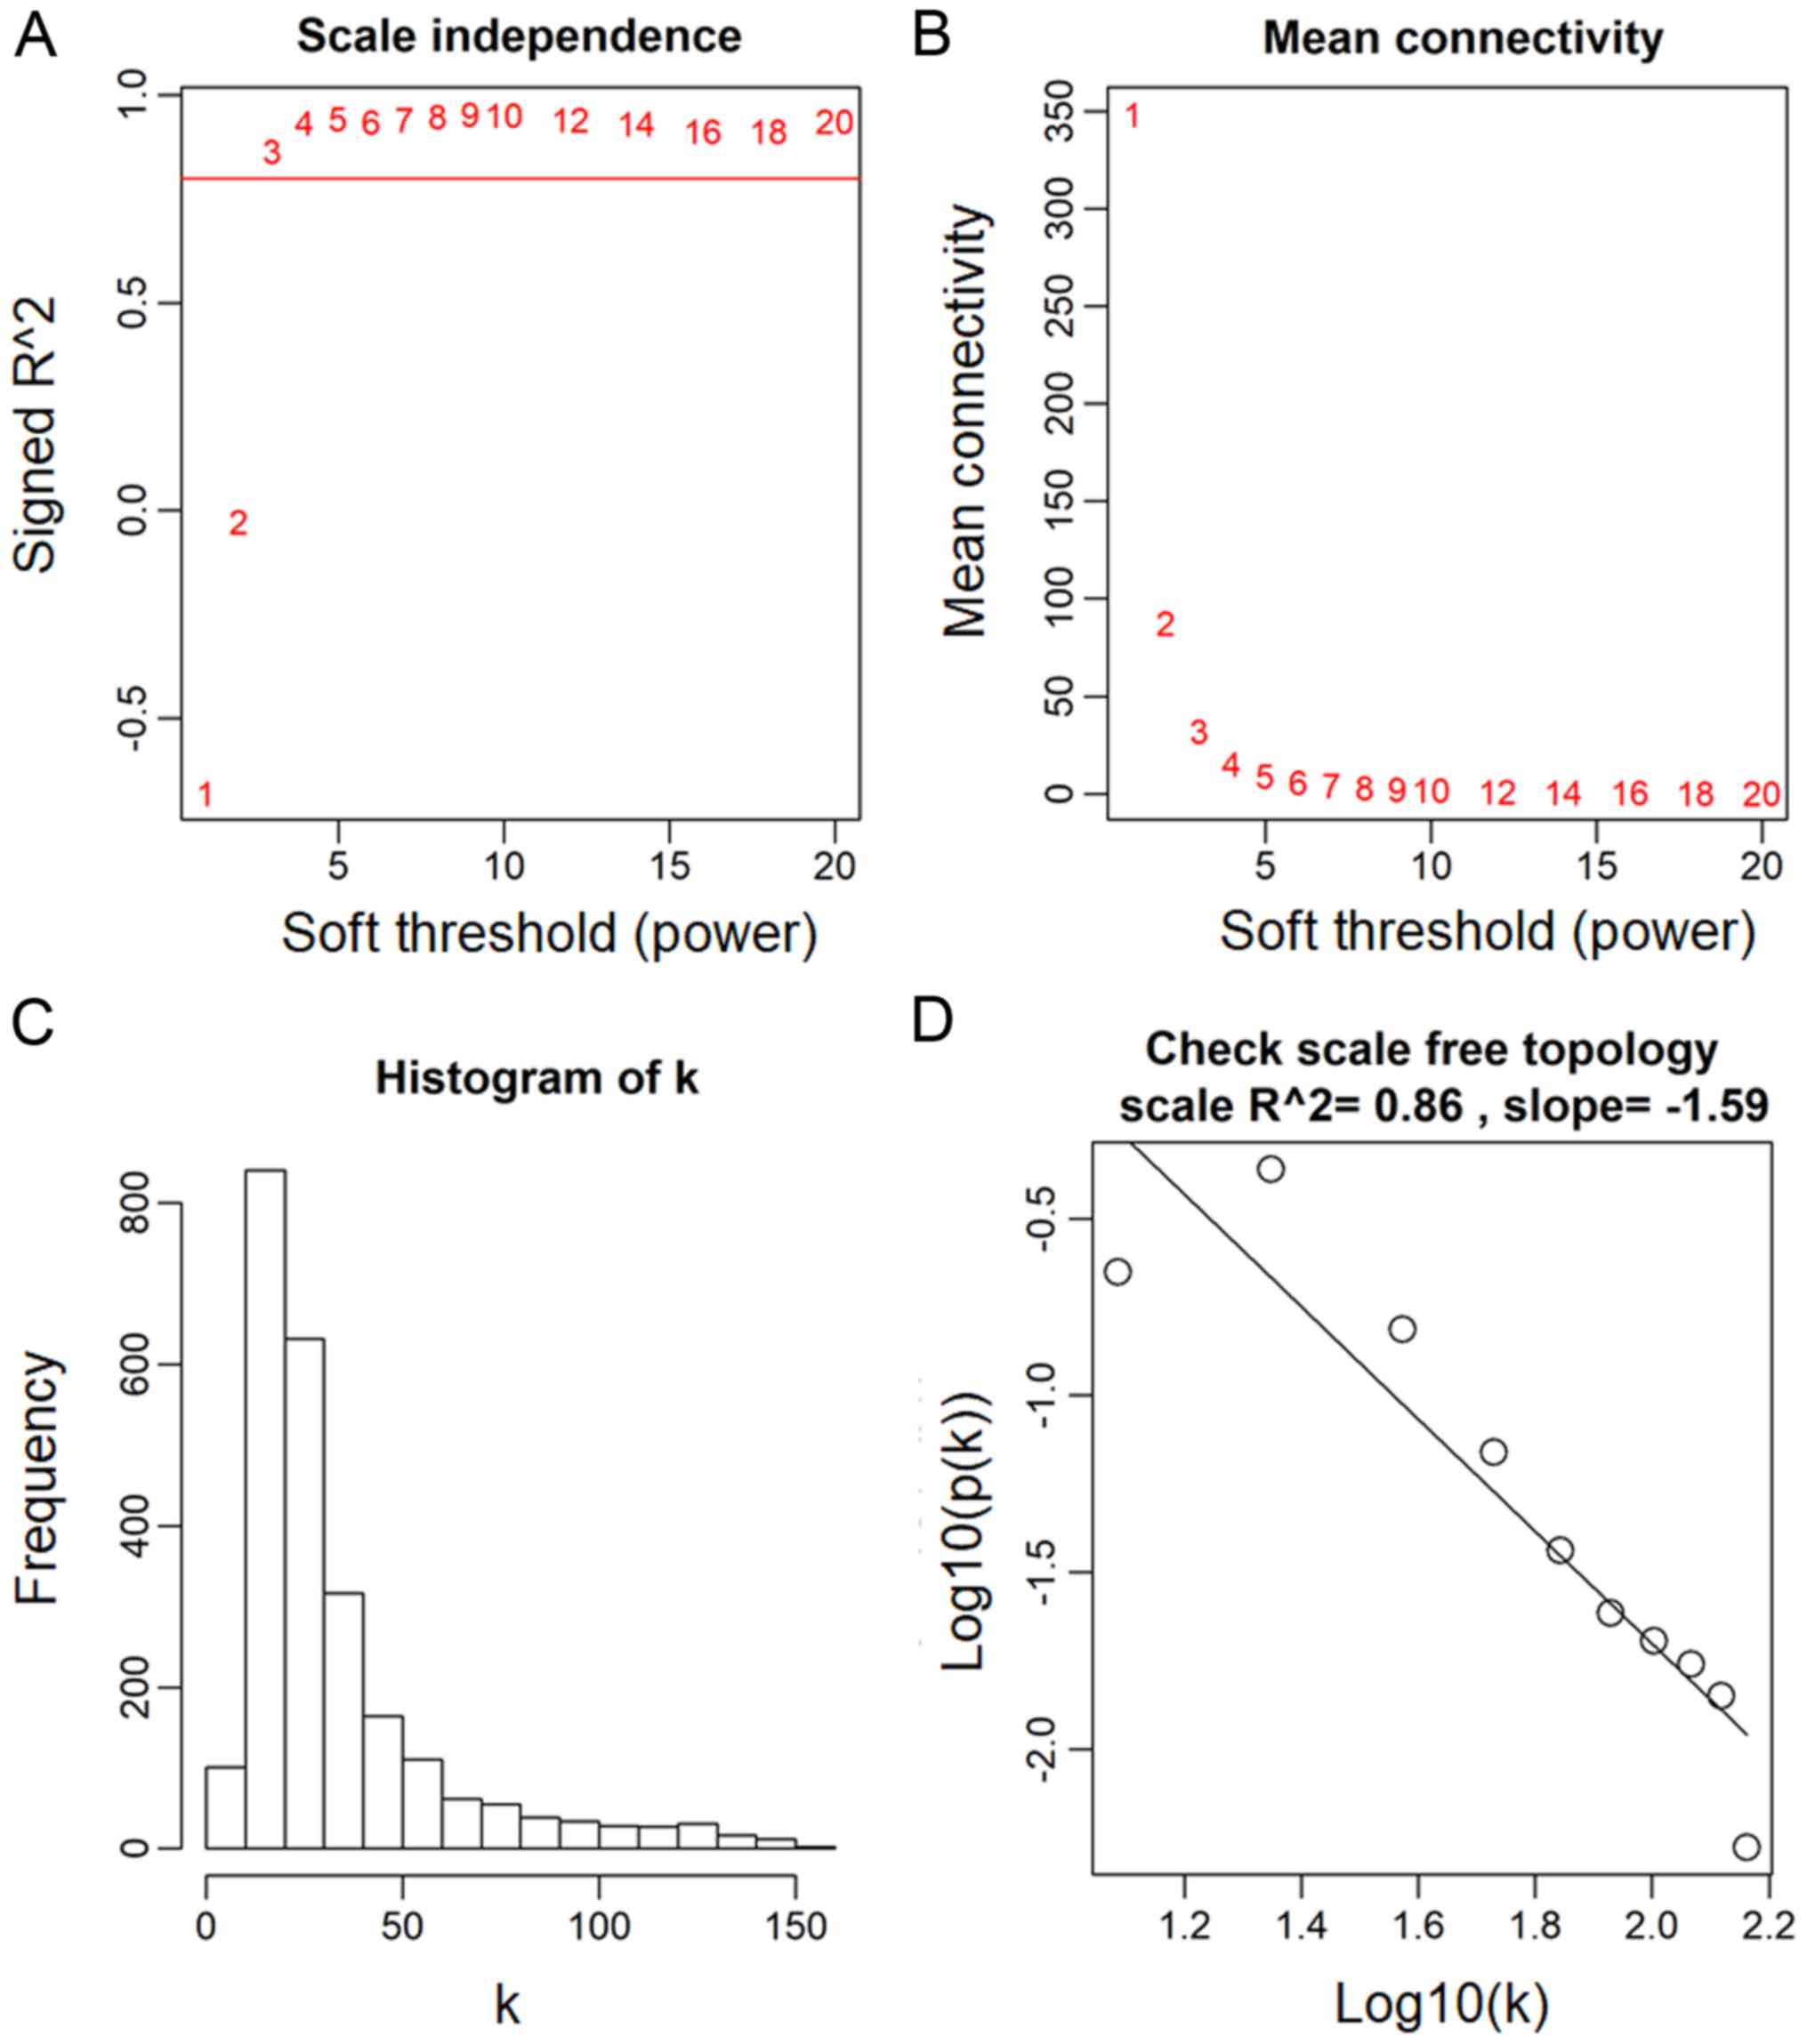
The power value, which primarily affects the
independence and the average connectivity degree of the
co-expression module of the most critical parameters in the
network, is considered an important parameter. Therefore, the power
value of the data was assessed (Fig.
2A). A power value of 3, indicated the independent degree was
up to 0.8 and the average connectivity degree was higher (Fig. 2B). The degree distribution of the
node and the fitting relationship between the node degree and its
corresponding proportion were calculated (Fig. 2C and D). The results revealed that
the constructed network was a scale-free network conforming to
biological characteristics. Therefore, a power value of 3 was used
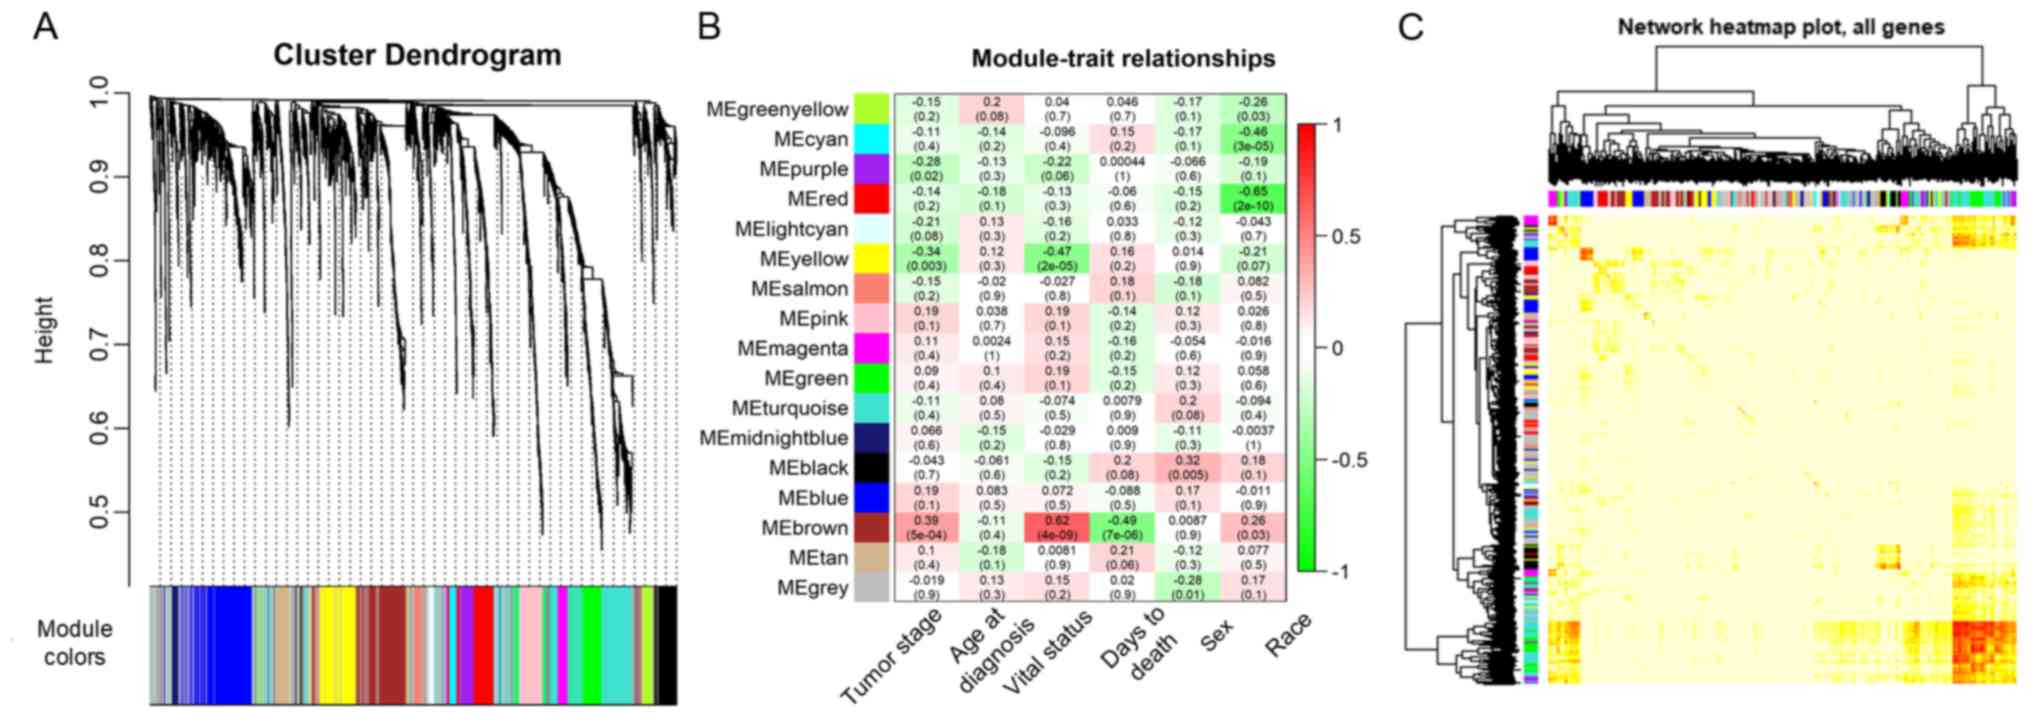
to construct the co-expression modules and the results generated 17
distinct gene co-expression modules in the ACC samples. These
co-expression modules were constructed and depicted in different
colors (Fig. 3A). They were arranged
from large to small by the number of genes they included and the
interactions of the 17 co-expression modules are shown in Fig. 3B.
Gene co-expression modules correspond
to clinic traits
The data on the clinical traits were obtained from
TCGA. The modules with common expression patterns that were
associated with certain traits were identified based on the
association between the module eigengene and the clinical traits
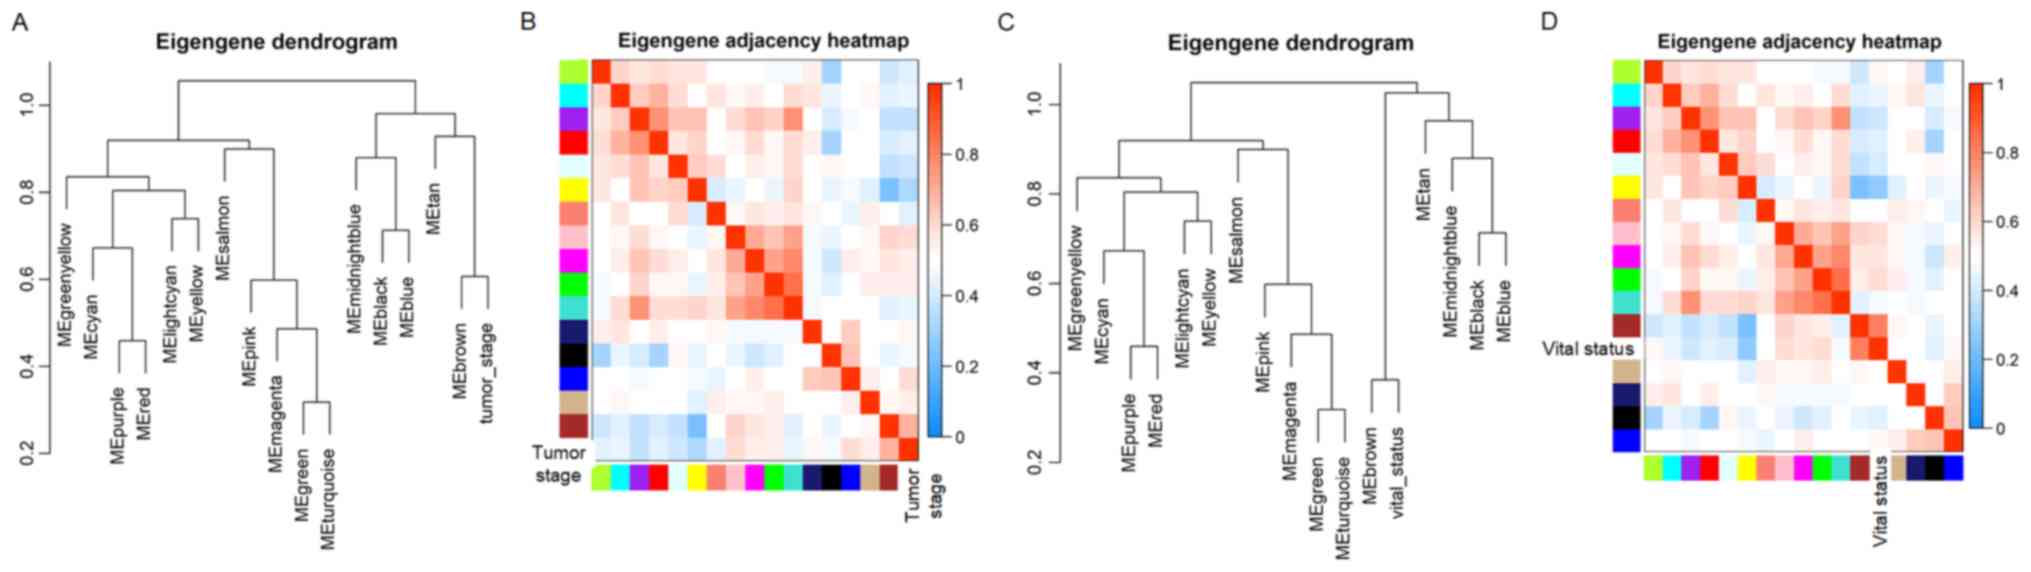
(Fig. 3C; Tables SI and SII). The dendrogram and heat map of the
eigengene were both used to identify groups of correlated
eigengenes and clinical characteristics. The brown module clustered
with two important clinical indexes, the tumor stage and vital
status (Fig. 4). Moreover, the
Pearson's correlation coefficient (PCC) between the yellow module
and the tumor stage is −0.34 (P=0.003), and the PCC between the
yellow module and the vital status is −0.47 (P=2×10−05).
Furthermore, the yellow module negatively correlated with these two
indexes, indicating that genes in this module may be associated
with the prognosis of patients (Fig.
3B). Therefore, both modules were defined as core modules for
further study.
GO and KEGG enrichment analysis of
genes in brown and yellow modules
The association between the genes and the clinical
characteristics were calculated along with the MM and GS, where MM
was the correlation of the gene expression profile with the
eigengenes and GS was the absolute value of the association between
the gene and the external traits. MMs and GSs with high thresholds
were chosen to avoid false positive prognostic genes, and the top
50% of genes in the brown and yellow modules were selected as
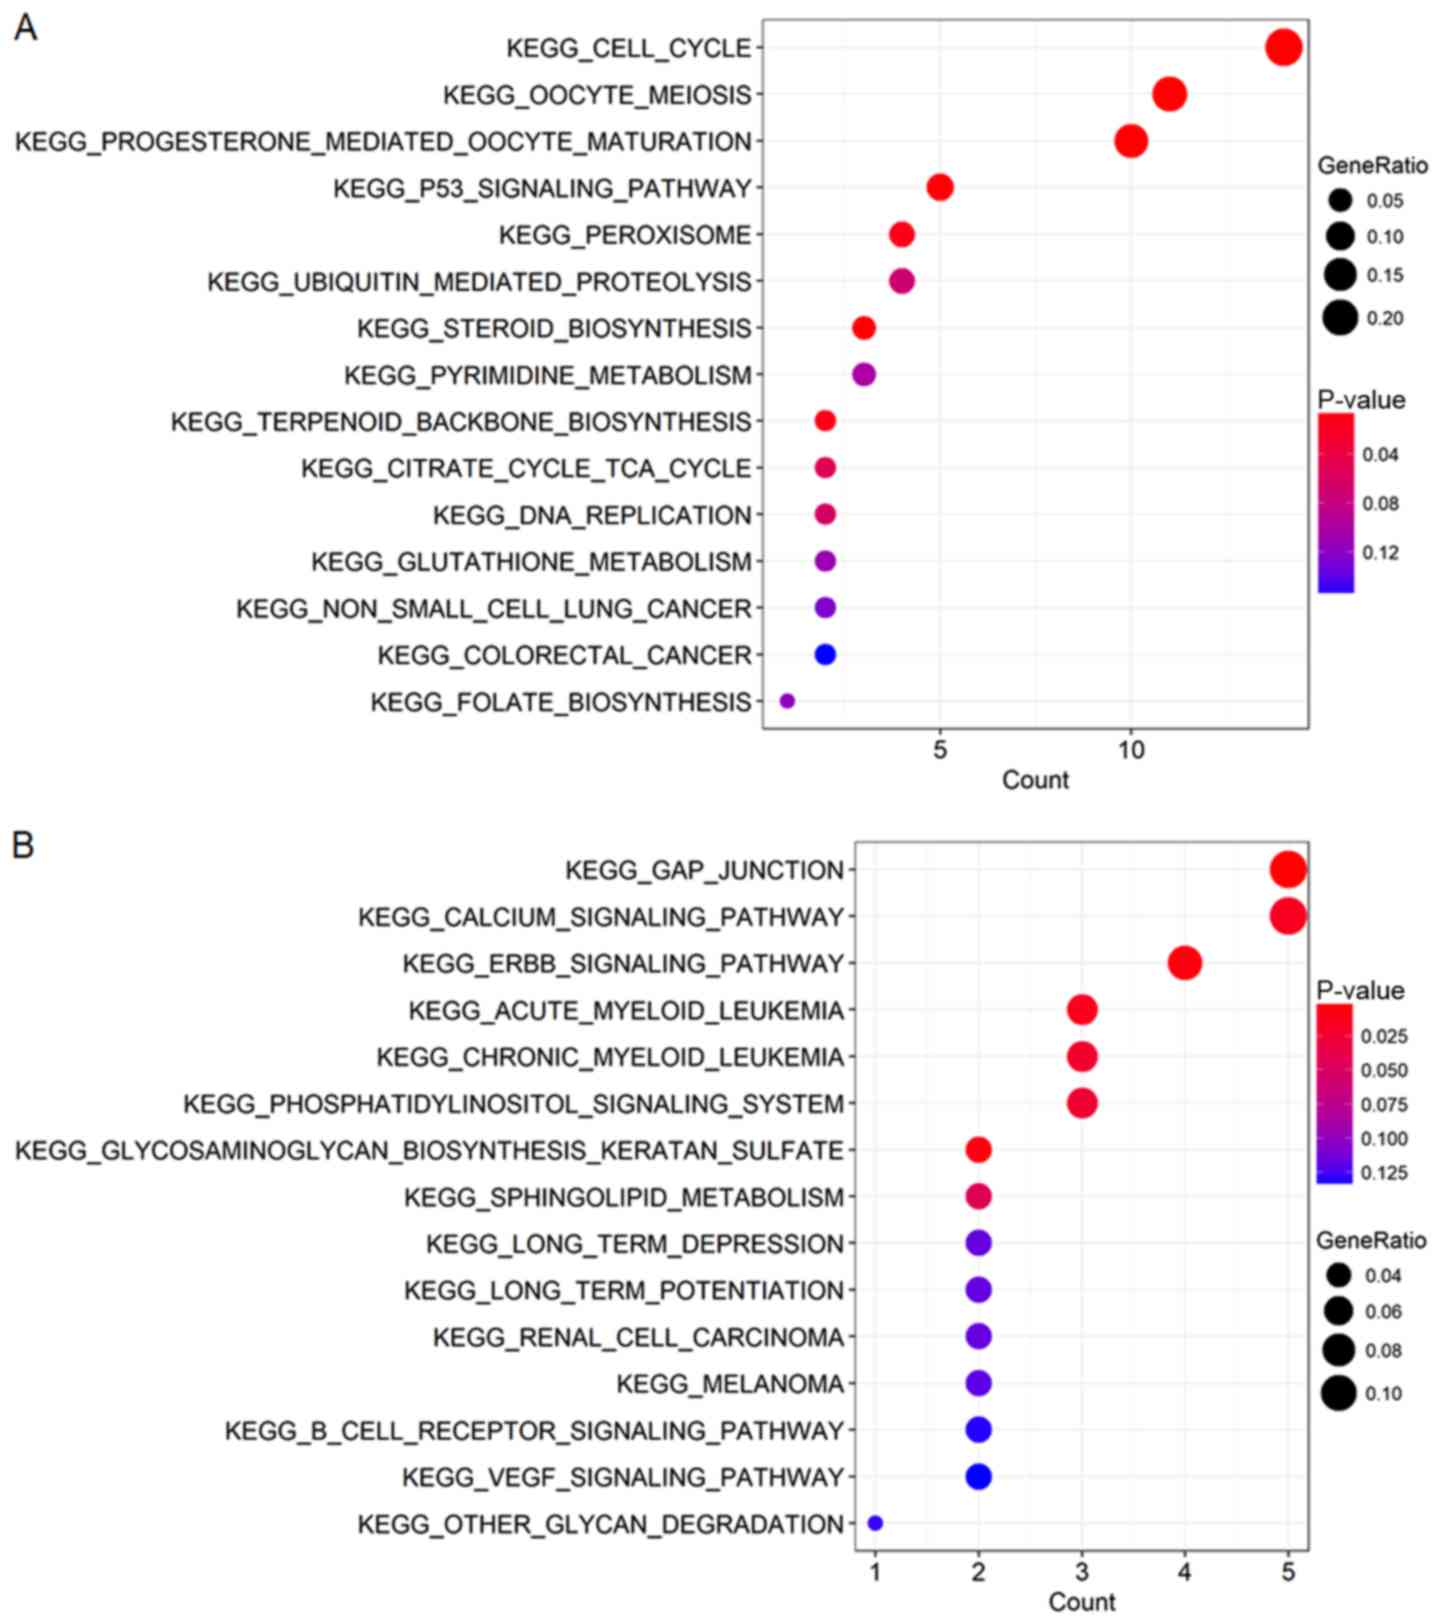
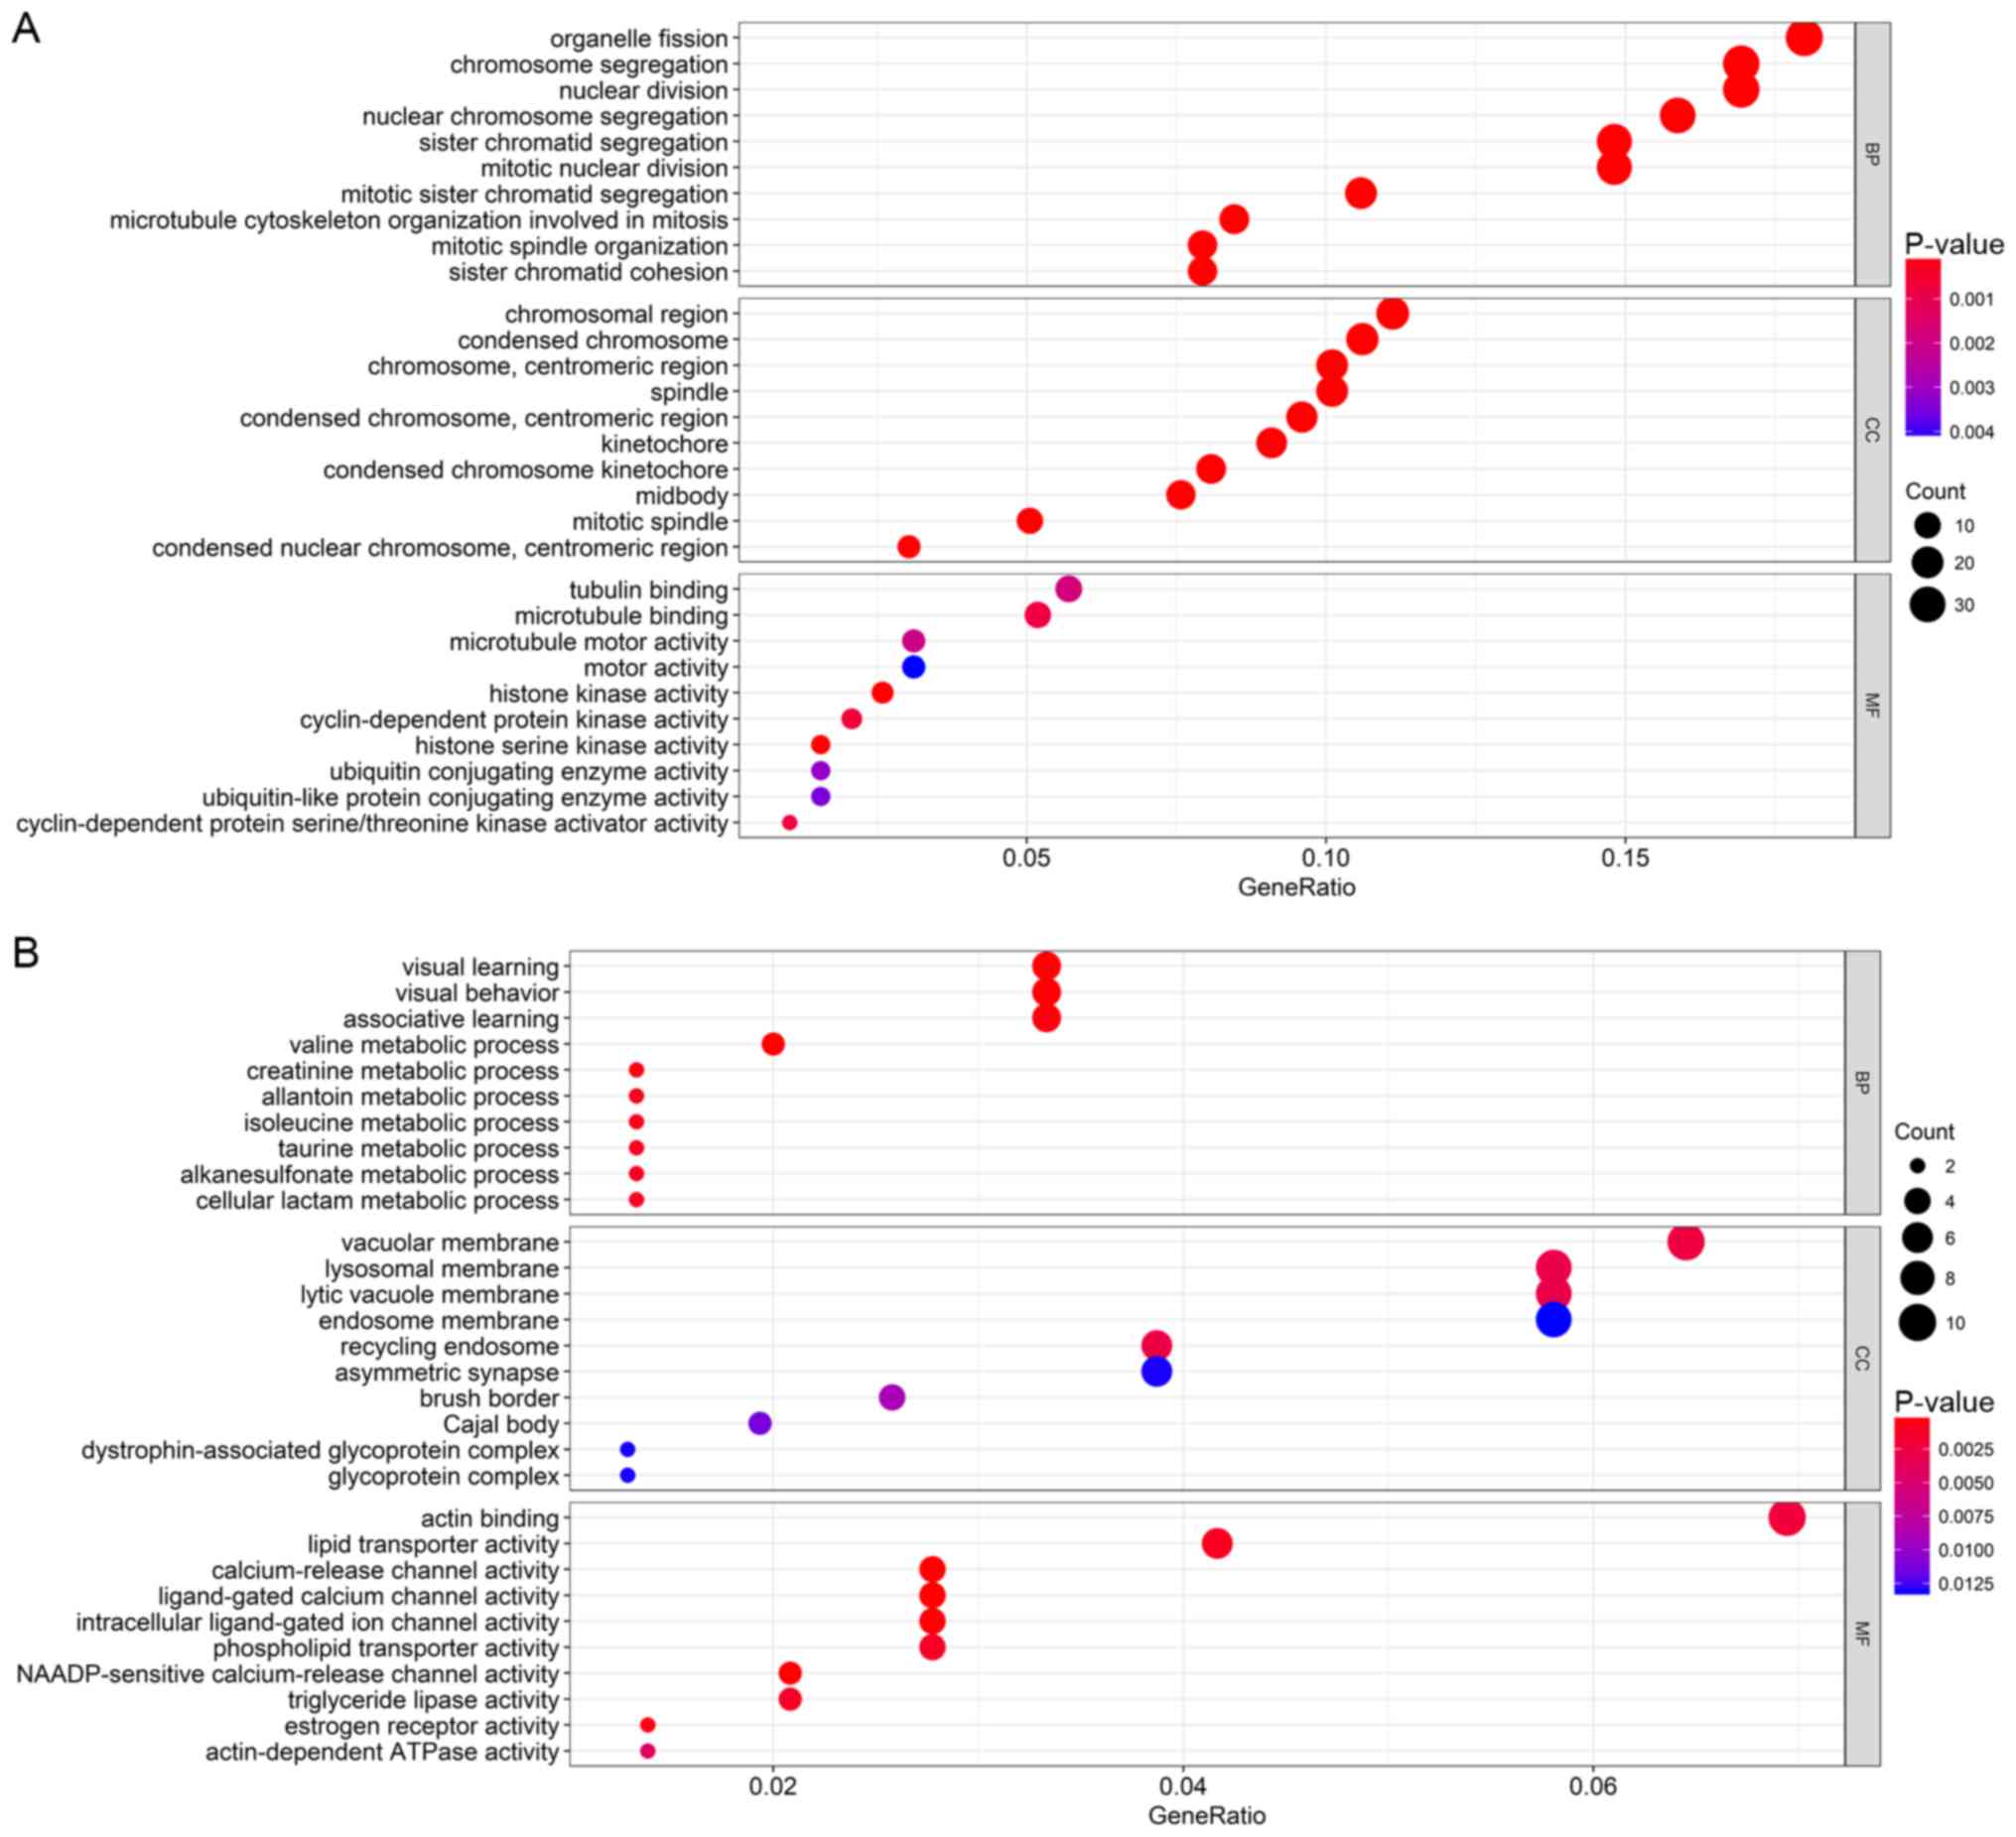
candidate genes. GO and KEGG analyses were performed to explore the
biological functions of the candidate genes in the brown and yellow
modules. All significant terms in the annotated systems were
represented as colored bars to compare the relative significance of
the enriched terms, where the length and color saturation of each
term were proportional to the gene count/ratio and the P-value
obtained from the enrichment analyses (Figs. 5 and 6). According to the results, GO enrichment
analysis indicated that the genes in the brown module were
primarily involved in cell division and protein kinase activity
(Fig. 6A), which was consistent with
the KEGG pathway enrichment results (Fig. 5A). For the yellow module, the genes
were enriched in various metabolic pathways in GO enrichment
analysis such as valine, creatinine and isoleucine metabolic
processes (Fig. 6B) and various
tumor-associated pathways including acute myeloid leukemia and
renal cell carcinoma in KEGG enrichment analysis (Fig. 5B).
PPI network-based prognostic gene
identification
The brown and yellow modules contained 214 and 168
genes, respectively. To identify the prognostic genes based on the
PPI network, the genes were mapped to the pre-built PPI network,
and the nodes that failed to map to the PPI network were ignored.
Cytoscape (V3.6.1) (32) software
was used to construct the module and to calculate the intramodular
connectivity. The intramodular connectivity was calculated for each
gene by the connection strength with other module genes and genes
with high intramodular connectivity were considered intramodular
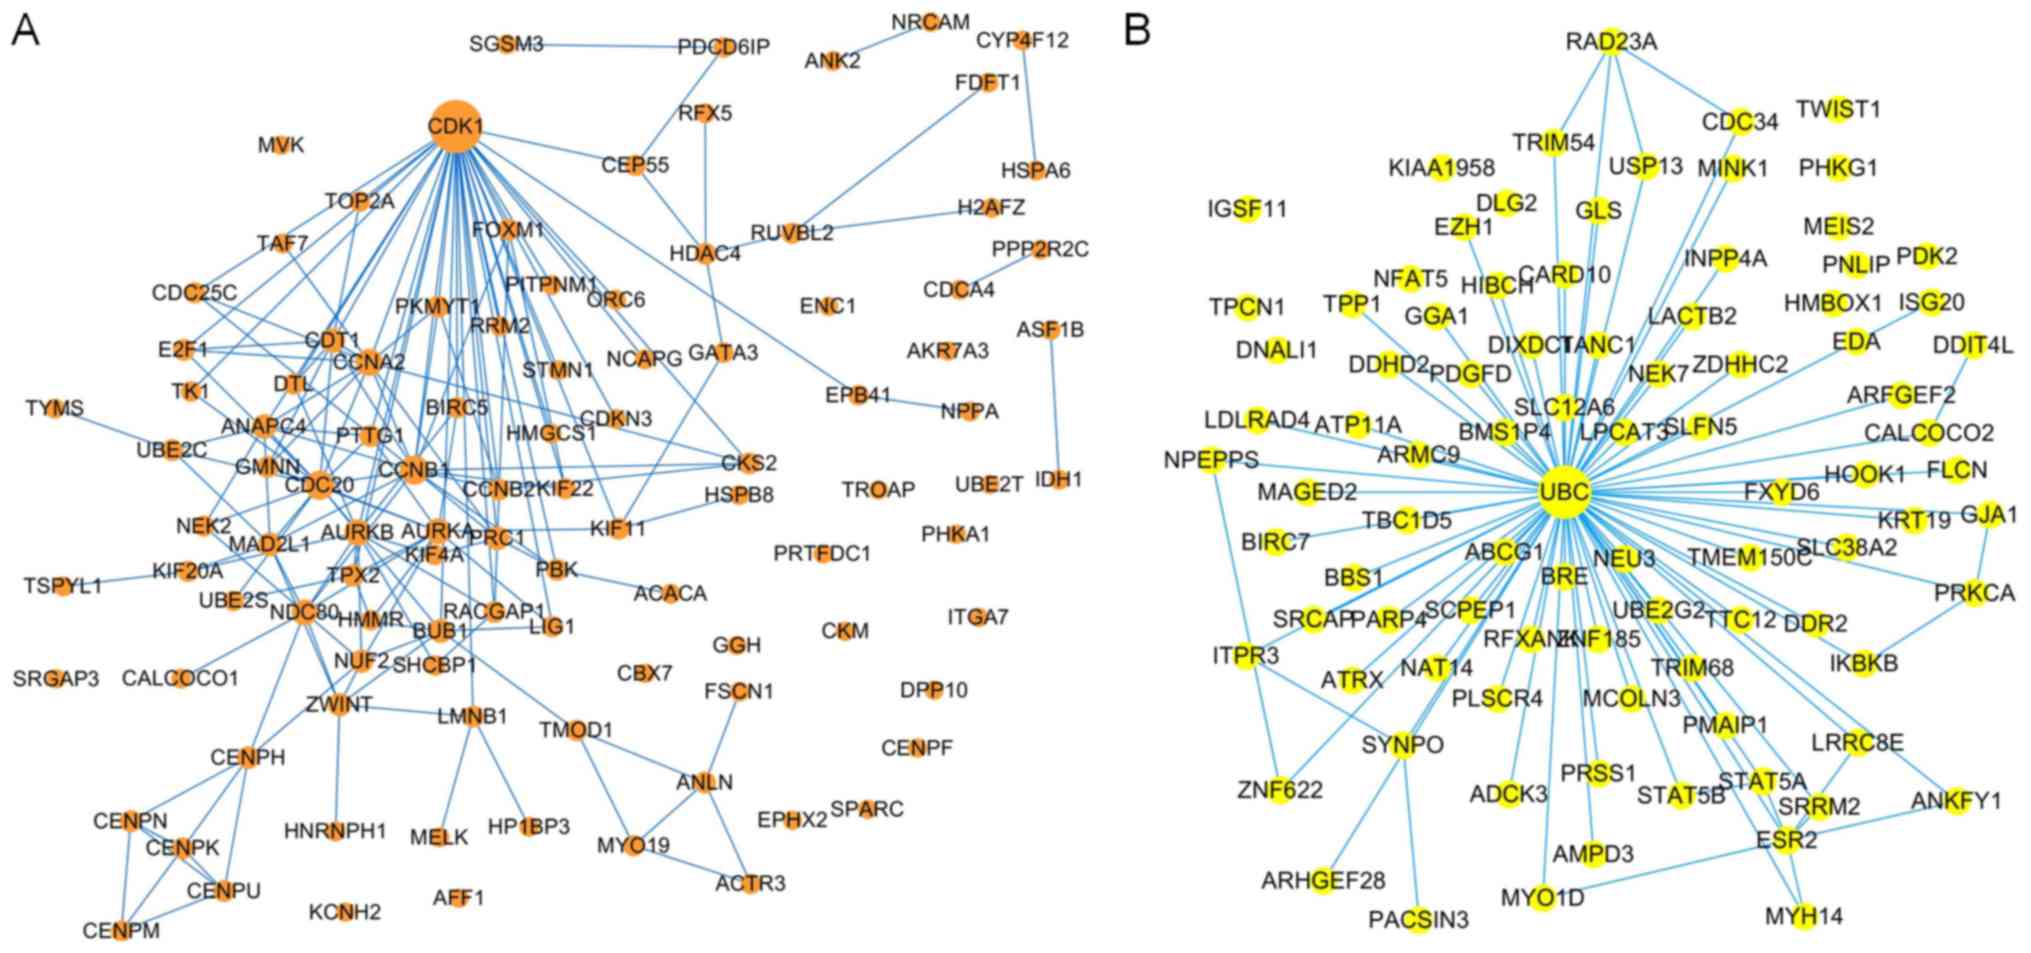
hub genes. The hub genes in the two modules are represented with
larger dots in Fig. 7. The brown
module subnetwork contained 105 nodes and 216 edges (Fig. 7A), whereas the yellow module
subnetwork contained 92 nodes and 126 edges (Fig. 7B).
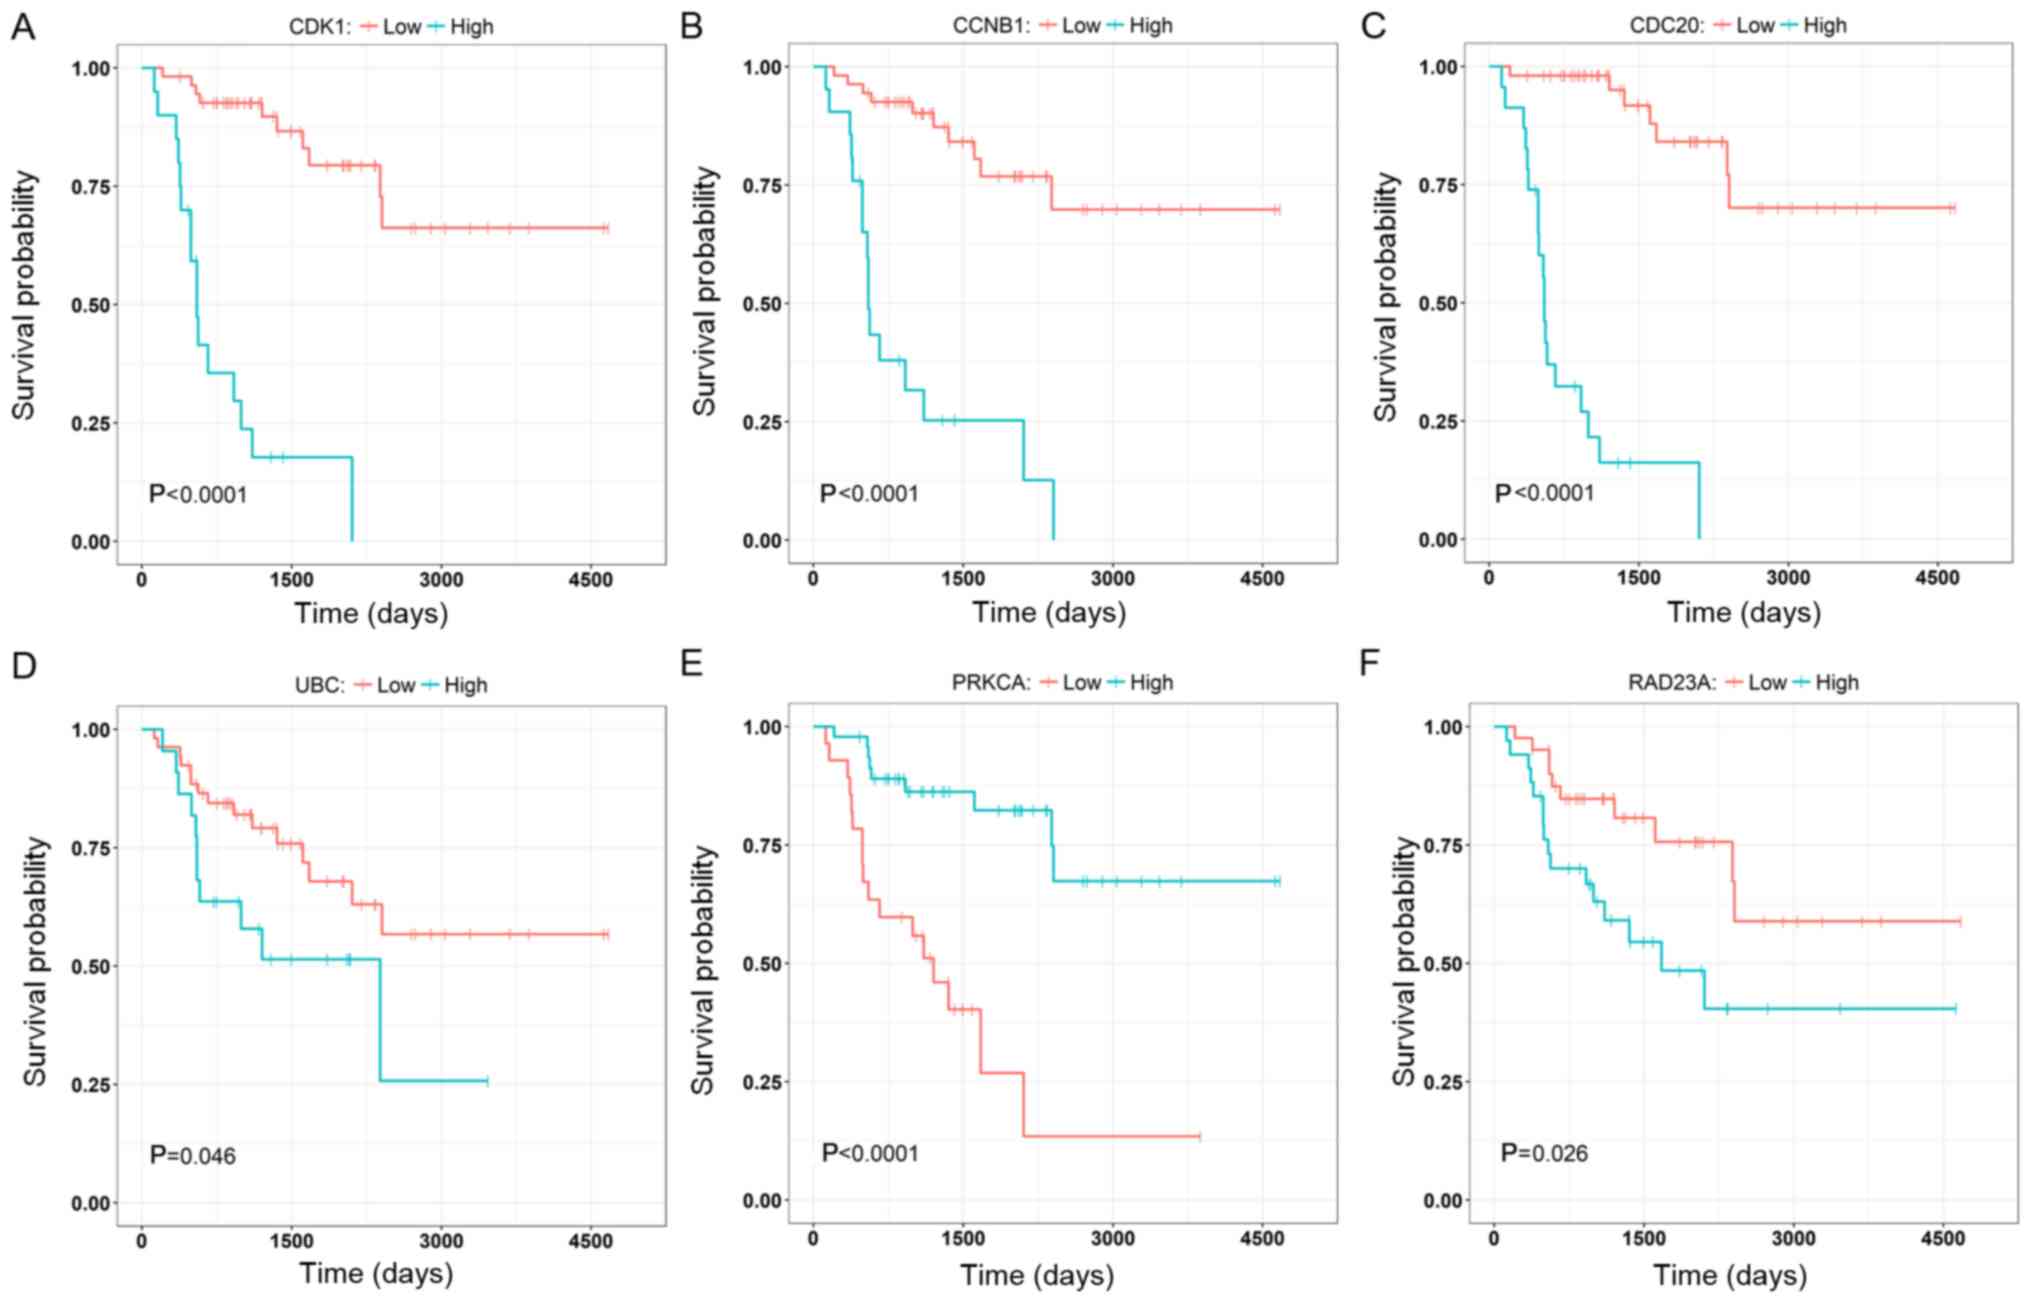
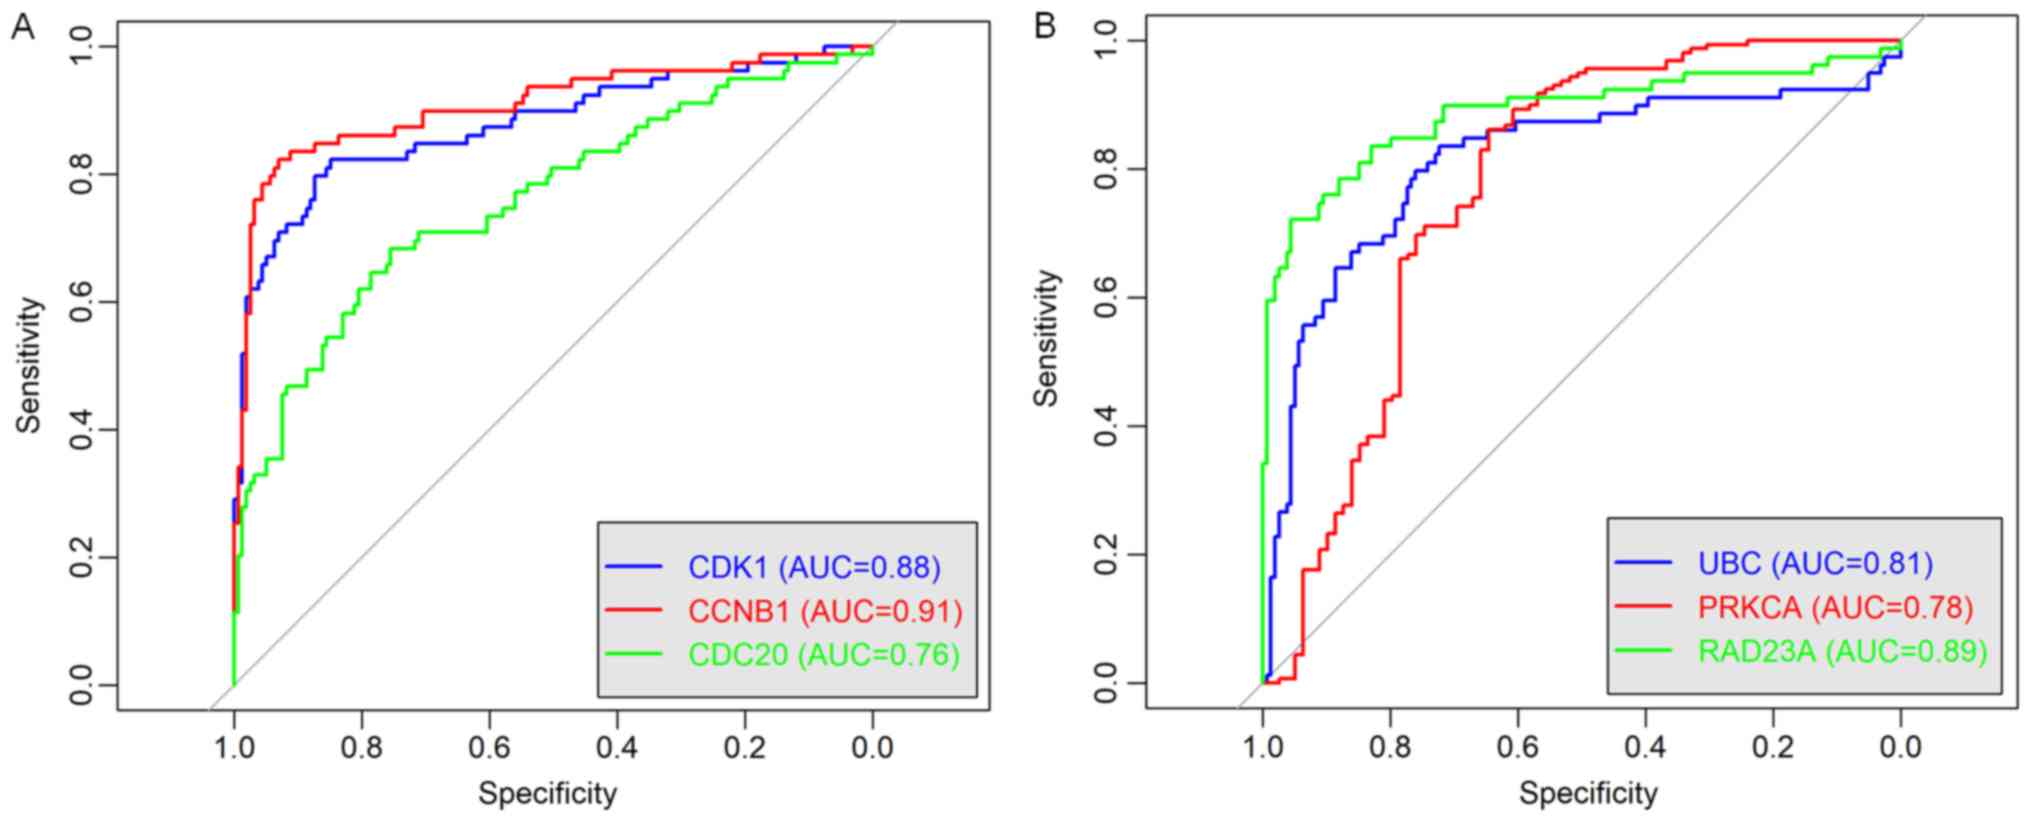
To further validate the results, three genes with
the highest degree, in the brown (CCNB1, CDC2 and CDK1) and the
yellow (PRKCA, RAD23A and UBC) modules were selected to investigate
their correlation with the overall survival of the patients
(Fig. 8). The nodes with the highest
degrees in the two modules were CDK1 and UBC, and their elevated
expression levels were significantly associated with poor overall
survival (P<0.0001; Fig. 8A and
D). Other genes (CCNB1, CDC2, PRKCA and RAD23A) were also
significantly associated with the overall survival and they may
serve as prognostic genes in ACC (Fig.
8B, C, E and F). The relationships between all nodes and the
overall survival were calculated (data not shown). In addition, as
shown in the Fig. 9, ROC curve
validated that the high degree gene in the brown module (Fig. 9A) and the yellow module (Fig. 9B) exhibited good diagnostic
efficiency for normal and tumor tissues.
Discussion
Compared with other methods such as differential
expression analysis, WGCNA places a focus on the association
between co-expression modules and clinical traits, and therefore,
the results that are considered more reliable yield relevant
biological significance (12). In
the present study, a total of 17 distinct gene co-expression
modules were identified from 79 patients with ACC by WGCNA to
determine the association between the transcriptome of patients
with ACC and the clinical traits. After examining the associations
between the modules and the clinical traits, two modules were
correlated with clinical traits. Several hub genes in the network
were identified which confirmed that CDK1 and UBC serve important
roles in the progression of ACC.
Early diagnosis and specific markers are important
for managing and limiting tumor development. Electrochemical
immunosensors have been developed to detect dehydroepiandrosterone
sulfate in blood plasma samples for early diagnosis of patients
with pediatric ACC (33). Mohan
et al (34) demonstrated that
evaluation of G0S2 hypermethylation identified a subgroup of
patients with ACC with a rapidly progressive disease course which
is feasible for clinical treatment options (34). Novel therapeutic regimens are
frequently based on specific gene or protein targets present in the
disease. Identification of programmed cell death protein 1 function
in T cells has improved the development of cancer immunotherapy
(35,36). The identification of potential
biomarkers in the present study may serve as novel targets for
drugs or in diagnostic methods clinically.
The power value was the most critical parameter
affecting the independence and the average connectivity degree of
the co-expression modules in WGCNA (10,37). A
higher average connectivity degree appeared when the power value
=3. The brown module clustered with tumor stage and vital status,
whereas the yellow module negatively correlated with these two
indices. The Tumor-Node-Metastasis classification system was used
in ACC staging and stage III ACC was characterized by infiltration
in the surrounding tissues (38,39). As
discussed above tumor stage and vital status were important
clinical parameters, and they may also reflect tumor prognosis
(40–42). Functional enrichment analysis for
candidate genes in the brown module showed that these genes were
primarily enriched in pathways associated with cell division.
Uncontrolled self-renewal capacity and aberrant regulation of
genetic material may promote tumor cell progression and recurrence
(43). Tripartite motif-containing
protein 3 (TRIM3) has been used as a tumor suppressor due to its
ability to regulate asymmetric cell division in glioblastoma and
expression of TRIM3 additionally attenuates the stem-like quality
of primary glioblastoma cultures (44). A combination of mitochondrial
division inhibitor 1 and platinum agents produced a synergistic
pro-apoptotic effect in drug-resistant tumor cells (45). These results indicate that cell
division is associated with tumor progression and genes in the
brown module may serve an important role in the regulation of cell
division in patients with ACC. Furthermore, genes in the yellow
module were primarily enriched in metabolic processes and lysosome
membrane-associated pathways, which may influence the T
cell-mediated immune response, tumor invasion, and malignancy
(46–48).
Cytoscape was used to construct a co-expression
network for the brown and yellow modules, and the genes with high
intramodular connectivity were considered as hub genes. The genes
with the highest degree of connectivity in the two modules were
CDK1 and UBC. CDK1 is a master regulator of the cell cycle and
overexpression of CDK1 increases the spheroid-forming ability of
tumor cells and the tumor-initiating capacity, whereas the
inhibition of CDK1 reduced these characteristics (49–51).
CDK1 was previously identified as a biomarker in patients with ACC
using PCR, western blotting and immunofluorescence by Xiao et
al (52). UBC is a highly
conserved protein which is involved in the selective proteolysis of
abnormal proteins (53). Hao et
al (54) identified UBC as a
differential node protein which may serve as a key regulator in the
response of non-small cell lung cancer A549 cells to phycocyanin
(54). Furthermore, knockdown of UBC
and UBB with mixed small hairpin RNAs suppressed the growth and
radio sensitivity of H1299 lung cancer cells (55). UBC was also associated with the
regulation of Toxoplasma gondii rhopty protein 18, which
serves a key regulatory role in cell immunity and apoptosis
(56). Survival analysis revealed
that increased expression of CDK1 and UBC resulted in poorer
overall survival of patients with ACC, which is consistent with
previous studies (49,50).
However, there were some limitations in the present
study. The finally identified hub genes in the network requires
experimental verification. At present, there are no studies
investigating the function of UBC in ACC, to the best of our
knowledge. Therefore, experiments based on clinical samples are
required to verify the results of the present study.
In conclusion, the brown and yellow modules were
identified as the most critical modules in the progression of ACC.
The hub genes CDK1 and UBC were the most significantly expressed
genes in the two modules, and they may serve as potential
diagnostic and prognostic biomarkers of patients with ACC in the
future. The selected candidate genes may serve as targets for the
development of novel therapeutics.
Supplementary Material
Supporting Data
Acknowledgements
Not applicable.
Funding
No funding was received.
Availability of data and materials
The datasets analyzed in the present study are
available in the The Cancer Genoma Atlas repository, (https://cancergenome.nih.gov/).
Authors' contributions
YZ designed the study. YZ and LJ developed the
methods. YZ collected the sample. YZ analyzed and interpreted the
data. YZ and LJ wrote, reviewed and revised the manuscript.
Ethics approval and consent to
participate
Not applicable.
Patient consent for publication
Not applicable.
Competing interests
The authors declare that they have no competing
interests.
References
|
1
|
Drenthen LCA, Roerink SHPP, Mattijssen V
and de Boer H: Bilaterally enlarged adrenal glands without obvious
cause: Need for a multidisciplinary diagnostic work-up. Clin Case
Rep. 6:729–734. 2018. View Article : Google Scholar : PubMed/NCBI
|
|
2
|
Mohan DR, Lerario AM and Hammer GD:
Therapeutic targets for adrenocortical carcinoma in the genomics
era. J Endocr Soc. 2:1259–1274. 2018. View Article : Google Scholar : PubMed/NCBI
|
|
3
|
Paragliola RM, Torino F, Papi G, Locantore
P, Pontecorvi A and Corsello SM: Role of mitotane in adrenocortical
carcinoma-review and state of the art. Eur Endocrinol. 14:62–66.
2018. View Article : Google Scholar : PubMed/NCBI
|
|
4
|
Fragni M, Fiorentini C, Rossini E, Fisogni
S, Vezzoli S, Bonini SA, Dalmiglio C, Grisanti S, Tiberio GAM,
Claps M, et al: In vitro antitumor activity of progesterone in
human adrenocortical carcinoma. Endocrine. 63:592–601. 2019.
View Article : Google Scholar : PubMed/NCBI
|
|
5
|
Breidbart E, Cameo T, Garvin JH, Hibshoosh
H and Oberfield SE: Pubertal outcome in a female with virilizing
adrenocortical carcinoma. J Pediatr Endocrinol Metab. 29:503–509.
2016. View Article : Google Scholar : PubMed/NCBI
|
|
6
|
Nikoleishvili D, Koberidze G, Kutateladze
M, Zumbadze G and Mariamidze A: Bilateral adrenocortical carcinoma:
Case report and review of literature. Georgian Med News. 19–24.
2018.PubMed/NCBI
|
|
7
|
Stigliano A, Cerquetti L, Lardo P,
Petrangeli E and Toscano V: New insights and future perspectives in
the therapeutic strategy of adrenocortical carcinoma (Review).
Oncol Rep. 37:1301–1311. 2017. View Article : Google Scholar : PubMed/NCBI
|
|
8
|
Megerle F, Herrmann W, Schloetelburg W,
Ronchi CL, Pulzer A, Quinkler M, Beuschlein F, Hahner S, Kroiss M
and Fassnacht M; German ACC Study Group, : Mitotane monotherapy in
patients with advanced adrenocortical carcinoma. J Clin Endocrinol
Metab. 103:686–1695. 2018. View Article : Google Scholar
|
|
9
|
Oddie PD, Albert BB, Hofman PL, Jefferies
C, Laughton S and Carter PJ: Mitotane in the treatment of childhood
adrenocortical carcinoma: A potent endocrine disruptor. Endocrinol
Diabetes Metab Case Rep 2018. (pii): EDM1800592018.
|
|
10
|
Langfelder P and Horvath S: WGCNA: An R
package for weighted correlation network analysis. BMC
Bioinformatics. 9:5592008. View Article : Google Scholar : PubMed/NCBI
|
|
11
|
Lin X, Li J, Zhao Q, Feng JR, Gao Q and
Nie JY: WGCNA Reveals Key Roles of IL8 and MMP-9 in progression of
involvement area in colon of patients with ulcerative colitis. Curr
Med Sci. 38:252–258. 2018. View Article : Google Scholar : PubMed/NCBI
|
|
12
|
Wan Q, Tang J, Han Y and Wang D:
Co-expression modules construction by WGCNA and identify potential
prognostic markers of uveal melanoma. Exp Eye Res. 166:13–20. 2018.
View Article : Google Scholar : PubMed/NCBI
|
|
13
|
Yang Q, Wang R, Wei B, Peng C, Wang L, Hu
G, Kong D and Du C: Candidate biomarkers and molecular mechanism
investigation for glioblastoma multiforme utilizing WGCNA. Biomed
Res Int 2018. 42467032018.
|
|
14
|
Ross JS, Wang K, Rand JV, Gay L, Presta
MJ, Sheehan CE, Ali SM, Elvin JA, Labrecque E, Hiemstra C, et al:
Next-generation sequencing of adrenocortical carcinoma reveals new
routes to targeted therapies. J Clin Pathol. 67:968–973. 2014.
View Article : Google Scholar : PubMed/NCBI
|
|
15
|
Papathomas TG, Duregon E, Korpershoek E,
Restuccia DF, van Marion R, Cappellesso R, Sturm N, Rossi G, Coli
A, Zucchini N, et al: Sarcomatoid adrenocortical carcinoma: A
comprehensive pathological, immunohistochemical, and targeted
next-generation sequencing analysis. Hum Pathol. 58:113–122. 2016.
View Article : Google Scholar : PubMed/NCBI
|
|
16
|
Gu Y, Gu W, Dou J, Lu Z, Ba J, Li J, Wang
X, Liu H, Yang G, Guo Q, et al: Diagnostic role of
prostate-specific membrane antigen in adrenocortical carcinoma.
Front Endocrinol (Lausanne). 10:2262019. View Article : Google Scholar : PubMed/NCBI
|
|
17
|
Romero Arenas MA, Whitsett TG, Aronova A,
Henderson SA, LoBello J, Habra MA, Grubbs EG, Lee JE, Sircar K,
Zarnegar R, et al: Protein expression of PTTG1 as a diagnostic
biomarker in adrenocortical carcinoma. Ann Surg Oncol. 25:801–807.
2018. View Article : Google Scholar : PubMed/NCBI
|
|
18
|
Duregon E, Volante M, Giorcelli J, Terzolo
M, Lalli E and Papotti M: Diagnostic and prognostic role of
steroidogenic factor 1 in adrenocortical carcinoma: A validation
study focusing on clinical and pathologic correlates. Hum Pathol.
44:822–828. 2013. View Article : Google Scholar : PubMed/NCBI
|
|
19
|
Ding M, Li F, Wang B, Chi G and Liu H: A
comprehensive analysis of WGCNA and serum metabolomics manifests
the lung cancer-associated disordered glucose metabolism. J Cell
Biochem. 120:10855–10863. 2019. View Article : Google Scholar : PubMed/NCBI
|
|
20
|
Tang Z, Li C, Kang B, Gao G, Li C and
Zhang Z: GEPIA: A web server for cancer and normal gene expression
profiling and interactive analyses. Nucleic Acids Res. 45:W98–W102.
2017. View Article : Google Scholar : PubMed/NCBI
|
|
21
|
Zheng S, Cherniack AD, Dewal N, Moffitt
RA, Danilova L, Murray BA, Lerario AM, Else T, Knijnenburg TA,
Ciriello G, et al: Comprehensive pan-genomic characterization of
adrenocortical carcinoma. Cancer cell. 29:723–736. 2016. View Article : Google Scholar : PubMed/NCBI
|
|
22
|
Gentleman RC, Carey VJ, Bates DM, Bolstad
B, Dettling M, Dudoit S, Ellis B, Gautier L, Ge Y, Gentry J, et al:
Bioconductor: Open software development for computational biology
and bioinformatics. 5:R802004.PubMed/NCBI
|
|
23
|
Colaprico A, Silva TC, Olsen C, Garofano
L, Cava C, Garolini D, Sabedot TS, Malta TM, Pagnotta SM,
Castiglioni I, et al: TCGAbiolinks: An R/Bioconductor package for
integrative analysis of TCGA data. Nucleic Acids Res. 44:e712016.
View Article : Google Scholar : PubMed/NCBI
|
|
24
|
Team RC, R, . A language and environment
for statistical computing. 2013.
|
|
25
|
Shi H, Zhang L, Qu Y, Hou L, Wang L and
Zheng M: Prognostic genes of breast cancer revealed by gene
co-expression network analysis. Oncol Lett. 14:4535–4542. 2017.
View Article : Google Scholar : PubMed/NCBI
|
|
26
|
Yu G, Wang LG, Han Y and He QY:
clusterProfiler: An R package for comparing biological themes among
gene clusters. OMICS. 16:284–287. 2012. View Article : Google Scholar : PubMed/NCBI
|
|
27
|
Cheng F, Desai RJ, Handy DE, Wang R,
Schneeweiss S, Barabási AL and Loscalzo J: Network-based approach
to prediction and population-based validation of in silico drug
repurposing. Nat Commun. 9:26912018. View Article : Google Scholar : PubMed/NCBI
|
|
28
|
Csardi G and Nepusz T: The igraph software
package for complex network 31. research. Inter Journal, Complex
Systems 1695. 1–9. 2006.
|
|
29
|
Collado-Torres L, Nellore A, Kammers K,
Ellis SE, Taub MA, Hansen KD, Jaffe AE, Langmead B and Leek JT:
Reproducible RNA-seq analysis using recount2. Nat Biotechnol.
35:319–321. 2017. View
Article : Google Scholar : PubMed/NCBI
|
|
30
|
Sing T, Sander O, Beerenwinkel N and
Lengauer T: ROCR: Visualizing classifier performance in R.
Bioinformatics. 21:3940–3941. 2005. View Article : Google Scholar : PubMed/NCBI
|
|
31
|
Langfelder P and Horvath S: Fast R
Functions for robust correlations and hierarchical clustering. J
Stat Softw. 46:1–17. 2012. View Article : Google Scholar : PubMed/NCBI
|
|
32
|
Shannon P, Markiel A, Ozier O, Baliga NS,
Wang JT, Ramage D, Amin N, Schwikowski B and Ideker T: Cytoscape: A
software environment for integrated models of biomolecular
interaction networks. Genome Res. 13:2498–2504. 2003. View Article : Google Scholar : PubMed/NCBI
|
|
33
|
Lima D, Inaba J, Clarindo Lopes L, Calaça
GN, Los Weinert P, Lenzi Fogaça R, Ferreira de Moura J, Magalhães
Alvarenga L, Cavalcante de Figueiredo B, Wohnrath K and Andrade
Pessôa C: Label-free impedimetric immunosensor based on arginine-
functionalized gold nanoparticles for detection of DHEAS, a
biomarker of pediatric adrenocortical carcinoma. Biosens
Bioelectron. 133:86–93. 2019. View Article : Google Scholar : PubMed/NCBI
|
|
34
|
Mohan DR, Lerario AM, Else T, Mukherjee B,
Almeida MQ, Vinco M, Rege J, Mariani BMP, Zerbini MCN, Mendonca BB,
et al: Targeted assessment of G0S2 methylation identifies a rapidly
recurrent, routinely fatal molecular subtype of adrenocortical
carcinoma. Clin Cancer Res. 125:3276–3288. 2019. View Article : Google Scholar
|
|
35
|
Ishida Y, Agata Y, Shibahara K and Honjo
T: Induced expression of PD-1, a novel member of the immunoglobulin
gene superfamily, upon programmed cell death. EMBO J. 11:3887–3895.
1992. View Article : Google Scholar : PubMed/NCBI
|
|
36
|
Ascierto PA, Capone M, Grimaldi AM,
Mallardo D, Simeone E, Madonna G, Roder H, Meyer K, Asmellash S,
Oliveira C, et al: Proteomic test for anti-PD-1 checkpoint blockade
treatment of metastatic melanoma with and without BRAF mutations. J
Immunother Cancer. 7:912019. View Article : Google Scholar : PubMed/NCBI
|
|
37
|
Liu X, Hu AX, Zhao JL and Chen FL:
Identification of key gene modules in human osteosarcoma by
co-expression analysis weighted gene co-expression network analysis
(WGCNA). J Cell Biochem. 118:3953–3959. 2017. View Article : Google Scholar : PubMed/NCBI
|
|
38
|
Grubbs E and Lee JE: Limited prognostic
value of the 2004 International Union Against Cancer staging
classification for adrenocortical carcinoma: Proposal for a revised
TNM classification. Cancer. 115:58482009. View Article : Google Scholar
|
|
39
|
Libe R: Adrenocortical carcinoma (ACC):
Diagnosis, prognosis, and treatment. Front Cell Dev Biol. 3:452015.
View Article : Google Scholar : PubMed/NCBI
|
|
40
|
Petru E, Huber C, Sampl E and Haas J:
Comparison of primary tumor size in stage I and III epithelial
ovarian cancer. Anticancer Res. 38:6507–6511. 2018. View Article : Google Scholar : PubMed/NCBI
|
|
41
|
Sylvestre E, Bouzille G, Breton M, Cuggia
M and Campillo-Gimenez B: Retrieving the vital status of patients
with cancer using online obituaries. Stud Health Technol Inform.
247:571–575. 2018.PubMed/NCBI
|
|
42
|
Roseweir AK, Kong CY, Park JH, Bennett L,
Powell AGMT, Quinn J, van Wyk HC, Horgan PG, McMillan DC, Edwards J
and Roxburgh CS: A novel tumor-based epithelial-to-mesenchymal
transition score that associates with prognosis and metastasis in
patients with Stage II/III colorectal cancer. Int J Cancer.
144:150–159. 2019. View Article : Google Scholar : PubMed/NCBI
|
|
43
|
Palm MM, Elemans M and Beltman JB:
Heritable tumor cell division rate heterogeneity induces clonal
dominance. PLoS Comput Biol. 14:e10059542018. View Article : Google Scholar : PubMed/NCBI
|
|
44
|
Chen G, Kong J, Tucker-Burden C, Anand M,
Rong Y, Rahman F, Moreno CS, Van Meir EG, Hadjipanayis CG and Brat
DJ: Human Brat ortholog TRIM3 is a tumor suppressor that regulates
asymmetric cell division in glioblastoma. Cancer Res. 74:4536–4548.
2014. View Article : Google Scholar : PubMed/NCBI
|
|
45
|
Qian W, Wang J, Roginskaya V, McDermott
LA, Edwards RP, Stolz DB, Llambi F, Green DR and Van Houten B:
Novel combination of mitochondrial division inhibitor 1 (mdivi-1)
and platinum agents produces synergistic pro-apoptotic effect in
drug resistant tumor cells. Oncotarget. 5:4180–4194. 2014.
View Article : Google Scholar : PubMed/NCBI
|
|
46
|
Noël G, Langouo Fontsa M and Willard-Gallo
K: The impact of tumor cell metabolism on T cell-mediated immune
responses and immuno-metabolic biomarkers in cancer. Semin Cancer
Biol. 52:66–74. 2018. View Article : Google Scholar : PubMed/NCBI
|
|
47
|
Herrero-Ruiz J, Mora-Santos M, Giráldez S,
Sáez C, Japón MA, Tortolero M and Romero F: βTrCP controls the
lysosome-mediated degradation of CDK1, whose accumulation
correlates with tumor malignancy. Oncotarget. 5:7563–7574. 2014.
View Article : Google Scholar : PubMed/NCBI
|
|
48
|
Dykes SS, Gao C, Songock WK, Bigelow RL,
Woude GV, Bodily JM and Cardelli JA: Zinc finger E-box binding
homeobox-1 (Zeb1) drives anterograde lysosome trafficking and tumor
cell invasion via upregulation of Na+/H+ Exchanger-1 (NHE1). Mol
Carcinog. 56:722–734. 2017. View Article : Google Scholar : PubMed/NCBI
|
|
49
|
Ravindran Menon D, Luo Y, Arcaroli JJ, Liu
S, KrishnanKutty LN, Osborne DG, Li Y, Samson JM, Bagby S, Tan AC,
et al: CDK1 interacts with Sox2 and promotes tumor initiation in
human melanoma. Cancer Res. 78:6561–6574. 2018. View Article : Google Scholar : PubMed/NCBI
|
|
50
|
Warfel NA, Dolloff NG, Dicker DT, Malysz J
and El-Deiry WS: CDK1 stabilizes HIF-1α via direct phosphorylation
of Ser668 to promote tumor growth. Cell Cycle. 12:3689–3701. 2013.
View Article : Google Scholar : PubMed/NCBI
|
|
51
|
Zeng Y, Stauffer S, Zhou J, Chen X, Chen Y
and Dong J: Cyclin-dependent kinase 1 (CDK1)-mediated mitotic
phosphorylation of the transcriptional co-repressor Vgll4 inhibits
its tumor-suppressing activity. J Biol Chem. 292:15028–15038. 2017.
View Article : Google Scholar : PubMed/NCBI
|
|
52
|
Xiao H, Xu D, Chen P, Zeng G, Wang X and
Zhang X: Identification of five genes as a potential biomarker for
predicting progress and prognosis in adrenocortical carcinoma. J
Cancer. 9:4484–4495. 2018. View Article : Google Scholar : PubMed/NCBI
|
|
53
|
Eichner R, Fernández-Sáiz V, Targosz BS
and Bassermann F: Cross talk networks of mammalian target of
rapamycin signaling with the ubiquitin proteasome system and their
clinical implications in multiple myeloma. Int Rev Cell Mol Biol.
343:219–297. 2019. View Article : Google Scholar : PubMed/NCBI
|
|
54
|
Hao S, Li S, Wang J, Zhao L, Yan Y, Cao Q,
Wu T, Liu L and Wang C: Transcriptome analysis of
phycocyanin-mediated inhibitory functions on non-small cell lung
cancer A549 cell growth. Mar Drugs. 16(pii): E5112018. View Article : Google Scholar : PubMed/NCBI
|
|
55
|
Tang Y, Geng Y, Luo J, Shen W, Zhu W, Meng
C, Li M, Zhou X, Zhang S and Cao J: Downregulation of ubiquitin
inhibits the proliferation and radioresistance of non-small cell
lung cancer cells in vitro and in vivo. Sci Rep. 5:94762015.
View Article : Google Scholar : PubMed/NCBI
|
|
56
|
Xia J, Kong L, Zhou LJ, Wu SZ, Yao LJ, He
C, He CY and Peng HJ: Genome-wide bimolecular fluorescence
complementation-based proteomic analysis of Toxoplasma gondii
ROP18's human interactome shows its key role in regulation of cell
immunity and apoptosis. Front Immunol. 9:612018. View Article : Google Scholar : PubMed/NCBI
|