Introduction
Epithelial ovarian cancer (EOC) has the highest
mortality rate among gynecological malignancies, and remains the
most lethal type that threatens the life and health of females
(1,2). The majority of patients with EOCs are
diagnosed at an advanced stage of the disease (3–6), and
numerous studies have demonstrated that the outcome of patients
with EOC depends on the tumor grade (7). Following surgery and platinum-based
combination chemotherapy, the recurrence rate of low-grade EOCs
(LG-EOCs) was lower and the survival rate was higher compared with
high-grade EOCs (HG-EOCs) (8).
Therefore, the EOC grade is considered to serve as a distinctive
risk factor. At present, the assessment of grade in EOC samples is
based on a dualistic classification system proposed by Shih Ie and
Kurman in 2004 (9). EOC is divided
into types I and II; type I (low-grade) EOC presents with a good
prognosis; however, it is unresponsive to chemotherapy. Type II
(high-grade) EOC has a poor prognosis, yet it is sensitive to
chemotherapy (9). The evaluation of
ovarian cancer grade currently relies solely on clinicopathological
parameters; a molecular standard for diagnosis is yet to be
established (10). Therefore,
identifying effective biomarkers associated with the EOC grade is
of clinical significance for developing effective therapeutic
strategies for patients with EOC, and may contribute to the
prediction of prognosis.
Gene microarrays are valued for their strong
application prospects, as they can monitor expression levels of
thousands of genes simultaneously. At present, due to the
publication of gene microarray information, an increasing number of
researchers are devoted to exploring unknown mechanisms with this
methodology. However, limited sample sizes, different microarray
platforms and different statistical methods are limitations of this
approach (11). Bioinformatics
analysis may be conducted to overcome these drawbacks.
In the past decades, several studies investigated
dysregulated genes and their potential functions in EOC (12,13).
However, to the best of our knowledge, few studies investigating
molecular biomarkers associated with EOCs grade have been reported.
Therefore, there is a requirement for the identification of
reliable biomarkers to distinguish between LG-EOCs and HG-EOCs. The
present study used bioinformatics methods to investigate and
identify differentially expressed genes in different EOC
grades.
Materials and methods
Microarray datasets filtering
To analyze the differentially expressed genes
between HG-EOCs and LG-EOCs, EOC datasets were downloaded from the
Gene Expression Omnibus (GEO; http://www.ncbi.nlm.nih.gov/geo/) database, using the
keywords ‘ovarian cancer’ and ‘GPL570’. Subsequently, four public
microarray datasets, including GSE26193 (14), GSE63885 (15), GSE30161 (16) and GSE9891 (17), were selected based on the following
criteria (11): i) Expression
profiling by array; ii) samples obtained from from Homo
sapiens; iii) availability of raw CEL files; iv) GPL570
platforms; and v) EOC samples associated with EOC grades. As a
result, the GSE26193, GSE63885, GSE30161 and GSE9891 datasets,
consisting of 107, 80, 54 and 280 EOC samples associated with EOC
grades, respectively, were included in the present study. The
GSE26193 dataset consisted of 40 LG-EOCs and 67 HG-EOCs samples,
GSE63885 contained 10 LG-EOCs and 70 HG-EOCs samples, GSE30161
included 21 LG-EOCs and 33 HG-EOCs samples, and GSE9891 was
composed of 119 LG-EOCs and 161 HG-EOCs samples.
Data analysis
The publicly available raw CEL files downloaded from
the GEO database pre-treated by robust multichip average (RMA)
analysis in the affy package (version 3.9; http://www.bioconductor.org/packages/release/bioc/html/affy.html).
In order to analyze dysregulated genes in each dataset, the limma
package (version 3.9; http://bioconductor.org/packages/release/bioc/html/limma.html)
was used. The upregulated or downregulated probes, where P<0.05
and log2 fold change (FC)>1 (upregulated genes) or
<-1(downregulated genes), were listed. Venn diagrams
(bioinfogp.cnb.csic.es/tools/venny) were used to analyze the
consistently differentially expressed genes in the datasets in the
present study. To further expand the sample size, the
InSilicoMerging (18) approach was
used to merge the normalized datasets selected for inclusion in the
current study and the ‘RankProd’ (19) approach was applied to identify the
dysregulated genes in the merged datasets.
Gene enrichment analysis of
dysregulated genes
Gene Ontology analysis for the list of
differentially expressed genes identified by RankProd was performed
to identify their prevalence in biological processes and in
molecular functions and pathways, using the Database for
Annotation, Visualization and Integrated Discovery (DAVID
Bioinformatics Resources; version 6.8; http://david.ncifcrf.gov) (20). The ggplot2 package (21) was used to visualize the main
functional pathways of dysregulated genes.
Tissue sample collection
A total of 82 EOC tissue samples (including 36
LG-EOCs and 46 HG-EOCs) were collected from patients with an age
range of 35–73 years who had received surgery at The First
Affiliated Hospital of Nanjing Medical University (Nanjing, China)
between July 2011 to December 2018. The resected tissues were
assessed by histological analysis. The patients enrolled had been
histopathologically diagnosed with primary ovarian cancer, and had
not received any other treatment prior to surgical resection. The
tissue samples were immediately stored at −80°C until subsequent
analysis. Patients were followed up every 3 months after surgery,
during which no patients were lost to follow-up. The follow-up
information was recorded comprehensively. Written informed consent
for the collection and analysis of tissue specimens in the present
study was obtained from every patient; the study was approved by
the Research Ethics Committee of Nanjing Medical University. The
clinical and pathological characteristics of the patients with EOC
are presented in Table I.
 | Table I.Association between CTCFL expression
and clinical pathological characteristics of patients with
epithelial ovarian cancer (n=82). |
Table I.
Association between CTCFL expression
and clinical pathological characteristics of patients with
epithelial ovarian cancer (n=82).
|
|
| CTCFL
expression |
|
|---|
|
|
|
|
|
|---|
| Clinicopathological
feature | Number of
cases | Low (n=41) | High (n=41) | P-value |
|---|
| Age (years) |
|
|
| 0.2672 |
|
<50 | 37 | 16 | 21 |
|
|
≥50 | 45 | 25 | 20 |
|
| Histological
subtype |
|
|
| 0.1052 |
|
Serous | 71 | 33 | 38 |
|
|
Others | 11 | 8 | 3 |
|
| Tumor size
(cm) |
|
|
| 0.0344a |
|
<8 | 27 | 18 | 9 |
|
| ≥8 | 55 | 23 | 32 |
|
| FIGO stage |
|
|
| 0.0343a |
|
I–II | 13 | 10 | 3 |
|
|
III–IV | 69 | 31 | 38 |
|
| Histological
grade |
|
|
| 0.0004a |
|
Low-grade | 36 | 26 | 10 |
|
|
High-grade | 46 | 15 | 31 |
|
| Lymph node
metastasis |
|
|
| 0.3769 |
|
Absent | 40 | 18 | 22 |
|
|
Present | 42 | 23 | 19 |
|
| Ascites |
|
|
| 0.1109 |
|
Absent | 31 | 12 | 19 |
|
|
Present | 51 | 29 | 22 |
|
RNA isolation and
reverse-transcription polymerase chain reaction (RT-qPCR)
Total RNA in the EOC tissues was extracted by
TRIzol® reagent (Invitrogen, CA, USA) according to the
manufacturer's protocol. The cDNA reactions prepared using the
reverse transcriptase kit (Takara Bio, Inc.) according to the
manufacturer's protocol. The mRNA expression of CCCTC-binding
factor like (CTCFL) was detected using a standard SYBR Green permix
Ex Taq kit (Takara Bio, Inc.) on the 7900 HT real-time instrument
(Applied Biosytems; Thermo Fisher Scientific, Inc.). The
amplification of CTCFL was performed with an initial step at 94°C
for 30 sec, followed by 40 cycles of denaturation at 95°C for 5
sec, annealing at 60°C for 30 sec, and extension at 95°C for 15
sec. The sequences of the primers used were as follows: CTCFL
forward, 5′-GTACTCCCCGCAAGAGATGG-3′ and reverse,
5′-TCACCGCTAACTTACTGTCTTCA-3′; and GAPDH forward,
5′-CCCACTCCTCCACCTTTGAC-3′ and reverse,
5′-GGATCTCGCTCCTGGAAGATG-3′. CTCFL mRNA levels were quantified
using the 2−ΔΔCq method and normalized to GAPDH
(22).
Immunohistochemical analysis
Immunohistochemical analysis was performed to detect
CTCFL protein expression in the tissue specimens. Analysis revealed
that CTCFL was the most upregulated gene in the four datasets and
was subsequently selected for immunohistochemical analysis.
Briefly, paraffin-embedded tissue blocks were cut into 4-µm thick
sections and then placed in a constant temperature box at 65°C for
30 min to deparaffinize. The sections were submerged in the
ethylenediaminetetraacetic acid buffer and microwaved for 8 min for
antigenic retrieval. 3% hydrogen peroxide in methanol was used to
quench the endogenous peroxidase activity. Then 1% goat serum
albumin (Abcam) was incubated at room temperature for 5 min to
block nonspecific binding. The sections were subsequently stained
with an anti-BORIS (CTCFL) primary antibody (1:200; cat. no.
ab187163; Abcam) and incubated overnight at 4°C, and horseradish
peroxidase-conjugated goat anti-rabbit IgG secondary antibody
(1:1,000; cat. no. ab6721; Abcam) were then incubated at room
temperature for 1 h. Finally, images were captured using a
high-capacity digital slide scanner (Pannoramic SCAN, 3DHISTECH) at
×200 magnification. The sections were evaluated independently by
two experienced pathologists. A total of 12 patients with paired
serous ovarian cancer patients, were selected from patients
enrolled in our study to conduct this experiment.
Statistical analysis
SPSS software (version 18.0; SPSS, Inc., Chicago,
IL, USA) and GraphPad Prism software (version 5; GraphPad Software,
Inc., La Jolla, CA, USA) were used for all statistical analysis.
Data are presented as the mean ± standard error of mean (SEM). The
differences between groups were analyzed by the Student's t-test.
For the analysis on the clinicopathological parameters,
χ2 test and Fisher exact probability method were
applied. And Kaplan-Meier analysis and the log-rank test were used
for survival analysis. P<0.05 was considered to indicate a
statistically significant difference. All experiments were repeated
in triplicate.
Results
Dysregulated genes between high-and
low-grade EOC
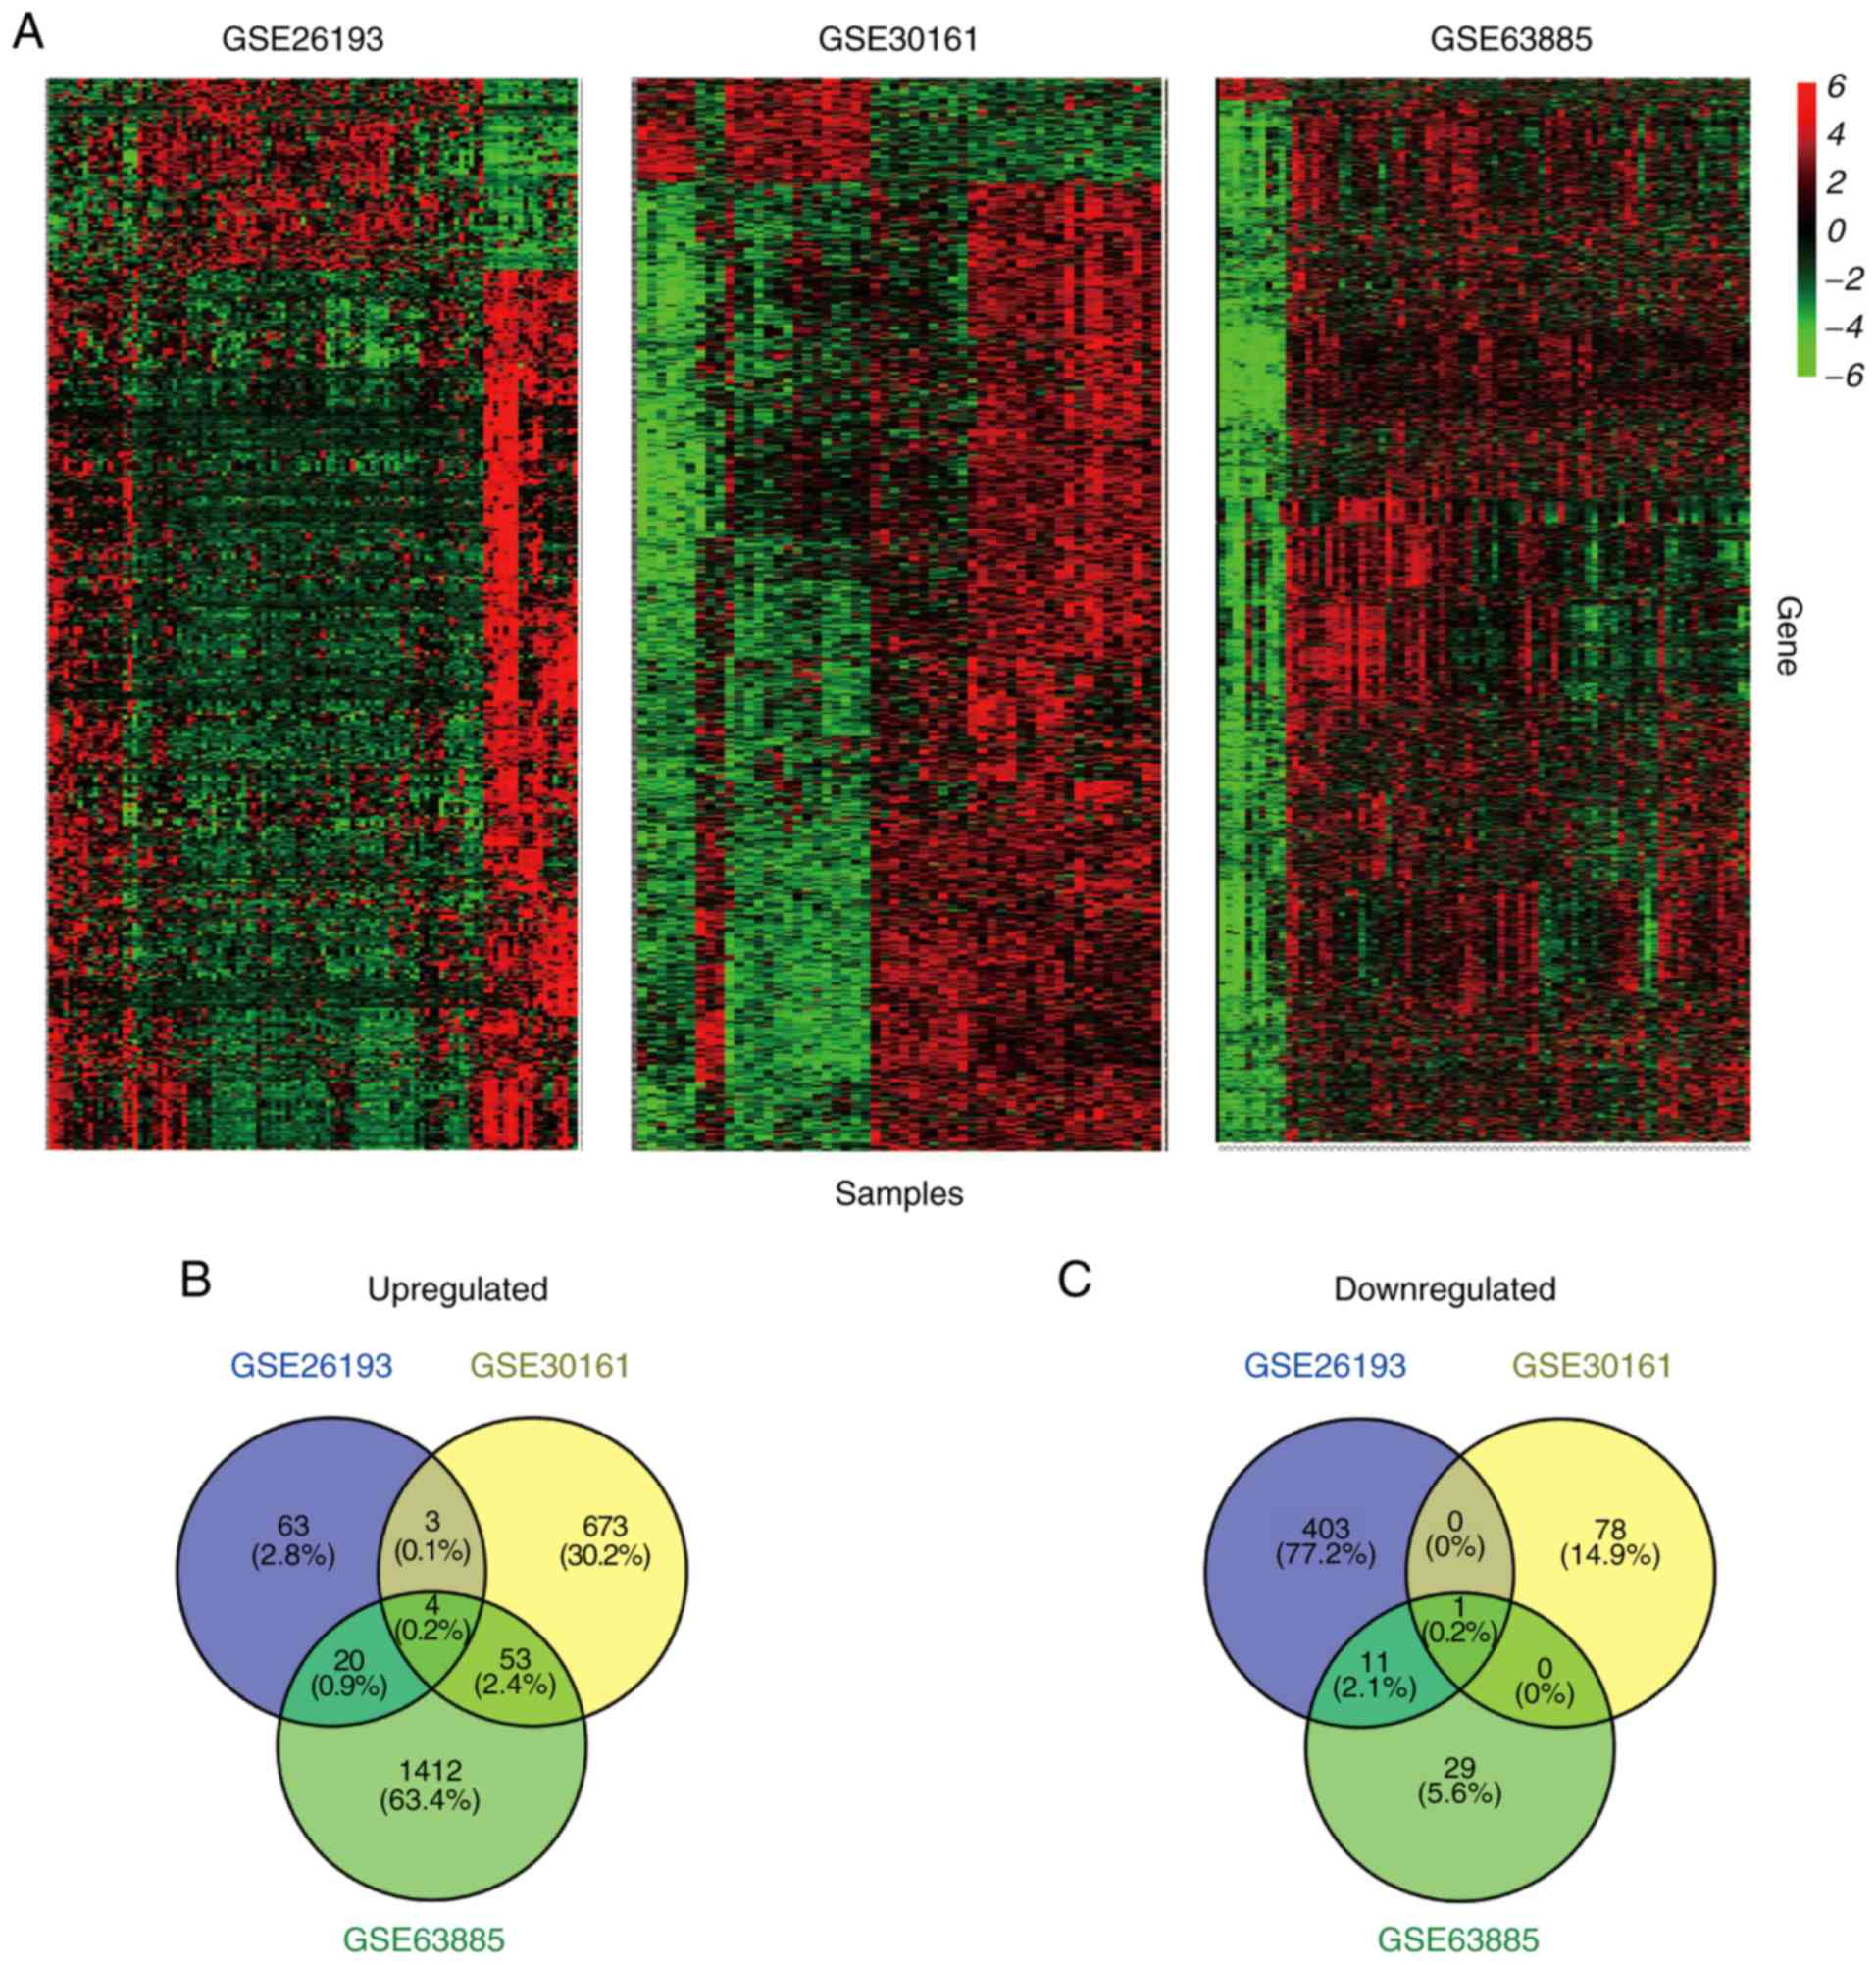
The present study initially analyzed the
differentially expressed genes between HG-EOCs and LG-EOCs in each
dataset with the limma software package. The three datasets
(GSE26193, GSE63885 and GSE30161) were then employed to analyze the
consistently differential expressed genes (Fig. 1A). As illustrated in Fig. 1B, there were 90, 733 and 1,489
upregulated genes in the GSE26193, GSE30161 and GSE63885 datasets,
respectively. CTCFL (fold change/FC=2.676; percentage of false
prediction/pfp<0.01), EGFL6 (FC=2.140; pfp<0.01), radical
S-adenosyl methionine domain containing 2 (FC=1.776; pfp<0.01)
and SAM and HD domain containing deoxynucleoside triphosphate
triphosphohydrolase 1 (SAMHD1; FC=1.639; pfp<0.01) were
consistently upregulated among these three datasets. Furthermore,
415, 79 and 41 genes were identified as downregulated in the
GSE26193, GSE30161 and GSE63885 datasets, respectively. Only ALK
and LTK ligand 2 (FC=0.504; pfp<0.01) was downregulated among
the three aforementioned datasets (Fig.
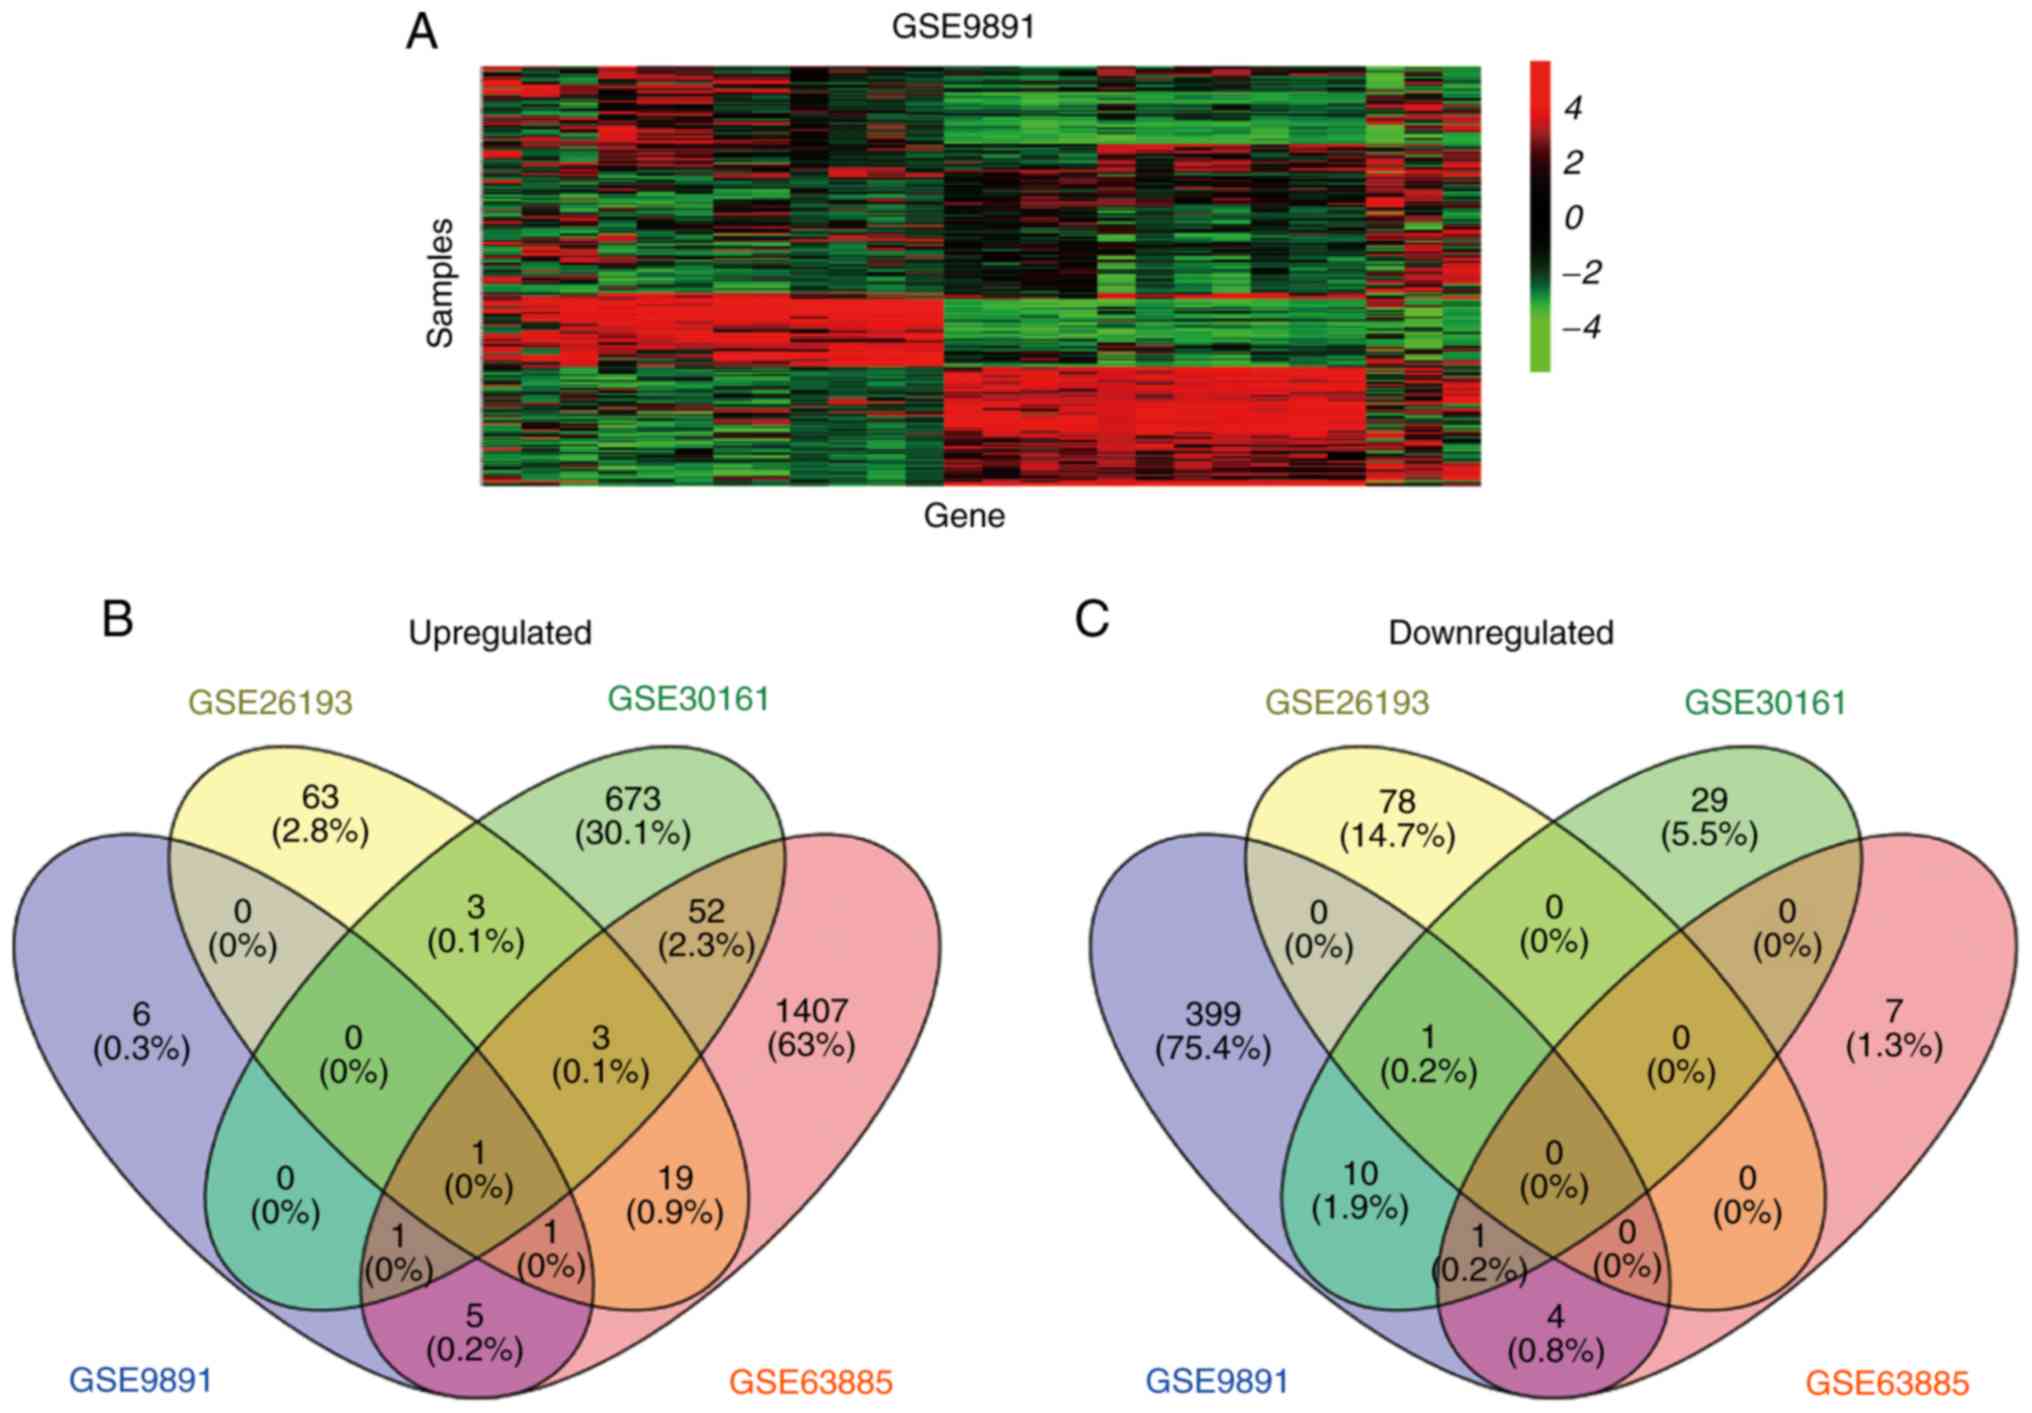
1C). In order to decrease the number of differentially
expressed genes, and therefore identify more reliable potential
molecular markers for EOC grade, the present study superadded an
additional dataset (GSE9891). As presented in Fig. 2, only one overlapping candidate
probe, CTCFL, was identified to be upregulated in the four datasets
and no probes were consistently downregulated in the four examined
datasets.
Genome-wide analysis of differential
gene expression in merged datasets
To further enlarge the sample size, the present
study initially merged the three datasets by using the
InSilicoMerging method. The ‘RankProd’ approach was subsequently
used to analyze the differentially expressed genes in the merged
datasets. As a result, a total of 6,103 upregulated probes
corresponding with 5,766 genes (FC>1; pfp<0.01), and 4,004
downregulated probes corresponding with 3,707 genes (FC<1;
pfp<0.01) were identified from the GSE26193, GSE63885 and
GSE30161 datasets. The top 20 upregulated and downregulated genes
are presented in Tables II and
III, respectively.
| Table II.Top 20 most significantly upregulated
probes identified from merged three datasets by RankProd in high
grade-EOCs. |
Table II.
Top 20 most significantly upregulated
probes identified from merged three datasets by RankProd in high
grade-EOCs.
| PROBEID | SYMBOL | Fold change (class
1/class 2) | Pfp | P-value |
|---|
| 1552368_at | CTCFL | 2.675943 | <0.001 | <0.001 |
| 211430_s_at | MIR8071-2 | 2.242152 | <0.001 | <0.001 |
| 211430_s_at | MIR8071-1 | 2.242152 | <0.001 | <0.001 |
| 211430_s_at | IGHV4-31 | 2.242152 | <0.001 | <0.001 |
| 211430_s_at | IGHM | 2.242152 | <0.001 | <0.001 |
| 211430_s_at | IGHG3 | 2.242152 | <0.001 | <0.001 |
| 211430_s_at | IGHG2 | 2.242152 | <0.001 | <0.001 |
| 211430_s_at | IGHG1 | 2.242152 | <0.001 | <0.001 |
| 214677_x_at | IGLJ3 | 2.159827 | <0.001 | <0.001 |
| 214677_x_at | IGLC1 | 2.159827 | <0.001 | <0.001 |
| 210809_s_at | POSTN | 2.145002 | <0.001 | <0.001 |
| 219454_at | EGFL6 | 2.139953 | <0.001 | <0.001 |
| 204533_at | CXCL10 | 2.119093 | <0.001 | <0.001 |
| 210096_at | CYP4B1 | 2.111486 | <0.001 | <0.001 |
| 219768_at | VTCN1 | 2.05719 | <0.001 | <0.001 |
| 202575_at | CRABP2 | 2.042067 | <0.001 | <0.001 |
| 209138_x_at | IGLC1 | 1.982947 | <0.001 | <0.001 |
| 206067_s_at | WT1 | 1.968892 | <0.001 | <0.001 |
| 230720_at | RNF182 | 1.965409 | <0.001 | <0.001 |
| 224795_x_at | IGKC | 1.958864 | <0.001 | <0.001 |
| Table III.The top 20 most significantly
downregulated probes identified from merged three datasets by
RankProd in high grade-EOCs. |
Table III.
The top 20 most significantly
downregulated probes identified from merged three datasets by
RankProd in high grade-EOCs.
| Probe ID | Gene symbol | Fold change (class
1/class 2) | pfp | P-value |
|---|
| 1552283_s_at | ZDHHC11B | 0.842815 | <0.001 | <0.001 |
| 1552283_s_at | ZDHHC11 | 0.842815 | <0.001 | <0.001 |
| 1552348_at | PRSS33 | 0.683901 | <0.001 | <0.001 |
| 1552365_at | SCIN | 0.926526 | <0.001 | <0.001 |
| 1552496_a_at | COBL | 0.83375 | <0.001 | <0.001 |
| 1552532_a_at | ATP6V1C2 | 0.855798 | <0.001 | <0.001 |
| 1552670_a_at | PPP1R3B | 0.79164 | <0.001 | <0.001 |
| 1552767_a_at | HS6ST2 | 0.826037 | <0.001 | <0.001 |
| 1552790_a_at | SEC62 | 0.893735 | <0.001 | <0.001 |
| 1552797_s_at | PROM2 | 0.846668 | <0.001 | <0.001 |
| 1552910_at | SIGLEC11 | 0.827746 | <0.001 | <0.001 |
| 1553062_at | MOGAT1 | 0.872144 | <0.001 | <0.001 |
| 1553589_a_at | PDZK1IP1 | 0.808865 | <0.001 | <0.001 |
| 1553613_s_at | FOXC1 | 0.617665 | <0.001 | <0.001 |
| 1553655_at | CDC20B | 0.740247 | <0.001 | <0.001 |
| 1553986_at | RASEF | 0.720305 | <0.001 | <0.001 |
| 1553989_a_at | ATP6V1C2 | 0.800128 | <0.001 | <0.001 |
| 1553995_a_at | NT5E | 0.740796 | <0.001 | <0.001 |
| 1553997_a_at | ASPHD1 | 0.813537 | <0.001 | <0.001 |
| 1554067_at | C12orf66 | 0.847529 | <0.001 | <0.001 |
Consistent with the intersection results among the
aforementioned four datasets, CTCFL was the most upregulated gene
in HG-EOCs from the merged GSE26193, GSE63885 and GSE30161 datasets
(Table I). Therefore, CTCFL may
serve as a potent biomarker and CTCFL was subsequently selected as
a candidate gene for distinguishing HG-EOCs from LG-EOCs.
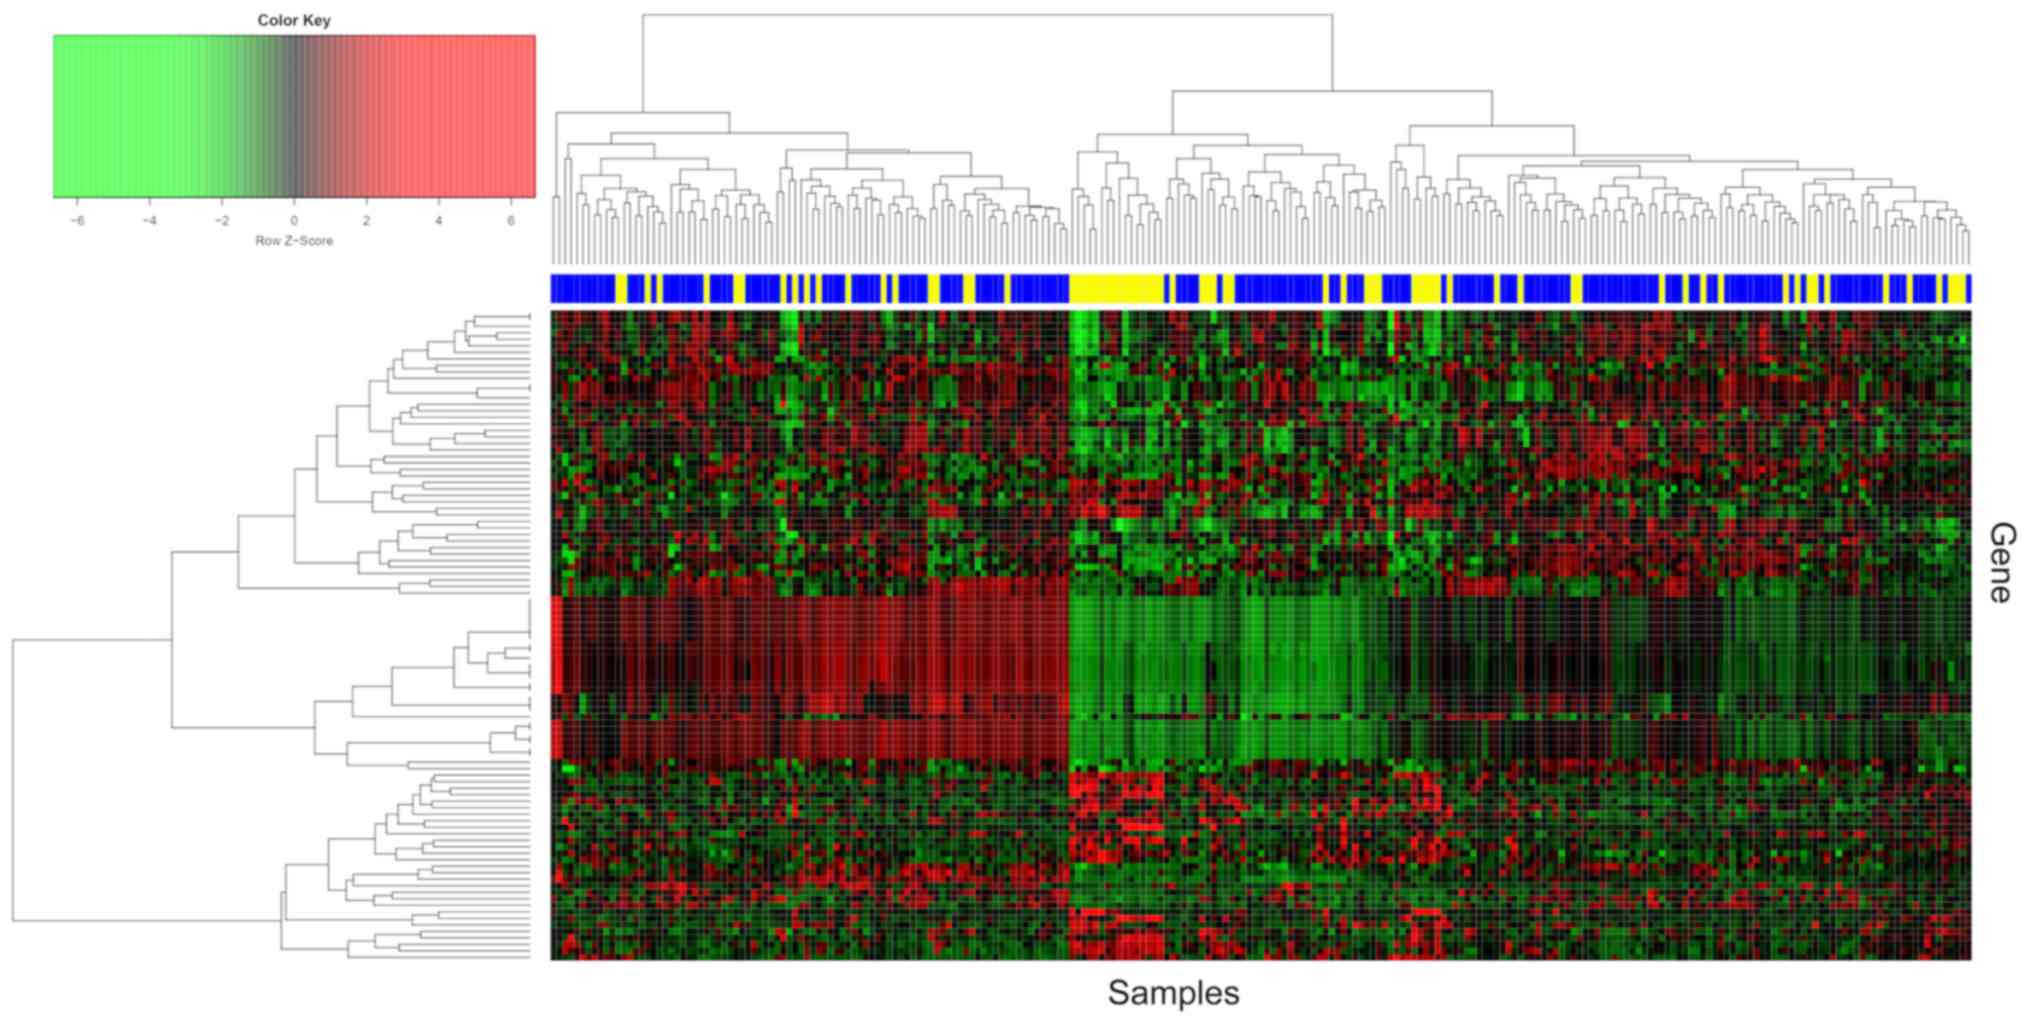
The top 100 dysregulated probes in the merged
datasets are presented in Fig. 3,
and the hierarchical cluster analysis revealed that the expression
profiles of HG-EOCs were similar to those of LG-EOCs.
Gene enrichment analysis of
dysregulated genes
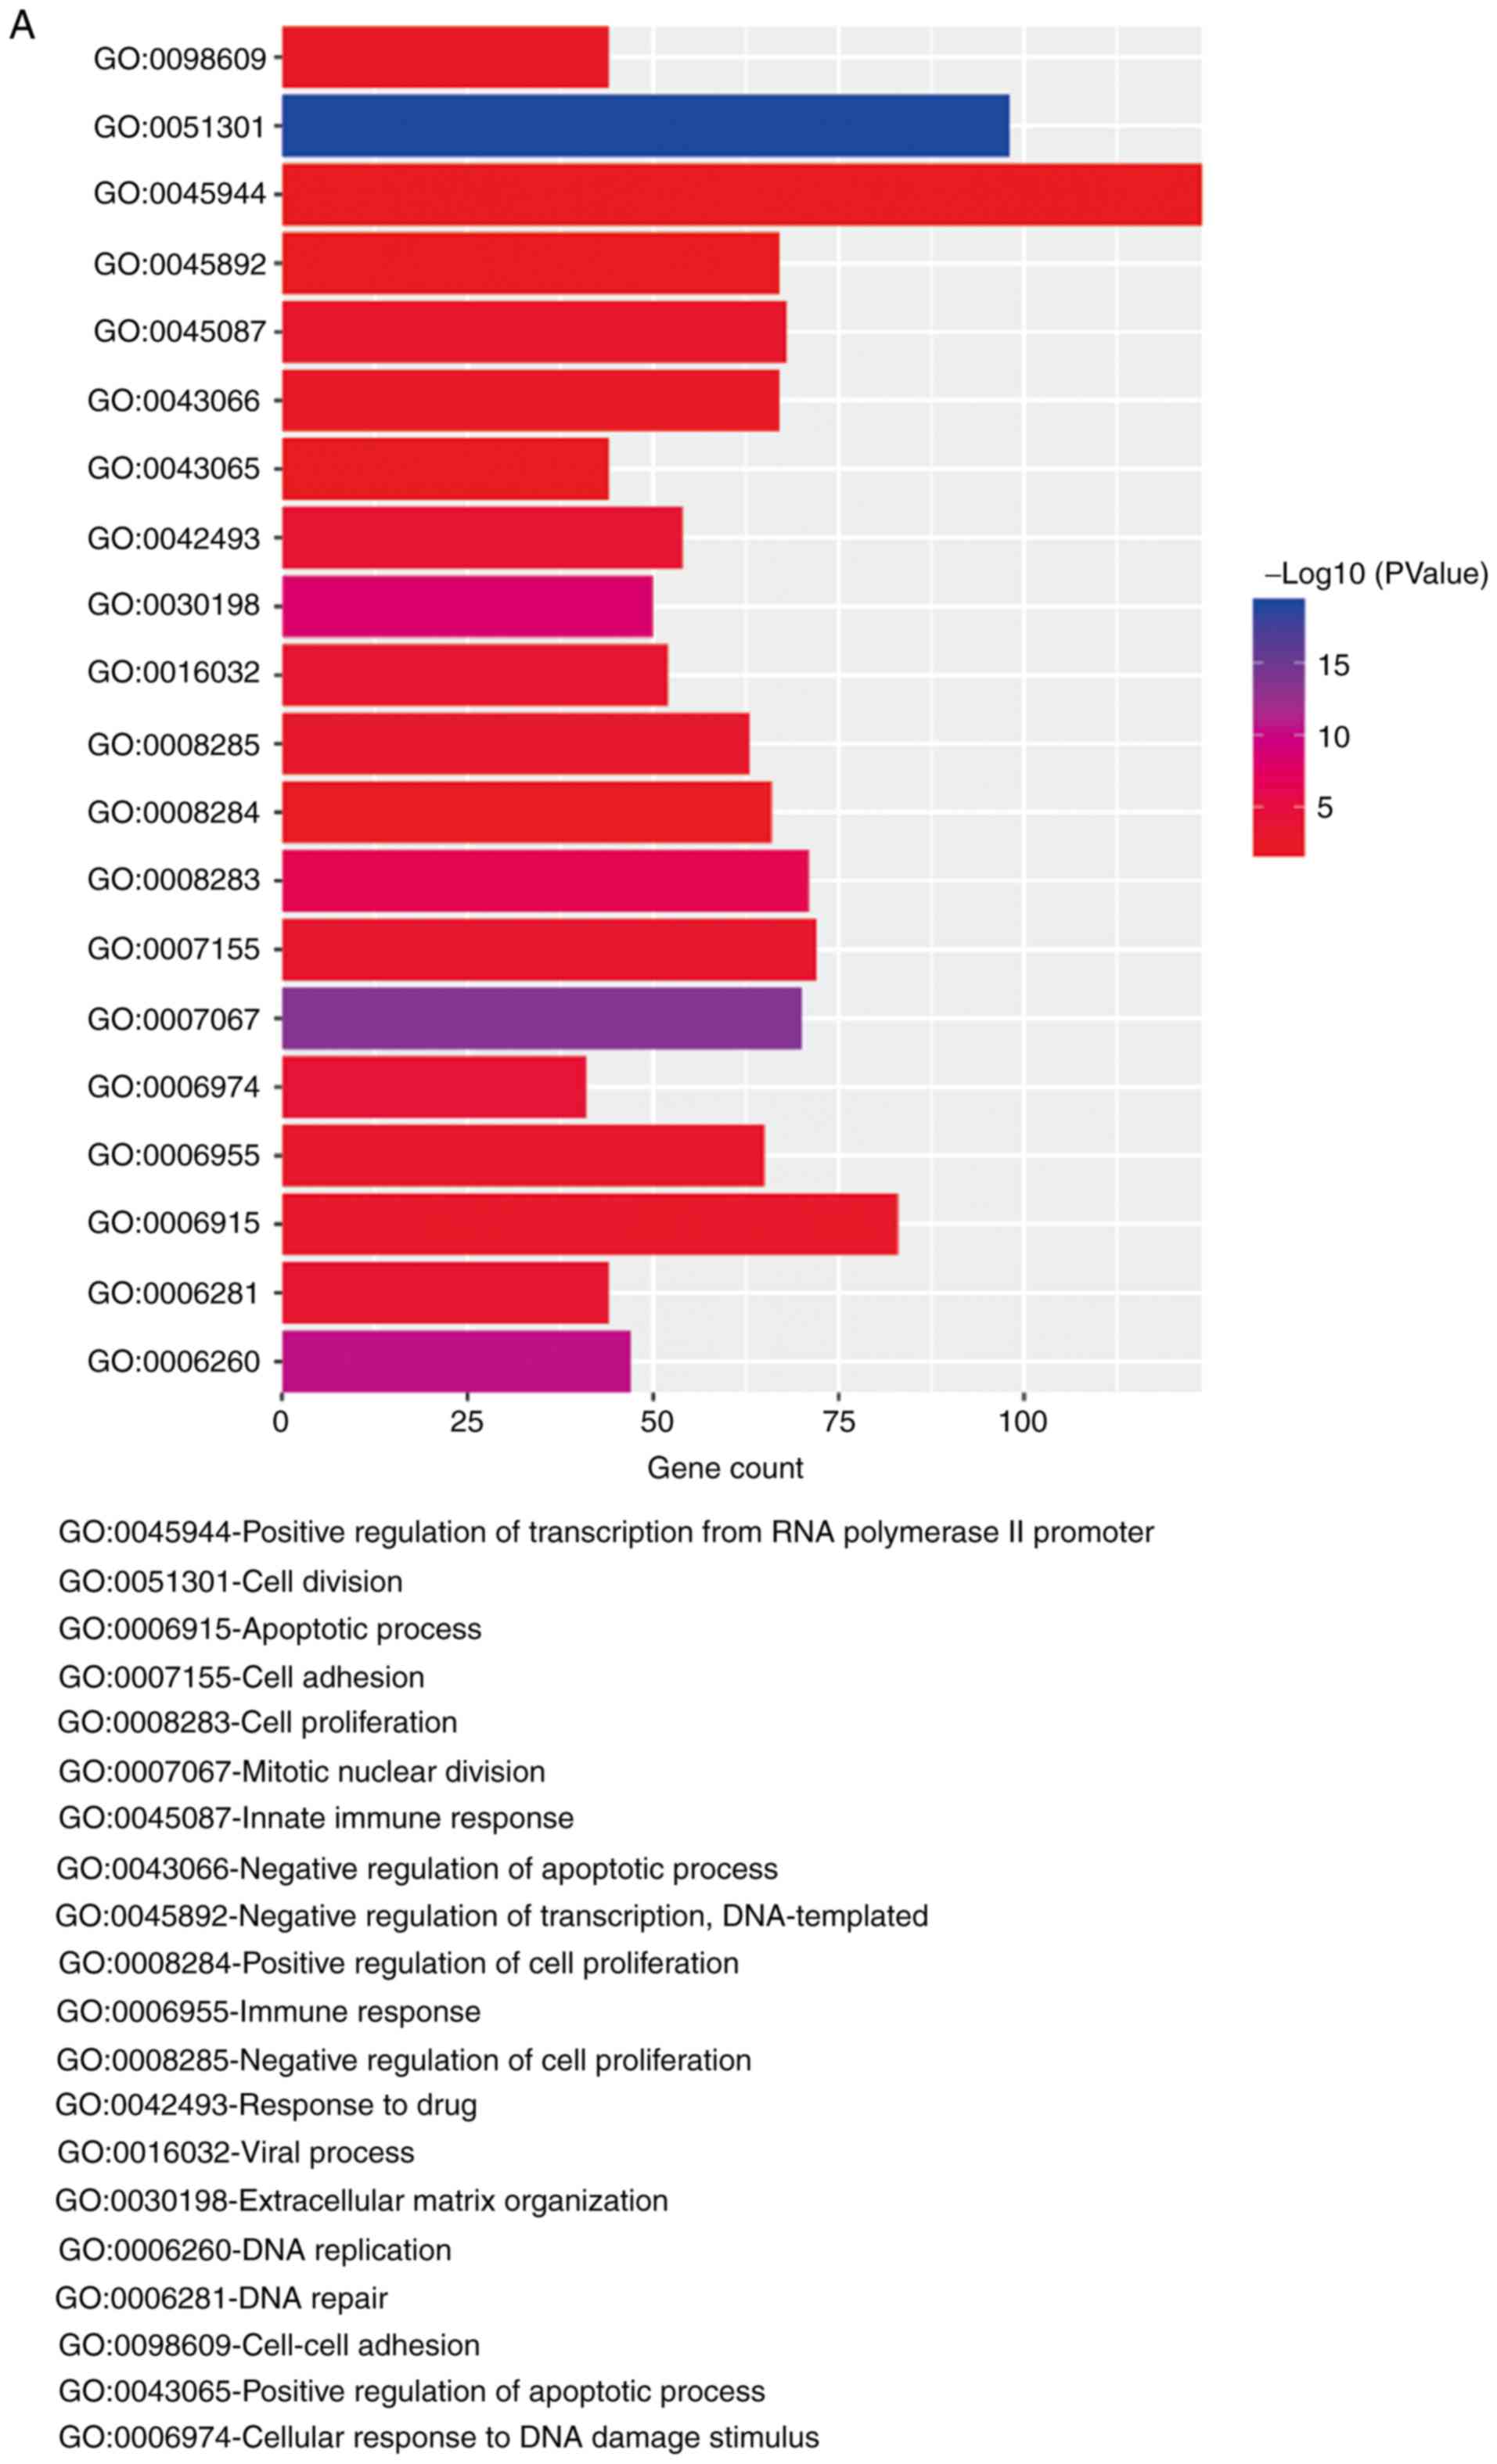
To effectively analyze the function of the
dysregulated genes in the merged datasets, DAVID was utilized to
process the functional enrichment analysis. The biological process
(BP) terms associated with the top 3,000 dysregulated genes were
downloaded. There were 370 significant BP terms associated with the
genes upregulated in HG-EOCs and 380 significant BP terms
associated with the genes that were downregulated in HG-EOCs. The
upregulated genes were enriched in the ‘positive regulation of
transcription from RNA polymerase II’, whilst the downregulated
genes were enriched in ‘signal transduction’ and ‘positive
regulation of transcription from RNA polymerase II promoter’. The
top 20 BP terms are presented in Fig. 4A
and B.
mRNA expression of CTCFL between
HG-EOCs and LG-EOCs
In order to verify the differential expression of
CTCFL in LG-EOCs and HG-EOCs, RT-qPCR was performed in 36 LG-EOCs
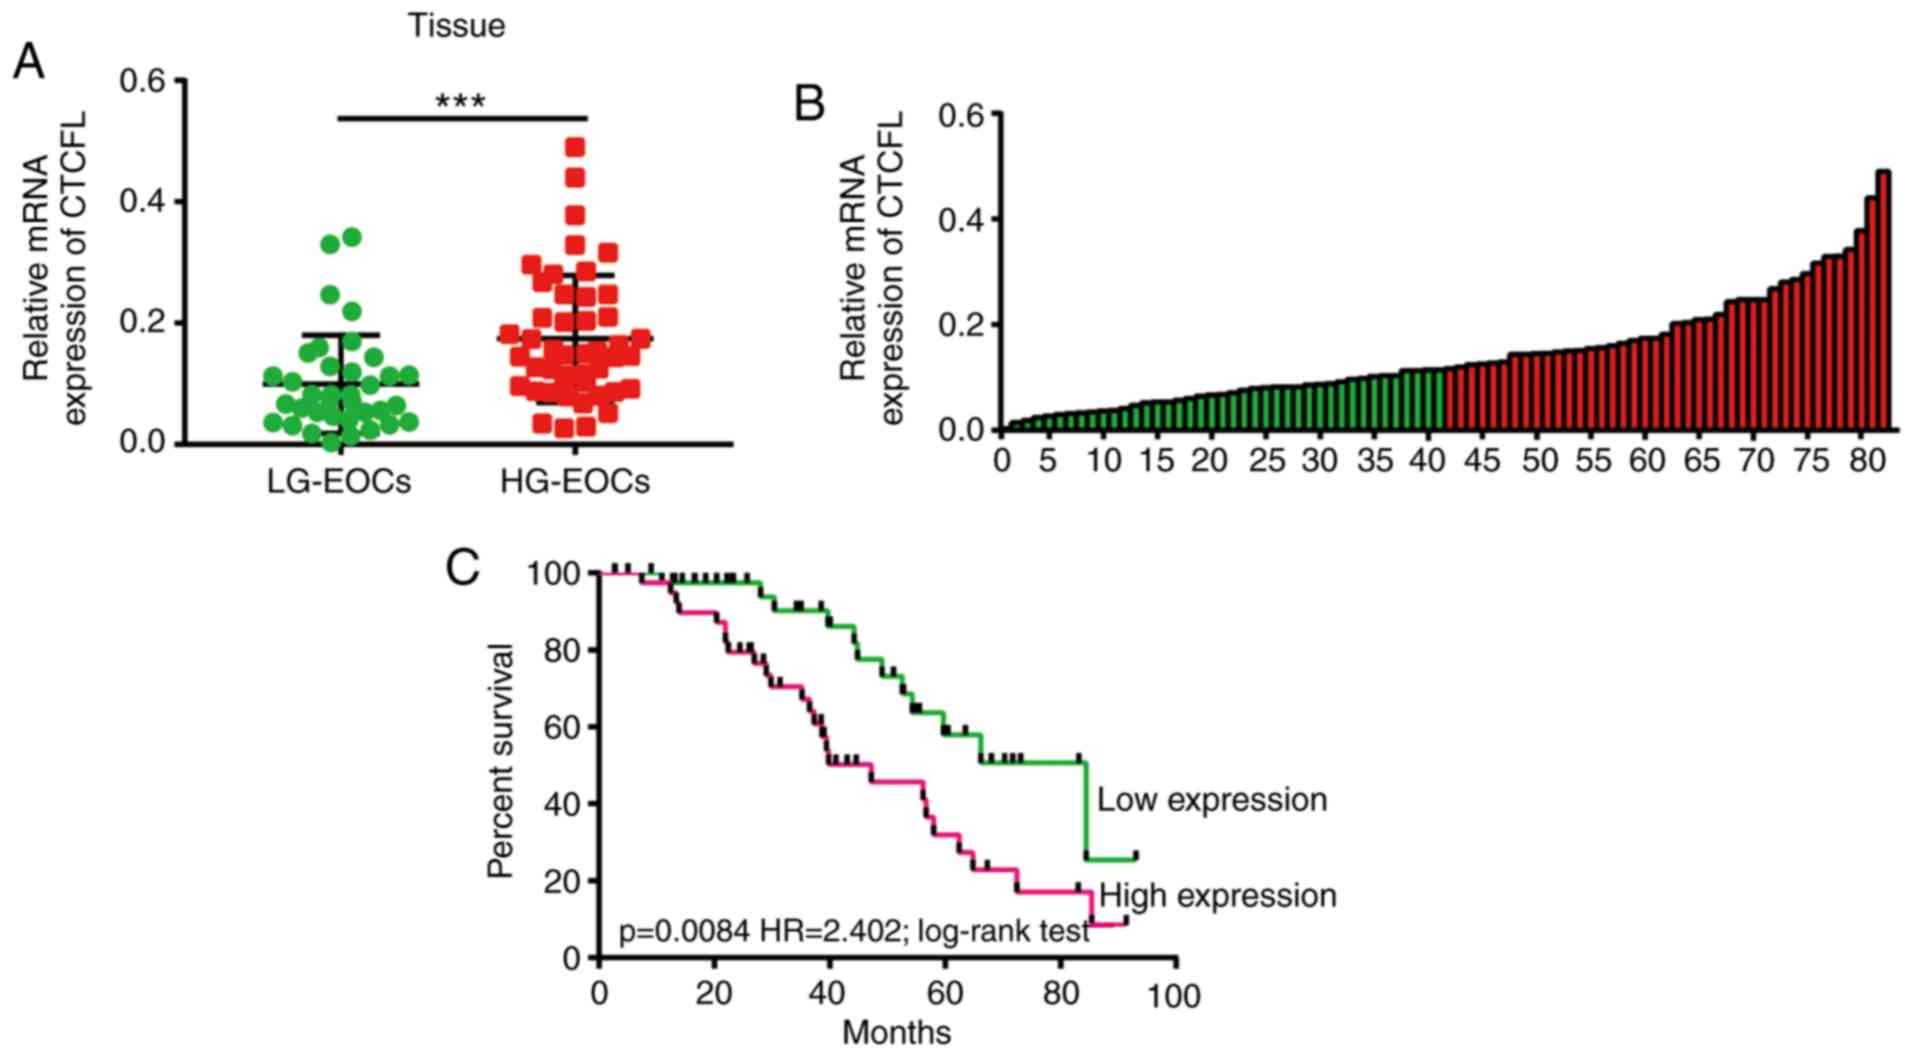
and 46 HG-EOCs tissue samples. As illustrated in Fig. 5A, the mRNA level of CTCFL was
significantly upregulated in HG-EOCs compared with LG-EOCs
(P=0.0007). This results indicated that upregulated CTCFL may be
implicated in HG-EOCs. In addition, the present study divided the
82 patients with EOC into two groups on the basis of CTCFL
expression in tumor tissues (Fig.
5B; cut-off, 0.1152275). By using the log-rank test, patients
with high expression levels of CTCFL were observed to have a poor
outcome compared with patients with low expression levels of CTCFL
(P=0.0084, Fig. 5C). Notably, the
association between clinical pathological characteristics and CTCFL
expression revealed that high expression levels of CTCFL were
significantly associated with tumor size (P=0.0344), the
International Federation of Gynecology and Obstetrics stage
(P=0.0343) and histological grade (P=0.0004). However,
highly-expressed CTCFL was not associated with the other examined
clinical characteristics (Table
I).
Protein expression of CTCFL between
HG-EOCs and LG-EOCs
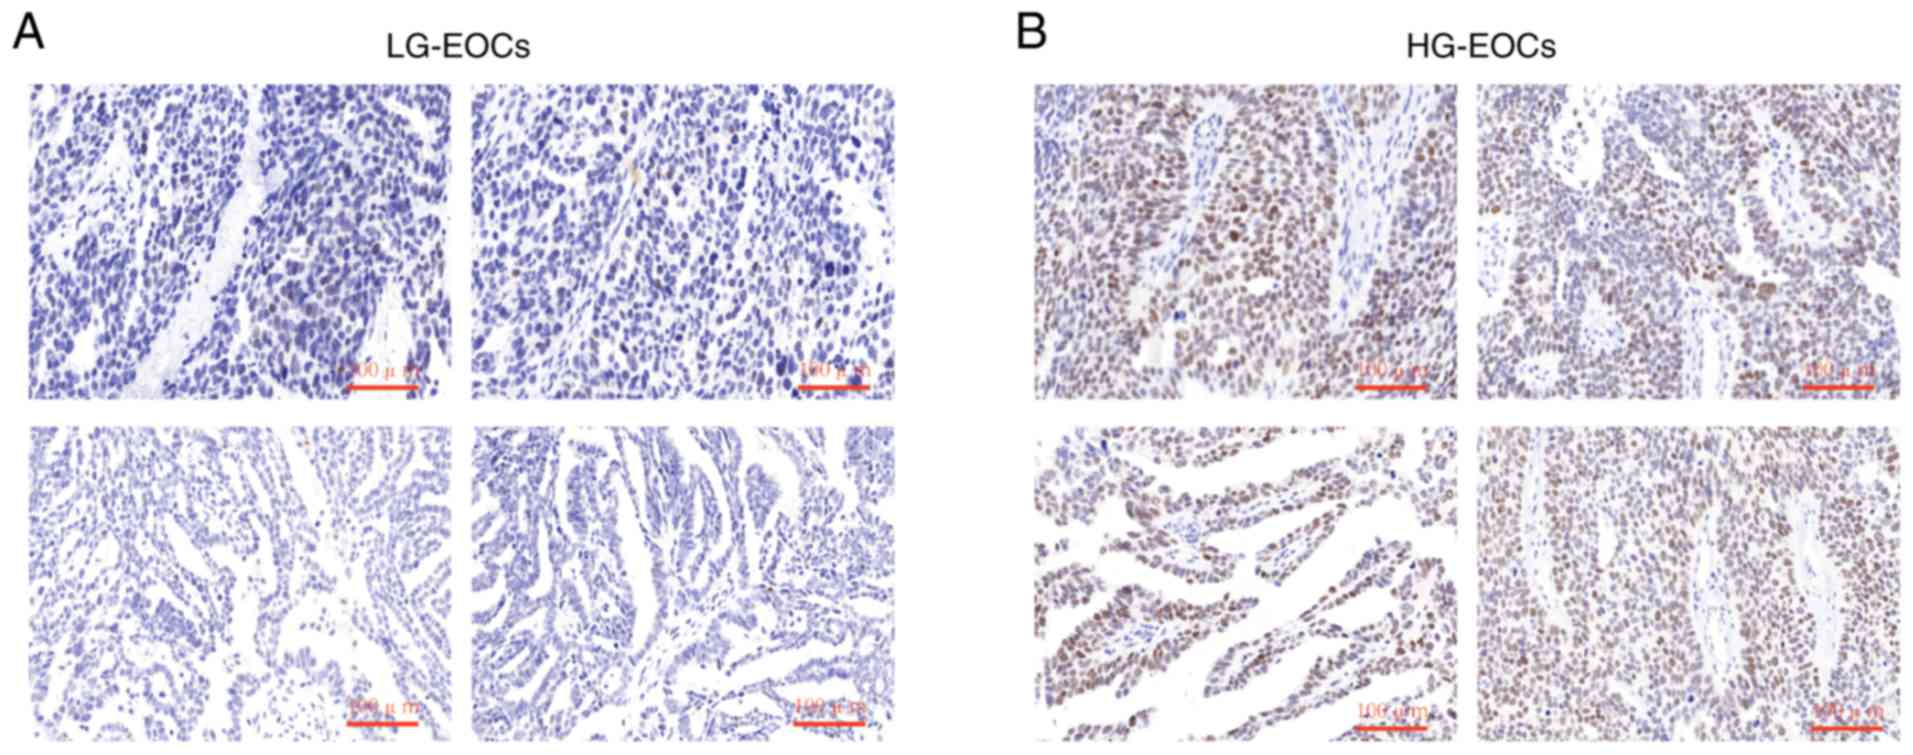
For further validation, the protein expression of
CTCFL in LG-EOCs EOCs and HG-EOCs was analyzed by
immunohistochemistry. As hypothesized, the protein expression of
CTCFL in HG-EOCs samples was markedly higher than LG-EOCs samples
(Fig. 6A and B). Taken together,
these results suggested that CTCFL was associated with EOC grade
and may serve as a promising biomarker and therapeutic target for
HG-EOCs.
Discussion
As gene chip technology has advanced, genome-wide
analysis of microarrays have been increasingly applied to medical
research in order to identify differentially expressed genes in a
variety of diseases including EOCs, as well as to explore the
potential underlying molecular mechanisms of pathogenesis (11). An increasing number of microarray
gene analysis investigating various diseases have been reported
(11,23–25). For
example, Singh et al (26)
analyzed the genome-wide profile of the PIWI-interacting RNA-mRNA
regulatory networks in EOCs. The study of Shi and Zhang (27) utilized microarray analysis to screen
genes and regulatory factors involved in EOCs. Januchowski et
al (28) used microarrays to
identify novel genes associated with drug resistance in ovarian
cancer cell lines. Wei et al (29) investigated the sequential gene
changes in EOC induced by carboplatin via microarray analysis.
However, few studies investigating biomarkers associated with EOC
grade have been reported. Additionally, these studies have a
limited sample size and different platforms resources, which lead
to inconsistent results. Consequently, merging several eligible
datasets together with normalization by using RMA analysis may
produce more reliable results.
The present study was based on four public
microarray datasets downloaded from the GEO database (GSE26193,
GSE63885, GSE30161 and GSE9891), which collectively included 521
EOC samples. Initially, the differentially expressed genes in each
dataset were analyzed, and an intersection was obtained. CTCFL,
EGFL6 and SAMHD1 were identified to be consistently upregulated
among the GSE26193, GSE63885 and GSE30161 datasets. Following the
addition of the GSE9891 dataset, only one overlapping candidate
probe was identified to be upregulated among all the datasets. To
compensate for the shortage of limited sample size and different
platforms resources, the GSE26193, GSE63885 and GSE30161 datasets
were merged for subsequent analysis and CTCFL was revealed to be
the most upregulated gene in high-grade EOC. Based on gene
enrichment analysis of dysregulated genes, the upregulated genes
were most enriched in the ‘positive regulation of transcription
from RNA polymerase II promoter’, while the downregulated genes
were enriched in ‘signal transduction’ and ‘positive regulation of
transcription from RNA polymerase II promoter’. These results
indicated that the dysregulated genes in HG-EOCs may serve an
underlying role in oncogene development and progression. Finally,
RT-qPCR and immunohistochemical analysis demonstrated that the EOC
grade was closely associated with the CTCFL level.
The aforementioned results demonstrated that CTCFL
was the most upregulated gene in HG-EOCs. CTCFL belongs to the
cancer testis antigen family (30),
which is typically expressed in the testes (31). However, numerous studies
investigating the high expression of CTCFL in multiple carcinomas
have been reported, including breast cancer, lung cancer,
endometrial carcinoma, prostate cancer and colon cancer, and the
expression of CTCFL was associated with tumor size and histological
differentiation (32–35). D'Arcy et al (32) reported that the CTCFL protein is
closely associated with the occurrence and progression of breast
cancer. Risinger et al (34)
identified a similar expression profile of CTCFL in uterine cancer.
The aforementioned studies suggested that CTCFL promoted
tumorigenesis. Previous studies demonstrated that CTCFL was highly
expressed in ovarian cancer, and the dysregulation was associated
with DNA hypomethylation (36–38). At
present, the pathophysiological role of CTCFL in tumor formation
and progression is yet to be fully elucidated. To further
investigate whether CTCFL was differentially expressed between
HG-EOCs and LG-EOCs, the present study performed
immunohistochemical analysis, and the results were consistent with
the result of microarray datasets analysis. The results obtained in
the current study suggested that CTCFL was the most upregulated
gene in HG-EOCs compared with LG-EOCs. Taken together, the results
of the present study indicated that CTCFL may act as an oncogene in
the progression of EOC and may be a potential diagnostic biomarker
and therapeutic target of EOC.
However, there are limitations to the present study.
Due to the small sample size of EOC tissues in the experiment,
further studies are required to verify the oncogenic role of CTCFL
in EOC grade. Additionally, the mechanism of CTCFL which promotes
malignant behaviors of ovarian cancer cells should be explored in
depth. Finally, although the statistical analysis indicated a
significant upregulation of CTFCL in HG-EOCs when compared with
LG-EOCs, the RT-qPCR results demonstrated that the majority of
patients had a value falling within the error bars for the LG-EOCs.
Therefore, a larger sample size is required to define the CTCFL
values that distinguish HG-EOCs from LG-EOCs.
In conclusion, CTCFL was the most upregulated gene
in the selected datasets and may serve as a potential molecular
biomarker to distinguish HG-EOCs from LG-EOCs. However, further
investigations are required to explore the underlying mechanisms of
CTCFL in HG-EOCs.
Acknowledgements
Not applicable.
Funding
This work was supported by the National Nature
Science Foundation of China (grant. no. 81472442) and the Jiangsu
Province Medical Innovation Team (grant. no. CXTDA2017008).
Availability of data and materials
The datasets analyzed during the current study are
available in the GEO repository, https://www.ncbi.nlm.nih.gov/geo/query/acc.cgi?acc=GSE26193,
https://www.ncbi.nlm.nih.gov/geo/query/acc.cgi?acc=GSE63885,
https://www.ncbi.nlm.nih.gov/geo/query/acc.cgi?acc=GSE30161
and https://www.ncbi.nlm.nih.gov/geo/query/acc.cgi?acc=GSE9891.
Authors' contributions
WC designed the study. MG, CY and YJ analyzed and
interpreted the microarray datasets, and produced the manuscript.
MG wrote the paper and submitted the manuscript. HM and MF
performed the experiments. All authors read and approved the final
manuscript.
Ethics approval and consent to
participate
The present study was approved by the Research
Ethics Committee of Nanjing Medical University. Written informed
consent for the analysis of tissue specimens in this study was
obtained from the patients.
Patient consent for publication
Not applicable.
Competing interests
The authors declare that they have no competing
interests.
References
|
1
|
Siegel RL, Miller KD and Jemal A: Cancer
statistics, 2015. CA Cancer J Clin. 65:5–29. 2015. View Article : Google Scholar : PubMed/NCBI
|
|
2
|
Bast RC Jr, Hennessy B and Mills GB: The
biology of ovarian cancer: New opportunities for translation. Nat
Rev Cancer. 9:415–428. 2009. View
Article : Google Scholar : PubMed/NCBI
|
|
3
|
Prat J: Ovarian carcinomas: Five distinct
diseases with different origins, genetic alterations, and
clinicopathological features. Virchows Arch. 460:237–249. 2012.
View Article : Google Scholar : PubMed/NCBI
|
|
4
|
Yan C, Jiang Y, Wan Y, Zhang L, Liu J,
Zhou S and Cheng W: Long noncoding RNA NBAT-1 suppresses
tumorigenesis and predicts favorable prognosis in ovarian cancer.
Onco Targets Ther. 10:1993–2002. 2017. View Article : Google Scholar : PubMed/NCBI
|
|
5
|
Jacobs AS, Schwartz MD, Valdimarsdottir H,
Nusbaum RH, Hooker GW, DeMarco TA, Heinzmann JE, McKinnon W,
McCormick SR, Davis C, et al: Patient and genetic counselor
perceptions of in-person versus telephone genetic counseling for
hereditary breast/ovarian cancer. Fam Cancer. 15:529–539. 2016.
View Article : Google Scholar : PubMed/NCBI
|
|
6
|
Ganeshan D, Bhosale P, Wei W, Ramalingam
P, Mudasiru- Dawodu E, Gershenson D, Sun C and Iyer R: Increase in
post-therapy tumor calcification on CT scan is not an indicator of
response to therapy in low-grade serous ovarian cancer. Abdom
Radiol (NY). 41:1589–1595. 2016. View Article : Google Scholar : PubMed/NCBI
|
|
7
|
Hoppenot C, Eckert MA, Tienda SM and
Lengyel E: Who are the long-term survivors of high grade serous
ovarian cancer? Gynecol Oncol. 148:204–212. 2018. View Article : Google Scholar : PubMed/NCBI
|
|
8
|
Hacker KE, Uppal S and Johnston C:
Principles of treatment for borderline, micropapillary serous, and
low-grade ovarian cancer. J Natl Compr Canc Netw. 14:1175–1182.
2016. View Article : Google Scholar : PubMed/NCBI
|
|
9
|
Shih Ie M and Kurman RJ: Ovarian
tumorigenesis: A proposed model based on morphological and
molecular genetic analysis. Am J Surg Pathol. 164:1511–1518. 2004.
View Article : Google Scholar
|
|
10
|
Khalique L, Ayhan A, Weale ME, Jacobs IJ,
Ramus SJ and Gayther SA: Genetic intra-tumour heterogeneity in
epithelial ovarian cancer and its implications for molecular
diagnosis of tumours. J Pathol. 211:286–295. 2007. View Article : Google Scholar : PubMed/NCBI
|
|
11
|
Chow YP, Alias H and Jamal R:
Meta-analysis of gene expression in relapsed childhood B-acute
lymphoblastic leukemia. BMC Cancer. 17:1202017. View Article : Google Scholar : PubMed/NCBI
|
|
12
|
Ding Y, Yang DZ, Zhai YN, Xue K, Xu F, Gu
XY and Wang SM: Microarray expression profiling of long non-coding
RNAs in epithelial ovarian cancer. Oncol Lett. 14:2523–2530. 2017.
View Article : Google Scholar : PubMed/NCBI
|
|
13
|
Wang H, Fu Z, Dai C, Cao J, Liu X, Xu J,
Lv M, Gu Y, Zhang J, Hua X, et al: LncRNAs expression profiling in
normal ovary, benign ovarian cyst and malignant epithelial ovarian
cancer. Sci Rep. 6:389832016. View Article : Google Scholar : PubMed/NCBI
|
|
14
|
Mateescu B, Batista L, Cardon M, Gruosso
T, de Feraudy Y, Mariani O, Nicolas A, Meyniel JP, Cottu P,
Sastre-Garau X and Mechta-Grigoriou F: miR-141 and miR-200a act on
ovarian tumorigenesis by controlling oxidative stress response. Nat
Med. 17:1627–1635. 2011. View
Article : Google Scholar : PubMed/NCBI
|
|
15
|
Lisowska KM, Olbryt M, Dudaladava V,
Pamula-Pilat J, Kujawa K, Grzybowska E, Jarzab M, Student S,
Rzepecka IK, Jarzab B and Kupryjańczyk J: Gene expression analysis
in ovarian cancer-faults and hints from DNA microarray study. Front
Oncol. 4:62014. View Article : Google Scholar : PubMed/NCBI
|
|
16
|
Ferriss JS, Kim Y, Duska L, Birrer M,
Levine DA, Moskaluk C, Theodorescu D and Lee JK: Multi-gene
expression predictors of single drug responses to adjuvant
chemotherapy in ovarian carcinoma: Predicting platinum resistance.
PLoS One. 7:e305502012. View Article : Google Scholar : PubMed/NCBI
|
|
17
|
Tothill RW, Tinker AV, George J, Brown R,
Fox SB, Lade S, Johnson DS, Trivett MK, Etemadmoghadam D, Locandro
B, et al: Novel molecular subtypes of serous and endometrioid
ovarian cancer linked to clinical outcome. Clin Cancer Res.
14:5198–5208. 2008. View Article : Google Scholar : PubMed/NCBI
|
|
18
|
Taminau J, Meganck S, Lazar C, Steenhoff
D, Coletta A, Molter C, Duque R, de Schaetzen V, Weiss Solis DY,
Bersini H and Nowé A: Unlocking the potential of publicly available
microarray data using inSilicoDb and inSilicoMerging R/Bioconductor
packages. BMC Bioinformatics. 13:3352012. View Article : Google Scholar : PubMed/NCBI
|
|
19
|
Hong F, Breitling R, McEntee CW, Wittner
BS, Nemhauser JL and Chory J: RankProd: A bioconductor package for
detecting differentially expressed genes in meta-analysis.
Bioinformatics. 22:2825–2827. 2006. View Article : Google Scholar : PubMed/NCBI
|
|
20
|
Huang da W, Sherman BT and Lempicki RA:
Systematic and integrative analysis of large gene lists using DAVID
bioinformatics resources. Nat Protoc. 4:44–57. 2009. View Article : Google Scholar : PubMed/NCBI
|
|
21
|
Ito K and Murphy D: Application of ggplot2
to Pharmacometric Graphics. CPT Pharmacometrics Syst Pharmacol.
2:e792013. View Article : Google Scholar : PubMed/NCBI
|
|
22
|
Livak KJ and Schmittgen TD: Analysis of
relative gene expression data using real-time quantitative PCR and
the 2(-Delta Delta C(T)) method. Methods. 25:402–408. 2001.
View Article : Google Scholar : PubMed/NCBI
|
|
23
|
Chan SK, Griffith OL, Tai IT and Jones SJ:
Meta-analysis of colorectal cancer gene expression profiling
studies identifies consistently reported candidate biomarkers.
Cancer Epidemiol Biomarkers Prev. 17:543–552. 2008. View Article : Google Scholar : PubMed/NCBI
|
|
24
|
Botling J, Edlund K, Lohr M, Hellwig B,
Holmberg L, Lambe M, Berglund A, Ekman S, Bergqvist M, Ponten F, et
al: Biomarker discovery in non-small cell lung cancer: Integrating
gene expression profiling, meta-analysis, and tissue microarray
validation. Clin Cancer Res. 19:194–204. 2013. View Article : Google Scholar : PubMed/NCBI
|
|
25
|
Goonesekere NC, Wang X, Ludwig L and Guda
C: A meta analysis of pancreatic microarray datasets yields new
targets as cancer genes and biomarkers. PLoS One. 9:e930462014.
View Article : Google Scholar : PubMed/NCBI
|
|
26
|
Singh G, Roy J, Rout P and Mallick B:
Genome-wide profiling of the PIWI-interacting RNA-mRNA regulatory
networks in epithelial ovarian cancers. PLoS One. 13:e01904852018.
View Article : Google Scholar : PubMed/NCBI
|
|
27
|
Shi C and Zhang Z: Screening of
potentially crucial genes and regulatory factors involved in
epithelial ovarian cancer using microarray analysis. Oncol Lett.
14:725–732. 2017. View Article : Google Scholar : PubMed/NCBI
|
|
28
|
Januchowski R, Sterzynska K, Zawierucha P,
Rucinski M, Swierczewska M, Partyka M, Bednarek-Rajewska K, Brazert
M, Nowicki M, Zabel M, et al: Microarray-based detection and
expression analysis of new genes associated with drug resistance in
ovarian cancer cell lines. Oncotarget. 8:49944–49958. 2017.
View Article : Google Scholar : PubMed/NCBI
|
|
29
|
Wei S, Liu J, Shi Y, Zhang X, Yang Y and
Song Q: Exploration of the sequential gene changes in epithelial
ovarian cancer induced by carboplatin via microarray analysis. Mol
Med Rep. 16:3155–3160. 2017. View Article : Google Scholar : PubMed/NCBI
|
|
30
|
He J, Huang Y, Liu Z, Zhao R, Liu Q, Wei
L, Yu X, Li B and Qin Y: Hypomethylation of BORIS is a promising
prognostic biomarker in hepatocellular carcinoma. Gene. 629:29–34.
2017. View Article : Google Scholar : PubMed/NCBI
|
|
31
|
Martin-Kleiner I: BORIS in human cancers-a
review. Eur J Cancer. 48:929–935. 2012. View Article : Google Scholar : PubMed/NCBI
|
|
32
|
D'Arcy V, Pore N, Docquier F, Abdullaev
ZK, Chernukhin I, Kita GX, Rai S, Smart M, Farrar D, Pack S, et al:
BORIS, a paralogue of the transcription factor, CTCF, is aberrantly
expressed in breast tumours. Br J Cancer. 98:571–579. 2008.
View Article : Google Scholar : PubMed/NCBI
|
|
33
|
Kang Y, Hong JA, Chen GA, Nguyen DM and
Schrump DS: Dynamic transcriptional regulatory complexes including
BORIS, CTCF and Sp1 modulate NY-ESO-1 expression in lung cancer
cells. Oncogene. 26:4394–4403. 2007. View Article : Google Scholar : PubMed/NCBI
|
|
34
|
Risinger JI, Chandramouli GV, Maxwell GL,
Custer M, Pack S, Loukinov D, Aprelikova O, Litzi T, Schrump DS,
Murphy SK, et al: Global expression analysis of cancer/testis genes
in uterine cancers reveals a high incidence of BORIS expression.
Clin Cancer Res. 13:1713–1719. 2007. View Article : Google Scholar : PubMed/NCBI
|
|
35
|
Hoffmann MJ, Muller M, Engers R and Schulz
WA: Epigenetic control of CTCFL/BORIS and OCT4 expression in
urogenital malignancies. Biochem Pharmacol. 72:1577–1588. 2006.
View Article : Google Scholar : PubMed/NCBI
|
|
36
|
Woloszynska-Read A, James SR, Link PA, Yu
J, Odunsi K and Karpf AR: DNA methylation-dependent regulation of
BORIS/CTCFL expression in ovarian cancer. Cancer Immun.
7:212007.PubMed/NCBI
|
|
37
|
Link PA, Zhang W, Odunsi K and Karpf AR:
BORIS/CTCFL mRNA isoform expression and epigenetic regulation in
epithelial ovarian cancer. Cancer Immun. 13:62013.PubMed/NCBI
|
|
38
|
Woloszynska-Read A, Zhang W, Yu J, Link
PA, Mhawech-Fauceglia P, Collamat G, Akers SN, Ostler KR, Godley
LA, Odunsi K and Karpf AR: Coordinated cancer germline antigen
promoter and global DNA hypomethylation in ovarian cancer:
Association with the BORIS/CTCF expression ratio and advanced
stage. Clin Cancer Res. 17:2170–2180. 2011. View Article : Google Scholar : PubMed/NCBI
|