Introduction
Prostate cancer (PCa) is the most common cancer
worldwide, and its incidence rate has increased continuously in
recent years; the number of new cases of PCa worldwide increased
from 1.11 million in 2015 to 1.28 million in 2018 (1–3). It has
been estimated that >1 million men are diagnosed and >300,000
succumb to the disease annually (4).
Although radical prostatectomy is an effective treatment, early
detection of PCa is difficult (2).
Therefore, early diagnosis is extremely important for PCa
treatment. At present, prostate-specific antigen (PSA) is used as a
biomarker for PCa diagnosis (5).
however, this method has numerous defects. For example, the
specificity is low when PSA is moderately elevated (6,7). As a
result, identification of more specific biomarkers is essential in
order to detect patients at an early stage of PCa and to provide
patients with an optimal treatment.
Microarrays are an efficient tool for analysis of
differentially expressed genes (DEGs) and could be applied to
identify potential biomarkers for the diagnosis and prognosis of
cancer (8,9). During the past decade, various DEGs in
colorectal cancer and pancreatic carcinoma have been identified
using microarrays (10,11). However, the results indicated that
these biomarkers are not enough for the diagnosis and prognosis of
PCa, and no reliable biomarker was validated for clinical use
(12). Therefore, potential
diagnostic and prognostic biomarkers need to be further identified
using microarrays and bioinformatics.
The aim of the present study was to determine
potential diagnostic and prognostic biomarkers of PCa. Firstly, the
GSE103512 dataset was analyzed and the DEGs were screened.
Secondly, Gene Ontology (GO), Kyoto Encyclopedia of Genes and
Genomes (KEGG) and protein-protein interaction (PPI) analyses of
DEGs were performed. The expression of key genes was verified using
Gene Expression Profiling Interactive Analysis (GEPIA) and Human
Protein Atlas (HPA) analysis. Finally, receiver operating
characteristic (ROC) and survival analyses were performed to
evaluate the diagnostic and prognostic value of these genes.
Materials and methods
Differential expression analysis
The mRNA expression profile of the GSE103512 dataset
was downloaded from Gene Expression Omnibus (GEO) (http://www.ncbi.nlm.nih.gov/geo/). The dataset
included 60 PCa samples and 7 normal prostate samples (13). The expression profile of GSE103512
was subsequently analyzed using Morpheus online tool (https://software.broadinstitute.org/morpheus/)
(14). A classical t-test was used
to identify the DEGs between PCa and normal prostate tissue. A
fold-change >2 and P<0.05 were considered to indicate a
statistically significant difference.
GO and KEGG pathway analysis
To characterize the function and pathway of DEGs, GO
and KEGG pathway analyses were performed using the Database for
Annotation, Visualization and Integrated Discovery (https://david.ncifcrf.gov/) (9). P<0.05 was considered as
statistically significant.
PPI network and module analysis
To assess the interactive associations among DEGs,
the DEGs were analyzed using the Search Tool for the Retrieval of
Interacting Genes/Proteins database, and a score >0.4 was
considered significant (15).
Subsequently, PPI network was built by the Cytoscape software
(version 3.3.0) (16). Finally, the
modules were selected using the plug-in Molecular Complex Detection
(MCODE), and the pathway analysis was conducted in the modules.
P<0.05 was considered as significant (16).
Validation of gene expression
In this study, GEPIA (http://gepia.cancer-pku.cn/) was used to verify the
reliability of the mRNA expression of genes (17). HPA database (https://www.proteinatlas.org/) was applied to confirm
the protein expression of genes between PCa and normal prostate
tissues based on immunohistochemistry (IHC) (17).
ROC analysis and survival
analysis
To assess the sensitivity and specificity of the key
genes for PCa diagnosis, ROC curves were created by GraphPad Prism
software (version 7.0, GraphPad Software, Inc.), based on the data
of GSE103512, and the area under the curve (AUC) was used to
evaluate the ROC effect (11). In
addition, GEPIA was used to further verify the prognostic value of
the genes (18).
Results
Identification of DEGs
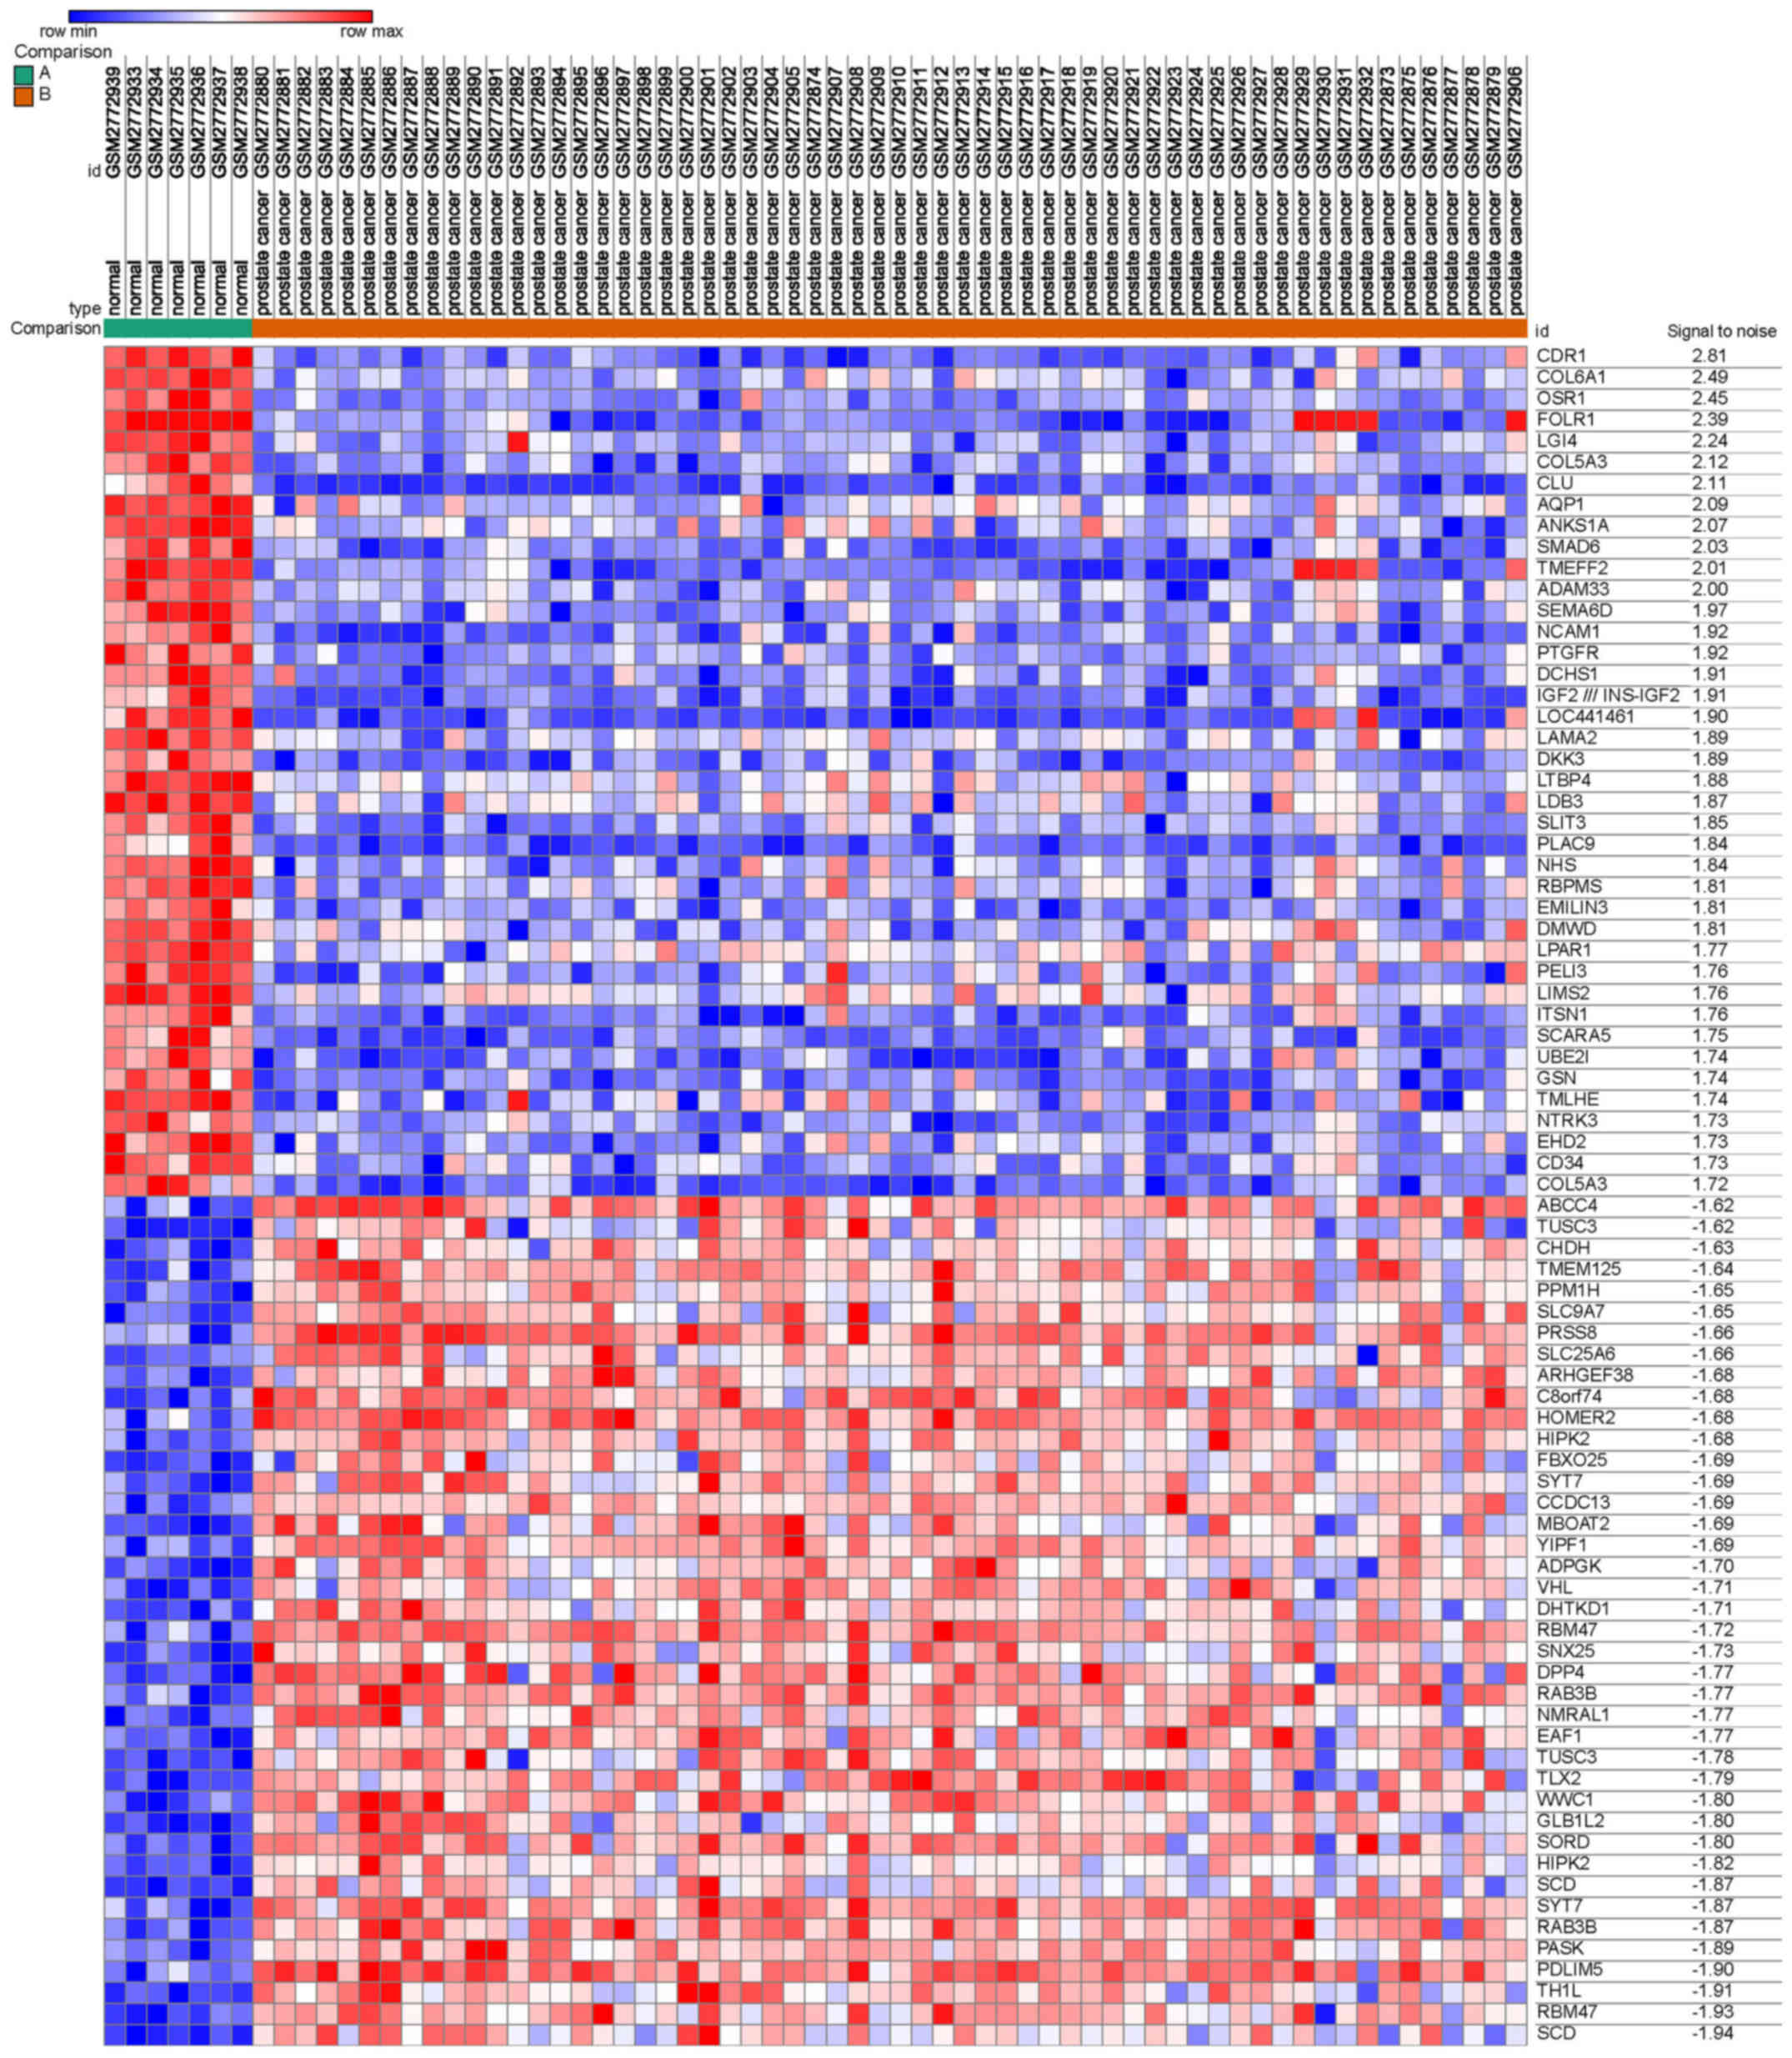
A total of 2,000 DEGs were screened from GSE103512,
including 1,000 upregulated and 1,000 downregulated genes,
comparing between PCa and normal prostate tissues. The heat map,
including the top 40 downregulated and 40 upregulated genes, is
presented in Fig. 1.
GO and KEGG pathway analysis
To delineate the function of the DEGs, GO and KEGG
pathway analyses were conducted. The results of GO analysis
indicated that the DEGs were mostly enriched in biological
processes, including ‘carboxylic acid catabolic process’, ‘negative
regulation of cell death’, ‘apoptotic process’, ‘cell
proliferation’ and ‘cell migration’ (Table I). For cell component, the DEGs were
mostly concentrated in ‘Golgi apparatus part’, ‘endoplasmic
reticulum’, ‘extracellular matrix’, ‘receptor complex’ and
‘anchoring junction’. For molecular function, the DEGs were mainly
concentrated in ‘coenzyme binding’, ‘transferase activity’,
‘transferring acyl groups’, ‘calcium ion binding’ and
‘phosphatidylserine binding’. In addition, the KEGG analysis
results suggested that the DEGs were mostly concentrated in
‘metabolic pathways’, ‘ECM-receptor interaction’, the ‘PI3K-Akt
pathway’, ‘pathways in cancer’ and ‘focal adhesion’ (Table II).
 | Table I.GO annotation of differentially
expressed genes in prostate cancer. |
Table I.
GO annotation of differentially
expressed genes in prostate cancer.
| A, Upregulated
genes |
|---|
|
|---|
| Category | Term/gene
function | Count | P-value |
|---|
| GOTERM_BP_FAT | Carboxylic acid
catabolic process | 14 |
2.3×10⁻⁶ |
| GOTERM_BP_FAT | Organic acid
catabolic process | 14 |
1.0×10⁻⁵ |
| GOTERM_BP_FAT | Oxoacid metabolic
process | 28 |
2.0×10⁻⁵ |
| GOTERM_BP_FAT | Cellular amino acid
metabolic process | 14 |
3.5×10⁻⁵ |
| GOTERM_BP_FAT | Small molecule
catabolic process | 15 |
2.2×10⁻⁴ |
| GOTERM_CC_FAT | Golgi apparatus
part | 34 |
4.5×10⁻⁷ |
| GOTERM_CC_FAT | Endoplasmic
reticulum | 42 |
2.1×10⁻⁴ |
| GOTERM_CC_FAT | Membrane-bounded
vesicle | 74 |
3.0×10⁻⁴ |
| GOTERM_CC_FAT | Extracellular
exosome | 60 |
5.9×10⁻⁴ |
| GOTERM_CC_FAT | Cell junction | 29 |
3.0×10⁻² |
| GOTERM_MF_FAT | Coenzyme
binding | 11 |
2.0×10⁻⁴ |
| GOTERM_MF_FAT | Transferase
activity, transferring acyl groups | 10 |
1.0×10⁻² |
| GOTERM_MF_FAT | Secondary active
transmembrane transporter activity | 9 |
1.4×10⁻² |
| GOTERM_MF_FAT | Ligase
activity | 12 |
2.3×10⁻² |
| GOTERM_MF_FAT | Cadherin
binding | 9 |
5.6×10⁻² |
|
| B, Downregulated
genes |
|
|
Category | Term/gene
function | Count | P-value |
|
| GOTERM_BP_FAT | Negative regulation
of cell death | 21 |
1.5×10⁻⁶ |
| GOTERM_BP_FAT | Apoptotic
process | 28 |
1.9×10⁻⁶ |
| GOTERM_BP_FAT | Cell
proliferation | 30 |
2.0×10⁻⁶ |
| GOTERM_BP_FAT | Regulation of
signal transduction | 39 |
5.3×10⁻⁶ |
| GOTERM_BP_FAT | Cell migration | 20 |
8.7×10⁻⁴ |
| GOTERM_CC_FAT | Extracellular
matrix | 14 |
3.9×10⁻⁵ |
| GOTERM_CC_FAT | Receptor
complex | 8 |
2.2×10⁻² |
| GOTERM_CC_FAT | Anchoring
junction | 9 |
4.5×10⁻² |
| GOTERM_CC_FAT | Cell surface | 11 |
5.8×10⁻² |
| GOTERM_CC_FAT | Adherens
junction | 8 |
8.4×10⁻² |
| GOTERM_MF_FAT | Calcium ion
binding | 14 |
9.3×10⁻⁴ |
| GOTERM_MF_FAT | Phosphatidylserine
binding | 4 |
1.4×10⁻³ |
| GOTERM_MF_FAT | Ion binding | 33 |
5.5×10⁻² |
| GOTERM_MF_FAT | Receptor
activity | 19 |
5.7×10⁻² |
| GOTERM_MF_FAT | Molecular
transducer activity | 19 |
5.7×10⁻² |
| Table II.KEGG pathway analysis of
differentially expressed genes in prostate cancer. |
Table II.
KEGG pathway analysis of
differentially expressed genes in prostate cancer.
| A, Upregulated
genes |
|---|
|
|---|
| KEGG term | Count | P-value | Genes |
|---|
| Metabolic
pathways | 39 |
2.5×10⁻⁶ | AGPAT3, DHCR24,
ABAT, DHCR7, ADPGK, ACLY, CDS1, GMDS, NANS, UAP1, ACACB, ADI1,
ACAD8, ACSL1, ALDH6A1, AKR1A1, CRLS1, CHDH, DCXR, DDOST, FASN,
GCNT2, GLUD2, HGD, MGAT4A, MOGS, MBOAT2, MCCC2, MTMR3, PLA2G12A,
PAFAH1B3, GALNT7, RDH11, SORD, SAT1, SMS, SYNJ2, TALDO1, TUSC3 |
| Amino sugar and
nucleotide sugar metabolism | 4 |
3.5×10⁻² | GMDS, NANS, UAP1,
PGM3 |
| Protein processing
in endoplasmic reticulum | 7 |
4.1×10⁻² | SEC13, SEC24A,
XBP1, DDOST, MOGS, MAPK9, TUSC3 |
| Glycerophospholipid
metabolism | 5 |
5.4×10⁻² | AGPAT3, CDS1,
CRLS1, MBOAT2, PLA2G12A |
| Adipocytokine
signaling pathway | 4 |
8.7×10⁻² | ACACB, ACSL1,
CAMKK2, MAPK9 |
|
| B, Downregulated
genes |
|
| KEGG
term | Count | P-value | Genes |
|
| ECM-receptor
interaction | 8 |
9.2×10⁻⁶ | COL4A5, COL5A3,
COL6A1, HSPG2, ITGB4, LAMA2, LAMA5, TNXB |
| PI3K-Akt signaling
pathway | 12 |
1.3×10⁻⁴ | ANGPT1, COL4A5,
COL5A3, COL6A1, FGF10, FGFR1, ITGB4, LAMA2, LAMA5, LPAR1, PTEN,
TNXB |
| Pathways in
cancer | 11 |
1.8×10⁻³ | ADCY5, COL4A5,
FGF10, FGFR1, LAMA2, LAMA5, LPAR1, PTEN, PML, PTGER3, TCF7L1 |
| Focal adhesion | 8 |
2.0×10⁻³ | COL4A5, COL5A3,
COL6A1, ITGB4, LAMA2, LAMA5, PTEN, TNXB |
| Regulation of
lipolysis in adipocytes | 4 |
1.2×10⁻² | ADCY5, NPR1,
PTGER3, PRKG1 |
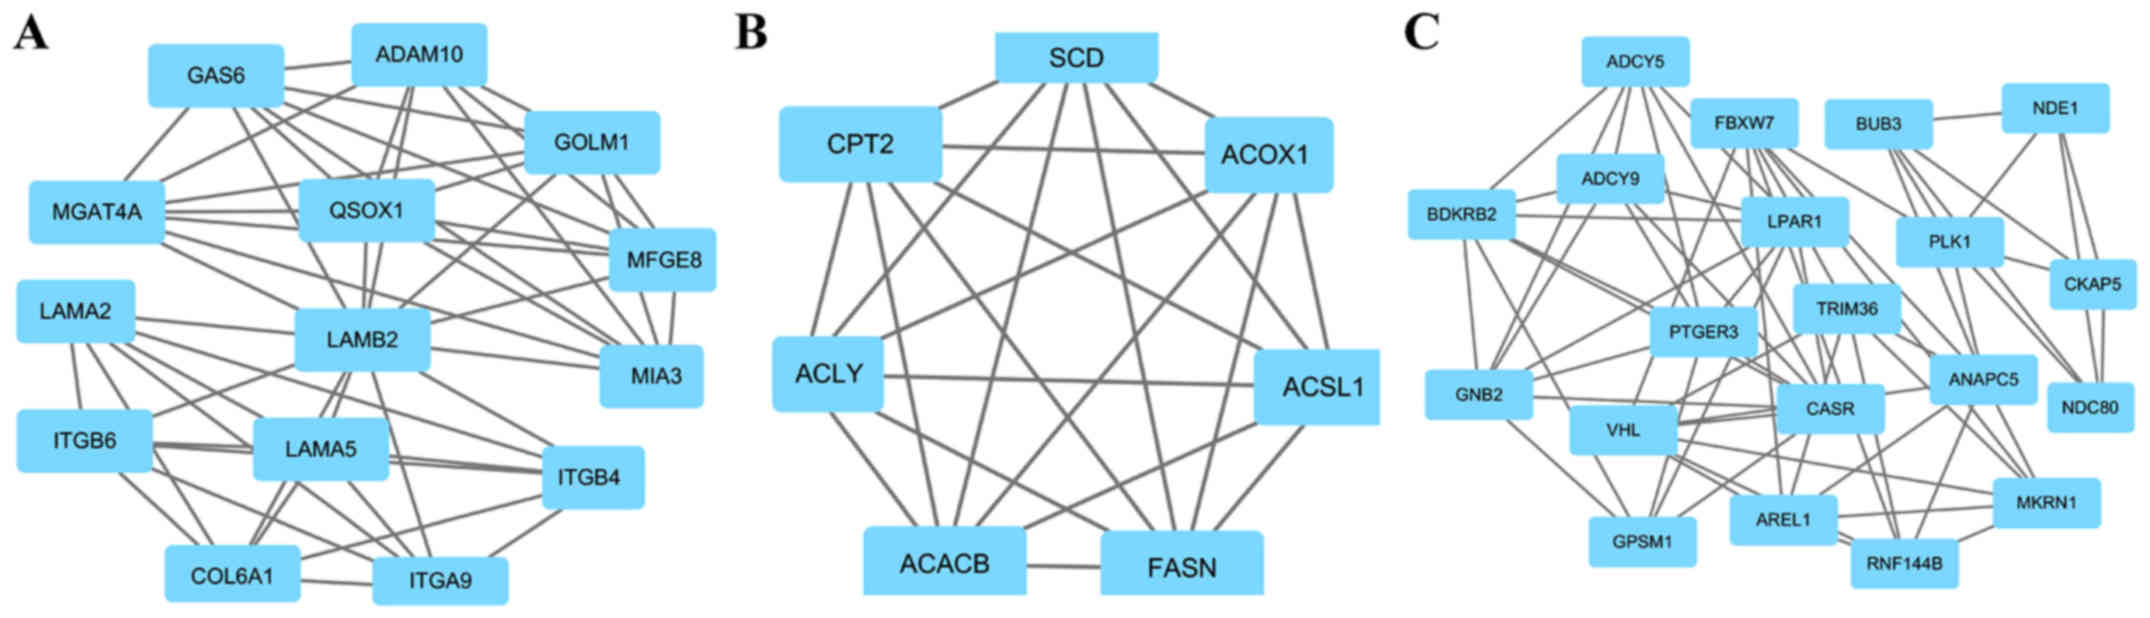
PPI analysis of DEGs
A total of four key genes with high degrees of
interaction were selected using the Cytoscape software. The key
genes included Golgi membrane protein 1 (GOLM1), melanoma
inhibitory activity member 3 (MIA3), ATP citrate lyase (ACLY) and G
protein subunit β2 (GNB2). Furthermore, the top three modules were
obtained using plug-ins MCODE analysis (Fig. 2). The results of enrichment analysis
revealed that the genes in the modules were associated with
‘ECM-receptor interaction’, ‘focal adhesion’, ‘PI3K-Akt pathway’,
‘PPAR pathway’, ‘AMPK pathway’, ‘metabolic pathways’, ‘pathways in
cancer’, ‘gap junction’ and ‘cell cycle’ (Table III).
| Table III.Enriched pathways in modules. |
Table III.
Enriched pathways in modules.
| Module | Gene set | FDR | Nodes |
|---|
| 1 | ECM-receptor
interaction |
1.94×10⁻¹² | GOLM1, MIA3, LAMA5,
ITGA9, LAMB2, ITGB6, MGAT4A, QSOX1, ITGB4, MFGE8, COL6A1, GAS6,
LAMA2, ADAM10 |
|
| Focal adhesion |
3.88×10⁻¹⁰ |
|
|
| PI3K-Akt signaling
pathway |
9.34×10−09 |
|
| 2 | PPAR signaling
pathway |
6.92×10−08 | ACLY, ACSL1, CPT2,
ACOX1, ACACB, FASN, SCD |
|
| AMPK signaling
pathway |
3.16×10−05 |
|
|
| Metabolic
pathways |
6.41×10−05 |
|
| 3 | Pathways in
cancer |
3.63×10−05 | GNB2, ADCY5,
ANAPC5, BUB3, CASR, NDC80, PLK1, |
|
| Gap junction |
1.4×10−04 | VHL, RNF144B,
AREL1, PTGER3, NDE1, GPSM1, TRIM36, |
|
| Cell cycle |
1.5×10−04 | FBXW7, LPAR1,
ADCY9, CKAP5, MKRN1, BDKRB2 |
Validation of key genes
expression
The expression of key genes was identified by GEPIA
and HPA analysis. The results of GEPIA analysis suggested that the
mRNA expression of MIA3 and GNB2 was slightly upregulated in PCa
(P>0.05), and the expression of GOLM1 and ACLY was upregulated
significantly (P<0.05). In addition, IHC results from HPA showed
that GOLM1 and ACLY expression was upregulated significantly in PCa
compared with that in normal prostate tissues (Fig. 3).
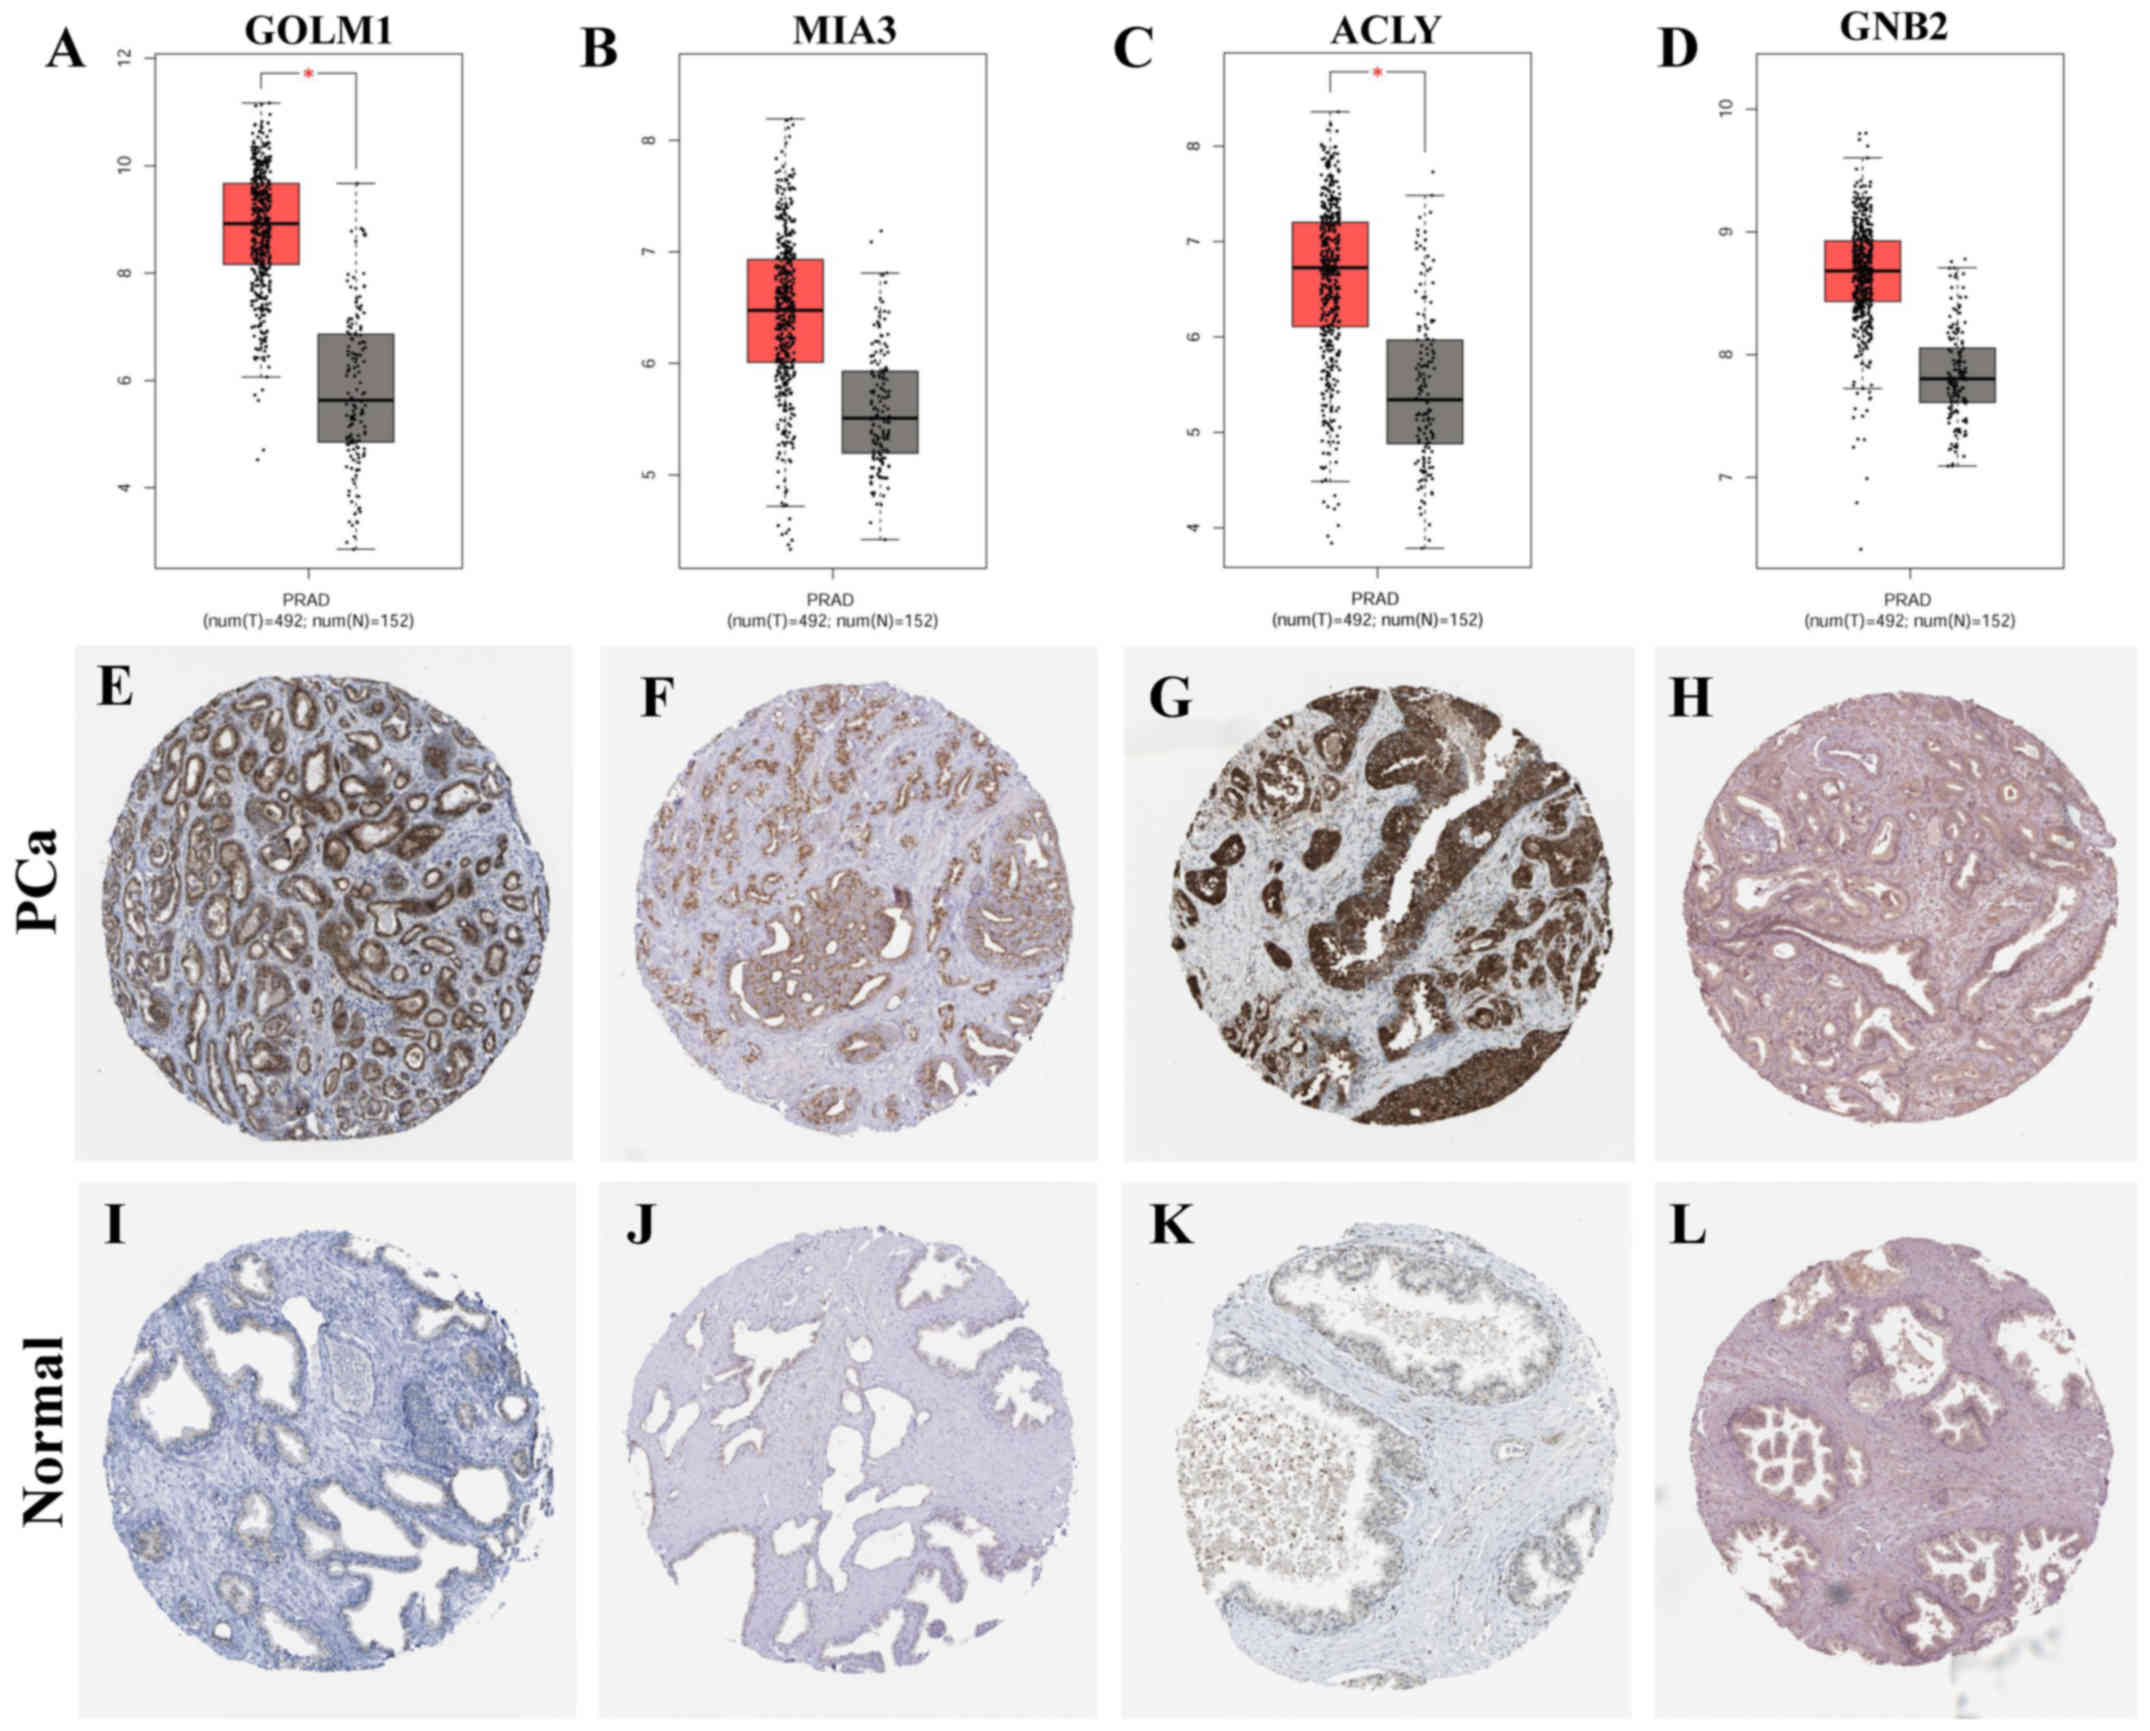 | Figure 3.Expression of key genes in prostate
cancer and normal prostate tissues. (A-D) The mRNA expression of
the key genes was obtained from GEPIA (http://gepia.cancer-pku.cn/), including (A) GOLM1
(http://gepia.cancer-pku.cn/detail.php?gene=GOLM1),
(B) MIA3 (http://gepia.cancer-pku.cn/detail.php?gene=MIA3),
(C) ACLY (http://gepia.cancer-pku.cn/detail.php?gene=ACLY)
and (D) GNB2 (http://gepia.cancer-pku.cn/detail.php?gene=GNB2).
Red data columns represent prostate cancer; black data columns
represent normal prostate tissues; T, tumor; N, normal. (E-L)
Immunohistochemistry images of protein expression of genes were
obtained from the Human Protein Atlas (https://www.proteinatlas.org/), including (E) GOLM1
(https://www.proteinatlas.org/ENSG00000135052-GOLM1/pathology/tissue/prostate+cancer#img),
(F) MIA3 (https://www.proteinatlas.org/ENSG00000154305-MIA3/pathology/tissue/prostate+cancer#img),
(G) ACLY (https://www.proteinatlas.org/ENSG00000131473-ACLY/pathology/tissue/prostate+cancer#img)
and (H) GNB2 (https://www.proteinatlas.org/ENSG00000172354-GNB2/pathology/tissue/prostate+cancer#img)
in prostate cancer tissues, and (I) GOLM1 (https://www.proteinatlas.org/ENSG00000135052-GOLM1/tissue/prostate),
(J) MIA3 (https://www.proteinatlas.org/ENSG00000154305-MIA3/tissue/prostate),
(K) ACLY (https://www.proteinatlas.org/ENSG00000131473-ACLY/tissue/prostate)
and (L) (https://www.proteinatlas.org/ENSG00000172354-GNB2/tissue/prostate)
in control tissues. Magnification, ×40. *P<0.05. PRAD, prostate
cancer; control, normal prostate tissues; GOLM1, Golgi membrane
protein 1; MIA3, melanoma inhibitory activity member 3; ACLY, ATP
citrate lyase; GNB2, G protein subunit β2. |
Identification of key genes for
diagnosis and prognosis of PCa
To evaluate the potential efficiency of these four
genes as diagnostic biomarkers, ROC curves were prepared. AUC
values of GOLM1, MIA3, ACLY and GNB2 were >0.85, suggesting that
these four genes had high sensitivity and specificity for PCa
diagnosis (Fig. 4A-D). These results
indicated that GOLM1, MIA3, ACLY and GNB2 may be used as biomarkers
for the diagnosis of PCa.
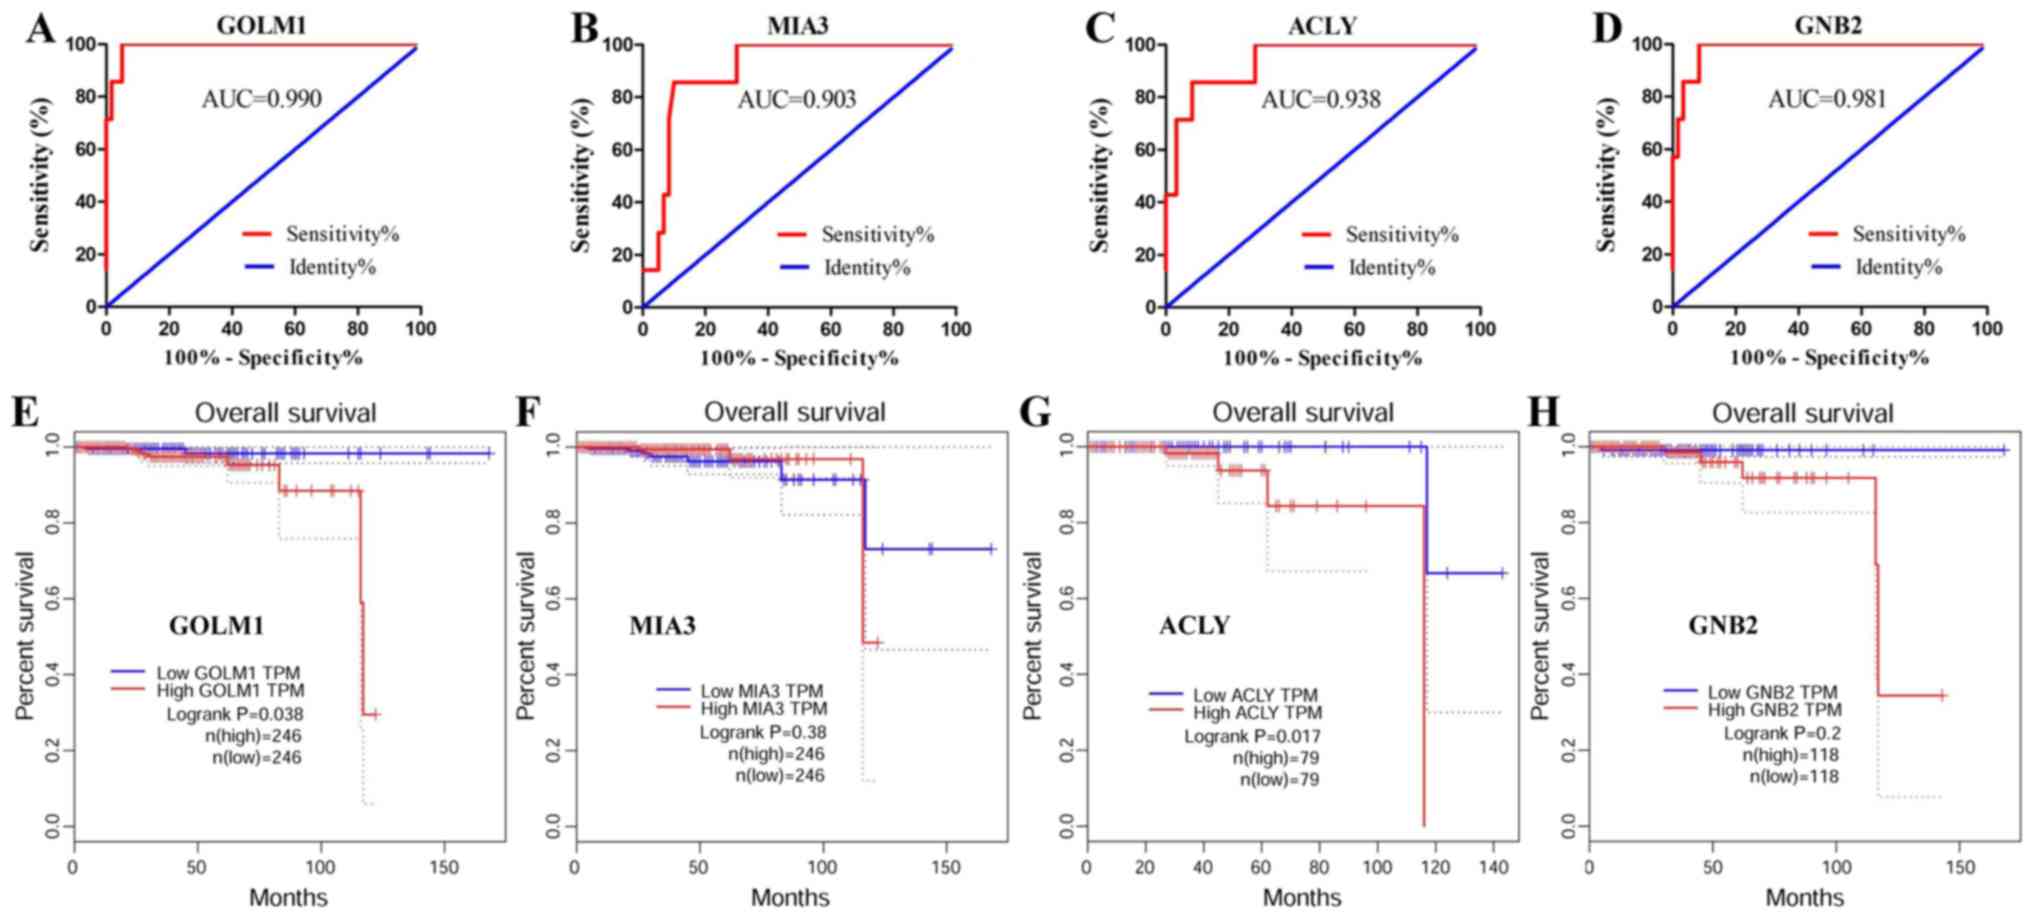 | Figure 4.Identification of key genes for the
diagnosis and prognosis of PCa. ROC analysis of the top four key
genes was performed in PCa and normal prostate tissues. Survival
curves were prepared for patients with PCa based on GEPIA data. ROC
curve of (A) GOLM1, (B) MIA3, (C) ACLY and (D) GNB2 genes. Survival
curve of (E) GOLM1, (F) MIA3, (G) ACLY and (H) GNB2. AUC, area
under the curve; PCa, prostate cancer; control, normal prostate
tissues; GOLM1, Golgi membrane protein 1; MIA3, melanoma inhibitory
activity member 3; ACLY, ATP citrate lyase; GNB2, G protein subunit
β2; ROC, receiver operating characteristics; GEPIA, Gene Expression
Profiling Interactive Analysis. |
Survival analysis of the key genes
conducted using GEPIA data
The results demonstrated that GOLM1 and ACLY were
significantly associated with the prognosis of patients
(P<0.05), and high expression of these genes was associated with
a poor prognosis (Fig. 4E-H). The
data suggested that GOLM1 and ACLY may serve as candidate
biomarkers for the prognosis of PCa.
Discussion
PCa is the most prevalent cancer in males, and an
early diagnosis is difficult (1,2).
Therefore, novel diagnostic and prognostic biomarkers need to be
further examined. In the present study, GSE103512 was downloaded
and 2,000 DEGs were screened using bioinformatics analysis. The
results of GO and KEGG analyses revealed that the DEGs were mostly
enriched in ‘carboxylic acid catabolic process’, ‘cell apoptosis’,
‘cell proliferation’ and ‘cell migration’. PPI analysis indicated
that GOLM1, MIA3, ACLY and GNB2 were the key genes with high
degrees. The results of GEPIA and HPA analysis showed the
expression of GOLM1 and ACLY was upregulated in PCa tissues. ROC
analysis and survival analysis suggested that GOLM1 and ACLY may be
used as biomarkers for the diagnosis and prognosis of PCa.
Morpheus is a useful online tool for analyzing gene
expression that could be used to select DEGs (16). Therefore, GSE103512 was downloaded
and analyzed by Morpheus in the present study. The results showed
that 2,000 DEGs were screened, including 1,000 upregulated and
1,000 downregulated genes, in PCa compared with normal prostate
tissues. A previous study has revealed that co-expressed genes are
associated by similar biological function and signaling pathways
(9). As a result, GO and KEGG
analysis was further performed.
GO analysis indicated that the DEGs were mostly
enriched in ‘carboxylic acid catabolic process’, ‘cell apoptosis’,
‘cell proliferation’ and ‘cell migration’ (Table I). These results indicated that the
dysregulation of cell proliferation and cell migration was an
important factor in the occurrence and metastasis of cancer
(19,20). KEGG analysis indicated that the DEGs
were mostly concentrated in ‘metabolic pathways’, ‘ECM-receptor
interaction’, the ‘PI3K-Akt pathway’ and ‘focal adhesion’ (Table II). Previous studies reported that
cancer metabolism has emerged as an indispensable process of
tumorigenesis (21,22). Recent studies demonstrated that
‘ECM-receptor interaction’ and ‘focal adhesion’ were associated
with tumor occurrence and metastasis (23,24).
Furthermore, another study implied that the ‘PI3K-Akt pathway’
served an important role in PCa progression (25).
PPI analysis was also performed in the present study
and the following key genes with high degrees of interaction were
found: GOLM1, MIA3, ACLY and GNB2. GOLM1 was the first identified
key gene, and its functional role and molecular mechanism are
unclear. Consistent with the present study, the study by Varambally
et al (26) also reported
that GOLM1 was upregulated in PCa tissues. It was further reported
that GOLM1 may be secreted out of the cell by exosomes, which could
be tested in the urine of patients with PCa (26). As a result, GOLM1 may act as a
potential diagnostic biomarker of PCa. In addition, Yan et
al (1) reported that GOLM1 could
promote PCa progression by activating the PI3K-Akt pathway. Other
studies also demonstrated that GOLM1 acted as a pivotal oncogene,
involved in tumor cell migration and invasion in esophageal cancer
(27) and hepatocellular carcinoma
(28). These data suggested that
GOLM1 may serve as a potential therapeutic target.
The second key gene identified in the present study
was MIA3, which is an endoplasmic reticulum-resident protein
(29). To the best of our knowledge,
the study of MIA3 in cancer is limited. Arndt and Bosserhoff
(30) reported that MIA3 may serve
as a tumor suppressor of malignant melanoma. Gao et al
(29) reported that miR-222 promoted
migration through MIA3 in colorectal cancer cells. In the present
study, the expression of MIA3 was elevated, which indicated that it
may serve different functions in PCa compared with other tumors.
The relevant underlying mechanism, however, requires further
examination.
The third identified key gene was ACLY, which has
been suggested to catalyze the formation of acetyl-CoA (31). To the best of our knowledge, ACLY has
not been reported in PCa, but has been reported in other types of
tumors. A previous study reported that ACLY serves a critical role
in tumorigenesis, and downregulation of ACLY expression may inhibit
tumor cell proliferation in numerous types of cancer, such as lung,
breast and bladder cancer (32). In
addition, other studies further reported that inhibition of ACLY
reversed the process of epithelial-mesenchymal transition in
bronchial epithelial cells and non-small cell lung carcinoma cells
(31,33). Therefore, it was speculated that ACLY
may serve as a key oncogene promoting the occurrence and metastasis
of PCa.
The fourth identified key gene was GNB2, a member of
the guanine nucleotide-binding proteins family. To the best of our
knowledge, the related studies of GNB2 in cancer were limited.
Kotani et al (34) reported
that both mutation and overexpression of GNB2 could induce
leukemogenesis, and it was indicated that the decrease of GNB2
expression reduced tumor cell proliferation. Akinori et al
(35) reported that GNB2 mutations
can activate the canonical signaling pathway and confer resistance
to targeted kinase inhibitors in numerous types of cancer, such as
acute myeloid leukemia and melanoma. To the best of our knowledge,
the present study is the first to suggest that GNB2 was involved in
PCa; however, the underlying mechanism requires further
investigation. In addition, module analysis of PPI revealed that
the genes in the three modules were associated with ‘ECM-receptor
interaction’, ‘focal adhesion’, ‘PI3K-Akt pathway’, ‘AMPK pathway’,
‘metabolic pathway’, ‘pathways in cancer’, ‘gap junction’ and ‘cell
cycle’. These results were consistent with the GO and KEGG
analysis.
GEPIA is a newly developed database including the
data from The Cancer Genome Atlas and Genotype Tissue Expression
projects (17). HPA is also a useful
database for analysis of protein expression of genes between cancer
tissues and normal tissues based on IHC (17). In the present study, GEPIA and HPA
were used to identify the expression of key genes. The results
showed that the expression of MIA3 and GNB2 was insignificantly
upregulated in PCa compared with normal prostate tissues, and GOLM1
and ACLY expression was upregulated significantly. These results
were matched with the bioinformatics analysis.
ROC and survival analyses were performed to evaluate
the potential efficiency of these key genes as diagnostic and
prognostic biomarkers. The results of ROC analysis showed that the
AUC values of these genes were all >0.85. An AUC value >0.5
suggested the matter measured would yield significant distinction
between the two groups (36,37). Therefore, the results indicated that
GOLM1, MIA3, ACLY and GNB2 had high sensitivity and specificity,
and that they may be used as biomarkers for PCa diagnosis. The
result of the survival analysis showed that high expression of
GOLM1 and ACLY were associated with poor overall survival in
patients with PCa, which indicated that these genes may serve as
candidate biomarkers for the prognosis of PCa.
In summary, this study identified GOLM1 and ACLY in
PCa, which may serve as potential diagnostic and prognostic
biomarkers of PCa. It should be noted that this research was based
on bioinformatics analysis. Therefore, relevant clinical studies
are required, such as detection of the expression of the
aforementioned genes in circulating tumor cells. In addition, the
molecular mechanism of these genes will also be further studied to
elucidate their role in the occurrence and metastasis of PCa.
Acknowledgements
Not applicable.
Funding
The study was supported by the Natural Science
Foundation of Shandong Province (grant nos. ZR2014CL034 and
ZR2018MC015), the Medical and Health Development Plan of Shandong
Province (grant no. 2017WS058) and the Research and Development
Plan of University in Shandong Province (grant no. J18KA120).
Availability of data and materials
All data generated or analyzed during this study are
included in this published article. The mRNA expression profile of
the GSE103512 dataset was downloaded from Gene Expression Omnibus
(GEO) (http://www.ncbi.nlm.nih.gov/geo).
Authors' contributions
WF, ZFP and ZG designed the experiments and wrote
the paper. QZ, XY, ZWP, YC, SH and GG analyzed the data.. All
authors read and approved the final manuscript.
Ethics approval and consent to
participate
Not applicable.
Patient consent for publication
Not applicable.
Competing interests
The authors declare that they have no competing
interests.
References
|
1
|
Yan G, Ru Y, Wu K, Yan F, Wang Q, Wang J,
Pan T, Zhang M, Han H, Li X and Zou L: GOLM1 promotes prostate
cancer progression through activating PI3K-AKT-mTOR signaling.
Prostate. 78:166–177. 2018. View Article : Google Scholar : PubMed/NCBI
|
|
2
|
Zhao H, Zhao X, Lei T and Zhang M:
Screening, identification of prostate cancer urinary biomarkers and
verification of important spots. Invest New Drugs. Jan 4–2019.(Epub
ahead of print). View Article : Google Scholar
|
|
3
|
Siegel RL, Miller KD and Jemal A: Cancer
statistics, 2018. CA Cancer J Clin. 68:7–30. 2018. View Article : Google Scholar : PubMed/NCBI
|
|
4
|
Kudryavtseva AV, Lukyanova EN, Kharitonov
SL, Nyushko KM, Krasheninnikov AA, Pudova EA, Guvatova ZG, Alekseev
BY, Kiseleva MV, Kaprin AD, et al: Bioinformatic identification of
differentially expressed genes associated with prognosis of locally
advanced lymph node-positive prostate cancer. J Bioinform Computat
Biol. 17:19500032019. View Article : Google Scholar
|
|
5
|
Gadzinski AJ and Cooperberg MR: Prostate
cancer markers. Cancers Treat Res. 175:55–86. 2018. View Article : Google Scholar
|
|
6
|
Fujita K and Nonomura N: Urinary
biomarkers of prostate cancer. Int J Urol. 25:770–779. 2018.
View Article : Google Scholar : PubMed/NCBI
|
|
7
|
Thompson IM, Pauler DK, Goodman PJ, Tangen
CM, Lucia MS, Parnes HL, Minasian LM, Ford LG, Lippman SM, Crawford
ED, et al: Prevalence of prostate cancer among men with a
prostate-specific antigen level < or =4.0 ng per milliliter. N
Engl J Med. 350:2239–2246. 2004. View Article : Google Scholar : PubMed/NCBI
|
|
8
|
Kulasingam V and Diamandis EP: Strategies
for discovering novel cancer biomarkers through utilization of
emerging technologies. Nat Clin Pract Oncol. 5:588–599. 2008.
View Article : Google Scholar : PubMed/NCBI
|
|
9
|
Liang B, Li C and Zhao J: Identification
of key pathways and genes in colorectal cancer using bioinformatics
analysis. Med Oncol. 33:1112016. View Article : Google Scholar : PubMed/NCBI
|
|
10
|
Lascorz J, Hemminki K and Försti A:
Systematic enrichment analysis of gene expression profiling studies
identifies consensus pathways implicated in colorectal cancer
development. J Carcinog. 10:72011. View Article : Google Scholar : PubMed/NCBI
|
|
11
|
Cheng Y, Wang K, Geng L, Sun J, Xu W, Liu
D, Gong S and Zhu Y: Identification of candidate diagnostic and
prognostic biomarkers for pancreatic carcinoma. EBioMedicine.
40:382–393. 2019. View Article : Google Scholar : PubMed/NCBI
|
|
12
|
Shinichi Y, Sian J, Ivana B, Antal T,
Leary R, Fu B, Kamiyama M, Hruban RH, Eshleman JR, Nowak MA, et al:
Distant metastasis occurs late during the genetic evolution of
pancreatic cancer. Nature. 467:1114–1117. 2010. View Article : Google Scholar : PubMed/NCBI
|
|
13
|
Brouwer-Visser J, Cheng WY, Bauer-Mehren
A, Maisel D, Lechner K, Andersson E, Dudley JT and Milletti F:
Regulatory T-cell genes drive altered immune microenvironment in
adult solid cancers and allow for immune contextual patient
subtyping. Cancer Epidemiol Biomarkers Prev. 27:103–112. 2018.
View Article : Google Scholar : PubMed/NCBI
|
|
14
|
Mi B, Liu G, Zhou W, Lv H, Liu Y and Liu
J: Identification of genes and pathways in the synovia of women
with osteoarthritis by bioinformatics analysis. Mol Med Rep.
17:4467–4473. 2018.PubMed/NCBI
|
|
15
|
Franceschini A, Szklarczyk D, Frankild S,
Kuhn M, Simonovic M, Roth A, Lin J, Minguez P, Bork P, von Mering C
and Jensen LJ: STRING v9.1: Protein-protein interaction networks,
with increased coverage and integration. Nucleic Acids Res.
41((Database Issue)): D808–D815. 2013.PubMed/NCBI
|
|
16
|
Fan S, Liang Z, Gao Z, Pan Z, Han S, Liu
X, Zhao C, Yang W, Pan Z and Feng W: Identification of the key
genes and pathways in prostate cancer. Oncol Lett. 16:6663–6669.
2018.PubMed/NCBI
|
|
17
|
Zhang B, Wu Q, Wang Z, Xu R, Hu X, Sun Y,
Wang Q, Ju F, Ren S, Zhang C, et al: The promising novel biomarkers
and candidate small molecule drugs in kidney renal clear cell
carcinoma: Evidence from bioinformatics analysis of highthroughput
data. Mol Genet Genomic Med. 7:e6072019. View Article : Google Scholar : PubMed/NCBI
|
|
18
|
Jin Q, Dai Y, Wang Y, Zhang S and Liu G:
High kinesin family member 11 expression predicts poor prognosis in
patients with clear cell renal cell carcinoma. J Clin Pathol.
72:354–362. 2019. View Article : Google Scholar : PubMed/NCBI
|
|
19
|
Perez R, Wu N, Klipfel AA and Beart RW Jr:
A better cell cycle target for gene therapy of colorectal cancer:
Cyclin G. J Gastroint Surg. 7:884–889. 2003. View Article : Google Scholar
|
|
20
|
Tsunoda T, Nakamura T, Ishimoto K, Yamaue
H, Tanimura H, Saijo N and Nishio K: Upregulated expression of
angiogenesis genes and down regulation of cell cycle genes in human
colorectal cancer tissue determined by cDNA macroarray. Anticancer
Res. 21:137–143. 2001.PubMed/NCBI
|
|
21
|
Dong W, Keibler MA and Stephanopoulos G:
Review of metabolic pathways activated in cancer cells as
determined through isotopic labeling and network analysis. Metab
Eng. 43:113–124. 2017. View Article : Google Scholar : PubMed/NCBI
|
|
22
|
Zarrinpar A: Metabolic pathway inhibition
in liver cancer. SLAS Technol. 22:237–244. 2017.PubMed/NCBI
|
|
23
|
Zhang HJ, Tao J, Sheng L, Hu X, Rong RM,
Xu M and Zhu TY: Twist2 promotes kidney cancer cell proliferation
and invasion by regulating ITGA6 and CD44 expression in the
ECM-receptor interaction pathway. OncoTargets Ther. 9:1801–1812.
2016.
|
|
24
|
Eke I and Cordes N: Focal adhesion
signaling and therapy resistance in cancer. Semin Cancer Biol.
31:65–75. 2015. View Article : Google Scholar : PubMed/NCBI
|
|
25
|
Yang L, Zha TQ, He X, Chen L, Zhu Q, Wu
WB, Nie FQ, Wang Q, Zang CS, Zhang ML, et al: Placenta-specific
protein 1 promotes cell proliferation and invasion in non-small
cell lung cancer. Oncol Rep. 39:53–60. 2018.PubMed/NCBI
|
|
26
|
Varambally S, Laxman B, Mehra R, Cao Q,
Dhanasekaran SM, Tomlins SA, Granger J, Vellaichamy A, Sreekumar A,
Yu J, et al: Golgi protein GOLM1 is a tissue and urine biomarker of
prostate cancer. Neoplasia. 10:1285–1294. 2008. View Article : Google Scholar : PubMed/NCBI
|
|
27
|
Byrne AM, Bekiaris S, Duggan G, Prichard
D, Kirca M, Finn S, Reynolds JV, Kelleher D and Long A: Golgi
phosphoprotein 2 (GOLPH2) is a novel bile acid-responsive modulator
of oesophageal cell migration and invasion. Br J Cancer.
113:1332–1342. 2015. View Article : Google Scholar : PubMed/NCBI
|
|
28
|
Ye QH, Zhu WW, Zhang JB, Qin Y, Lu M, Lin
GL, Guo L, Zhang B, Lin ZH, Roessler S, et al: GOLM1 modulates
EGFR/RTK cell-surface recycling to drive hepatocellular carcinoma
metastasis. Cancer Cell. 30:444–458. 2016. View Article : Google Scholar : PubMed/NCBI
|
|
29
|
Gao H, Cong X, Zhou J and Guan M:
MicroRNA-222 influences migration and invasion through MIA3 in
colorectal cancer. Cancer Cell Int. 17:78–87. 2017. View Article : Google Scholar : PubMed/NCBI
|
|
30
|
Arndt S and Bosserhoff AK: TANGO is a
tumor suppressor of malignant melanoma. Int J Cancer.
119:2812–2820. 2010. View Article : Google Scholar
|
|
31
|
Fu Y, Lu R, Cui J, Sun H, Yang H, Meng Q,
Wu S, Aschner M, Li X and Chen R: Inhibition of ATP citrate lyase
(ACLY) protects airway epithelia from PM2.5-induced
epithelial-mesenchymal transition. Ecotoxicol Environmen Saf.
167:309–316. 2019. View Article : Google Scholar
|
|
32
|
Icard P and Lincet H: The reduced
concentration of citrate in cancer cells: An indicator of cancer
aggressiveness and a possible therapeutic target. Drug Resist
Updat. 29:47–53. 2016. View Article : Google Scholar : PubMed/NCBI
|
|
33
|
Hanai J, Doro N, Sasaki AT, Kobayashi S,
Cantley LC, Seth P and Sukhatme VP: Inhibition of lung cancer
growth: ATP citrate lyase knockdown and statin treatment leads to
dual blockade of mitogen-activated protein kinase (MAPK) and
phosphatidylinositol-3-kinase (PI3K)/AKT pathways. J Cell Physiol.
227:1709–1720. 2012. View Article : Google Scholar : PubMed/NCBI
|
|
34
|
Kotani S, Yoda A, Kon A, Kataoka K, Ochi
Y, Shiozawa Y, Hirsch C, Takeda J, Ueno H, Yoshizato T, et al:
Molecular pathogenesis of disease progression in MLL-rearranged
AML. Leukemia. 33:612–624. 2019. View Article : Google Scholar : PubMed/NCBI
|
|
35
|
Yoda A, Adelmant G, Tamburini J, Chapuy B,
Shindoh N, Yoda Y, Weigert O, Kopp N, Wu SC, Kim SS, et al:
Mutations in G protein β subunits promote transformation and kinase
inhibitor resistance. Nat Med. 21:71–75. 2015. View Article : Google Scholar : PubMed/NCBI
|
|
36
|
Arthurs C, Murtaza BN, Thomson C, Dickens
K, Henrique R, Patel HRH, Beltran M, Millar M, Thrasivoulou C and
Ahmed A: Expression of ribosomal proteins in normal and cancerous
human prostate tissue. PLoS One. 12:e01860472017. View Article : Google Scholar : PubMed/NCBI
|
|
37
|
Fawcett T: An introduction to ROC
analysis. Pattern Recog Lett. 27:861–874. 2006. View Article : Google Scholar
|