Introduction
Acute lymphoblastic leukemia (ALL) is the most
common malignancy of childhood cancer. Treatment of pediatric ALL
is effective as chemotherapy results in the treatment of >80–85%
ALL pediatric patients (1–4). Nevertheless, a total of 20–30% of
pediatric patients will ultimately relapse and succumb to the
disease. Residual leukemia stem cells (LSCs) are chemoresistant
cells, which are able to escape from immune surveillance. These
abilities may be responsible for therapeutic failure and relapse of
ALL (5). LSCs may be regulated by
bone marrow mesenchymal stem cells (BM-MSCs), which in turn may
improve the survival of LSCs by providing the necessary cytokines
and cell contact-mediated signals. For instance, previous
experimental data indicated that LSCs accumulated in close
association with BM-MSCs, which might regulate their proliferation,
differentiation and chemoresistance (6). Therefore, it is critical to further
understand the association between LSCs and BM-MSCs.
The finding of ‘donor cell leukemia’ (DCL) confirms
the important role of the hematopoietic microenvironment in
hematopoietic stem cell regulation (7). BM-MSCs, an important component of the
BM environment, act as hematopoietic regulators through producing
cytokines, chemokines, adhesion molecules and extracellular matrix
molecules. BM-MSCs are also considered as a major source for the
secretion of the homeostatic chemokine, stromal cell-derived factor
1 (SDF-1) also known as C-X-C motif chemokine 12 (CXCL12), which
serves a critical role as a homing signal of circulating HSCs, and
in the regulation of immune responses (8). However, whether LSC may influence the
hematopoietic microenvironment remains poorly studied. In the
present study, CD34+ cells were isolated from Nalm-6 cells and used
as LSCs in further experiments. CD34 protein is used as a surface
marker to identify hematopoietic stem cells and LSCs (9). Subsequently, the effect of LSCs
stimulation on immunophenotype and expression of hematopoietic
genes in BM-MSCs was evaluated. A gene sequencing method was used
to detect the changes of gene expression levels in MSCs induced by
LSCs.
Materials and methods
Cell cultures
The human pre-B cell leukemia Nalm-6 cell line, was
supplied by The American Type Culture Collection and was cultured
in RPMI-1640 medium (Gibco; Thermo Fisher Scientific, Inc.)
supplemented with 10% fetal bovine serum (FBS; Gibco; Thermo Fisher
Scientific, Inc.), 100 U/ml penicillin G and 100 mg/ml streptomycin
at 37°C in a humidified 5% CO2 incubator. Human BM-MSCs
were purchased from ScienCell Research Laboratories, Inc. and
cultured in low-glucose DMEM (Gibco; Thermo Fisher Scientific,
Inc.) supplemented with 10%, 100 U/ml penicillin G and 100 mg/ml
streptomycin at 37°C in a humidified 5% CO2
incubator.
CD34 positive B-lineage LSCs
enrichment
CD34 protein was used as a surface marker to
identify LSCs in Nalm-6. CD34 positive cells were isolated from
Nalm-6 cells through immunomagnetic bead-positive selection using a
CD34+ MicroBead kit (Miltenyi Biotech, Inc.) according
to the manufacturer's instructions to a purity of 90–96% as
determined by flow cytometry. Purity was confirmed by flow
cytometry with anti-CD34 (dilution 1:10, phycoerythrin-labeled;
cat. No. 550761; BD Pharmingen) and was >95% in all
experiments.
Co-culture of LSCs with BM-MSCs
To study the effect of Nalm-6 cell stimulation on
BM-MSCs, LSCs were co-cultured with an adherent monolayer of
BM-MSCs at a 10:1 ratio for 24–72 h. To perform co-culture
experiments, continuous culture of BM-MSCs was maintained and
plated at a concentration of 1×10⁵ cells/well, 24 h
before adding LSC cells at a concentration of 1×10⁶
cells/well. Although LSCs are constantly interacting with stroma,
these lymphocytes do not adhere to plastic or to BM-MSCs.
Co-cultured LSCs were carefully separated from BM-MSCs monolayer by
pipetting with ice-cold PBS, leaving the adherent BM-MSCs layer
undisturbed. Subsequently, BM-MSCs were trypsinized and used for
transcriptome sequencing, and pharmacological and biochemical end
points.
Detection of BM-MSCs immune-phenotype
using flow cytometry
BM-MSCs and BM-MSCsLSC were collected and
treated with 0.25% trypsin. The cells were individually stained
with fluorescein isothiocyanate or phycoerythrin-conjugated
anti-marker monoclonal antibodies in 100 µl PBS for 15 min at room
temperature or for 30 min at 4°C, as recommended by the
manufacturer. The antibodies used were specific for the human
antigens, CD29 (cat. No. 557332), CD31 (cat. No. 560983), CD34
(Cat. 550761), CD44 (Cat. 562818), CD45 (cat. No. 560975), CD73
(cat. No. 562430), CD90 (cat. No. 561970), and CD105 (cat. No.
560839; all at 1:10; all from BD Pharmingen). Cells were analyzed
on a flow cytometry system (Guava easyCyte8HT; EMD Millipore) with
the Guava Incyte software (version 2.8; EMD Millipore). Positive
cells were counted and the signals for the corresponding
immunoglobulin isotypes were compared.
Transcriptome sample preparation and
sequencing
Total RNA was isolated from BM-MSCs using
TRIzol® (Ambion, RNA Life Technologies) according to the
manufacturer's procedures. RNA integrity was assessed using the
RNA6000 Pico assay kit on the Bioanalyzer 2100 system (Agilent
Technologies, Inc.). Sequencing libraries were generated using the
Illumina TruSeq™ RNA sample preparation kit (Illumina, Inc.)
following the manufacturer's recommendations and 4 index codes were
added to attribute sequences to each sample. The clustering of the
index-coded samples was performed on a cBot Cluster Generation
system using TruSeq PE Cluster kit v3-cBot-HS (Illumina, Inc.)
according to the manufacturer's instructions. After cluster
generation, the library preparations were sequenced on an Illumina
Hiseq2000 platform and 100 bp paired-end reads were generated.
Sequencing data analysis
Quality control: Raw data (raw reads) in the fastq
format were firstly processed through in-house perl script.
Differential expression analysis of two conditions/groups (two
biological replicates per condition) was performed using the DESeq
R package (version 1.10.1) (10).
DESeq provides statistica1 routines for determining differentia1
expression in digital gene expression data using a model based on
the negative binomial distribution. The resulting P-values were
adjusted using the Benjamini and Hochberg approach for controlling
the fake discovery rate. Genes with an adjusted P-value <0.05
found by DESeq were assigned as differentially expressed.
Differential expression analysis of two conditions was performed
using the DEGSeq R package (version 1.12.0) (11). The P-values were adjusted using the
Benjamini and Hochberg method. Corrected P-value of <0.005 and
1og 2 (fold-change) of 1 were set as the threshold for
significantly differential expression.
RNA isolation and
reverse-transcription quantitative PCR (RT-qPCR)
RT-qPCR analysis was performed to confirm the
expression profiles obtained from RNA sequencing. Total cellular
RNA was isolated from BM-MSCs and BM-MSCsLSC using
TRIzol® (Invitrogen; Thermo Fisher Scientific, Inc.) as
per the manufacturer's protocol. Nucleotide sequences of primers
used for PCR analysis are listed in Table I. For each set of primers, a gradient
PCR was performed to determine the optimal annealing temperature.
Optimal annealing temperature was determined using 1°C increments
in 12 different wells. The thermocycling conditions were as
follows: 10 min at 95°C for initial denaturation; and 35 cycles of
95°C for 15 sec, 60°C for 2 min, and 72°C for 30 sec. cDNA purified
from BM-MSCs were used as template. A high annealing temperature
was used to prevent or limit non-specific binding. qPCR was
performed using an ABI 7500 PCR system (Applied Biosystems; Thermo
Fisher Scientific, Inc.) and SYBR-Green I dye (Toyobo Life
Science). Serial dilutions of cDNA samples (between 1:10 and
1:1,000) were analyzed to determine efficiency and dynamic range of
the PCR, using GAPDH as endogenous control. Each gene expression
relative to β-actin was determined using the 2−∆ΔCq
method (12), where
∆Cq=(Cqtarget gene-Cqβ-actin). Total RNA (0.2
µg) was reverse transcribed in a 20 µl reaction mixture containing
the following components: 1X RT buffer, deoxynucleotide
triphosphate mix (5 mM each), RNase inhibitor (10 U/µl RNaseOut;
Invitrogen; Thermo Fisher Scientific, Inc.), and 4 units Omniscript
reverse transcriptase (Qiagen GmbH). Each sample was reversed
transcribed for 30 min at 38°C. By optimizing the annealing
temperature, the thermocycling conditions of PCR were as follows:
10 min at 95°C for initial denaturation; and 40 cycles of 95°C for
15 sec and 60°C for 2 min. Successful amplification was determined
by the presence of a single dissociation peak on the thermal
melting curve. Data were analyzed with the sequence detection
software (version 1.4; Applied Biosystems; Thermo Fisher
Scientific, Inc.). Results are expressed as the normalized fold
expression for each gene. Reported data are representative of at
least three independent experiments.
 | Table I.Primer sequences for quantitative
PCR. |
Table I.
Primer sequences for quantitative
PCR.
| Name | Sequence
(5′-3′) | Product size,
bp |
|---|
| GAPDH-F |
GACAGTCAGCCGCATCTTCT | 104 |
| GAPDH-R |
GCGCCCAATACGACCAAATC |
|
| IL-1α-F |
GACGCCCTCAATCAAAGTATAATTC | 89 |
| IL-1α-R |
TCAAATTTCACTGCTTCATCCAGAT |
|
| IL-1β-F |
GCGGCATCCAGCTACGAAT | 80 |
| IL-1β-R |
GTCCATGGCCACAACAACTG |
|
| IL-10-F |
GCCTTGTCTGAGATGATCCAGTT | 85 |
| IL-10-R |
TCACATGCGCCTTGATGTCT |
|
| IL-6-F |
GCAAAGAGGCACTGGCAGAA | 93 |
| IL-6-R |
GGCAAGTCTCCTCATTGAATCC |
|
| IL-7-F |
AACCAGCTGCAGAGATCACC | 86 |
| IL-7-R |
CTCACCGCCCATAGTCACTC |
|
| IL-11-F |
ACATGAACTGTGTTTGCCGC | 104 |
| IL-11-R |
GTCTGGGGAAACTCGAGGG |
|
| SCF-F |
TCGATGACCTTGTGGAGTGC | 84 |
| SCF-R |
TAAAGAGCCTGGGTTCTGGG |
|
| IL-3-F |
GACTCCAAGCTCCCATGACC | 116 |
| IL-3-R |
GTCCAGCAAAGGCAAAGGTG |
|
| G-CSF-F |
TTGACTCCCGAACATCACCG | 128 |
| G-CSF-R |
CAAGGCAAATGTCCAGGCAC |
|
| SDF-1-F |
AGATTGTAGCCCGGCTGAAG | 134 |
| SDF-1-R |
GTGGGTCTAGCGGAAAGTCC |
|
| LIF-F |
TGGGCCAATTTGTGGAGAGG | 115 |
| LIF-R |
TATCTGCCAGGAACAGTGCG |
|
| TRIB3-F |
GAGACTCGCAGCGGAAGTG | 139 |
| TRIB3-R |
CTCAGAGCCTCCAGGGCA |
|
| SLC7A5-F |
TCATCATCCGGCCTTCATCG | 134 |
| SLC7A5-R |
GAGCAGCAGCACGCAGA |
|
| WSB1-F |
GTCAACGAGAAAGAGATCGTGAG | 152 |
| WSB1-R |
ACTGTGCGATGTCCTTGTGA |
|
| NKTR-F |
GGAGCAGAGGATGGTACAGC | 139 |
| NKTR-R |
GTGTAGGACCTGGATCGACTG |
|
| LUM-F |
CCGTCCTGACAGAGTTCACAG | 111 |
| LUM-R |
TGGCAAATGGTTTGAATCCTTACTG |
|
| OGT-F |
GCTGCTGCCCTTGTACTACT | 150 |
| OGT-R |
ACGTTTCGTTGGTTCTGTGC |
|
| LENG8-F |
CGAAGGATCCTGGTTGACAGT | 135 |
| LENG8-R |
CAGCCACCATGCTGTACTGA |
|
Recombinant plasmid construction and
transfection
To study the effects of the overexpression and
downregulation of the lumican (LUM) gene, pcDNA3.1-LUM and 3
small interfering RNA (siRNA) sequences targeting LUM were designed
and synthesized (Shanghai GenePharma Co., Ltd.). The nucleotide
sequences of the 3 groups were as follows: Group 329 (the number
represents the starting position of the different siRNA cleavages
on the mRNA sequence), 5′-CTGCTTTAAGAATTAACGAAAGC-3′, group 437,
5′-CAGTGGCCAGTACTATGATTATGAT-3′, and group 467,
5′-CCTATCAATTTATGGGCAATCATCA-3′. For construction of the expression
plasmid, the Lumican inserts were isolated by PCR amplification
(Novoprotein) from a cDNA library (GeneChem, Inc.) and digested
with the restriction endonucleases EcoRI and BglII
(MBI Fermentas; Thermo Fisher Scientific, Inc.), and linked into
the pcDNA3.1 expression plasmids (Bio-Asia Company) with T4 DNA
ligase (TransGen Biotech, Co., Ltd.). The ligation products were
transformed into competent Escherichia coli DH5α (TransGen
Biotech, Co., Ltd.) and then selected using the kanamycin
resistance method. Recombinant plasmids were sequenced (ABI Prism
3100 DNA Sequencer; Applied Biosystems; Thermo Fisher Scientific,
Inc.) and confirmed to contain the entire coding sequence of
LUM.
The cells were seeded into 6-well plates and
cultured to 70% confluence for siRNA transfection (25 nM) and
plasmid transfection, respectively, for 24 h. Transfection was
performed using Lipofectamine® 2000 (Invitrogen; Thermo
Fisher Scientific, Inc.), according to the manufacturer's protocol,
and the culture medium was replaced after 6 h of incubation. After
72 h of transfection, the cells were counted and subjected to cell
cycling and apoptosis assay, and western blot analysis. The
untransfected cells were considered to be blank control, and the
cells transfected with scrambled siRNA
(5′-CATCATAAGTCACGTACTGTAGTGT-3′) were considered as the negative
controls (NCs) for the downregulation experiments. The cells
transfected with Lipofectamine only (Mock) or pcDNA3.1 (empty
vector) were considered as the control for the upregulation
experiments. Cells transfected with the BLOCK-iT™ Alexa
Fluor® Red Fluorescent Control (Invitrogen; Thermo
Fisher Scientific, Inc.) were used to determine the transfection
efficiency of siRNA.
Cell cycling analysis of
BM-MSCs-LUM+/- to Nalm-6 cells
The experiment was divided into 4 groups: Normal
nalm-6 cells, nalm-6+normal BM-MSCs, nalm-6+BM-MSCs-cDNA3.1- LUM,
and nalm-6+BM-MSCs-LUM-437 groups. After co-culture for 24 h, a
total of 1×10⁶ nalm-6 cells collected from each group
and were washed three times with PBS and resuspended in 50 µl PBS.
Resuspended cells were added, dropwise, into a tube containing 1 ml
ice cold 70% ethanol while vortexing at medium speed. The tubes
were frozen at −20°C for 3 h prior to staining. Afterwards, the
cells were washed and treated with propidium iodide (PI) staining
kit (Beyotime Institute of Biotechnology) according to the
manufacturer's protocol. After 30 min of incubation at room
temperature in the dark, cell suspension samples were transferred
into 1.5 ml microcentrifuge tubes and analyzed using a flow
cytometry system (Guava easyCyte8HT; EMD Millipore) and Guava
Incyte software (version 2.8; EMD Millipore). Results were
expressed as the percentage of cells in each cell cycle phase, and
error bars represented standard error of the mean (SEM).
Cell apoptosis assay
Nalm-6 cell apoptosis was determined using flow
cytometry with AnnexinV/PI double staining (Cat. 556547, BD
Biosciences) according to the manufacturer's protocol. The cells
were grouped into the different groups as aforementioned. A total
of 1×10⁵ cells from each group were collected by
centrifugation (800 × g, 5 min, at 4°C) and washed with PBS. Cells
were resuspended in PBS with 1% bovine serum albumin (Beijing
Solarbio Science & Technology Co., Ltd.) and 1% FBS, mixed with
the Annexin V and PI reagent, and subsequently incubated for 20 min
at room temperature in the dark. Analyses were performed using a
Guava easyCyte 8HT flow cytometer (EMD Millipore), and the data
were analyzed using Guava Incyte software (version 2.8; EMD
Millipore) Results were expressed as the percentage of apoptotic
cells, and error bars represented SEM.
Cytotoxicity assay of VP-16
The effect of BM-MSCs- LUM+/- on the
sensitivity of the Nalm-6 cell line to VP-16 (Sigma-Aldrich; Merck
KGaA) was evaluated using Cell Counting Kit-8 (CCK-8; Beyotime
Institute of Biotechnology) assay. The experiment was divided into
5 groups: VP-16+Nalm-6 cells (control group), VP-16 + Nalm-6 cells
+ normal BM-MSCs (group 1), VP-16 + Nalm-6 + BM-MSCs-LUM-329 (group
2), VP-16 + Nalm-6 + BM-MSCs-LUM-437 (group 3)., and VP-16 + Nalm-6
+ BM-MSCs-cDNA3.1-LUM (group 4) The cells treated with only 0.9%
normal saline were used as VP-16 blank controls. In brief, the
Nalm-6 cells were cultivated at a density of 2×10⁴
cells/well in 96-well culture plates, groups 2, 3, 4, and 5 were
pre-layered with BM-MSCs as the feeder cells. Nalm-6 cells were
treated with various concentrations of VP-16 (0, 0.05, 0.1 and 0.5
µg/ml). After 48 h of culture, the cytotoxicity of the treatments
was determined using CCK-8 dye according to the manufacturer's
instructions. The generated formazan was determined using a model
450 microplate reader (Bio-Rad Laboratories, Inc.) at an optical
density of 570 nm to determine cell viability. Survival rate (SR)
was calculated using the following equation: SR (%)=(A Test/A
Control) ×100%.
Statistical analysis
All data are presented as mean ± SEM from three
separate experiments. Data were analyzed using the Student's t-test
for comparison between two groups or Tukey's post-hoc tests for
comparison among multiple groups as appropriate. P<0.05 was
considered to indicate a statistically significant difference.
Statistical analyses were performed using SPSS (version 17.0; SPSS,
Inc.).
Results
LSCs regulate the phenotype and the
expression of hematopoietic factors in BM-MSCs
Following LSCs simulation for 24–72 h, the
expression levels of cell surface proteins on BM-MSCs were
evaluated by flow cytometry. The results showed that there were no
significant differences in the expression of surface markers
observed except for CD44 and CD105, CD44 was significantly
upregulated and CD105 was downregulated (Table II).
| Table II.Effect of LSCs on the immunophenotype
positive expression rate of BM-MSCs. |
Table II.
Effect of LSCs on the immunophenotype
positive expression rate of BM-MSCs.
| Phenotype | BM-MSC | BM-MSCLSC |
|---|
| CD29 | 94.36±5.17 | 96.42±3.85 |
| CD31 | 2.86±0.69 | 2.14±1.02 |
| CD34 | 0.86±0.35 | 0.92±0.44 |
| CD44 | 80.30±5.10 |
89.07±6.50b |
| CD45 | 4.29±2.43 | 3.39±0.78 |
| CD73 | 95.21±5.99 | 94.32±3.45 |
| CD90 | 91.30±3.73 | 95.46±2.67 |
| CD105 | 67.14±5.52 |
62.20±7.80a |
mRNA levels of hematopoietic factors were evaluated
in BM-MSCs following co-culture with LSCs for 24–72 h. In contrast
to SDF-1 and interleukin (IL)-6, which had reduced levels, the
majority of hematopoietic factors, including IL-10,
granulocyte-colony stimulating factor (G-CSF), IL-3, IL-7,stem cell
factor (SCF), IL-11, IL-1α, IL-1β and leukemia inhibitory factor
(LIF) showed increased expression in BM-MSCsLSC compared
with BM-MSCs group (Fig. 1). The
expression levels of IL-3, IL-7, IL-10 and G-CSF in
BM-MSCsLSC group were significantly higher compared with
BM-MSCs group (P<0.01). The results of SCF and LIF were also
higher in the BM-MSCsLSC group (P<0.05).
Collectively, these results suggest that the crosstalk of LSCs and
BM-MSCs result in changes in the expression of hematopoietic
factors in the BM microenvironment.
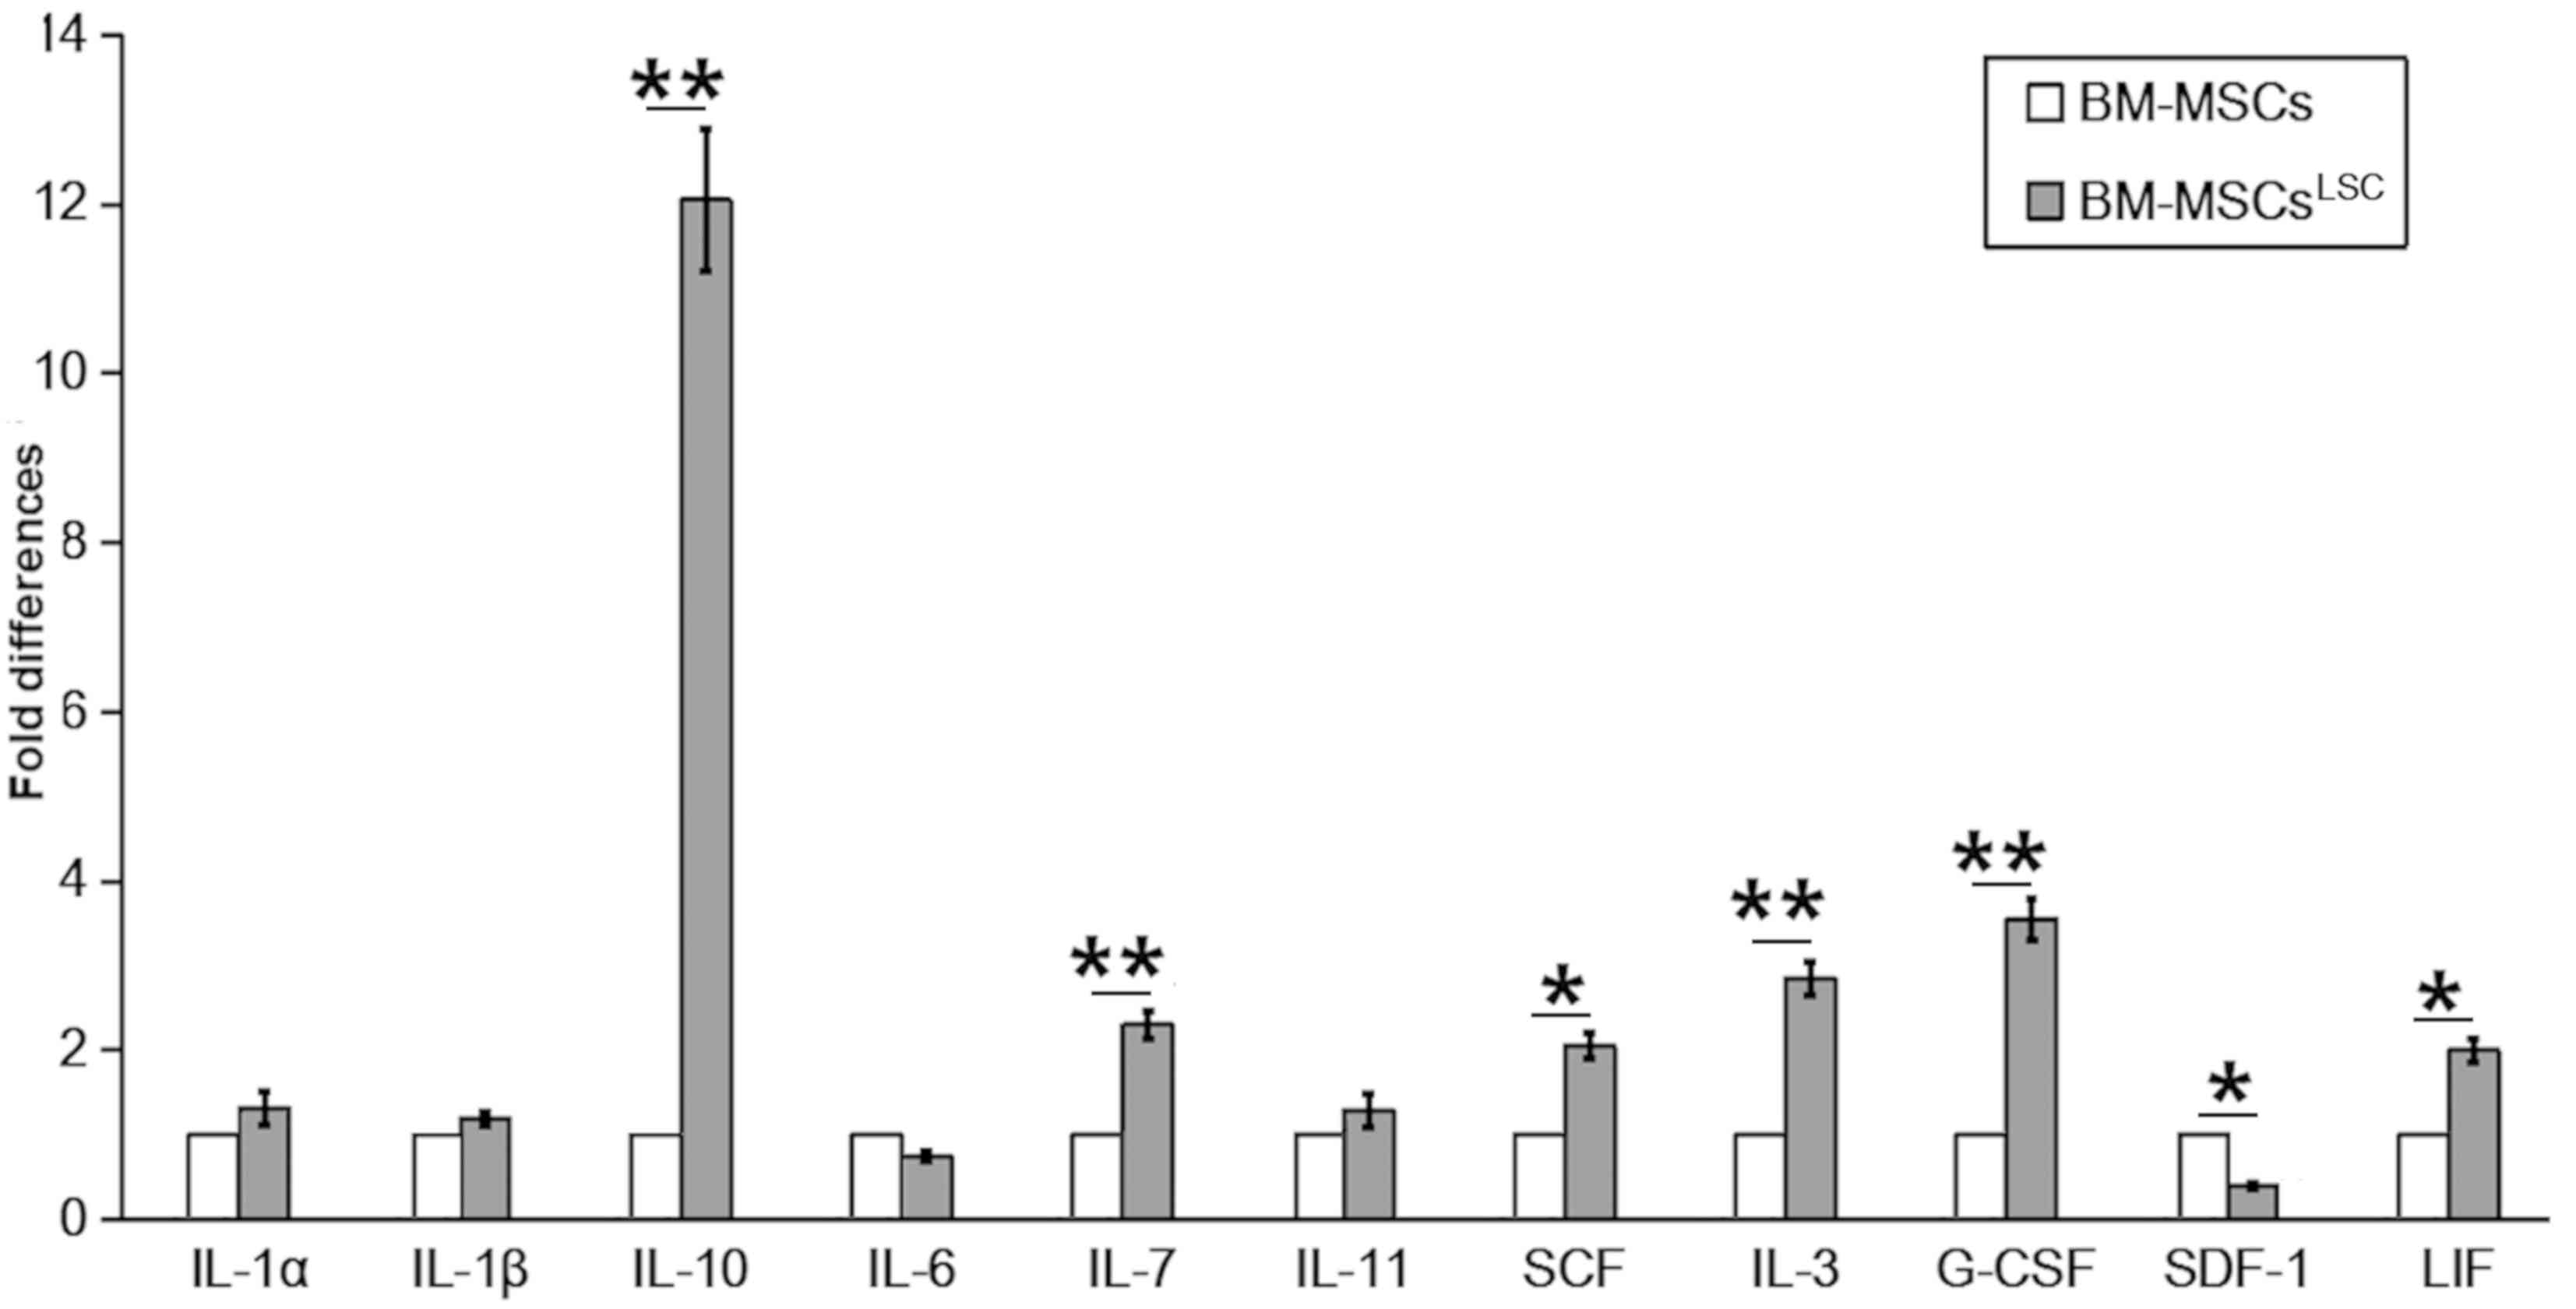 | Figure 1.Altered expression of hematopoietic
related factors in BM-MSCsLSC. Although expression of
SDF-1 and IL-6 mRNA was downregulated, the expression levels of the
other hematopoietic factors (particularly IL-3, IL-7, IL-10 and
G-CSF) were upregulated in BM-MSCsLSCs, compared with
BM-MSCs. *P<0.05, **P<0.01. BM-MSCs, bone marrow mesenchymal
stem cells; LSC, leukemia stem cell; IL, interleukin; SCF,
SKP1-CUL1-F protein; G-CSF, granulocyte-colony stimulating factor;
LIF, leukemia inhibitory factor; SDF-1, stromal cell-derived factor
1. |
Differentially expressed genes in
BM-MSCLSC
Illumina Genome Analyzer/Hiseq 2000 was performed to
identify differentially expressed genes between
BM-MSCsLSC and BM-MSCs. The data revealed significant
upregulation of 2 genes [solute carrier family 7 member 5
(SLC7A5) and tribbles pseudokinase 3 (TRIB3)] and
significant downregulation of 5 genes [WD repeat and SOCS box
containing 1, natural killer cell triggering receptor (NKTR),
LUM, O-linked N-acteylglucosamine (GlcNAc) transferase and
leukocyte receptor cluster member 8 (LENG8)] in BM-MSCs
after LSC simulation for 24–72 h (Table III). RT-qPCR analysis was performed
to confirm the expression profiles obtained by RNA sequencing.
P<0.05 was considered to indicate a statistically significant
difference. As revealed in Fig. 2,
TRIB3 and NKTR was upregulated, while SLC7A5,
LUM and LENG8 were downregulated in
BM-MSCsLSC compared with BM-MSCs group. The expression
of TRIB3 in BM-MSCsLSC group were higher than
that in BM-MSCs group (P<0.05). The expression levels of
SLC7A5 and LUM in BM-MSCsLSC group were
significantly lower than those in BM-MSCs group (P<0.01).
Notably, the results of PCR revealed a decrease in SLC7A5,
which was inconsistent with the results from RNA sequencing,
therefore SLC7A5 was not chosen as the target for further
experiments. The reduced expression levels of LUM were
consistent with the results from the Illumina sequencing data.
Therefore, LUM was selected for further experiments.
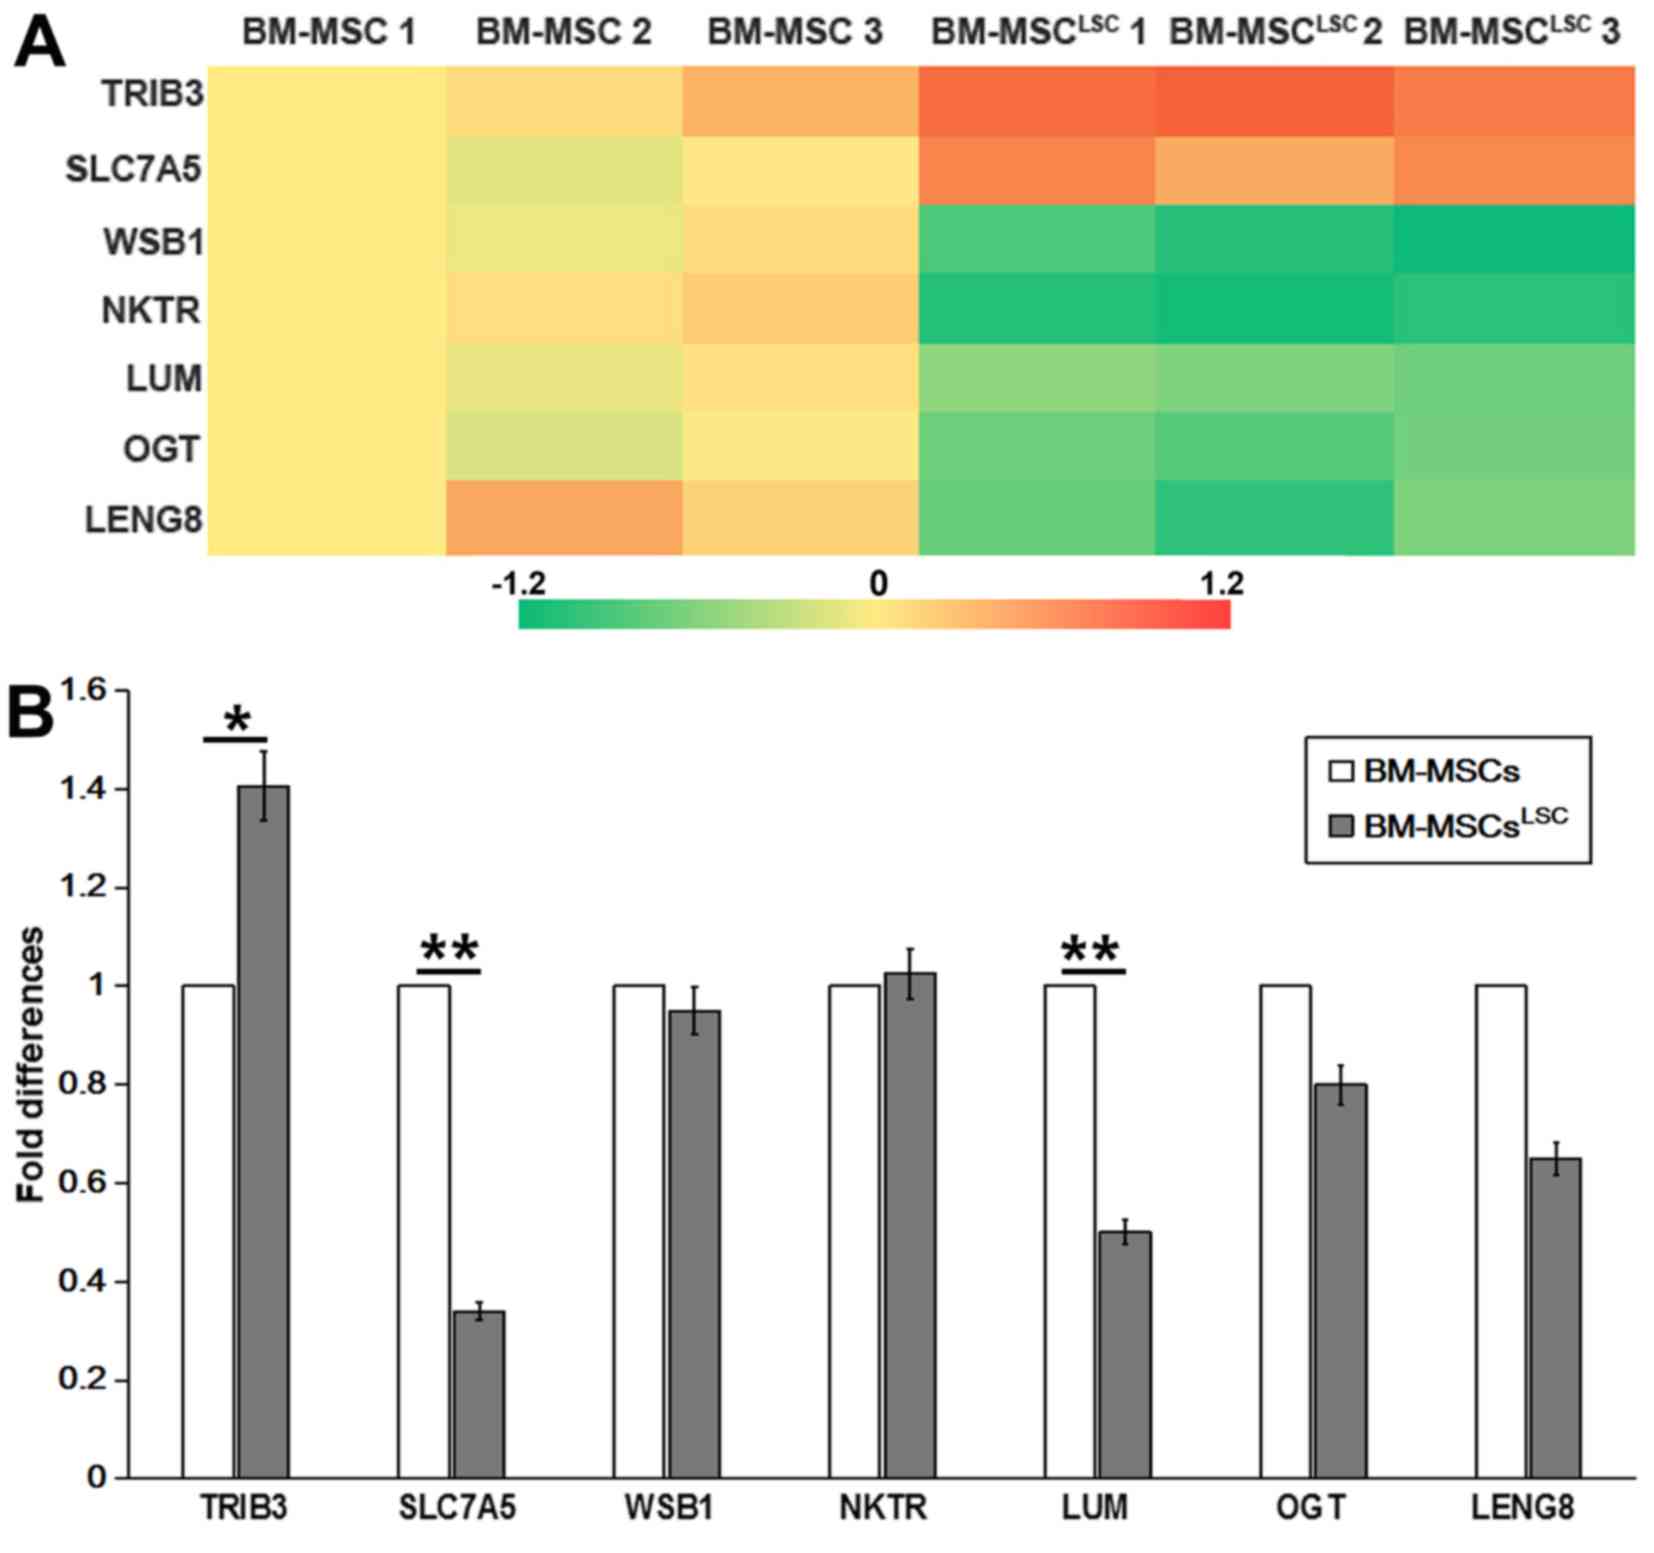 | Figure 2.Detection of differentially expressed
genes as assessed by Illumina sequencing and RT-qPCR. (A) Heat map
showing 7 differently expressed genes selected by Illumina
sequencing data. (B) Differentially expressed genes in BM-MSCsLSCs,
compared with that in BM-MSCs, were validated by RT-qPCR. The
relative expression was normalized to BM-MSCs. *P<0.05,
**P<0.01. BM-MSCs, bone marrow-mesenchymal stem cells; LSCs,
leukemia stem cells; RT-qPCR, reverse transcription-quantitative
PCR; SLC7A5, solute carrier family 7 member 5; TRIB3,
tribbles pseudokinase 3; WSB1, WD repeat and SOCS box
containing 1; NKTR, natural killer cell triggering receptor;
LUM, lumican; OGT, O-linked N-acteylglucosamine
(GlcNAc) transferase; LENG8, leukocyte receptor cluster
member 8. |
| Table III.Different expressed genes selected by
deep sequencing technology. |
Table III.
Different expressed genes selected by
deep sequencing technology.
| Associated gene
name | Description |
log2.fold-change | P-value | q value |
|---|
| TRIB3 | Tribbles
pseudokinase 3 | 0.87604 |
1.10×10−05 | 0.004136 |
| SLC7A5 | Solute carrier
family 7 member 5 | 0.64000 |
1.32×10−05 | 0.004891 |
| WSB1 | WD repeat and SOCS
box containing 1 | −1.04450 |
1.01×10−06 | 0.000490 |
| NKTR | Natural
killer-tumor recognition sequence | −1.07880 |
4.57×10−05 | 0.014561 |
| LUM | Lumican | −0.63497 |
4.05×10−06 | 0.001739 |
| OGT | O-linked
N-acetylglucosamine (GlcNAc) transferase | −0.78956 |
1.47×10−05 | 0.005309 |
| LENG8 | Leukocyte receptor
cluster member 8 | −0.84921 |
7.65×10−05 | 0.021334 |
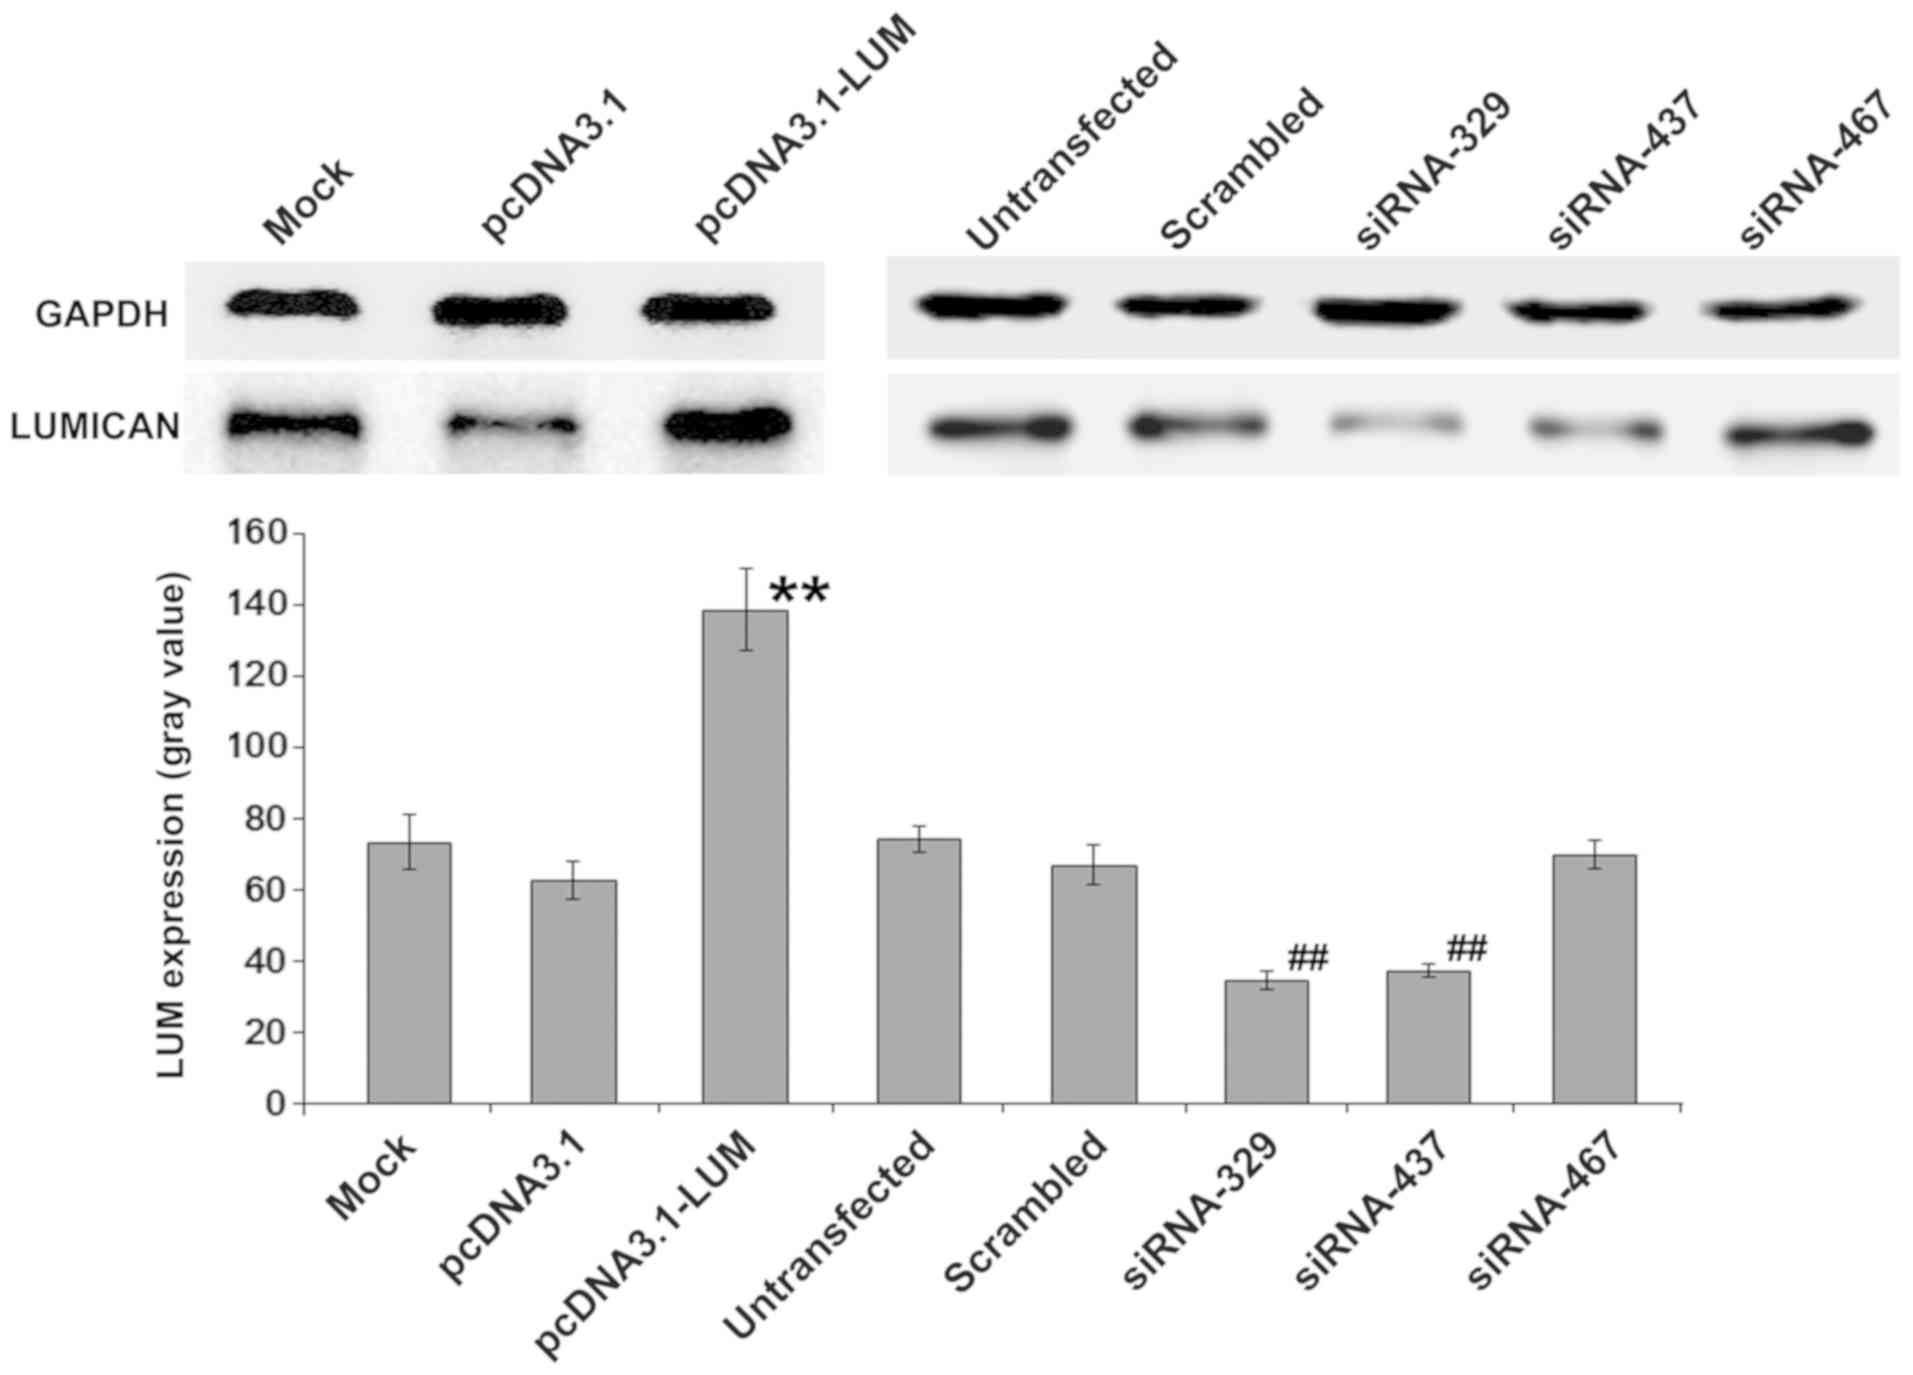
Up or downregulation of LUM in
BM-MSCs
Whether changes in LUM expression of BM-MSCs could
serve a critical a role in Nalm-6 cells was also evaluated. BM-MSCs
were transfected with pcDNA3.1-LUM vector or siRNAs
(siRNA329, siRNA437 and siRNA467). After colony selection for 2
weeks, expression of LUM in transfected BM-MSCs was confirmed by
western blotting (Fig. 3). The
results revealed that expression of LUM in LUM-transfected BM-MSCs
(Lum) was >2-fold increase compared with that in mock and
pcDNA3.1-transfected cells (P<0.01). By contrast, in siRNA329
and siRNA437-transfected BM-MSCs (siLUM), LUM mRNA transcripts were
downregulated, compared with untransfected BM-MSCs and scrambled
siRNA-transfected BM-MSCs (Fig. 3).
siRNA329 and siRNA437 were utilized further to inhibit the
expression of LUM. Transfection efficiency was ~43%.
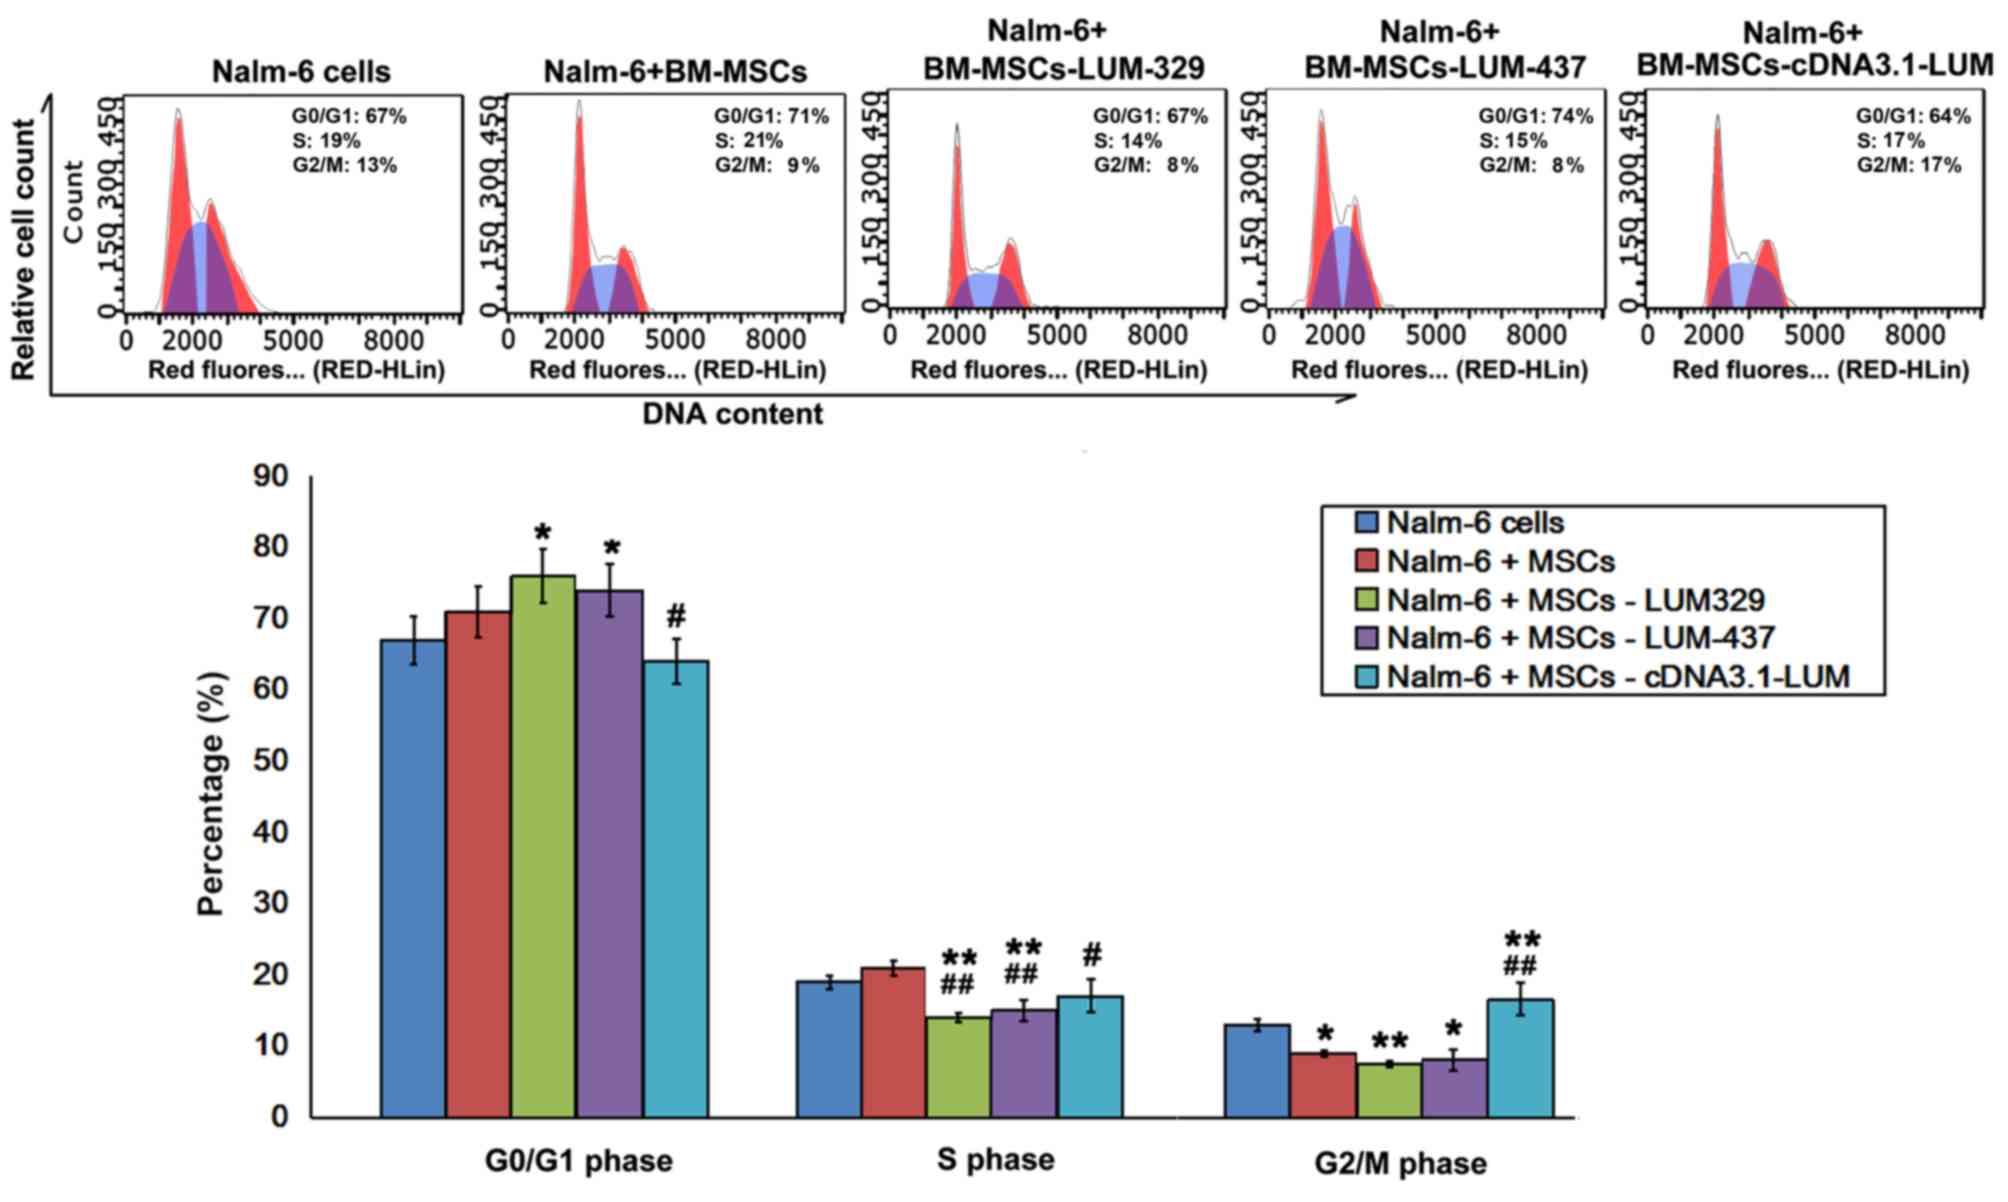
Effect of LUM downregulation on cell
cycle distribution in Nalm-6 cells
Flow cytometry analysis revealed that the fraction
of cells in G0/G1 phase increased, and the
proportion of cells in G2/M phase decreased in Nalm-6 +
BM-MSCs group compared with Nalm-6 cells group. Compared with
Nalm-6 cells group, there was a significant increase in the
percentage of cells in G0/G1 phase in the
Nalm-6+BM-MSCs-LUM-329 and Nalm-6+BM-MSCs-LUM-437 (P<0.05) and a
significant decrease in the S phase (P<0.01) and G2/M
phase (P<0.01, 0.05). However, increasing LUM expression
(Nalm-6+BM-MSCs-cDNA3.1-LUM group) decreased the percentage of
cells in G0/G1 and S phase (both P<0.05),
but increased the percentage of cells in G2/M phase
compared with Nalm-6+BM-MSCs group (P<0.01; Fig. 4).
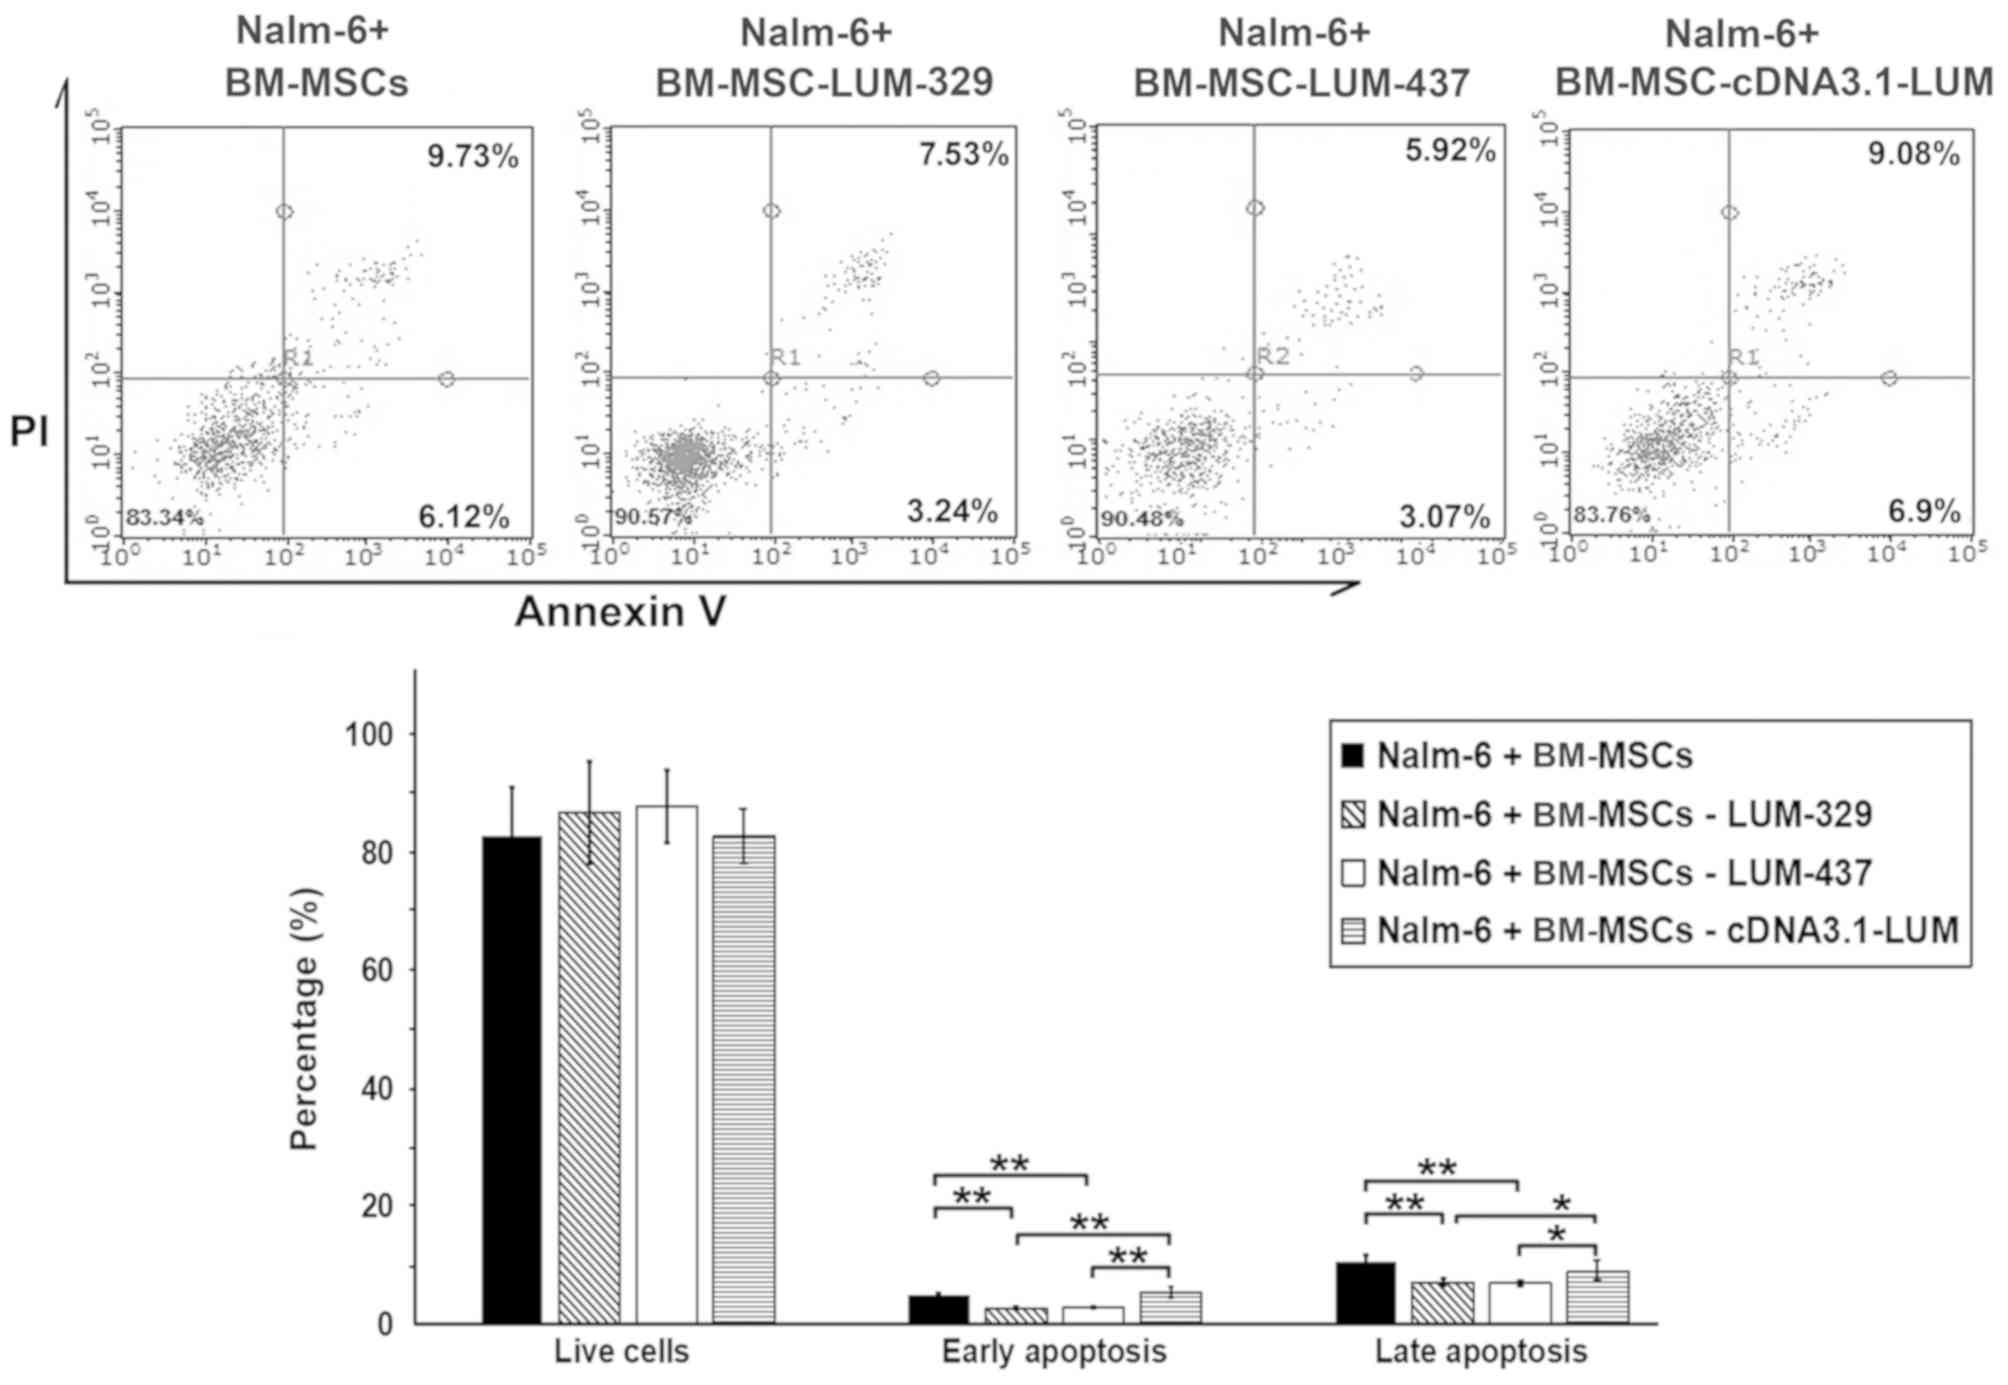
Downregulation of LUM decreases
apoptosis in Nalm-6 cells
To determine whether LUM expression affects
the apoptosis of Nalm-6 cells, the cells were stained with Annexin
V/PI after 24 h of co-culture. The percentage of cells in both
early and late apoptosis were significantly decreased in the
LUM-silenced group (Nalm-6+BM-MSCs-LUM-329 and
Nalm-6+BM-MSCs-LUM-437 group) compared with the Nalm-6+BM-MSCs
group (P<0.01; Fig. 5). Compared
with Nalm-6+BM-MSCs group, the numbers of apoptotic cells remained
unchanged in Nalm-6+BM-MSCs-cDNA3.1-LUM group.
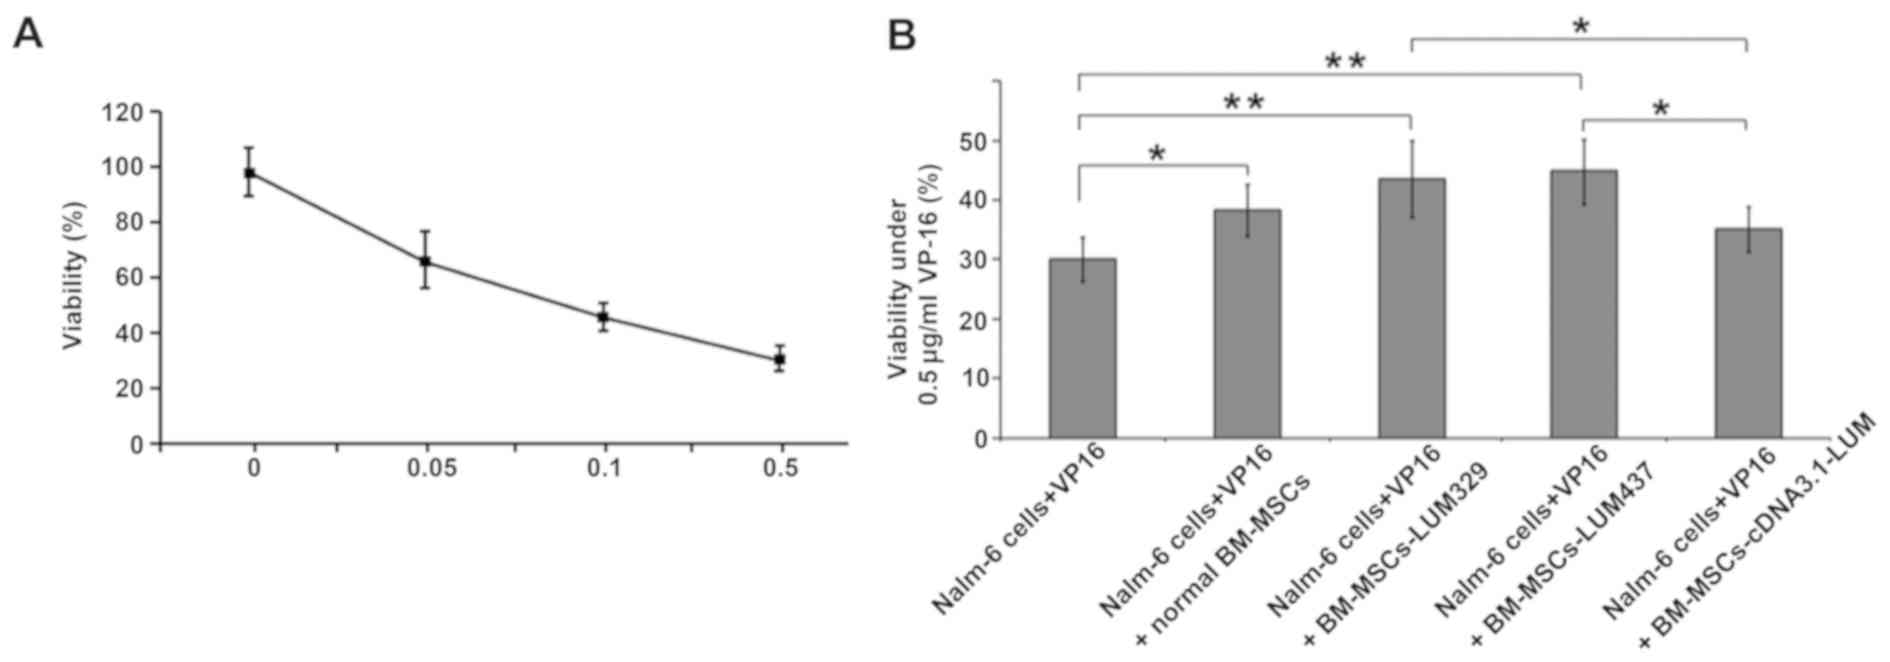
Downregulation of LUM decreases the
sensitivity of Nalm-6 cells to VP-16
Whether changes in LUM expression may affect the
sensitivity of Nalm-6 cells to VP-16, a chemotherapy medication
used for the treatment of various types of cancer was also
assessed. LUM-expressing BM-MSCs and LUM-silencing
BM-MSCs were treated with VP-16 and CCK-8 was used to assess
cytotoxicity. Treatment with VP-16 displayed cytotoxicity in
BM-MSCs in a dose-dependent manner (Fig.
6A). Coculture with BM-MSCs (Nalm-6+VP16+normal BM-MSCs group)
increased the cell viability compared with the Nalm-6 + VP16 group
(P<0.05). Silencing of LUM (Nalm-6+BM-MSCs-LUM-329 and
Nalm-6+BM-MSCs-LUM-437 group) also increased the cell viability
compared with the Nalm-6 + VP16 group (P<0.01). In contrast,
Nalm-6+BM-MSCs-cDNA3.1-LUM group reduced the cell viability
compared with Nalm-6 + VP16 + normal BM-MSCs group, but this effect
was not significant (P>0.05; Fig.
6B).
Discussion
In the present study, it was demonstrated that
Nalm-6 cell derived CD34+ LSCs significantly upregulated CD44
expression and altered the expression of different hematopoietic
factors in BM-MSCs following co-culture. LUM was
downregulated in BM-MSCsLSC as assessed by Illumina
Genome Analyzer/Hiseq 2000 and RT-qPCR. In addition, a recombinant
eukaryotic expression plasmid or siRNA were used to overexpress or
inhibit the expression of the lumican gene. The results suggest
that downregulated LUM expression in BM-MSCs contribute to the
anti-apoptotic properties and resistance to chemotherapy in Nalm-6
cells.
CD44 is a widely distributed cell-surface
glycoprotein involved in lymphocyte adhesion to the vascular
endothelium and extracellular matrix proteins (13). As a major receptor of hyaluronic acid
(HA) (14), CD44 participates in
diverse cellular processes during tumorigenesis, including cell
transformation, proliferation, metastasis and apoptosis (5,15,16).
CD44 is required for LSCs to efficiently lodge in and home to the
BM niche in AML, and anti-CD44 antibodies may modify the fate of
the LSCs via inducing differentiation (6). In addition, CD44-HA crosstalk mediates
LSC apoptosis resistance by initiating signal transductions and
cooperating with multidrug resistance genes (17). The results of the present study
demonstrated that CD44 expression of BM-MSCs was significantly
increased after LSC simulation. Therefore, LSCs may induce MSCs to
express increased levels of CD44. This results in LSCs staying
closer to MSCs for longer periods of time, thus additional shelter
from stromal cells. On the other hand, it can create a
microenvironment promoting the proliferation of LSCs and prevent
the damage caused by chemotherapeutic drugs, thus contributing to
relapse of ALL.
An intricate network of cytokine and cytokine
receptors is involved in the crosstalk between LSCs and BM-MSCs,
which may deregulate normal hematopoiesis and offer a selective
growth advantage to LSCs in leukemia. SDF-1/CXCL12, is critical for
the homing of hematopoietic cells to the BM through its receptor,
CXCLR4 (18). Specific antagonists,
which may block the interaction between CXCL12 and CXCR4, may
disrupt the adhesion of malignant cells to the BM microenvironment
and adipose tissue, rendering them more susceptible to chemotherapy
(19). Due to the effects of SDF-1
on the pathophysiological procedure of leukemia, it was
hypothesized that SDF-1 mRNA may be upregulated in BM-MSCs
following co-culture with LSCs. Unexpectedly, it was found that
SDF-1 mRNA was downregulated in BM-MSCs after LSC simulation. A
previous study found that CXCL12 expression in BM-MSCs was reduced
in BCR-ABL mice and CML patients (20). Maksym et al (21) reported that CXCL12/CXCR4 signaling
was deregulated in patients with myelodysplastic syndromes and
leukemia. Hematopoietic factors, including IL-10, IL-1α and IL-7
may promote progression of lymphoid malignancies and may be
associated with clinical prognosis. Excessive production of SCF
impairs normal BM niches and mediates the engraftment of CD34+
cells into the malignant niche. The SCF/c-kit-R pathway may be
utilized as a therapeutic target for leukemia (22). These findings are consistent with the
results of the present study. In accordance with previous studies
(23–28), the results of the present study
demonstrated reduced SDF-1 and IL-6 levels, and increased IL-10,
G-CSF, IL-3, IL-7, SCF, IL-11, IL-1α, IL-1β and LIF levels after
LSC-BM-MSCs co-culture for 24–72 h.
LUM is a member of the small leucine-rich
proteoglycan family (29) and its
overexpression has been reported in melanoma (30), breast (31), colorectal (32), uterine (33) and pancreatic cancer (34). In melanoma, decreased LUM expression
correlates with increased tumor growth and progression (35,36), and
increased LUM expression impedes tumor cell migration and invasion
by directly interacting with the α2β1 integrin (37) and decreasing phosphorylated focal
adhesion kinase phosphorylation (38). A previous study unambiguously linked
LUM with pancreatic carcinoma cell metabolism and identified the
LUM/epidermal growth factor receptor (EGFR)/Akt/hypoxia-inducible
factor-1 α (HIF-1α) signaling pathway as a mechanism by which LUM
may inhibit pancreatic cancer cell survival and proliferation
(39). LUM enhances the
internalization of EGFR from the cell membrane into the cytoplasm,
resulting in autophosphorylation and subsequent internalization
(40). The PI3K/Akt-mediated
signaling pathway is a major downstream pathway of EGFR (41). LUM downregulates HIF-1α expression
and activity through the EGFR/Akt signaling pathway. LUM may
decrease glucose consumption, lactate production and intracellular
ATP level and induce apoptosis through downregulation of HIF-1α
(25). Using the Illumina Genome
Analyzer/Hiseq 2000, it was identified that the expression of
LUM was decreased in BM-MSCsLSC. Additionally;
decreased LUM expression led to decreased apoptosis and promoted
chemoresistance to VP-16 in Nalm-6 cells, indicating that LSCs can
alter the expression of key genes of BM-MSCs to promote leukemia
survival. Decreased expression of LUM may also promote angiogenesis
by interfering with α2β1 integrin and downregulating matrix
metalloproteinase-14 expression (42). It is worth noting that only depletion
for LUM in BM-MSCs significantly affected the cell cycle, apoptosis
and drug resistance to Nalm-6, while overexpression of LUM did not
show a significant effect compared with the blank control group.
This may be due to the fact that the corresponding receptors on LSC
have not increased accordingly.
In summary, the present study revealed that ALL
cells may generate an abnormal inhibitory microenvironment for
normal hematopoietic cells. Downregulation of LUM in BM-MSCs
decreased apoptosis in Nalm-6 cells and the sensitivity of Nalm-6
cells to VP-16. However, the mechanism by which LUM interacts with
other factors during the occurrence and development of leukemia
remains unclear. These potential interactions should be further
investigated in future studies.
Acknowledgements
Not applicable.
Funding
The present study was funded by Natural Science
Foundation of China (grant no. 81473484), The Shenzhen Science and
Technology Research and Development Fund (grant no.
JCYJ20160331173652555) and The Shandong Province Major Scientific
Research Projects (grant no. 2017GSF218015).
Availability of data and materials
The datasets used and/or analyzed during the present
study are available from the corresponding author on reasonable
request.
Authors' contributions
RW and DL conceptualized the study and designed the
protocol. DL performed the literature search. LL and QS performed
the experiments. All authors analyzed and interpreted the data. ZY
performed the experiments and drafted the manuscript. All authors
approved the final version of the manuscript.
Ethics approval and consent to
participate
Not applicable.
Patient consent for publication
Not applicable.
Competing interests
The authors declare that they have no competing
interests.
References
|
1
|
Silverman LB, Gelber RD, Dalton VK,
Asselin BL, Barr RD, Clavell LA, Hurwitz CA, Moghrabi A, Samson Y,
Schorin MA, et al: Improved outcome for children with acute
lymphoblastic leukemia: Results of Dana-Farber consortium protocol
91-01. Blood. 97:1211–1218. 2001. View Article : Google Scholar : PubMed/NCBI
|
|
2
|
Conter V, Aricó M, Valsecchi MG, Rizzari
C, Testi A, Miniero R, Di Tullio MT, Lo Nigro L, Pession A,
Rondelli R, et al: Intensive BFM chemotherapy for childhood ALL:
Interim analysis of the AIEOP-ALL 91 study. Associazione Italiana
Ematologia Oncologia Pediatrica. Haematologica. 83:791–799.
1998.PubMed/NCBI
|
|
3
|
Gaynon PS, Steinherz PG, Bleyer WA, Ablin
AR, Albo VC, Finklestein JZ, Grossman NJ, Novak LJ, Pyesmany AF,
Reaman GH, et al: Improved therapy for children with acute
lymphoblastic leukemia and unfavorable presenting features: A
follow-up report of the Childrens cancer group study CCG-106. J
Clin Oncol. 11:2234–2242. 1993. View Article : Google Scholar : PubMed/NCBI
|
|
4
|
Arico M, Valsecchi MG, Conter V, Rizzari
C, Pession A, Messina C, Barisone E, Poggi V, De Rossi G, Locatelli
F, et al: Improved out-come in high-risk childhood acute
lymphoblastic leukemia defined by prednisone-poor response treated
with double Berlin-Frankfurt-Muenster protocol II. Blood.
100:420–426. 2002. View Article : Google Scholar : PubMed/NCBI
|
|
5
|
Lin YH and Yang-Yen HF: The
osteopontin-CD44 survival signal involves activation of the
phosphatidylinositol 3-kinase/Akt signaling pathway. J Biol Chem.
276:46024–46030. 2001. View Article : Google Scholar : PubMed/NCBI
|
|
6
|
Dick JE, Bhatia M, Gan O, Kapp U and Wang
JC: Assay of human stem cells by repopulation of NOD/SCID mice.
Stem Cells. 15 (Suppl 1):S199–S207. 1997. View Article : Google Scholar
|
|
7
|
Wiseman DH: Donor cell leukemia: A review.
Biol Blood Marrow Transplant. 17:771–789. 2011. View Article : Google Scholar : PubMed/NCBI
|
|
8
|
Juarez J, Bradstock KF, Gottlieb DJ and
Bendall LJ: Effects of inhibitors of the chemokine receptor CXCR4
on acute lymphoblastic leukemia cells in vitro. Leukemia.
17:1294–1300. 2003. View Article : Google Scholar : PubMed/NCBI
|
|
9
|
Jiang Z, Wu D, Lin S and Li P: CD34 and
CD38 are prognostic biomarkers for acute B lymphoblastic leukemia.
Biomark Res. 4:232016. View Article : Google Scholar : PubMed/NCBI
|
|
10
|
McCarthy DJ, Chen Y and Smyth GK:
Differential expression analysis of multifactor RNA-Seq experiments
with respect to biological variation. Nucleic Acids Res.
40:4288–4297. 2012. View Article : Google Scholar : PubMed/NCBI
|
|
11
|
Wang L, Feng Z, Wang X, Wang X and Zhang
X: DEGseq: An R package for identifying differentially expressed
genes from RNA-seq data. Bioinformatics. 26:136–138. 2010.
View Article : Google Scholar : PubMed/NCBI
|
|
12
|
Livak KJ and Schmittgen TD: Analysis of
relative gene expression data using real-time quantitative PCR and
the 2(-Delta Delta C(T)) method. Methods. 25:402–408. 2001.
View Article : Google Scholar : PubMed/NCBI
|
|
13
|
Eisterer W, Bechter O, Hilbe W, van Driel
M, Lokhorst HM, Thaler J, Bloem AC, Günthert U and Stauder R: CD44
isoforms are differentially regulated in plasma cell dyscrasias and
CD44v9 represents a new independent prognostic parameter in
multiple myeloma. Leuk Res. 25:1051–1057. 2001. View Article : Google Scholar : PubMed/NCBI
|
|
14
|
Niitsu N and Iijima K: High serum soluble
CD44 is correlated with a poor outcome of aggressive non-Hodgkin's
lymphoma. Leuk Res. 26:241–248. 2002. View Article : Google Scholar : PubMed/NCBI
|
|
15
|
Aruffo A, Stamenkovic I, Melnick M,
Underhill CB and Seed B: CD44 is the principal cell surface
receptor for hyaluronate. Cell. 61:1303–1313. 1990. View Article : Google Scholar : PubMed/NCBI
|
|
16
|
Bourguignon LY, Zhu H, Shao L, Zhu D and
Chen YW: Rho-kinase (ROK) promotes CD44v3, 8–10-ankyrin interaction
and tumor cell migration in metastatic breast cancer cells. Cell
Motil Cytoskeleton. 43:269–287. 1999. View Article : Google Scholar : PubMed/NCBI
|
|
17
|
Khaldoyanidi SK, Goncharova V, Mueller B
and Schraufstatter IU: Hyaluronan in the healthy and malignant
hematopoietic microenvironment. Adv Cancer Res. 123:149–189. 2014.
View Article : Google Scholar : PubMed/NCBI
|
|
18
|
Kuhn NZ and Tuan RS: Regulation of
stemness and stem cell niche of mesenchy-mal stem cells:
Implications in tumorigenesis and metastasis. J Cell Physiol.
222:268–277. 2010. View Article : Google Scholar : PubMed/NCBI
|
|
19
|
Van Rhenen A, Moshaver B, Kelder A, Feller
N, Nieuwint AW, Zweegman S, Ossenkoppele GJ and Schuurhuis GJ:
Aberrant marker expression patterns on the CD34+CD38-stem cell
compartment in acute myeloid leukemia allows to distinguish the
malignant from the normal stem cell compartment both at diagnosis
and in remission. Leukemia. 21:1700–1707. 2007. View Article : Google Scholar : PubMed/NCBI
|
|
20
|
Zhang B, Ho YW, Huang Q, Maeda T, Lin A,
Lee SU, Hair A, Holyoake TL, Huettner C and Bhatia R: Altered
microenvironmental regulation of leukemic and normal stem cells in
chronic myelogenous leukemia. Cancer Cell. 21:577–592. 2012.
View Article : Google Scholar : PubMed/NCBI
|
|
21
|
Maksym RB, Tarnowski M, Grymula K,
Tarnowska J, Wysoczynski M, Liu R, Czerny B, Ratajczak J, Kucia M
and Ratajczak MZ: The role of stromal-derived factor-1-CXCR7 axis
in development and cancer. Eur J Pharmacol. 625:31–40. 2009.
View Article : Google Scholar : PubMed/NCBI
|
|
22
|
Tsiftsoglou AS, Bonovolias ID and
Tsiftsoglou SA: Multilevel targeting of hematopoietic stem cell
self-renewal, differentiation and apoptosis for leukemia therapy.
Pharmacol Ther. 122:264–280. 2009. View Article : Google Scholar : PubMed/NCBI
|
|
23
|
Fouillard L, Francois S, Bouchet S,
Bensidhoum M, Elm'selmi A and Chapel A: Innovative cell therapy in
the treatment of serious adverse events related to both
chemo-radiotherapy protocol and acute myeloid leukemia syndrome:
The infusion of mesenchymal stem cells post-treatment reduces
hematopoietic toxicity and promotes hematopoietic reconstitution.
Curr Pharm Biotechnol. 14:842–848. 2013. View Article : Google Scholar : PubMed/NCBI
|
|
24
|
Lapalombella R: Interleukin-6 in CLL:
Accelerator or brake? Blood. 126:697–698. 2015. View Article : Google Scholar : PubMed/NCBI
|
|
25
|
Jafarzadeh N, Safari Z, Pornour M,
Amirizadeh N, Forouzandeh Moghadam M and Sadeghizadeh M: Alteration
of cellular and immune-related properties of bone marrow
mesenchymal stem cells and macrophages by K562 chronic myeloid
leukemia cell derived exosomes. J Cell Physiol. 234:3697–3710.
2019. View Article : Google Scholar : PubMed/NCBI
|
|
26
|
Zhang X, Tu H, Yang Y, Wan Q, Fang L, Wu Q
and Li J: High IL-7 levels in the bone marrow microenvironment
mediate imatinib resistance and predict disease progression in
chronic myeloid leukemia. Int J Hematol. 104:358–367. 2016.
View Article : Google Scholar : PubMed/NCBI
|
|
27
|
Supper E, Tahir S, Imai T, Inoue J and
Minato N: Modification of gene expression, proliferation, and
function of OP9 Stroma cells by Bcr-Abl-expressing leukemia cells.
PLoS One. 10:e01340262015. View Article : Google Scholar : PubMed/NCBI
|
|
28
|
Wetzler M, Talpaz M, Lowe DG, Baiocchi G,
Gutterman JU and Kurzrock R: Constitutive expression of leukemia
inhibitory factor RNA by human bone marrow stromal cells and
modulation by IL-1, TNF-alpha, and TGF-beta. Exp Hematol.
19:347–351. 1991.PubMed/NCBI
|
|
29
|
Chakravarti S, Stallings RL, Sundarraj N,
Cornuet PK and Hassell JR: Primary structure of human lumican
(Keratan Sulfate Proteoglycan) and localization of the gene (LUM)
to chromosome 12q21.3-q22. Genomics. 27:481–488. 1995. View Article : Google Scholar : PubMed/NCBI
|
|
30
|
Jeanne A, Untereiner V, Perreau C, Proult
I, Gobinet C, Boulagnon-Rombi C, Terryn C, Martiny L, Brézillon S
and Dedieu S: Lumican delays melanoma growth in mice and drives
tumor molecular assembly as well as response to matrix-targeted
TAX2 therapeutic peptide. Sci Rep. 7:77002017. View Article : Google Scholar : PubMed/NCBI
|
|
31
|
Karamanou K, Franchi M, Piperigkou Z,
Perreau C, Maquart FX, Vynios DH and Brézillon S: Lumican
effectively regulates the estrogen receptors-associated functional
properties of breast cancer cells, expression of matrix effectors
and epithelial-to-mesenchymal transition. Sci Rep. 7:451382017.
View Article : Google Scholar : PubMed/NCBI
|
|
32
|
de Wit M, Carvalho B, Delis-van Diemen PM,
van Alphen C, Beliën JAM, Meijer GA and Fijneman RJA: Lumican and
versican protein expression are associated with colorectal
adenoma-to-carcinoma progression. PLoS One. 12:e01747682017.
View Article : Google Scholar : PubMed/NCBI
|
|
33
|
Naito Z, Ishiwata T, Kurban G, Teduka K,
Kawamoto Y, Kawahara K and Sugisaki Y: Expression and accumulation
of lumican protein in uterine cervical cancer cells at the
periphery of cancer nests. Int J Oncol. 20:943–948. 2002.PubMed/NCBI
|
|
34
|
Li X, Kang Y, Roife D, Lee Y, Pratt M,
Perez MR, Dai B, Koay EJ and Fleming JB: Prolonged exposure to
extracellular lumican restrains pancreatic adenocarcinoma growth.
Oncogene. 36:5432–5438. 2017. View Article : Google Scholar : PubMed/NCBI
|
|
35
|
Brézillon S, Venteo L, Ramont L, D'Onofrio
MF, Perreau C, Pluot M, Maquart FX and Wegrowski Y: Expression of
lumican, a small leucine-rich proteoglycan with antitumour
activity, in human malignant melanoma. Clin Exp Dermatol.
32:405–416. 2007. View Article : Google Scholar : PubMed/NCBI
|
|
36
|
Vuillermoz B, Khoruzhenko A, D'Onofrio MF,
Ramont L, Venteo L, Perreau C, Antonicelli F, Maquart FX and
Wegrowski Y: The small leucine-rich proteoglycan lumican inhibits
melanoma progression. Exp Cell Res. 296:294–306. 2004. View Article : Google Scholar : PubMed/NCBI
|
|
37
|
Zéltz C, Brézillon S, Käpylä J, Eble JA,
Bobichon H, Terryn C, Perreau C, Franz CM, Heino J, Maquart FX and
Wegrowski Y: Lumican inhibits cell migration through α2β1 integrin.
Exp Cell Res. 316:2922–2931. 2010. View Article : Google Scholar : PubMed/NCBI
|
|
38
|
Brézillon S, Radwanska A, Zeltz C,
Malkowski A, Ploton D, Bobichon H, Perreau C, Malicka-Blaszkiewicz
M, Maquart FX and Wegrowski Y: Lumican core protein inhibits
melanoma cell migration via alterations of focal adhesion
complexes. Cancer Lett. 283:92–100. 2009. View Article : Google Scholar : PubMed/NCBI
|
|
39
|
Li X, Truty MA, Kang Y, Chopin-Laly X,
Zhang R, Roife D, Chatterjee D, Lin E, Thomas RM, Wang H, et al:
Extracellular lumican inhibits pancreatic cancer cell growth and is
associated with prolonged survival after surgery. Clin Cancer Res.
20:6529–6540. 2014. View Article : Google Scholar : PubMed/NCBI
|
|
40
|
Wang Q, Villeneuve G and Wang Z: Control
of epidermal growth factor receptor endocytosis by receptor
dimerization, rather than receptor kinase activation. EMBO Rep.
6:942–948. 2005. View Article : Google Scholar : PubMed/NCBI
|
|
41
|
Balakrishnan S, Mukherjee S, Das S, Bhat
FA, Raja Singh P, Patra CR and Arunakaran J: Gold
nanoparticles-conjugated quercetin induces apoptosis via inhibition
of EGFR/PI3K/Akt-mediated pathway in breast cancer cell lines
(MCF-7 and MDA-MB-231). Cell Biochem Funct. 35:217–231. 2017.
View Article : Google Scholar : PubMed/NCBI
|
|
42
|
Niewiarowska J, Brézillon S,
Sacewicz-Hofman I, Bednarek R, Maquart FX, Malinowski M, Wiktorska
M, Wegrowski Y and Cierniewski CS: Lumican inhibits angiogenesis by
interfering with α2β1 receptor activity and downregulating MMP-14
expression. Thromb Res. 128:452–457. 2011. View Article : Google Scholar : PubMed/NCBI
|