Introduction
Myelodysplastic syndromes (MDSs) are a diverse group
of clonal diseases derived from hematopoietic stem cells (HSCs),
which are characterized by ineffective hematopoiesis, progressive
bone marrow (BM) failure and a substantial risk of progression to
acute myeloid leukemia (AML) (1,2).
Although the majority of previous studies have focused on the
molecular and genetic changes in malignant hematopoietic cells, the
mechanisms underlying the progression from less advanced MDS, with
dysplastic progenitors and apoptosis in the bone marrow, to
advanced MDS, with an excess of blasts, have not been elucidated
(3,4). Accumulated evidence in recent years has
demonstrated that MDS is a complex disease that involves
abnormalities in HSCs and the bone marrow microenvironment
(4–6).
Mesenchymal stem cells (MSCs), which possess the
ability of self-renewal and multiple differentiation potential,
serve important roles in the support of hematopoiesis and
maintaining immune homeostasis (7,8). The
deletion of dicer 1, ribonuclease III in the mesenchymal lineage
induced an MDS-like phenotype, while the deletion of SBDS ribosome
maturation factor in MSCs induced genotoxic stress through
inflammatory tumor protein p53 (TP53)-S100 calcium binding protein
A8/9-TLR4 signaling in animal models (5,6). In
addition, MSCs derived from patients with MDS are required for the
propagation of MDS-initiating Lin-CD34+CD38 stem cells in
orthotropic xenografts (4). Although
knowledge about the role of MSCs in patients with MDS is limited,
studies have revealed that MSCs derived from patients with MDS
(MDS-MSCs) exhibited a senescent phenotype, which included
decreased proliferation and differentiation potential and the
production of secreted factors, such as jagged-1, C-C motif
chemokine ligand 3 and vascular endothelial growth factor, which
promote the progression of MDS (4,9–11). Senescence in MDS-MSCs that do not
have shortened telomeres may be induced by the upregulation of the
mitogen-activated protein kinase 14/mitogen activated protein
kinase/CDKN1A signaling pathway and the abnormal expression of
microRNAs. The blocking of these pathways successfully reversed
senescence in MDS-MSCs (9,12,13).
MDS-MSCs may therefore provide a potential target for therapeutic
interventions.
Decitabine (5-aza-2-deoxycytidine), an inhibitor of
DNA methyltransferases, has a wide range of anticancer activities
(14). Previous studies suggested
that the differentiation and immunomodulatory function of MSCs
maybe regulated by decitabine (15,16).
However, whether this applies to MDS-MSCs and whether it has
potential clinical significance remains unknown. The current study
isolated primary MSCs cultures from the bone marrow of patients
with different MDS subtypes and investigated the effects of
decitabine on their proliferation, differentiation and
immunomodulatory functions.
Materials and methods
Patients and samples
Bone marrow specimens were obtained from 40 patients
with newly-diagnosed MDS (median age, 54 years; range, 24–80 years)
at the Guangdong General Hospital between January 2014 and March
2015. According to the World Health Organization 2008
classification of MDS (17), 15
patients (37.5%) had refractory cytopenia with multilineage
dysplasia, 2 patients (5.0%) had refractory anemia with ringed
sideroblasts, 14 patients (35.0%) had refractory anemia with excess
blasts, 4 patients (10%) had unclassified MDS and 2 patients (5.0%)
had AML with myelodysplasia-related changes (Table I). In addition, there were 3 patients
(7.5%) with chronic myelomonocytic leukemia. Primary MSCs cultures
were successfully generated from 28 of these 40 patients. Written
informed consent was obtained from all patients and donors, and the
study was performed in accordance with the Declaration of Helsinki
and approved by the Research Ethics Committee of Guangdong General
Hospital, Guangdong Academy of Medical Sciences.
 | Table I.Clinical characteristics of patients
with myelodysplastic syndromes. |
Table I.
Clinical characteristics of patients
with myelodysplastic syndromes.
| Characteristic | No. of
patients | % of patients |
|---|
| Sex |
|
Male | 29 | 72.5 |
|
Female | 11 | 27.5 |
| Diagnosis |
|
RCMD | 15 | 37.5 |
|
RARS | 2 | 5.0 |
|
RAEB-I | 9 | 22.5 |
|
RAEB-II | 5 | 12.5 |
|
CMML | 3 | 7.5 |
|
MDS-U | 4 | 10.0 |
|
sAML | 2 | 5.0 |
| IPSS |
|
Low | 6 | 15.0 |
|
Intermediate-1 | 25 | 62.5 |
|
Intermediate-2 | 7 | 17.5 |
|
High | 2 | 5.0 |
Isolation and culture of BM-MSCs
Mononuclear cells were isolated from fresh BM
aspirates at the time of initial diagnosis by centrifugation at 600
× g for 15 min at room temperature using Ficoll-PaquePlus density
gradient (specific gravity 1.077 g/ml; Sigma Diagnostics, Inc.,
Livonia, MI, USA). Mononuclear cells (1–7×10⁷ cells)
were seeded and cultured in Human Mesenchymal Stem Cell Growth
Medium supplemented with 10% fetal bovine serum (FBS), 2 mM
glutamine, 100 U/ml Penicillin-Streptomycin [Cyagen Biosciences
(Guangzhou) Inc.] at 37°C with 5% CO2 in a fully
humidified atmosphere. After 72 h, the culture medium was replaced
and non-adherent cells were removed, thereafter medium was replaced
twice a week. Upon reaching >70–80% confluence, cells were
detached with 0.25% trypsin-EDTA (Gibco; Thermo Fisher Scientific,
Inc.) and were seeded at 1×10⁴ cells/cm2 in
T-25 flasks. All experiments were performed using MSCs derived from
passages (P) 2–4. To fulfill the criteria of the International
Society for Cellular Therapy (18)
and to exclude contamination of MSCs cultures by hematopoietic
cells, MSCs were suspended in 50 µl FC block (cat. no. 564219;
1:100; BD Biosciences) on ice for 10–15 min. MSCs were washed twice
with PBS containing 2% fetal bovine serum (Gibco; Thermo Fisher
Scientific, Inc.) and were incubated for 30 min at room temperature
with antibodies against CD34 (cat. no. 555821), CD45 (cat. no.
555482), CD73 (cat. no. 550257), CD166 (cat. no. 560903), CD90
(cat. no. 555595) and CD105 (cat. no. 560839). All antibodies were
used at a dilution of 1:100 and purchased from BD Biosciences.
Following incubation with the primary antibodies, cells were
subsequently fixed with 2% paraformaldehyde (w/v) overnight at 4°C,
in the dark. The same-species, same-isotype non-specific antibodies
(mouse IgG1, κ; cat. cat. no. 555749 for CD73 and CD166;
mouse BALB/c IgG1, κ; cat. no. 555748 for CD90, CD34 and
CD45; mouse BALB/c IgG1, κ; cat. no. 554680 for CD105;
all 1:100 and purchased from BD Biosciences) were used as negative
controls, and were incubated for 30 min at room temperature. Cell
analysis was performed using a flow cytometer and FlowJo software
(version 10; FlowJo LLC).
MSCs differentiation
The differentiation potential of MSCs toward the
osteogenic and adipogenic lineages was assessed. In brief, MSCs
(P2) were induced for adipogenesis following culture in Human
Mesenchymal Stem Cell Adipogenic Differentiation medium [ADM;
Cyagen Biosciences (Guangzhou), Inc.] containing 1 mM
dexamethasone, 0.2 mM rosiglitazone, 0.5 mM
3-isobutyl-1-methylxanthine, 0.01 mg/ml insulin and 10% FBS for 14
days. After 72 h, the ADM was replaced with adipogenesis
maintenance medium [AMM; Cyagen Biosciences (Guangzhou), Inc.]
containing 0.01 mg/ml insulin and 10% FBS in Dulbecco's modified
Eagle's medium. The spent AMM was replaced with fresh AMM following
24 h. The treatment was repeated three times to achieve full
adipogenic differentiation and the adipocyte phenotype was
determined by Oil Red O staining. In brief, cells were washed with
PBS and fixed with 4% (w/v) paraformaldehyde (Sigma-Aldrich; Merck
KGaA) in PBS for 30 min at room temperature. After discarding the
paraformaldehyde, cells were evenly covered with 0.5% Oil Red O
working solution (prepared 15 min before use by adding, mixing and
filtering 3 parts of Oil Red O stock solution to 2 parts of water)
[Cyagen Biosciences (Guangzhou) Inc.] for 30 min at room
temperature and washed twice with PBS. Cells were covered with
water and observed under a light microscope and images were
captured (magnification, ×100). Lipid droplets appeared red. The
osteogenic differentiation was performed as previously described
(19), and the osteogenic phenotype
was subsequently visualized by Alizarin red staining. In brief,
cells were washed with PBS and fixed with 4% (w/v) paraformaldehyde
(in PBS for 30 min at room temperature. Cells were stained with
Alizarin Red [1%w/v; Cyagen Biosciences (Guangzhou) Inc.] for 5
min, then washed with distilled water, and finally air-dried at
room temperature. Cells were covered with water and observed under
a microscope. Images were captured (Olympus, IX70, Japan) at the
time of observation. Mineralized matrix deposition appeared
red.
Decitabine treatment
A previous study revealed that the antitumor effect
of 0.02–0.30 µM decitabine in vitro corresponded with the
concentration of the clinically administered dose of decitabine and
did not cause immediate cytotoxicity in primary leukemic and
epithelial tumor cells in vitro (20). A previous study revealed that a
concentration of decitabine <10 µM did not inhibit the
proliferation of MDS-MSCs, and 0.25 µM decitabine induced the
immune response and enhanced the sensitivity of tumor cells to
immune cells in vitro (21).
Decitabine is generally administered daily for 5 consecutive days
in a clinical setting (22).
Therefore, the current study analyzed the effect of decitabine on
MDS-MSCs for 5 days. Decitabine was dissolved in PBS (pH 7.4) to
obtain 25 µM stocks and stored at −20°C. The same volume of PBS was
added to cells in the control group. The cells were used for
subsequent experimentation following 5 days of decitabine treatment
at 37°C with 5% CO2 in a fully humidified
atmosphere.
Cell viability assay
A methyl triazolyl tetrazolium (MTT)-based assay was
used to study the effect of decitabine on the viability of the
expanded MDS-MSCs at P3. Briefly, cells were seeded at a density of
3,000 cells/well in 96-well plates for 1–7 days and treated with
decitabine or PBS. The cell viability was measured every 24 h for
168 h, MTT solution (5 mg/ml) was added and the cultures were
incubated for 4 h. The MTT-formazan crystals were dissolved
overnight in 20% SDS and 50% dimethylformamideat pH 4.7 and
absorbance was measured at a wavelength of 570 nm.
Cell cycle assay
BM-MSCs (P2) treated with decitabine or PBS for 5
days were fixed with 70% (w/v) ice-cold ethanol overnight at 4°C,
washed twice with PBS and treated with 50 µg/ml RNase for 30 min at
37°C followed by 10 µg/ml propidium iodine (PI) for 30 min in the
dark at 4°C. DNA content was analyzed using a flow cytometer and
FlowJo software (version 10; FlowJo LLC).
Apoptosis assay
BM-MSCs (P2) were treated with decitabine or PBS for
5 days and the number of apoptotic cells was quantified using the
Annexin V-FITC Apoptosis Detection kit (Invitrogen; Thermo Fisher
Scientific, Inc.), according to the manufacturer's protocol. Cells
were incubated 7-AAD for 30 min on ice. Early apoptotic cells were
defined as Annexin V+/7-AAD−cells, whereas
late apoptotic, dead cells presented as Annexin
V+/7-AAD+ and
annexinV−/7-AAD+, respectively. The analyses
were performed using a flow cytometer and FlowJo software (version
10; FlowJo LLC).
MDS-MSCs and peripheral blood
mononuclear cells (PBMCs) co-culture
MDS-MSCs (P3) were seeded in a six-well plate at a
density of 1×10⁵ cells/well on day 0. On day 4, 10 µM
mitomycin C was added and the cells were incubated for 4 h at 37°C
with 5% CO2 in a fully humidified atmosphere. The MSCs
were trypsinized and washed twice with PBS. The MSCs were seeded
onto 12-well plates at a density of 2×10⁴ cells/well.
Human peripheral blood mononuclear cells (PBMCs) from healthy donor
were isolated by centrifugation (600 × g for 15 min at room
temperature) using Ficoll-PaquePlus density gradient (specific
gravity 1.077 g/ml; Sigma-Aldrich; Merck KGaA). PBMCs were
resuspended in RPMI-1640 complete medium (10% FBS, 1 mM
L-glutamineand 100 U/ml penicillin/streptomycin; Thermo Fisher
Scientific, Inc.). PBMCs (2×10⁵ cells/well) were added
to each well and stimulated with 5 µg/ml anti-CD3 (cat. no.
16-0037; 1:500; BioLegend, Inc.), 1 µg/ml anti-CD28 (cat. no.
16-0289; 1:200; BioLegend, Inc.) and 200 IU/ml recombinant
interleukin 2 (cat. no. 200-02; 1:500; PeproTech). MDS-MSCs with
treated with decitabine or PBS and PBMC cells were co-cultured at a
1:10 ratio for 5 days in RPMI-1640 complete medium at 37°C with 5%
CO2 in a fully humidified atmosphere prior to further
experimentation.
Flow cytometry analysis
For immunophenotype analysis, the suspended cells
from the co-cultures were harvested and washed with PBS containing
0.5% bovine serum albumin (BSA; Sigma-Aldrich; Merck KGaA,
Darmstadt, Germany), and incubated with primary antibodies (10–20
ng/ml) for 30 min at 4°C. The Human Regulatory T Cell Staining kit
(cat. no. 88-8995; eBioscience; Thermo Fisher Scientific, Inc.)
included primary antibodies against CD4, CD25 and forkhead box P3
(FOXP3; antibodies all 1:100). Same-species, same-isotype
non-specific antibodies (cat. no. 15-4321; 1:100; eBioscience;
Thermo Fisher Scientific, Inc.) were used as a negative control.
Cell analysis was performed with FlowJo software (version 10;FlowJo
LLC).
Reverse transcription-quantitative
polymerase chain reaction (RT-qPCR)
Total RNA was extracted from P3 undifferentiated
BM-MSCs using the RNeasy Mini kit (Qiagen GmbH, Hilden, Germany),
according to the manufacturer's protocol. cDNA was prepared using
the Revert Aid™ First Strand cDNA Synthesis kit (Fermentas; Thermo
Fisher Scientific, Inc.), according to the manufacturer's protocol.
A total of 1 µg total RNA was added to 20 µl total cDNA synthesis
volume. qPCR was performed with a reaction volume of 20 µl
containing 10 µl of 2X Real Master mix (TakaraBiotechnology Co.,
Ltd., Dalian, China), 0.5 µl of each primer (10 µM), 1 µl cDNA and
8 µl distilled water. qPCR was performed on an ABI 7500 Real-Time
PCR system (Applied Biosystems; Thermo Fisher Scientific, Inc.).
The thermocycling conditions were as follows: 95°C for 30 sec and
up to 40 cycles of 95°C for 5 sec and 60°C for 34 sec according to
the manufacturer's instructions. The primer sequences for
runt-related transcription factor 2 (RUNX2), Sp7 transcription
factor (SP7), cyclin dependent kinase inhibitor 1A (CDKN1A) and
CD274 are presented in Table II.
mRNA levels were quantified using the 2−ΔΔCq method
(23) and normalized to the internal
reference gene β-actin.
| Table II.Primer sequences for reverse
transcription quantitative polymerase chain reaction. |
Table II.
Primer sequences for reverse
transcription quantitative polymerase chain reaction.
|
| Primer sequence
(5′-3′) |
|---|
|
|
|
|---|
| Gene | Forward | Reverse |
|---|
| Cyclin dependent
kinase inhibitor 1A |
ACATCTTCTGCCTTAGTCTCA |
GACTAAGGCAGAAGATGTAG |
| Sp7 transcription
factor |
TCTCCATCTGCCTGGCTCCTT |
CTGCACGCTGCCGTCAGCATG |
| Runt related
transcription factor 2 |
TCTTCAGCACAGTGACACCAT |
CTGTTGCGCAGCCACCACCG |
| CD274 |
GGTGCCGACTACAAGCGAAT |
TGACTGGATCCACAACCAAAATT |
| β-actin |
TATGGAGAAGATTTGGCACC |
ATGAGACACACCTAAGGACC |
Statistical analysis
The results were statistically analyzed using SPSS
software (version 20.0; IBM Corp.). The Student's t-test was used
for analysis of two groups, and the one-way analysis of variance
followed by the least significant difference post hoc test was used
for the analysis of multiple groups. The results are presented as
the mean ± standard deviation from at least three independent
experiments. P<0.05 was considered to indicate a statistically
significant difference.
Results
Cell viability of MSCs from patients
with MDS is not inhibited by decitabine
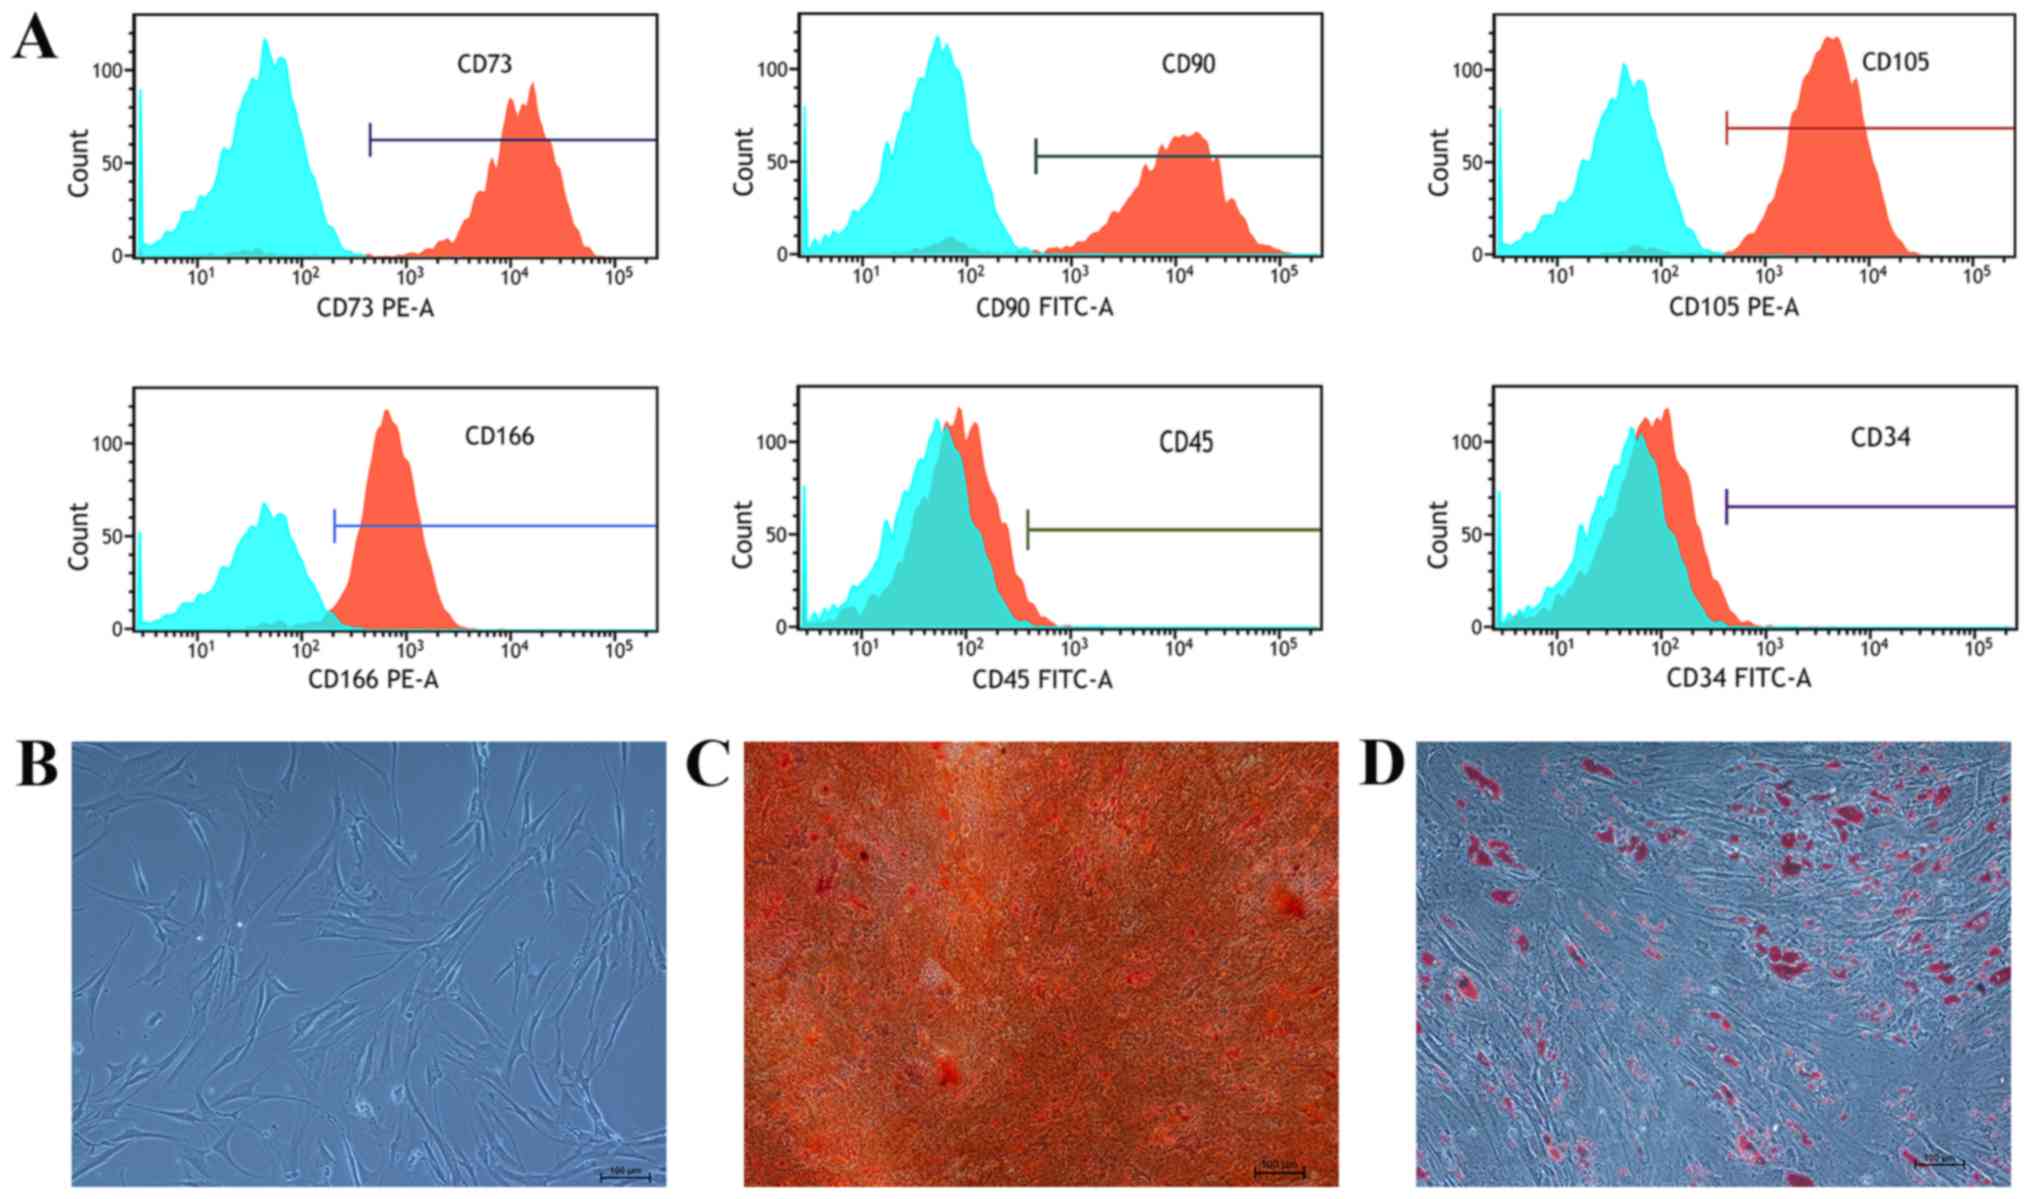
The immunophenotype of the MSCs isolated from
patients with MDS was detected using flow cytometry. All cell
samples were positive for CD90 (96.81±2.46%), CD166 (97.19±1.45%),
CD73 (98.40±2.85%) and CD105 (99.17±1.27%) expression, but negative
for CD45 (9.79±0.89%) and CD34 (2.12±0.99%) expression (Fig. 1A). MDS-MSCs layers were observed
under light microscopy and exhibited fibroblast-like morphology
(Fig. 1B). Under the appropriate
differentiation conditions, MDS-MSCs were induced to differentiate
into adipogenic and osteogenic cells (Fig. 1C and D).
The effect of decitabine on the viability of
MDS-MSCs was investigated by exposing cells to 0.25 µM decitabine
and assessing the cell viability with a MTT assay. The number of
live cells corresponding with the optical density of MDS-MSCs
treated with decitabine was slightly lower compared with the
controls over the 7-day culture period. However, no significant
difference was observed between the two groups (Fig. 2A). The apoptosis assay results showed
that the percentages of early apoptotic cells, late apoptotic cells
and dead cells in the control group were 4.19±1.16, 3.93±1.90 and
2.33±2.95%, respectively, whereas the percentages in the
decitabine-treated group were 3.84±1.53, 4.39±2.23 and 3.02±3.91%,
respectively (Fig. 2B and C). No
significant difference was observed between the control group and
decitabine-treated group (P=0.618, 0.664 and 0.673, respectively;
Fig. 2D).
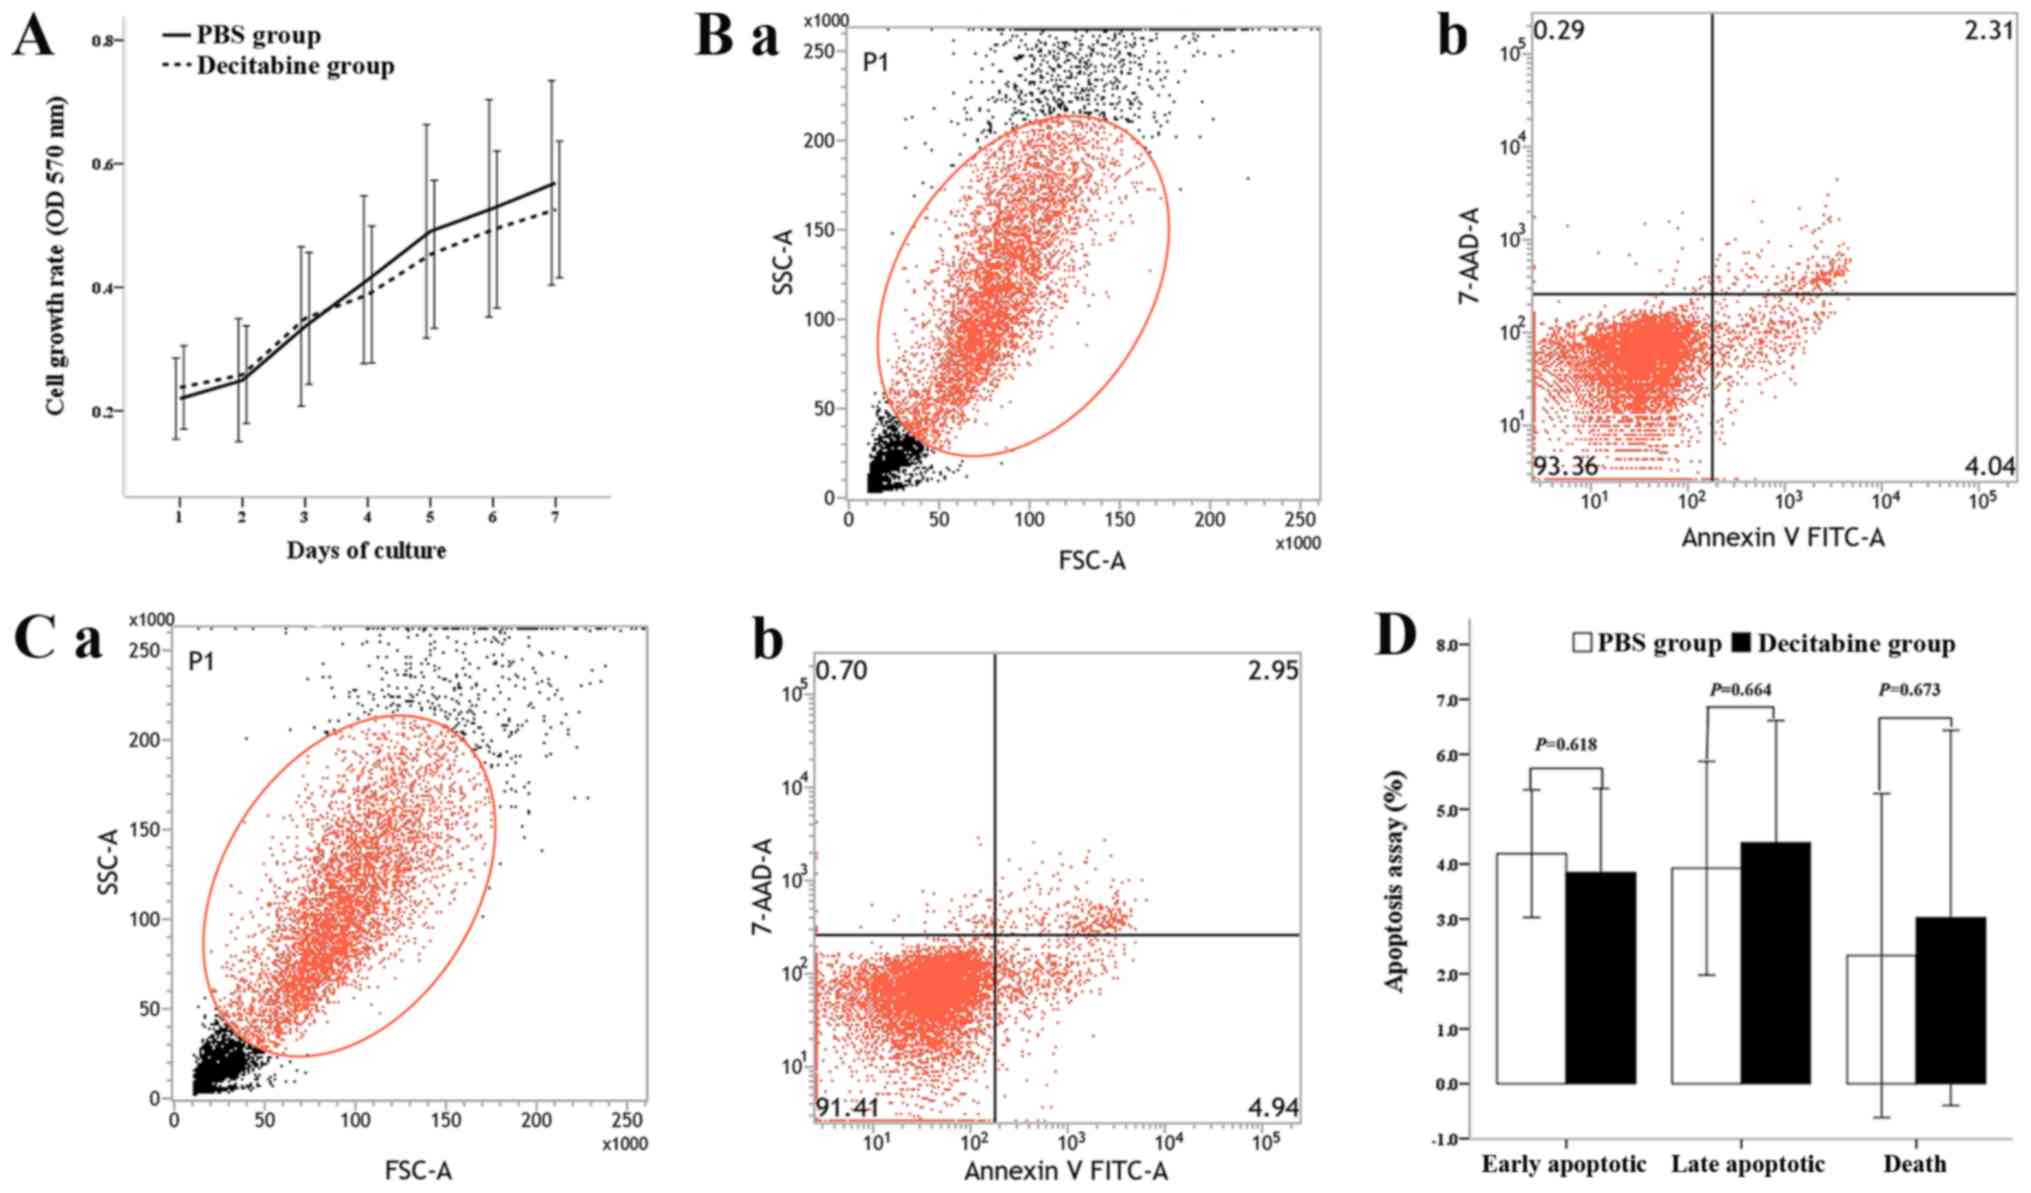 | Figure 2.Effect of viability on the
proliferation and apoptosis of BM-MSCs from patients with
myelodysplastic syndromes. (A) Growth curve of BM-MSCs was plotted
using an MTT assay. The absorbance represents the viability of
MDS-MSCs. Decitabine-treated BM-MSCs grew more slowly compared with
the control group (n=10). The apoptosis rate was measured by flow
cytometry in the control and decitabine-treated groups. (B) (a) The
FSC/SSC gating-graph for the control group. The cells in the red
circle represent the cells that were analyzed. (b) Early apoptotic
cells of control group. (C) (a) The FSC/SSC gating-graph for
decitabine-treated MDS-MSCs. The cells in the red circle represent
the cells that were analyzed. Early apoptotic cells, late apoptotic
cells and dead cells were defined as Annexin
V-positive/7AAD-negative, Annexin V-positive/7AAD-positive, and
Annexin V-negative/7AAD-positive cells, respectively. (b) Early
apoptotic cells in the decitabine-treated group. (D) The y-axis
represents percentages of the cells in each group. No significant
difference in the percentage of early apoptotic, late apoptotic and
dead cells was observed between the decitabine-treated and control
groups (n=8). Student's t-test was used to analyze statistically
significant differences. All data are presented as the mean ±
standard deviation. BM-MSCs, bone marrow mesenchymal stem cells;
FSC, forward scatter; SSC, side scatter; 7ADD, 7-aminoactinomycin
D; FSC, forward scatter; SSC, side scatter; FITC, fluorescein
isothiocyanate; OD, optical density. |
Decrease of the cell number in
G0/1phases in MDS-MSCs treated with decitabine
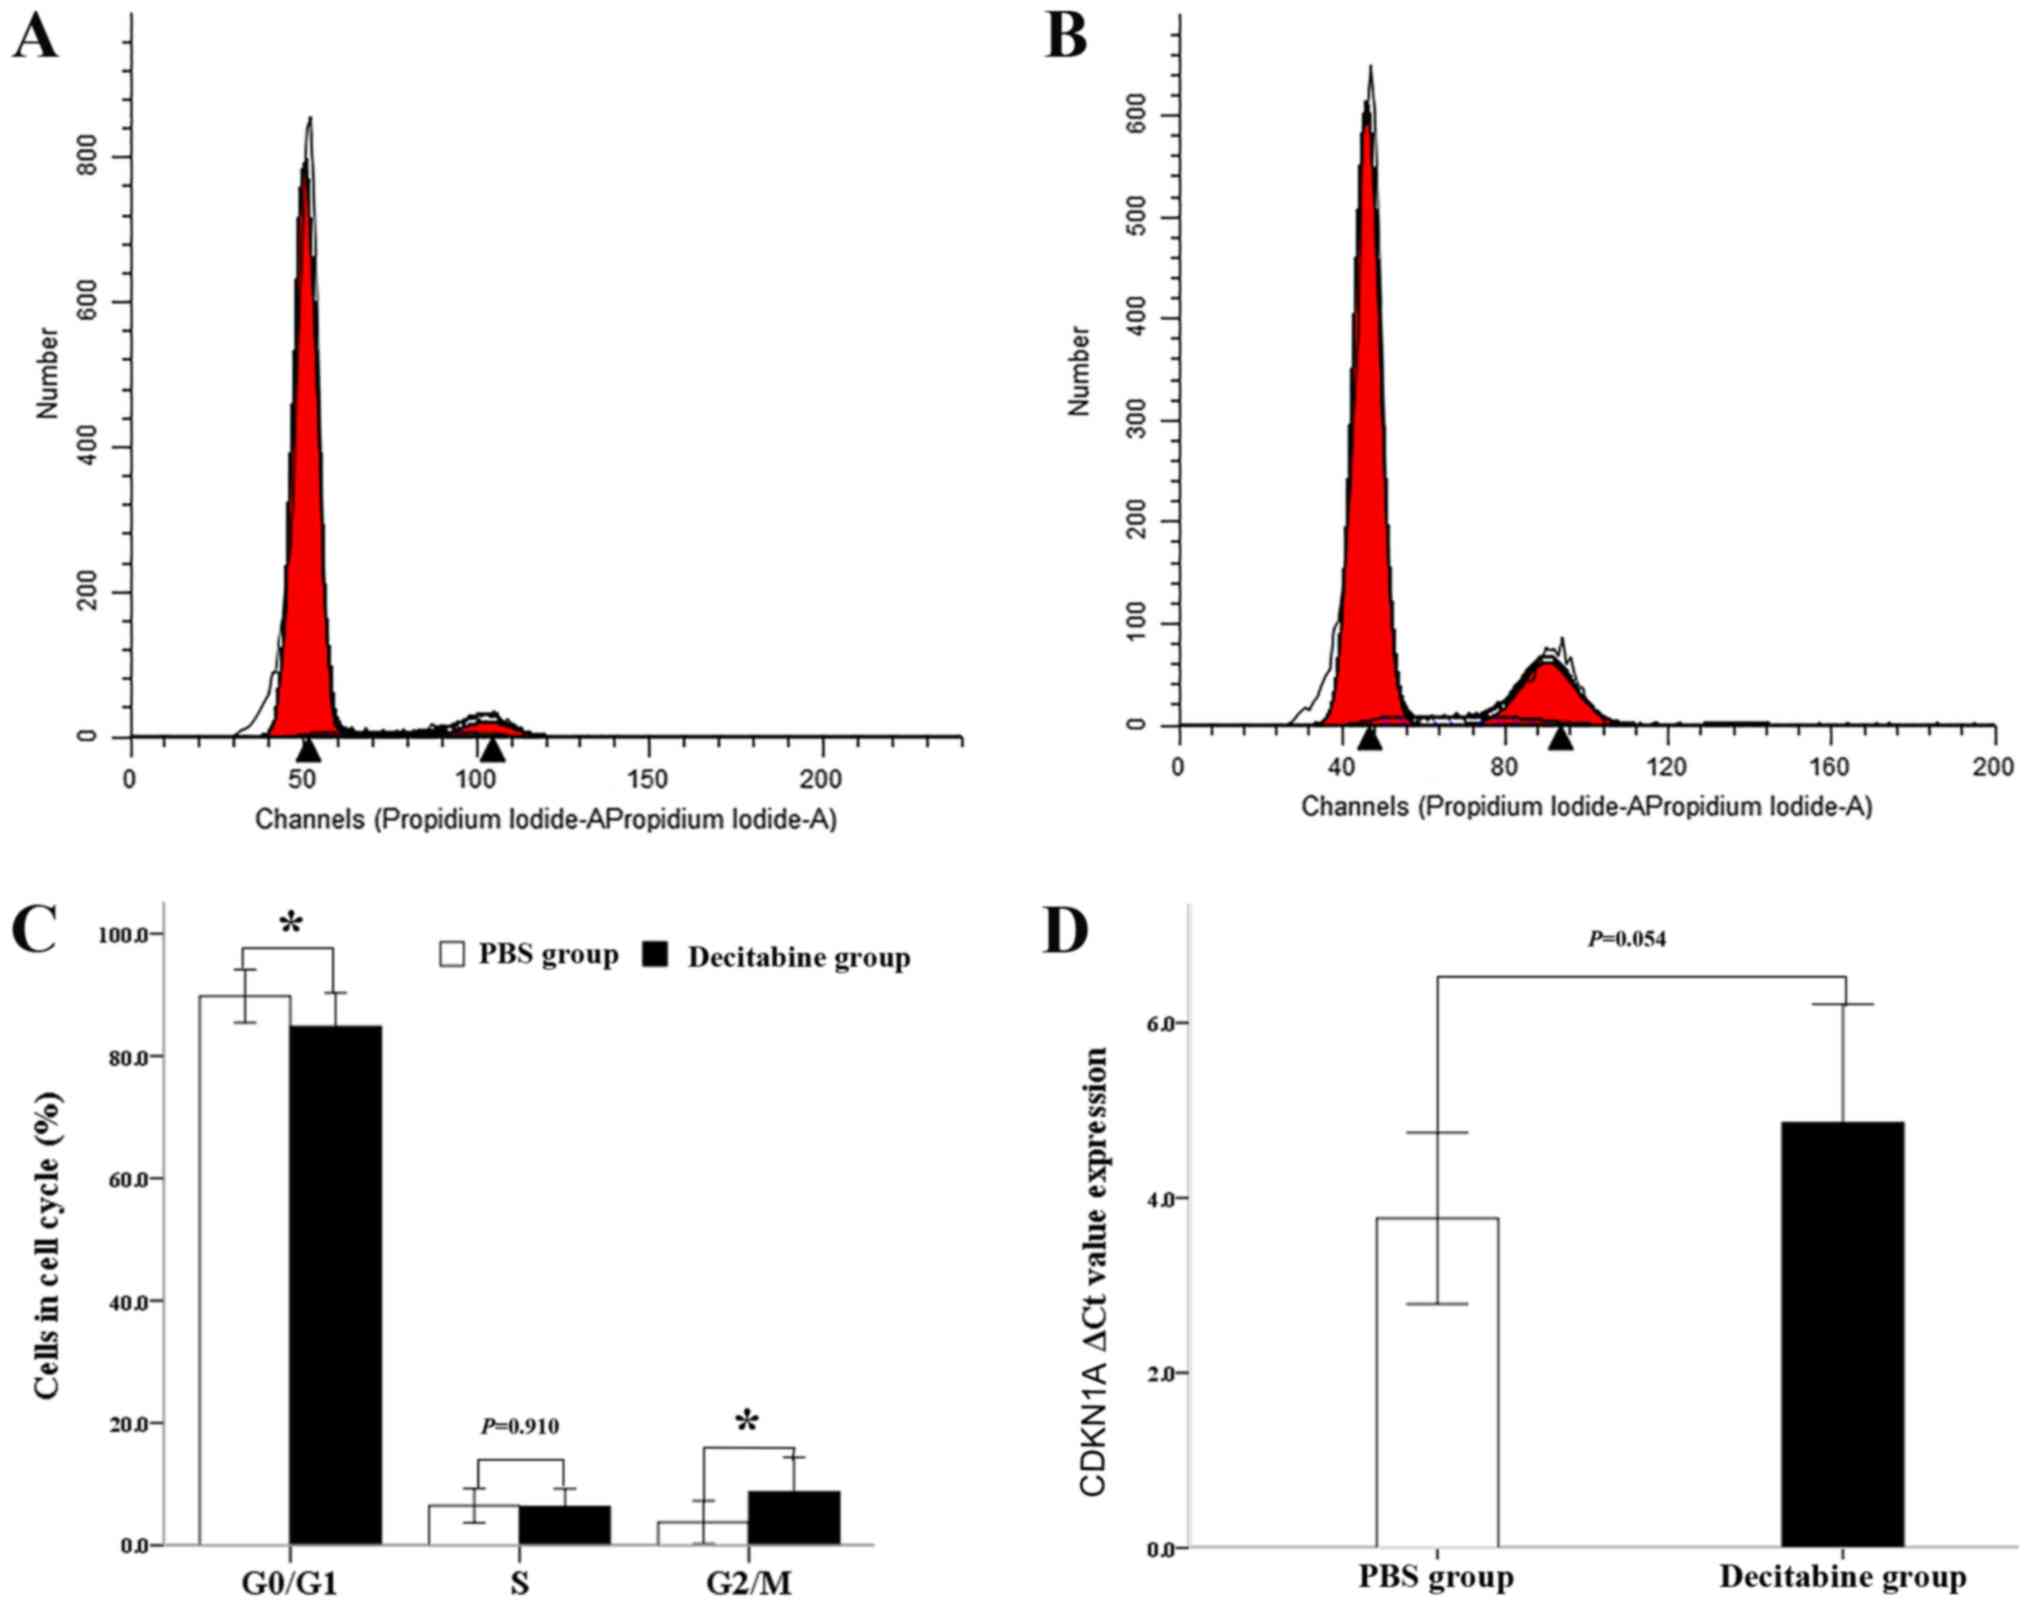
The present study investigated the effects of
decitabine on the cell cycle by staining the nuclei of the
untreated and decitabine-treated MDS-MSCs with PI (Fig. 3A and B). Analyses of the cell cycle
distribution following exposure to decitabine showed that the
number of cells in the G1 phase (84.84±5.46%) was significantly
reduced in comparison with that of the PBS group (89.77%; n=11;
P=0.023) and was simultaneously accompanied by a significant
increase in the number of cells in the G2/M phase (8.71±5.65 vs.
3.76±3.51%; n=11; P=0.017; Fig. 3C).
A significant difference in the number of cells in S phase between
the two groups was not observed (6.34±2.87 vs. 6.48±2.78; n=11;
P=0.910; Fig. 3C). In line with
these findings, the gene expression of CDKN1A, a key mediator of
senescence (19), was slightly lower
in the decitabine-treated group compared with the control group.
Accordingly the ΔCq value of CDKN1A in the decitabine-treated group
(4.86±1.35) was slightly higher compared with the control group
(3.97±0.98). However, no significant difference was observed
between the two groups (n=10; P=0.054; Fig. 3D). The results obtained suggested
that the senescent phenotype of MDS-MSCs seems to be partly
ameliorated by decitabine treatment.
Osteogenic differentiation of MDS-MSCs
is not significantly affected by decitabine
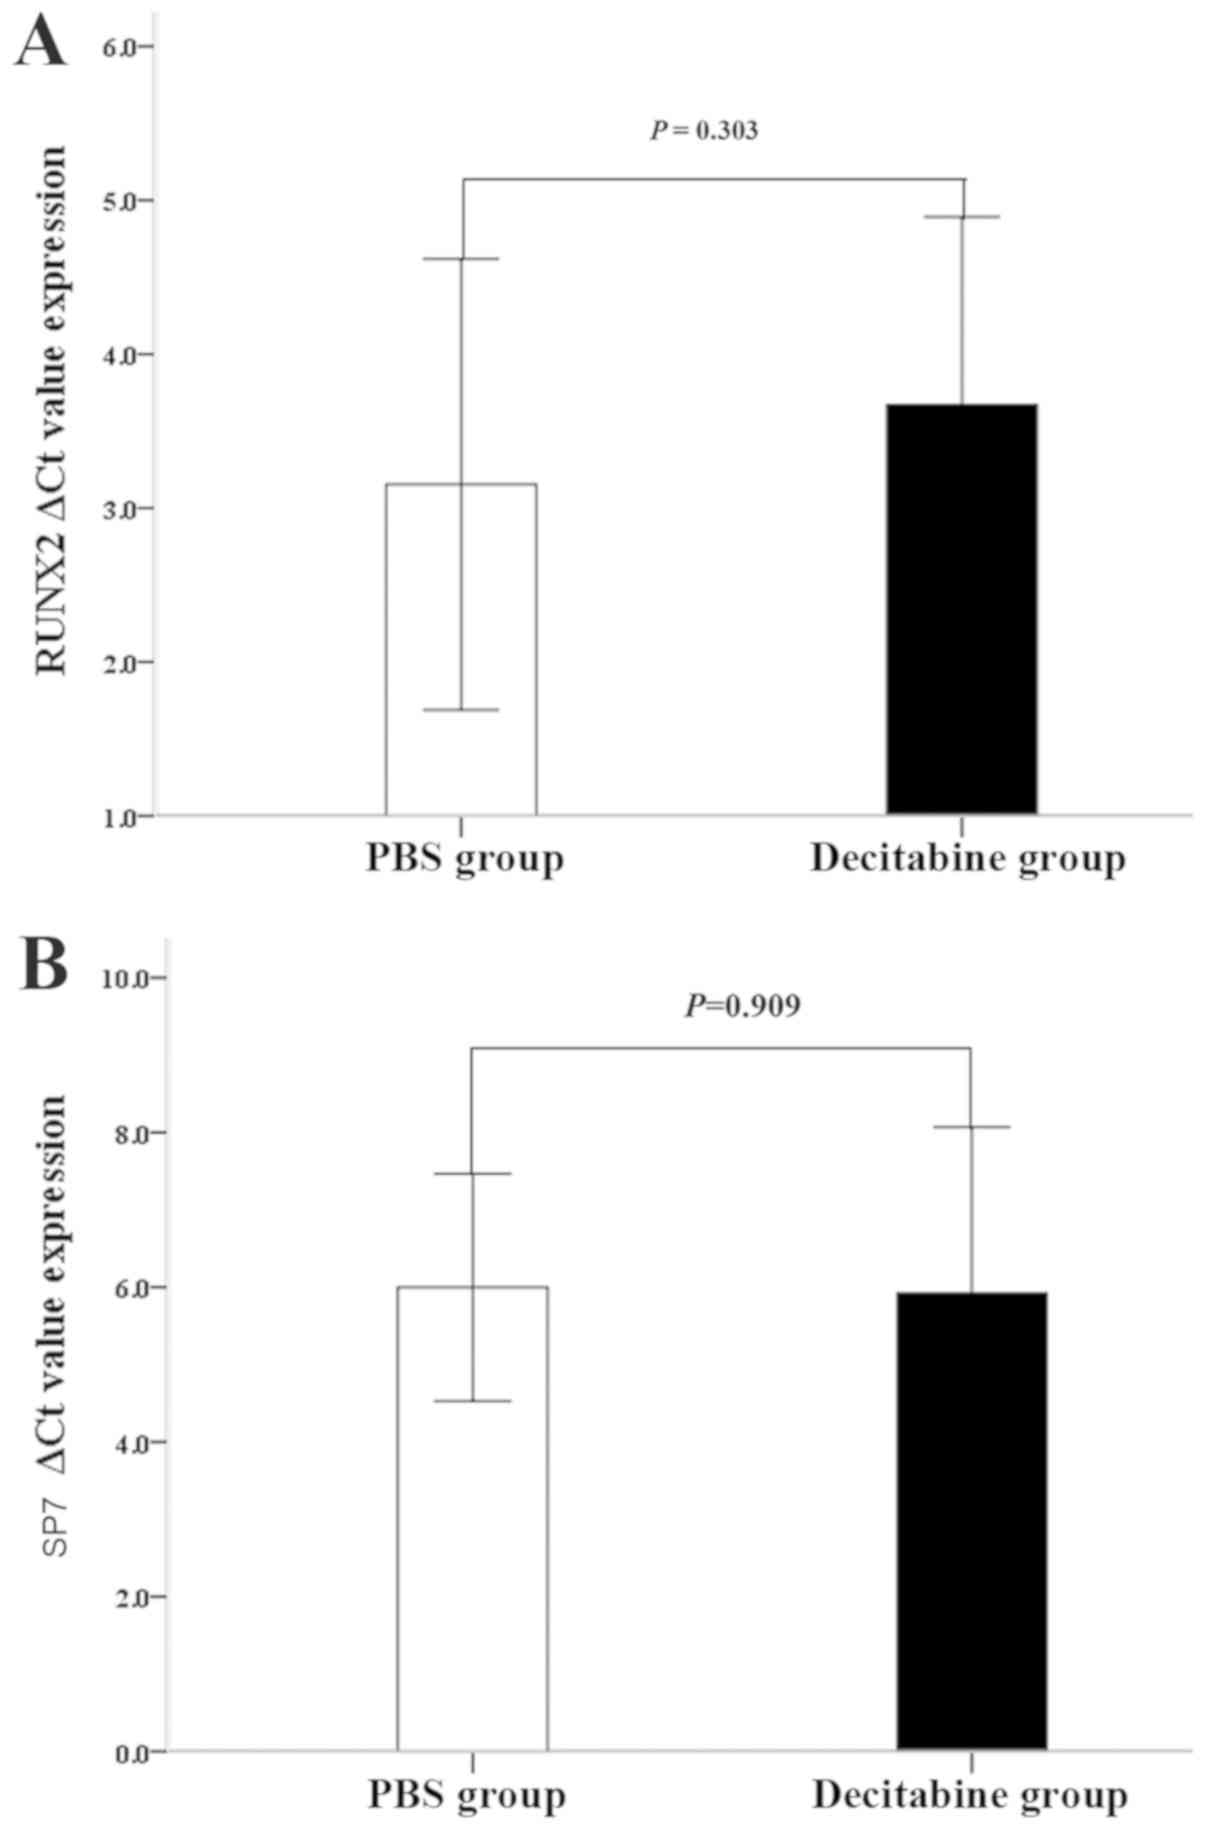
The effect of decitabine on the ability of MDS-MSCs
to differentiate into an osteogenic lineage was investigated. The
results demonstrated that the ΔCq values of RUNX2 in MDS-MSCs
without osteogenic induction were not significantly different
between the two groups (3.67±1.22 for the decitabine-treated group;
3.15±1.46 for the control group; n=15; P=0.303; Fig. 4A). The ΔCq value of SP7 slightly
decreased in the decitabine-treated group (5.92±2.15) compared with
the control group (6.00±1.46) but was not statistically significant
(n=15; P=0.909; Fig. 4B).
Immunosuppressive phenotype of
MDS-MSCs is reduced by decitabine treatment
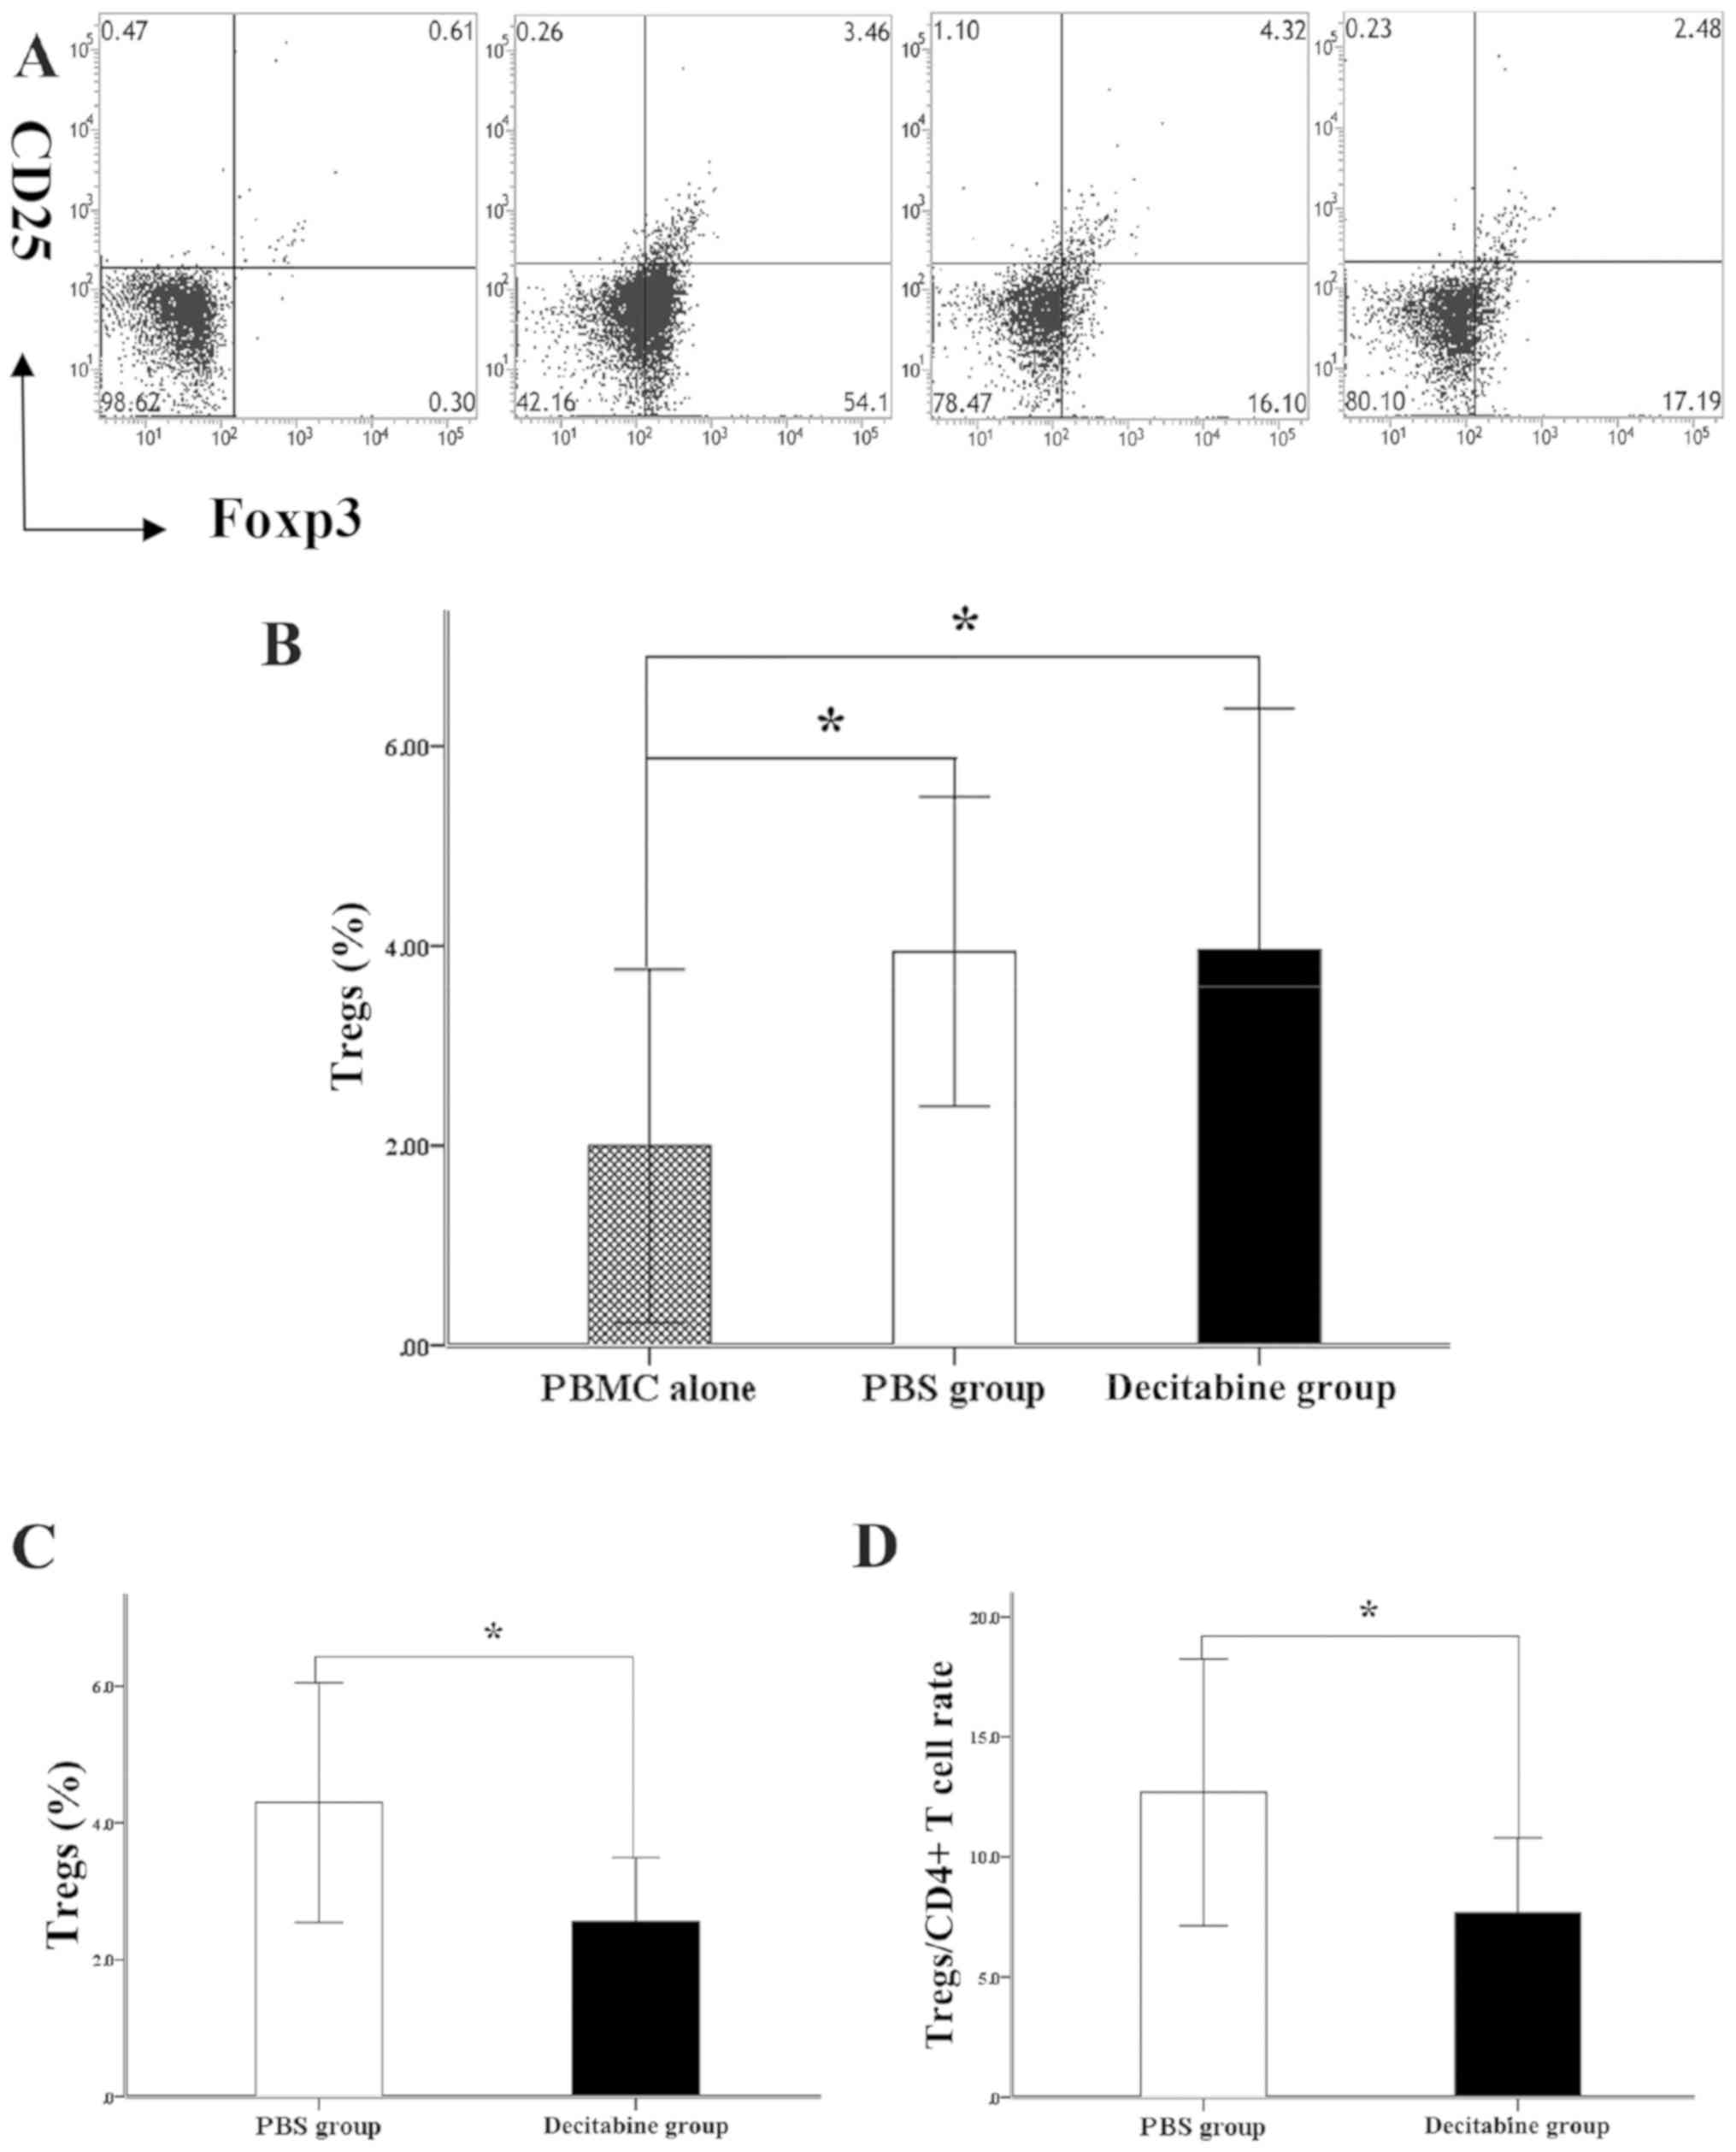
In the present study, decitabine-or PBS-treated
MDS-MSCs were co-cultured with PBMCs in vitro. The results
indicated that decitabine-and PBS-treated MDS-MSCs efficiently
generated CD4+CD25+FOXP3+Tregs
from activated T cells compared with PBMCs alone (2.00±1.77% for
PBMCs, 3.94±1.55% for the PBS group and 3.96±2.42% for the
decitabine group, P=0.015 and P=0.014, respectively; Fig. 5A and B). The effect of decitabine on
the ability of MDS-MSCs to induce T cells into Tregs was
investigated. The results showed that the induction of Tregs cell
was decreased in nine out of 13 decitabine-treated MDS-MSCs
samples. In the aforementioned nine samples of MDS-MSCs, the
percentage of CD4+T cells was similar between the
decitabine group and the PBS group (34.20±7.39 vs. 34.43±6.14%;
P=0.944). Furthermore, the percentage of
CD4+CD25+cells was not significantly
different between the decitabine and PBS groups (4.27±2.33 vs.
4.03±2.89%; P=0.849). The induction of T cells to Tregs was lower
in the decitabine-treated group compared with the PBS group
(decitabine group, 2.56±0.93%; PBS group, 4.30±1.57%; n=9; P=0.019;
Fig. 5C). To minimize the effect of
the two groups of MDS-MSC on CD4+T cells, the ratios of
Tregs to CD4+ T cells in the two groups were calculated.
The percentage of the decitabine group was lower compared with that
of the PBS group (7.68±3.12 vs. 12.69±5.55%; P=0.031; Fig. 5D).
As CD274 on MSCs serves an important role in
inducing activated T cells to differentiate into Tregs (24), the effect of decitabine treatment on
the expression levels of CD274 on MDS-MSCs was investigated in the
current study. The ΔCq value of CD274 on the MDS-MSCs in the
decitabine-treated group was significantly increased compared with
the control group (12.36±0.32 vs. 11.24±0.91; P=0.010), indicating
that the expression of CD274 on MDS-MSCs was inhibited by
decitabine.
Discussion
MDS is a complex disease that involves the
hematopoietic and BM microenvironment (4–6).
Previous studies demonstrated that the primary dysfunction of MSCs
may contribute to the evolution of MDS (5,6). The
role of MDS-MSCs in the pathogenesis of MDS remains unclear;
however, the senescent phenotype of MDS-MSCs may be involved in the
progression of MDS and may be a potential therapeutic target
(4). Therefore, the present study
investigated the effect of decitabine on the senescent phenotype of
MDS-MSCs.
The results obtained indicated that there was no
significant effect on the growth potential, apoptosis and mRNA
expression levels of transcription factors involved in the
osteogenic differentiation of MDS-MSCs treated with decitabine
compared with the control group. However, an altered cell cycle was
detected in MDS-MSCs treated with decitabine; notably a decrease in
the number of cells at the G1 phase and an increase in the number
of cells at the G2/M phase compared with the control group. In
addition, decitabine significantly diminished the induction of
activated T cells to differentiate into Tregs by MDS-MSCs, which
was associated with the decreased expression of PD-L1 on
decitabine-treated MDS-MSCs compared with the control group.
A previous pharmacokinetic study revealed that
decitabine exhibits in vitro antitumor effects on primary
human leukemia cells at concentrations (0.02–0.30 µM) similar to
which tumor cells in responding patients with MDS/AML are likely
exposed to in clinical settings (20). Previous studies have also
demonstrated that 0.10–0.25 µM decitabine can induce an immune
response (21,25). Therefore, 0.25 µM decitabine was
selected to study effects on MSCs in the present study. However,
other studies on solid tumor cell lines revealed that the growth of
tumor cells was not significantly inhibited by decitabine at such
low doses (26,27). Decitabine at low doses may not cause
cytotoxicity and DNA damage, but rather induces transcription of
endogenous dsRNAs in ovarian cancer that activate the viral
recognition and interferon response pathway, which lead to a
tumor-inhibiting immune response (14,28). The
current study revealed that the mRNA levels of SP7 and RUNX2, the
transcription factors involved in the early differentiation process
toward osteoblasts (10), were not
affected by 0.25 µM decitabine. These results indicated that the
mRNA expression levels of the transcription factors involved in
osteogenic differentiation in MDS-MSCs in the undifferentiated
state were not affected by decitabine treatment. Previous studies
revealed that these transcription factors induced the MSCs into
hematopoietic tissue and bone, i.e. a donor-derived ectopic bone
marrow, through a cartilage intermediate in the adult mouse kidney
capsule (29,30). Furthermore, certain patients with MDS
responded to decitabine treatment (22). Thus further studies are required to
clarify such discrepancies. It is important to consider the dosage
of decitabine when interpreting the results obtained in the current
study. However, other mechanisms including the post-transcriptional
regulation of the transcription factors, DNA methylation and
miRNAs, may be involved in the actions of decitabine (9,10).
The current study investigated the effect of
decitabine on the senescent phenotype of the isolated MDS-MSCs. The
cellular senescence was associated with cells in the G0/1 phase of
the cell cycle (31). The results
obtained in the current study indicated that the cell cycle of
MDS-MSCs was altered by decitabine treatment, leading to fewer
cells in the G0/G1 phases. A previous study revealed that the
senescent phenotype of MDS-MSCs was associated with cells
accumulated in the G0/1 phase of the cell cycle (9). Accordingly, the mRNA expression level
of CDKN1A in MDS-MSCs treated with decitabine was lower compared
with the control group; however, this difference was not
statistically significant. It is likely due to the fact that CDKN1A
is not the only G0/G1 phase regulator; there are several other
molecules, including TP53 and miRNAs, which are involved in the
process (9,19).
Tregs expansion in malignant diseases leads to the
suppression of host antitumor responses and is a feature of the
progression to aggressive subtypes in MDS (32). Tregs serve an important role during
the progression of MDS from a low to a high-risk stage. Previous
studies reported that the ability of high-risk MDS-MSCs to induce T
cells to differentiate into Tregs is greater compared with low-risk
MDS-MSCs (32,33). The current study showed that he
induction of activated T cells to differentiate into Tregs was
impeded by MDS-MSCs treated with 0.25 µM decitabine. The
aforementioned results suggested that decitabine treatment reverses
the inhibitory immune microenvironment induced by MDS-MSCs. These
results have important clinical implications, as the
immunosuppressive microenvironment created by the senescent MSCs
serves an important role in the progression from low-to high-risk
MDS (33). The decreased expression
of CD274 on decitabine-treated MDS-MSCs may be the mechanism
underlying the impaired ability of the MDS-MSCs to induce activated
T cells to differentiate into Tregs. CD274, a main ligand for
programmed cell death 1, is widely expressed in tissues and
contributes to the immunosuppressive microenvironment in MDS that
protects malignant cells from immune destruction (34). Reversing the cellular senescence of
MDS-MSCs may delay the progression of MDS (9).
The results of the current study suggested that
MDS-MSCs may be targeted by novel pharmacological intervention and
has important clinical implications. In recent years, knowledge
surrounding immunological dysfunction and the function of the HSC
niche in MDS has increased. A cure for MDS and AML is unlikely to
be achieved through the selective targeting of the
dysplastic/leukemic clones. Rather, a combination approach
consisting of the following approaches may be more effective: i)
targeting of the malignant clones; ii) targeting of the immune
cells, with the aim of releasing the suppressive microenvironment
or reconstruction of the antitumor immune response; and iii)
modulating the surrounding microenvironmental protective niche to
render it less hospitable to malignant cells and more amenable to
normal HSCs (35).
In summary, the current study revealed that 0.25 µM
decitabine altered the cell cycle distribution of the isolated MSCs
from patients with MDS. Furthermore, decitabine-treated MDS-MSCs
inhibited the induction of activated T cells to differentiate into
Treg cells. The results obtained in the current study suggested
that MDS may be partly ameliorated by reducing the
immunosuppressive function of MDS-MSCs by decitabine treatment,
providing a novel avenue for MDS interventions.
Acknowledgements
Not applicable.
Funding
The current study was supported by grants from the
National Natural Science Foundation of China (grant no. 81500102),
the Science and Technology Planning Project of Guangdong (grant
nos. 2014B020212009, 2014B020226002, 2015B020227003, 2015B020226001
and 2017B020230004), the Science and Technology Planning Project of
Guangzhou (grant nos. 201803040005, 201803040011 and
201400000003-4) and the Natural Science Foundation of Guangdong
(grant no. S2013030013305).
Availability of data and materials
The datasets used and/or analyzed during the current
study are available from the corresponding author on reasonable
request.
Authors' contributions
SG, HZ, PLL, JW, and XD conceived the study and
designed the experiments. SG, HZ, PJL, LZ, ZL, and JW performed the
experiments. SG, PLL, LZ, and JW analyzed the data. SG, JW and XD
prepared the paper. YP performed the experiments, analyzed the data
and co-wrote the manuscript. All authors read and approved the
final manuscript.
Ethics approval and consent to
participate
MDS-MSCs from patients with MDS and Human PBMCs from
health individual were obtained with informed consent for research
purposes, and the procedures were approved by the Ethics Committees
of Guangdong General Hospital.
Patient consent for publication
Consent to publish has been obtained from the
participant to report individual patient data.
Competing interests
The authors declare that they have no competing
interests.
References
|
1
|
Adès L, Itzykson R and Fenaux P:
Myelodysplastic syndromes. Lancet. 383:2239–2252. 2014. View Article : Google Scholar : PubMed/NCBI
|
|
2
|
Shastri A, Will B, Steidl U and Verma A:
Stem and progenitor cell alterations in myelodysplastic syndromes.
Blood. 129:1586–1594. 2017. View Article : Google Scholar : PubMed/NCBI
|
|
3
|
Ferrer RA, Wobus M, List C, Wehner R,
Schönefeldt C, Brocard B, Mohr B, Rauner M, Schmitz M, Stiehler M,
et al: Mesenchymal stromal cells from patients with myelodyplastic
syndrome display distinct functional alterations that are
modulatedbylenalidomide. Haematologica. 98:1677–1685. 2013.
View Article : Google Scholar : PubMed/NCBI
|
|
4
|
Medyouf H, Mossner M, Jann JC, Nolte F,
Raffel S, Herrmann C, Lier A, Eisen C, Nowak V, Zens B, et al:
Myelodysplastic cells in patients reprogram mesenchymal stromal
cells to establisha transplantable stem cell niche disease unit.
Cell Stem Cell. 14:824–837. 2014. View Article : Google Scholar : PubMed/NCBI
|
|
5
|
Zambetti NA, Ping Z, Chen S, Kenswil KJG,
Mylona MA, Sanders MA, Hoogenboezem RM, Bindels EMJ, Adisty MN, Van
Strien PMH, et al: Mesenchymal inflammation drives genotoxic
stressin hematopoietic stem cells and predicts diseaseevolution in
human pre-leukemia. Cell Stem Cell. 19:613–627. 2016. View Article : Google Scholar : PubMed/NCBI
|
|
6
|
Raaijmakers MH, Mukherjee S, Guo S, Zhang
S, Kobayashi T, Schoonmaker JA, Ebert BL, Al-Shahrour F, Hasserjian
RP, Scadden EO, et al: Bone progenitor dysfunction induces
myelodysplasia andsecondary leukemia. Nature. 464:852–857. 2010.
View Article : Google Scholar : PubMed/NCBI
|
|
7
|
Wang Y, Chen X, Cao W and Shi Y:
Plasticity of mesenchymal stem cells inimmunomodulation:
Pathological andtherapeutic implications. Nat Immunol.
15:1009–10016. 2014. View
Article : Google Scholar : PubMed/NCBI
|
|
8
|
Bagley RG, Weber W, Rouleau C, Yao M,
Honma N, Kataoka S, Ishida I, Roberts BL and Teicher BA: Human
mesenchymal stem cells from bone marrow express tumor endothelial
and stromal markers. Int J Oncol. 34:619–627. 2009. View Article : Google Scholar : PubMed/NCBI
|
|
9
|
Zhao Y, Wu D, Fei C, Guo J, Gu S, Zhu Y,
Xu F, Zhang Z, Wu L, Li X and Chang C: Down-regulation of Dicer1
promotes cellular senescence and decreases the differentiation and
stem cell-supporting capacities of mesenchymal stromal cells in
patients with myelodysplastic syndrome. Haematologica. 100:194–204.
2015. View Article : Google Scholar : PubMed/NCBI
|
|
10
|
Geyh S, Oz S, Cadeddu RP, Fröbel J,
Brückner B, Kündgen A, Fenk R, Bruns I, Zilkens C, Hermsen D, et
al: Insufficient stromal support in MDS results from molecular
andfunctional deficits of mesenchymal stromal cells. Leukemia.
27:1841–1851. 2013. View Article : Google Scholar : PubMed/NCBI
|
|
11
|
Pang Y, Deng C, Geng S, Weng J, Lai P,
Liao P, Zeng L, Lu Z, Zhang J and Du X: Premature exhaustion of
mesenchymal stromal cellsfrom myelodysplastic syndrome patients. Am
J Transl Res. 9:3462–3468. 2017.PubMed/NCBI
|
|
12
|
Pavlaki K, Pontikoglou CG, Demetriadou A,
Batsali AK, Damianaki A, Simantirakis E, Kontakis M, Galanopoulos
A, Kotsianidis I, Kastrinaki MC and Papadaki HA: Impaired
proliferative potential of bone marrow mesenchymal stromal cells in
patients with myelodysplastic syndromes is associated with abnormal
wnt signaling pathway. Stem Cells Dev. 23:1568–1581. 2014.
View Article : Google Scholar : PubMed/NCBI
|
|
13
|
Falconi G, Fabiani E, Fianchi L, Criscuolo
M, Raffaelli CS, Bellesi S, Hohaus S, Voso MT, D'Alò F and Leone G:
Impairment of PI3K/AKT and WNT/β-catenin pathways in bone marrow
mesenchymal stem cells isolated from patients with myelodysplastic
syndromes. Exp Hematol. 44:75–83.e1-4. 2016. View Article : Google Scholar : PubMed/NCBI
|
|
14
|
Roulois D, Loo Yau H, Singhania R, Wang Y,
Danesh A, Shen SY, Han H, Liang G, Jones PA, Pugh TJ, et al:
DNA-demethylating agents target colorectal cancer cells by inducing
viral mimicry by endogenous transcripts. Cell. 162:961–973. 2015.
View Article : Google Scholar : PubMed/NCBI
|
|
15
|
Chiba N, Furukawa K, Takayama S, Asari T,
Chin S, Harada Y, Kumagai G, Wada K, Tanaka T, Ono A, et al:
Decreased DNA methylation in the promoter region of the WNT5A and
GDNF genes may promote the osteogenicity of mesenchymal stemcells
from patients with ossified spinal ligaments. J Pharmacol Sci.
127:467–473. 2015. View Article : Google Scholar : PubMed/NCBI
|
|
16
|
Teklemariam T, Purandare B, Zhao L and
Hantash BM: Inhibition of DNA methylation enhances HLA-G expression
in human mesenchymal stem cells. Biochem Biophys Res Commun.
452:753–759. 2014. View Article : Google Scholar : PubMed/NCBI
|
|
17
|
Vardiman JW, Thiele J, Arber DA, Brunning
RD, Borowitz MJ, Porwit A, Harris NL, Le Beau MM,
Hellström-Lindberg E, Tefferi A and Bloomfield CD: The 2008
revision of the World Health Organization (WHO) classification
ofmyeloid neoplasms and acute leukemia: Rationale and important
changes. Blood. 114:937–951. 2009. View Article : Google Scholar : PubMed/NCBI
|
|
18
|
Dominici M, Le Blanc K, Mueller I,
Slaper-Cortenbach I, Marini F, Krause D, Deans R, Keating A,
Prockop DJ and Horwitz E: Minimal criteria for defining multipotent
mesenchymal stromal cells. The international society for cellular
therapy position statement. Cytotherapy. 8:315–317. 2006.
View Article : Google Scholar : PubMed/NCBI
|
|
19
|
Fei C, Zhao Y, Guo J, Gu S, Li X and Chang
C: Senescence of bone marrow mesenchymal stromal cells is
accompanied by activation of p53/p21 pathway inmyelodysplastic
syndromes. Eur J Haematol. 93:476–486. 2014. View Article : Google Scholar : PubMed/NCBI
|
|
20
|
Tsai HC, Li H, Van Neste L, Cai Y, Robert
C, Rassool FV, Shin JJ, Harbom KM, Beaty R, Pappou E, et al:
Transient low doses of DNA-demethylating agents exert durable
antitumor effects on hematological and epithelial tumor cells.
Cancer Cell. 21:430–446. 2012. View Article : Google Scholar : PubMed/NCBI
|
|
21
|
Yao Y, Zhou J, Wang L, Gao X, Ning Q,
Jiang M, Wang J, Wang L and Yu L: Increased PRAME-specific CTL
killing of acute myeloid leukemia cells by either a novel histone
deacetylase inhibitor chidamide alone or combined treatment with
decitabine. PLoS One. 8:e705222013. View Article : Google Scholar : PubMed/NCBI
|
|
22
|
Ding K, Fu R, Liu H, Nachnani DA and Shao
ZH: Effects of decitabine on megakaryocyte maturation in patients
with myelodysplastic syndromes. Oncol Lett. 11:2347–2352. 2016.
View Article : Google Scholar : PubMed/NCBI
|
|
23
|
Livak KJ and Schmittgen TD: Analysis of
relative gene expression data using real-time quantitative PCR and
the 2(-Delta Delta C(T)) method. Methods. 25:402–408. 2001.
View Article : Google Scholar : PubMed/NCBI
|
|
24
|
Armand P: Immune checkpoint blockade in
hematologic malignancies. Blood. 125:3393–3400. 2015. View Article : Google Scholar : PubMed/NCBI
|
|
25
|
Chiappinelli KB, Strissel PL, Desrichard
A, Li H, Henke C, Akman B, Hein A, Rote NS, Cope LM, Snyder A, et
al: Inhibiting DNA methylation causes an interferon response in
cancer via dsRNA including endogenous retroviruses. Cell.
169:3612017. View Article : Google Scholar : PubMed/NCBI
|
|
26
|
Shin DY, Sung Kang H, Kim GY, Kim WJ, Yoo
YH and Choi YH: Decitabine, a DNA methyltransferases inhibitor,
induces cell cycle arrest at G2/M phase through p53-independent
pathway in human cancer cells. Biomed Pharmacother. 67:305–311.
2013. View Article : Google Scholar : PubMed/NCBI
|
|
27
|
Shang D, Han T, Xu X and Liu Y: Decitabine
induces G2/M cell cycle arrest by suppressing p38/NF-κB signaling
inhuman renal clear cell carcinoma. Int J Clin Exp Pathol.
8:11140–11148. 2015.PubMed/NCBI
|
|
28
|
Diesch J, Zwick A, Garz AK, Palau A,
Buschbeck M and Götze KS: A clinical-molecular update
onazanucleoside-based therapy for thetreatment of hematologic
cancers. Clin Epigenetics. 8:712016. View Article : Google Scholar : PubMed/NCBI
|
|
29
|
Reinisch A, Etchart N, Thomas D, Hofmann
NA, Fruehwirth M, Sinha S, Chan CK, Senarath-Yapa K, Seo EY, Wearda
T, et al: Epigenetic and in vivo comparison of diverse MSC sources
reveals an endochondral signature for human hematopoietic niche
formation. Blood. 125:249–260. 2015. View Article : Google Scholar : PubMed/NCBI
|
|
30
|
Chan CK, Chen CC, Luppen CA, Kim JB,
DeBoer AT, Wei K, Helms JA, Kuo CJ, Kraft DL and Weissman IL:
Endochondral ossification is required for haematopoietic stem-cell
niche formation. Nature. 457:490–494. 2009. View Article : Google Scholar : PubMed/NCBI
|
|
31
|
Mao Z, Ke Z, Gorbunova V and Seluanov A:
Replicatively senescent cells are arrested in G1 and G2 phases.
Aging (Albany NY). 4:431–435. 2012. View Article : Google Scholar : PubMed/NCBI
|
|
32
|
Kordasti SY, Ingram W, Hayden J, Darling
D, Barber L, Afzali B, Lombardi G, Wlodarski MW, Maciejewski JP,
Farzaneh F and Mufti GJ: CD4+CD25high Foxp3+ regulatory T cells in
myelodysplastic syndrome. Blood. 110:847–850. 2007. View Article : Google Scholar : PubMed/NCBI
|
|
33
|
Zhao Z, Wang Z, Li Q, Li W, You Y and Zou
P: The different immunoregulatory functions of mesenchymal stem
cells in patients with low-risk or high-risk myelodysplastic
syndromes. PLoS One. 7:e456752012. View Article : Google Scholar : PubMed/NCBI
|
|
34
|
Yang H, Bueso-Ramos C, DiNardo C, Estecio
MR, Davanlou M, Geng QR, Fang Z, Nguyen M, Pierce S, Wei Y, et al:
Expression of PD-L1, PD-L2, PD-1 and CTLA4 in myelodysplastic
syndromes is enhanced by treatment with hypomethylating agents.
Leukemia. 28:1280–1288. 2014. View Article : Google Scholar : PubMed/NCBI
|
|
35
|
Pleyer L, Valent P and Greil R:
Mesenchymal stem and progenitor cells in normaland dysplastic
hematopoiesis-masters of survivaland clonality? Int J Mol Sci.
17(pii): E10092016. View Article : Google Scholar : PubMed/NCBI
|