Introduction
With an estimated 2.1 million new cases of lung
cancer occurring in 2018, accounting for ~11.6% of all cancer
diagnoses, lung cancer is the most frequently diagnosed type of
cancer and the leading cause of cancer-associated mortality
worldwide (1). During the 15-year
period 2000–2014, the 5-year survival rate of lung cancer was
10–20% in most countries (2). Lung
adenocarcinoma (LAC), a type of non-small cell lung cancer (NSCLC),
is the most diagnosed histological subtype of lung cancer (3). Diagnostic imaging is currently the main
detection method for NSCLC, and the recommended treatment and the
prognosis for patients with NSCLC are largely based on clinical
evidence or pathological Tumor-Node-Metastasis (TNM) stage
(4–6). However, the prognoses of patients with
same-stage tumors may differ (7) and
the underlying tumorigenic mechanism responsible for LAC remains
unclear.
High-throughput technology has provided new methods
for researching the molecular characterization and therapeutic
targets of diseases. An improved understanding of the molecular
characterization of LAC would contribute to its diagnosis,
prognosis, prediction, disease monitoring and emerging therapies.
The Cancer Genome Atlas (TCGA) (8)
is a publicly available dataset containing genomic and clinical
information on numerous types of cancer. The weighted gene
co-expression network analysis (WGCNA) (9) is a free-scale network construction
method suitable for dividing highly correlated genes into modules
and joining these modules to external clinical traits (9), which has advantages over numerous
methods in terms of global network construction (10), and has been used to assign highly
co-expressed genes to several modules. The analysis has been
applied in the construction of a gene network for numerous
different types of cancer, such as breast (11), lung (12) and gastric (13) cancer.
In addition, the least absolute shrinkage and
selection operator (LASSO) (14,15) is a
penalized regression method that could be used to analyze gene
expression profiles. Due to its high dimensionality and high
collinearity (16), the LASSO Cox
regression model could be combined with the WGCNA to identify
biomarkers. A previous study investigated the network-based
signature of LAC in non-smokers using WGCNA and LASSO regression,
and generated a 17-gene-signature that could discriminate the
high-risk subgroup from the low-risk subgroup by survival analysis
(12). However, differentially
expressed genes (DEGs) were filtered from assigned Gene Expression
Omnibus (GEO) datasets and submitted to WGCNA, which may result in
compromised scale-free topology assumption.
Therefore, in the present study, genes of LAC
samples from TCGA were filtered for WGCNA according to a threshold
for average gene expression value, instead of via differential
expression analysis, and the LASSO Cox regression model was used to
detect potential prognostic markers from the selected module
thereafter.
Materials and methods
Gene expression data and clinical
data
Gene expression data and clinical data for patients
with LAC were obtained from TCGA (https://cancergenome.nih.gov/) on May 20, 2018,
including data from 515 LAC samples. The retrieval condition was
(Program Name IS TCGA) AND (Project Id IS TCGA-LUAD) AND (Workflow
Type IS HTSeq-FPKM) AND (Experimental Strategy IS RNA-Seq).
Information on gene expression levels measured via RNA sequencing,
denoted by fragments per kilobase of transcript per million mapped
reads (FPKM), was collected. FPKM=109 × number of reads
mapped to the gene/(number of reads mapped to all protein-coding
genes × length of the gene in base pairs). Clinical information,
including pathological TNM stage and follow-up information, was
also collected.
WGCNA
Network construction and module
detection
A WGCN was constructed using the package WGCNA 1.63
in R (version 3.5.2). The adjacent coefficient (aij) was
calculated by the absolute value of Pearson's correlation
coefficient of genes i and j to the βth power, aij=|cor
(xi, xj)|β, where xi is
the series of expression values for gene i. P<0.05 in the
Pearson's correlation analysis was considered statistically
significant. The lowest power β was chosen when the scale-free
topology fit index curve flattens out upon reaching a high value.
In addition to considering the connection between two correlated
genes, WGCNA also takes into account associated genes, and the
topological overlaps (Tij) are calculated from
aij as follows, to compose a topological overlap matrix
(TOM), as a similarity evaluation reflecting relevancy and overlap
between genes:
Tij={lij+aijmin{ki,kj}+1-aij,i≠j1,i=jlij=∑u≠i,jaiuauj,ki=∑u≠iaiu
In these formulae, u represents common genes linking
genes i and j together, and Tij takes into account the
overlap between neighboring genes of genes i and j. TOM was
subtracted from one and converted into a topological overlap
dissimilarity matrix referred to as the corresponding dissimilarity
of TOM (dissTOM). A hierarchical clustering tree (dendrogram) of
genes was then created based on the dissTOM. Finally, modules of
highly correlated and co-expressed genes were created via a Dynamic
Tree Cut algorithm (17).
Associating modules with external
clinical traits and identifying hub genes
Correlations between modules and clinical traits,
including pathological stage and survival time, were estimated
using Spearman's correlation tests. Significantly correlated module
was preserved and visualized using Cytoscape 3.6.1 (18). Genes with multiple associations were
defined as hub genes.
Gene Ontology (GO) and
pathway-enrichment analysis
The present study investigated the potential
biological functions and signaling pathways of the genes in the
selected module by assessing enrichment using Gene Ontology (GO)
terms and Kyoto Encyclopedia of Genes and Genomes (KEGG) pathways
in Metascape (http://metascape.org) (19).
LASSO Cox regression model
construction
LASSO Cox regression models were constructed using
the package glmnet 2.0–16 in R. By utilizing several hub genes from
the selected module, the function returns a series of values of λ
and models. The coefficients of the majority of the original genes
were penalized to zero in line with the increasing values of the
tuning parameter λ. The λ was chosen when the partial likelihood
deviance reached its lowest. A suitable model was chosen based on
the 10-fold cross-validation of the function cv.glmnet. Using the
function lambda.min, the remaining genes with non-zero LASSO
coefficients were obtained. The risk score for each patient with
LAC was calculated using the linear combination of each FPKM of the
gene (Gk) multiplied by the LASSO coefficient
(ck): Risk score=∑k=1nGkxck.
Statistical analysis
Statistical analyses were conducted using SPSS
software (version 20.0; IBM Corp.). Receiver operating
characteristic (ROC) curves were drawn and the area under the curve
(AUC) was calculated to predict 3-year survival rate. The cut-off
risk score was decided when the Youden index (sensitivity +
specificity-1) in the ROC curve was highest. The samples were then
divided into high- and low-risk groups according to the cut-off.
Survival was compared between the high- and low-risk groups using
Kaplan-Meier analysis and log-rank tests. Hazard ratios (HRs) were
calculated using univariate and multivariable Cox regression
analysis. In a multivariate Cox regression analysis using backward
selection to test the independent significance of different factor,
P>0.10 was used to remove non-significant variables from the
analysis.
Results
Data preprocessing
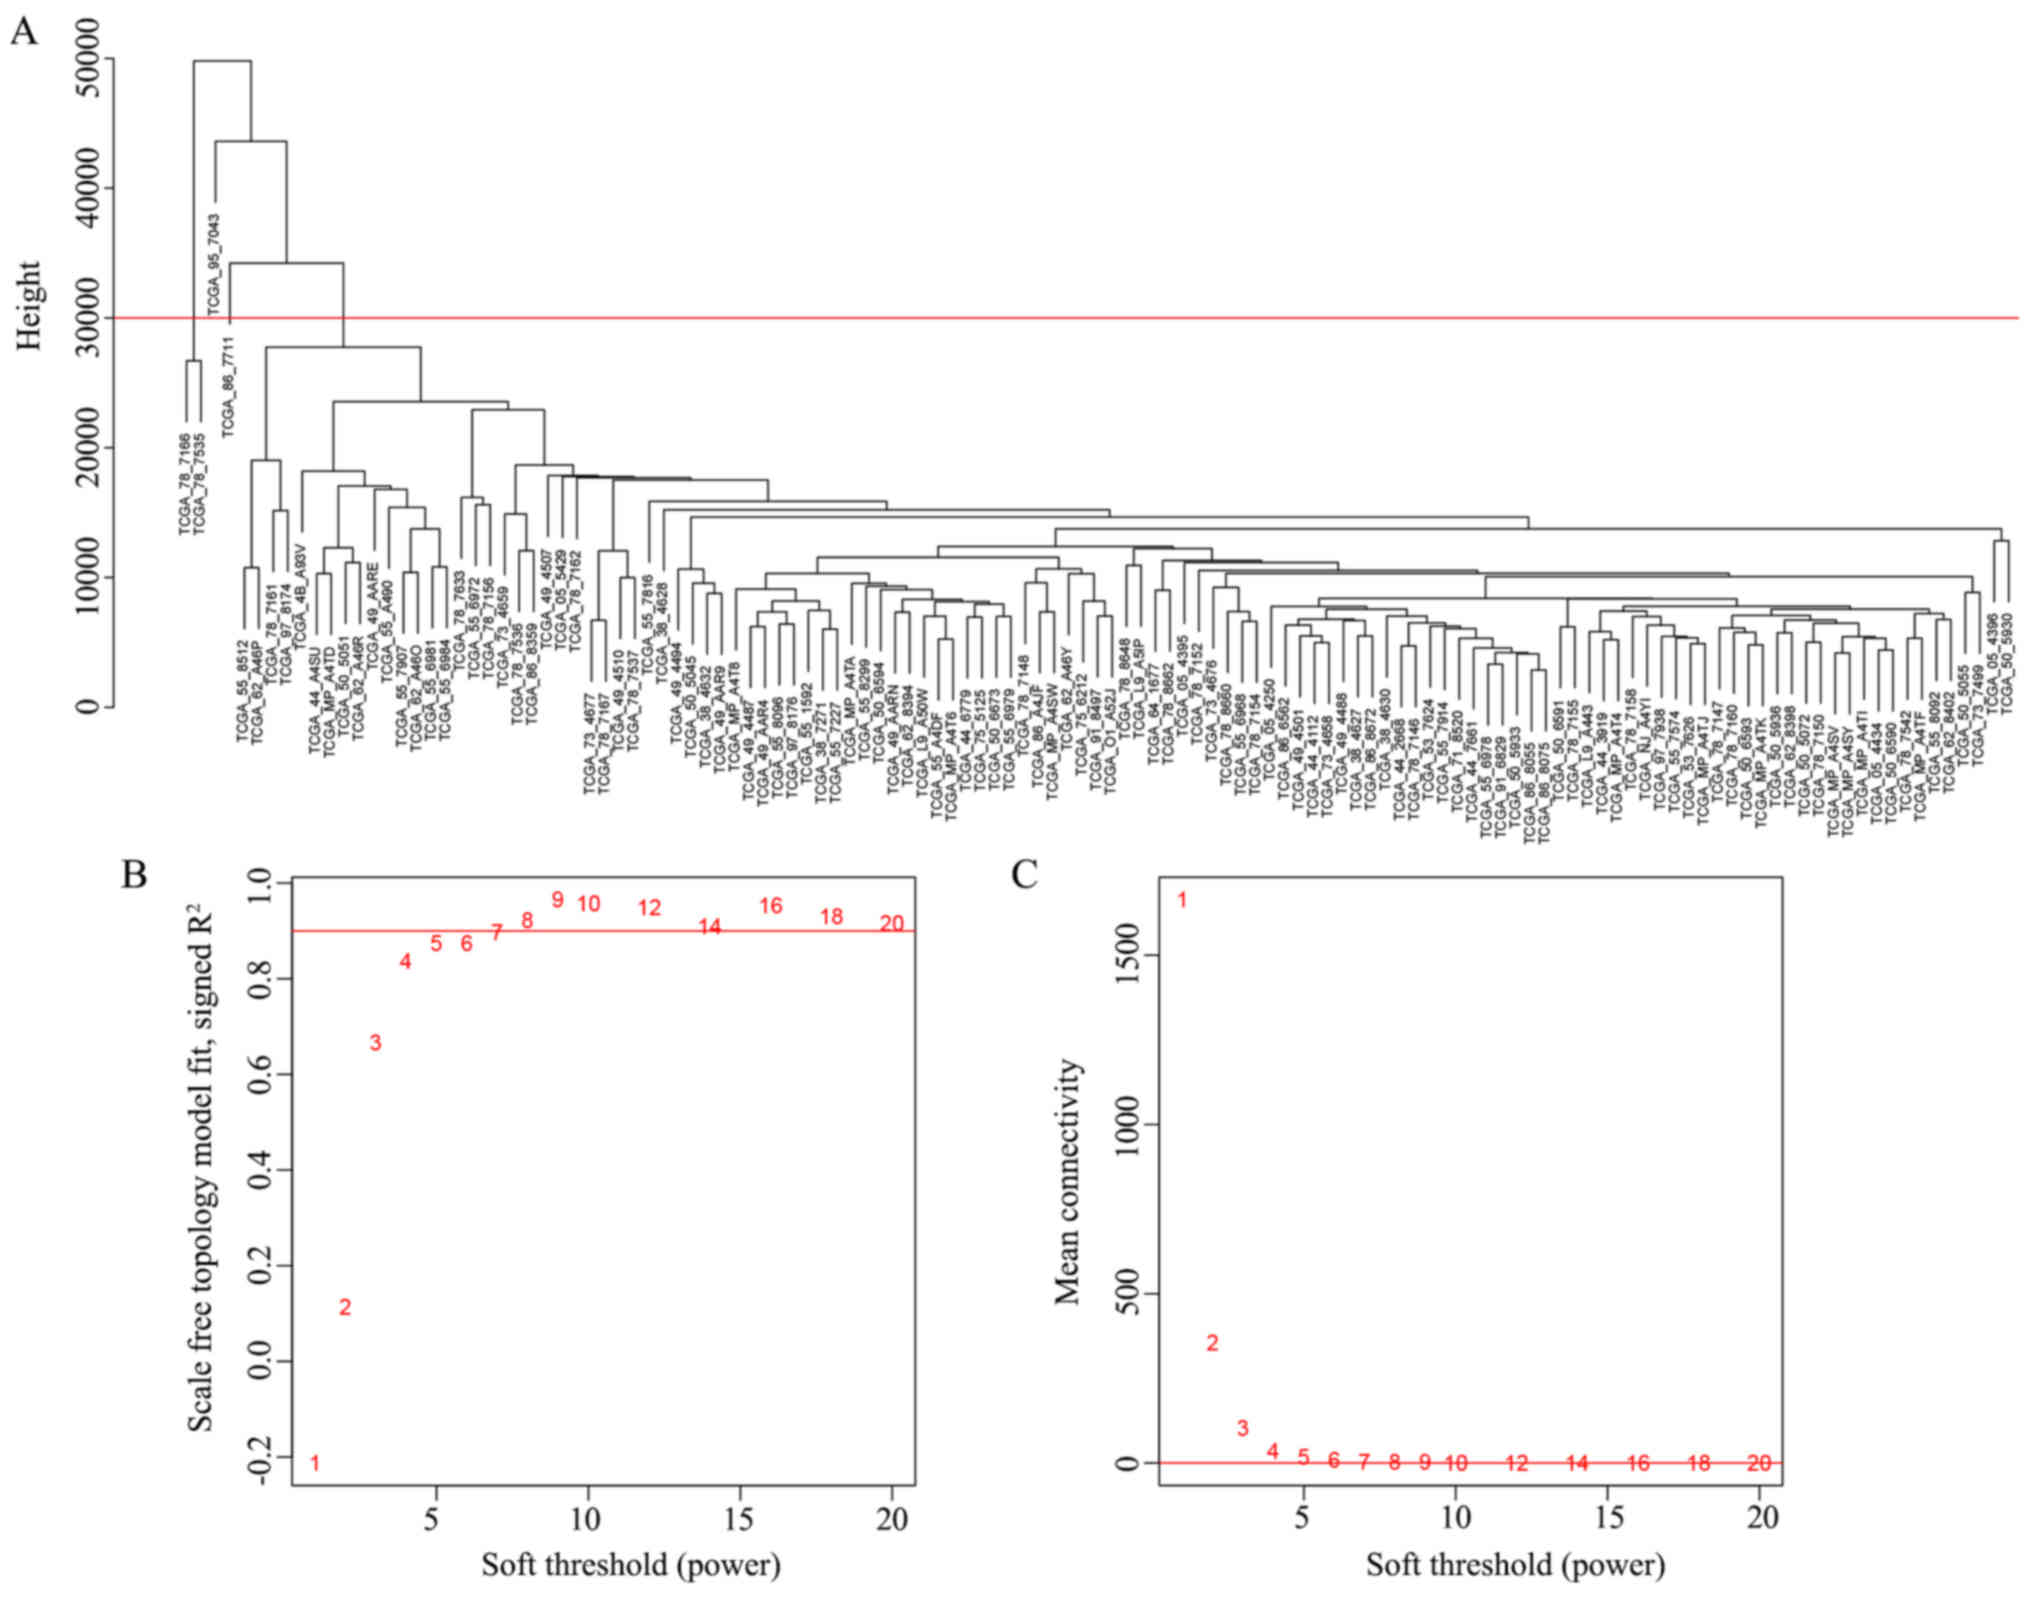
A total of 515 samples from patients diagnosed
between the ages of 33 and 88 years and classified as stage IA-IV
were collected from TCGA, and 498 samples with both gene expression
and clinical information were used for subsequent study. Based on
the pathological TNM stage, these samples were divided into a
training set and a validation set by stratified randomization, in a
ratio of 7:3. A total of 127 samples from patients in the training
set who completed the follow-up were subjected to sample
clustering, and 4 outlier samples were removed prior to the network
construction (Fig. 1A). The
threshold for average gene expression value was set as 1.
Protein-coding genes with average expression values less than the
threshold value in all samples were excluded. The final training
set was comprised of 348 samples and the validation set was
comprised of 150 samples. Data for a total of 123 samples,
including the expression levels of 12,914 protein-coding genes and
clinical information, were obtained for the WGCNA.
WGCN of LAC
When the soft thresholding power β was set as 7, the
scale-free topology fit index curve flattened out at 0.90 (Fig. 1B and C). The constructed weighted
gene co-expression network included 42 modules, including 39–1,360
genes. The grey module included genes that did not belong to any
other modules (Fig. 2A).
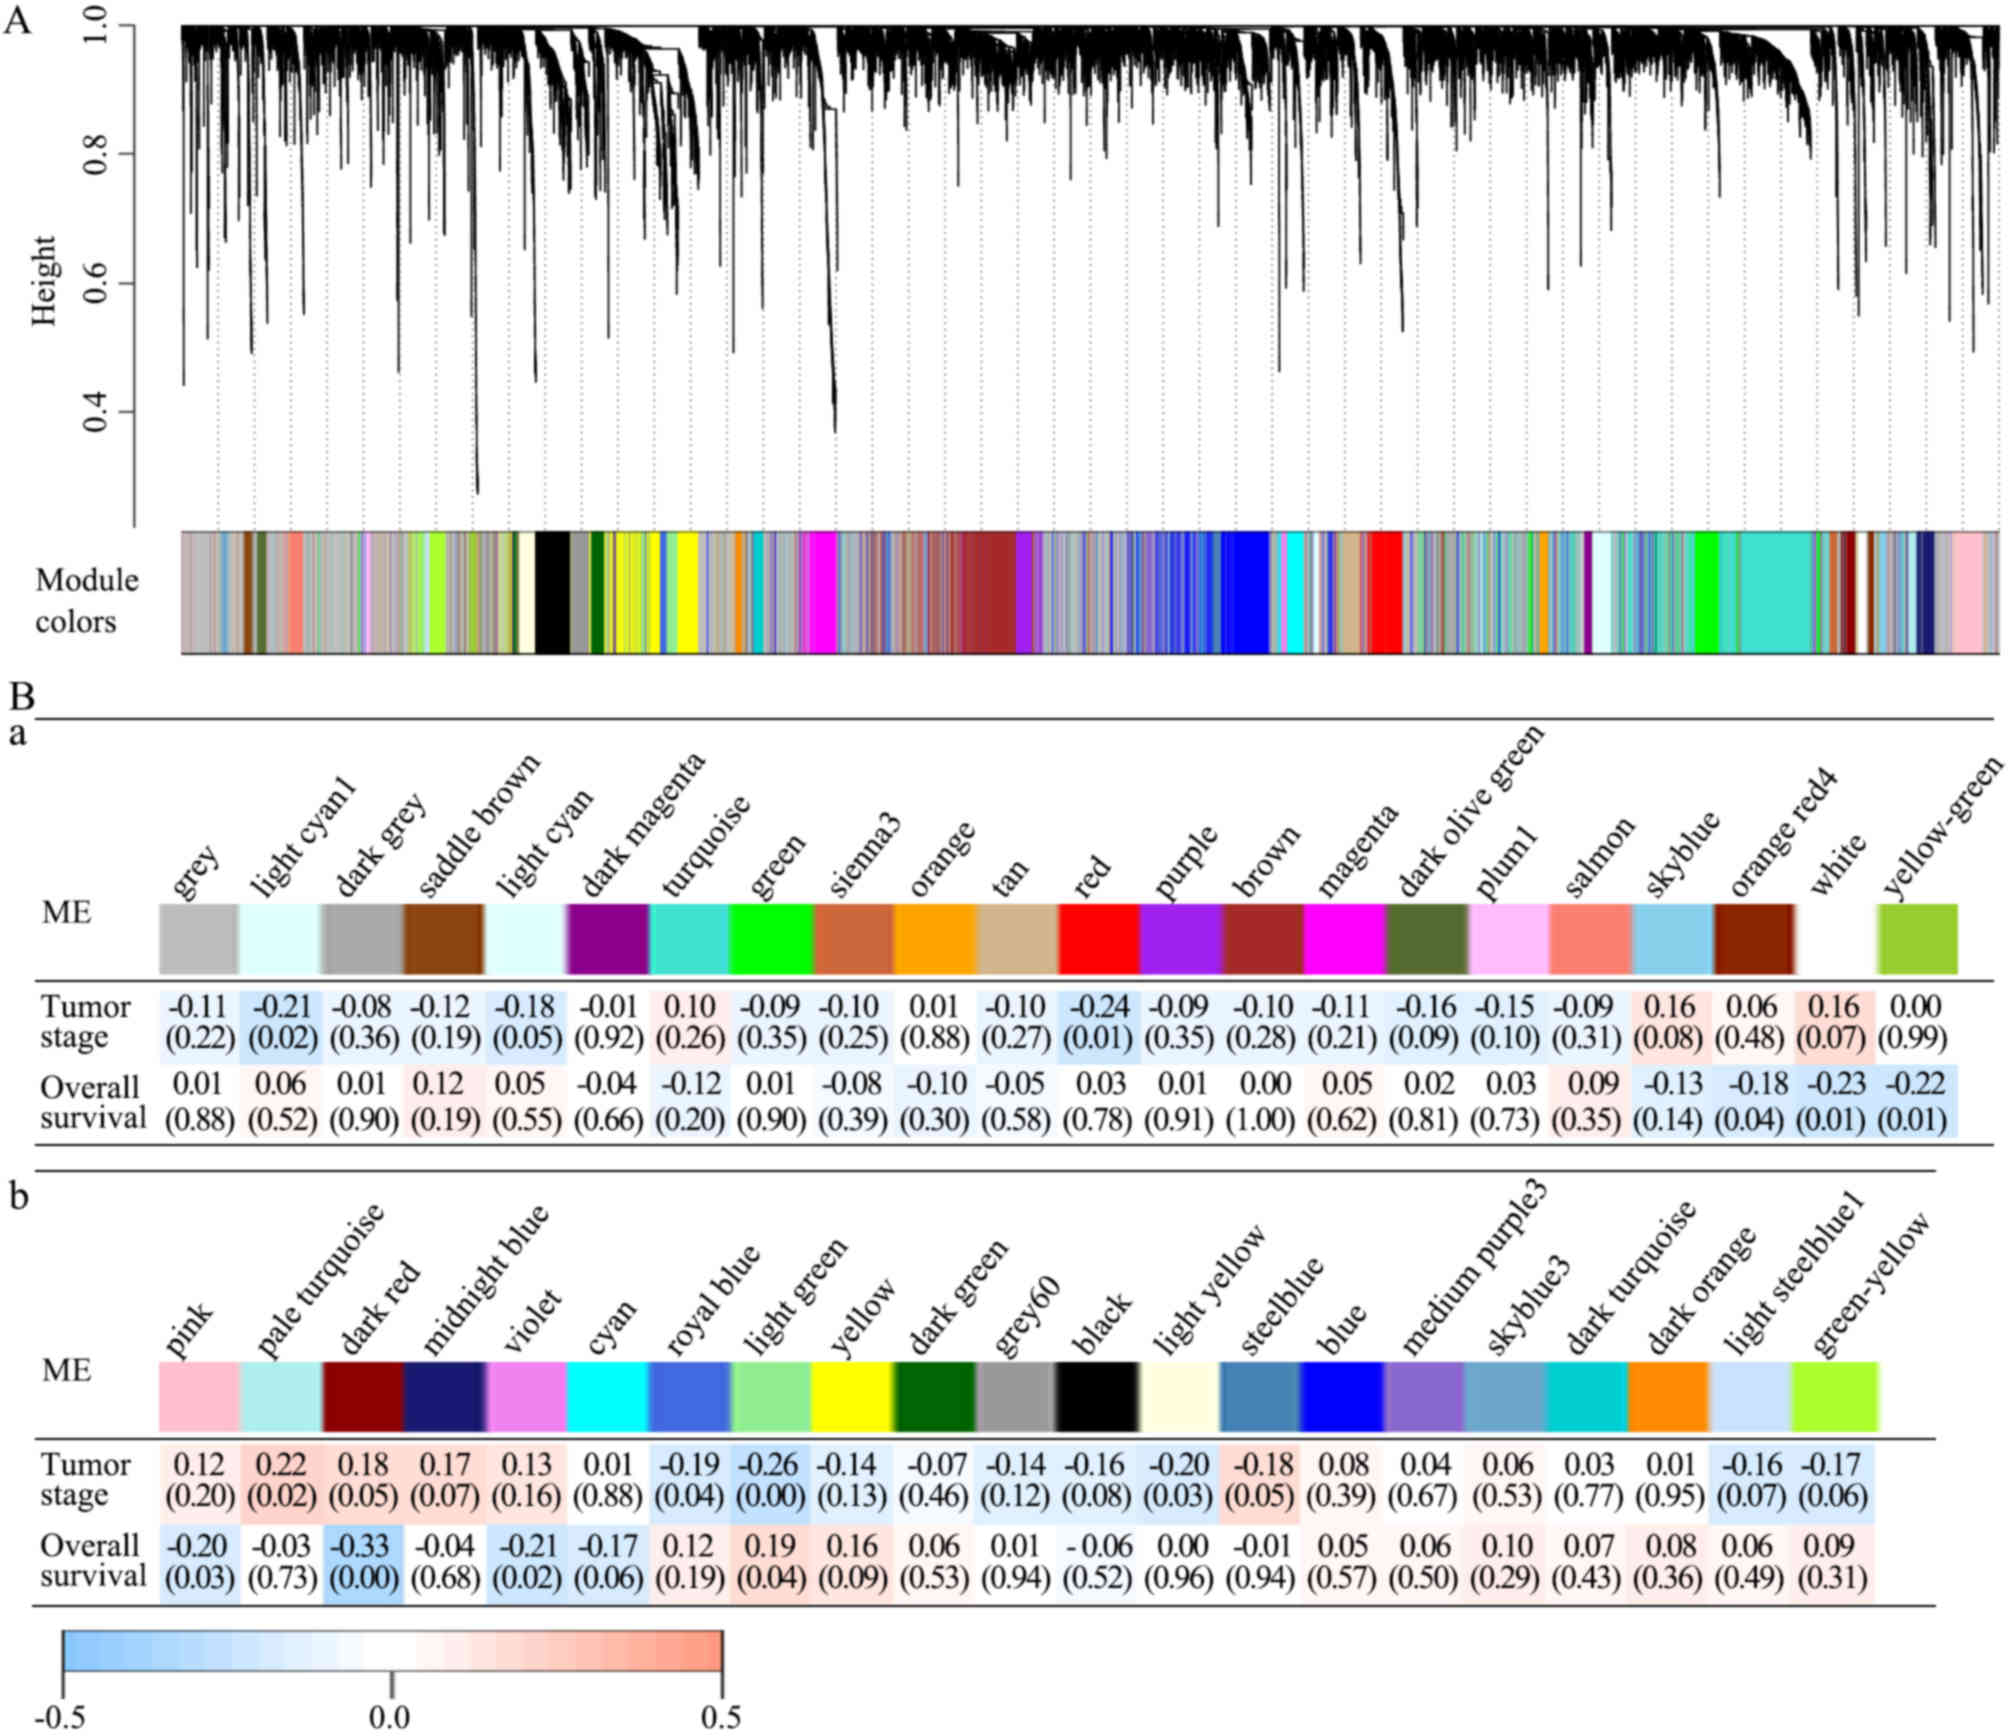 | Figure 2.All 42 modules and their module-trait
associations identified by the WGCNA. (A) The WGCN of LAC
identified 42 modules with correlated genes. A dendrogram was
produced based on the WGCNA package in R by average linkage
hierarchical clustering of 12,914 protein-coding genes. (Ba and b)
Module-trait associations. Each column represents a module
eigengene and each row represents a clinical trait. Each cell
contains the correlation coefficient (first line) and P-value (in
parentheses). The figures are drawn according to the color legend:
Pale turquoise module was positively correlated with pathological
TNM stage; light yellow, light green, royal blue, red and light
cyan modules were negatively correlated with pathological TNM
stage; light green module was positively correlated with survival
time; and violet, dark red, pink, yellow green, white, and orange
red modules were negatively correlated with survival time.
P<0.05 in the Spearman's correlation tests was considered to
indicate a statistically significant result. WGCNA, weighted gene
co-expression network analysis; LAC, lung adenocarcinoma; TNM,
Tumor-Node-Metastasis; ME, module eigengene. |
Identifying modules with clinical
significance
The present study analyzed the correlations between
each module and clinical traits, including pathological TNM stage
and survival information. In the modules, the pale turquoise module
was positively and the light yellow, light green, royal blue, red,
light cyan modules were negatively correlated with pathological TNM
stage, whereas the light green module was positively and the
violet, dark red, pink, yellow green, white, orange red modules
were negatively correlated with survival time. P<0.05 in the
Spearman's correlation tests was considered statistically
significant (Fig. 2Ba and b).
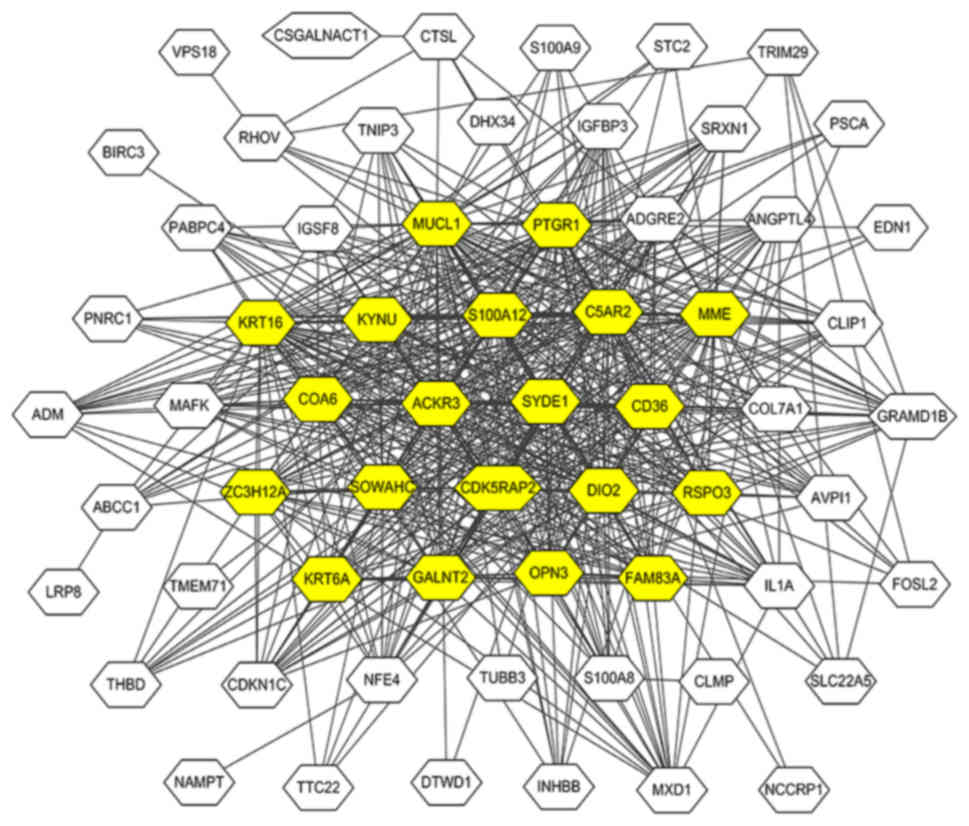
The dark red module was further analyzed, and it was
revealed to have the strongest negative correlation with survival
time (Spearman's correlation-0.33; P<0.01), but was not
considered significantly correlated with pathological TNM stage
(Spearman's correlation 0.18; P=0.05). Therefore, it was possible
to detect prognostic factors independent of staging in the dark red
module. A total of 20 genes with >20 associations were defined
as hub genes in the dark red module, including C5AR2, MUCL1, MME,
KRT16, S100A12, ACKR3, SYDE1, CDK5RAP2, DIO2, SOWAHC, COA6, PTGR1,
OPN3, GALNT2, FAM83A, RSPO3, ZC3H12A, KRT6A, CD36 and KYNU. The
gene network of the dark red module was visualized using Cytoscape
(Fig. 3).
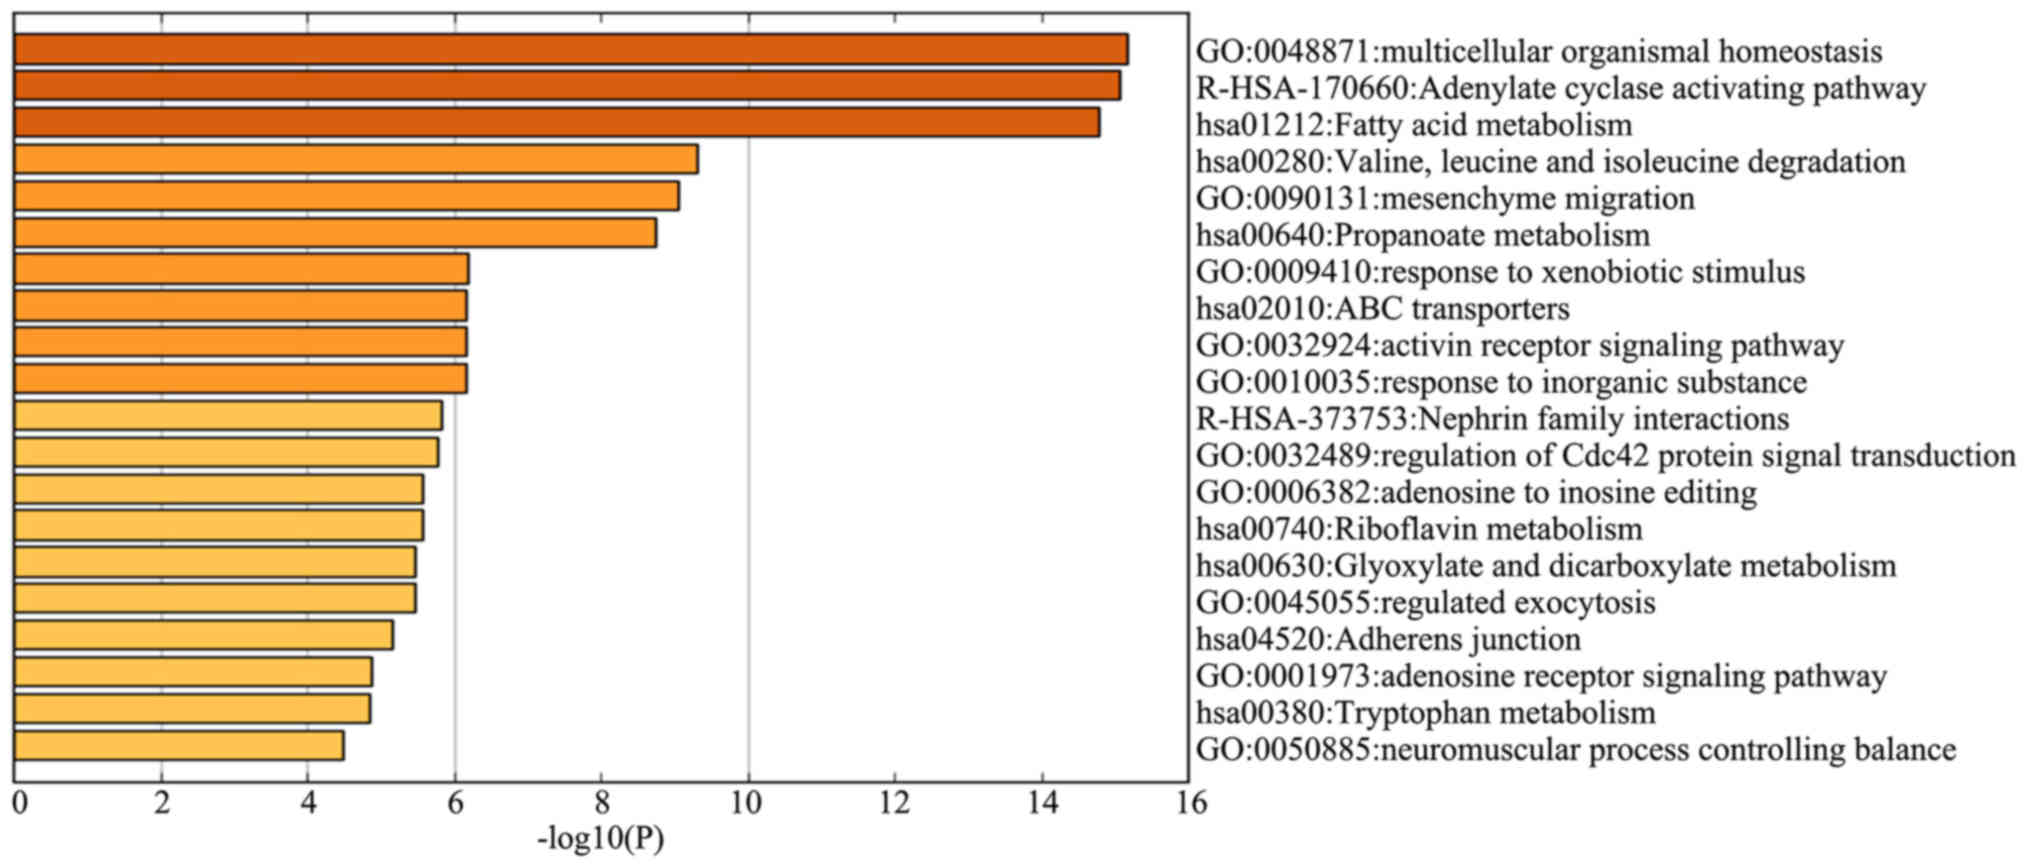
Functional characterization of genes
in the dark red module
In order to investigate the functional significance
of the identified genes in the dark red module, 113 genes were
subjected to GO term and KEGG pathway enrichment analyses. Among
the genes most negatively correlated with survival time,
‘multicellular organismal homeostasis’ (logP, −15.2), ‘adenylate
cyclase activating pathway’ (logP, −15.1) and ‘fatty acid
metabolism’ (logP, −14.8) were also the most significantly enriched
genes in the GO term and KEGG pathway enrichment analyses (Fig. 4).
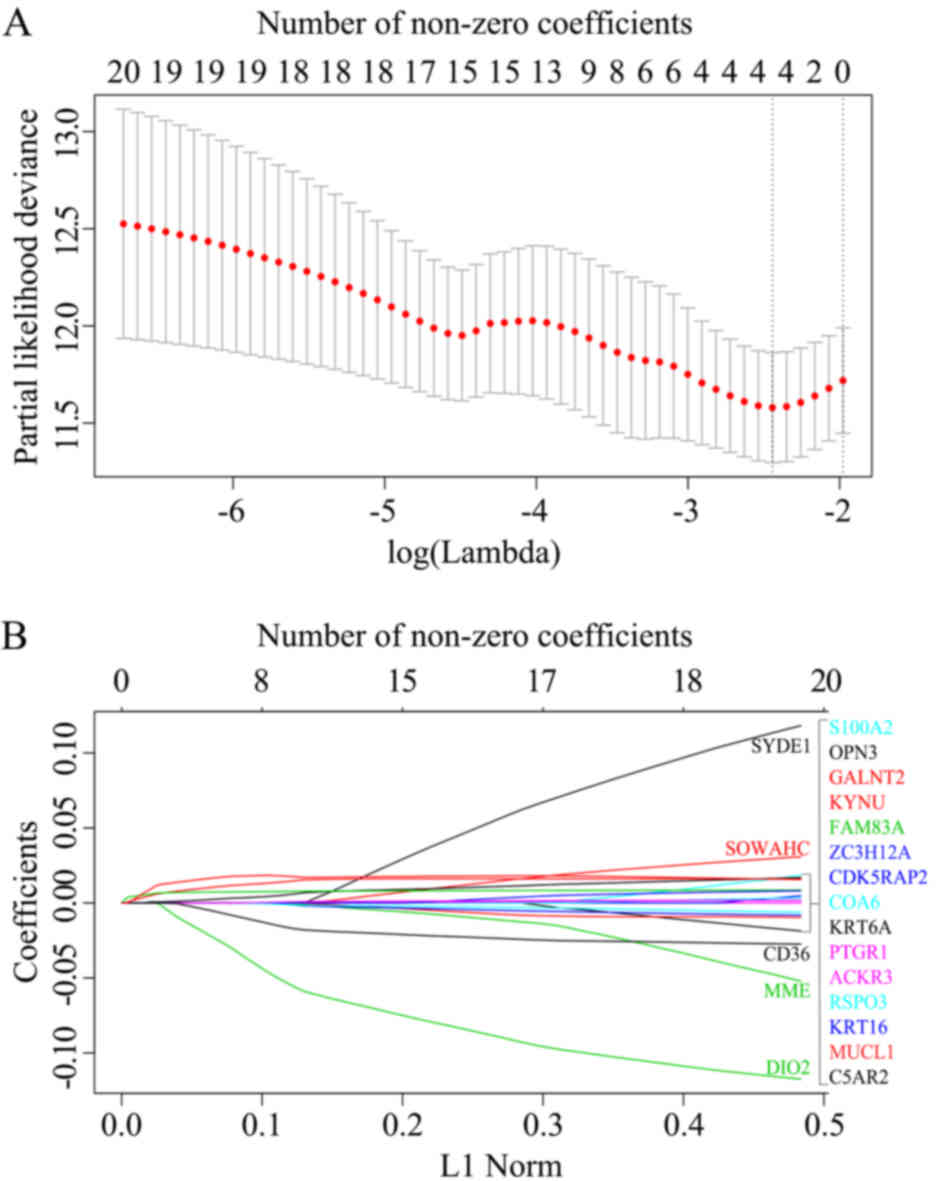
Prognostic signature construction via
LASSO Cox regression model using the training set
The LASSO Cox regression model was constructed using
the glmnet package in R by utilizing several hub genes in the dark
red module. Based on the 10-fold cross-validation, the value 0.087
was chosen as the minimum criteria for λ. At the λ parameter, the
total absolute of non-zero coefficients was 0.0214 and there were
four genes (OPN3, GALNT2, FAM83A and KYNU) obtained with non-zero
coefficients (Fig. 5A and B). Based
on the genes with non-zero coefficients, the risk score of every
patient was calculated according to the linear combination of each
gene expression multiplied by the LASSO coefficients: (0.0004 ×
OPN3) + (0.0042 × GALNT2) + (0.0055 × FAM83A) + (0.0077 ×
KYNU).
Survival analysis
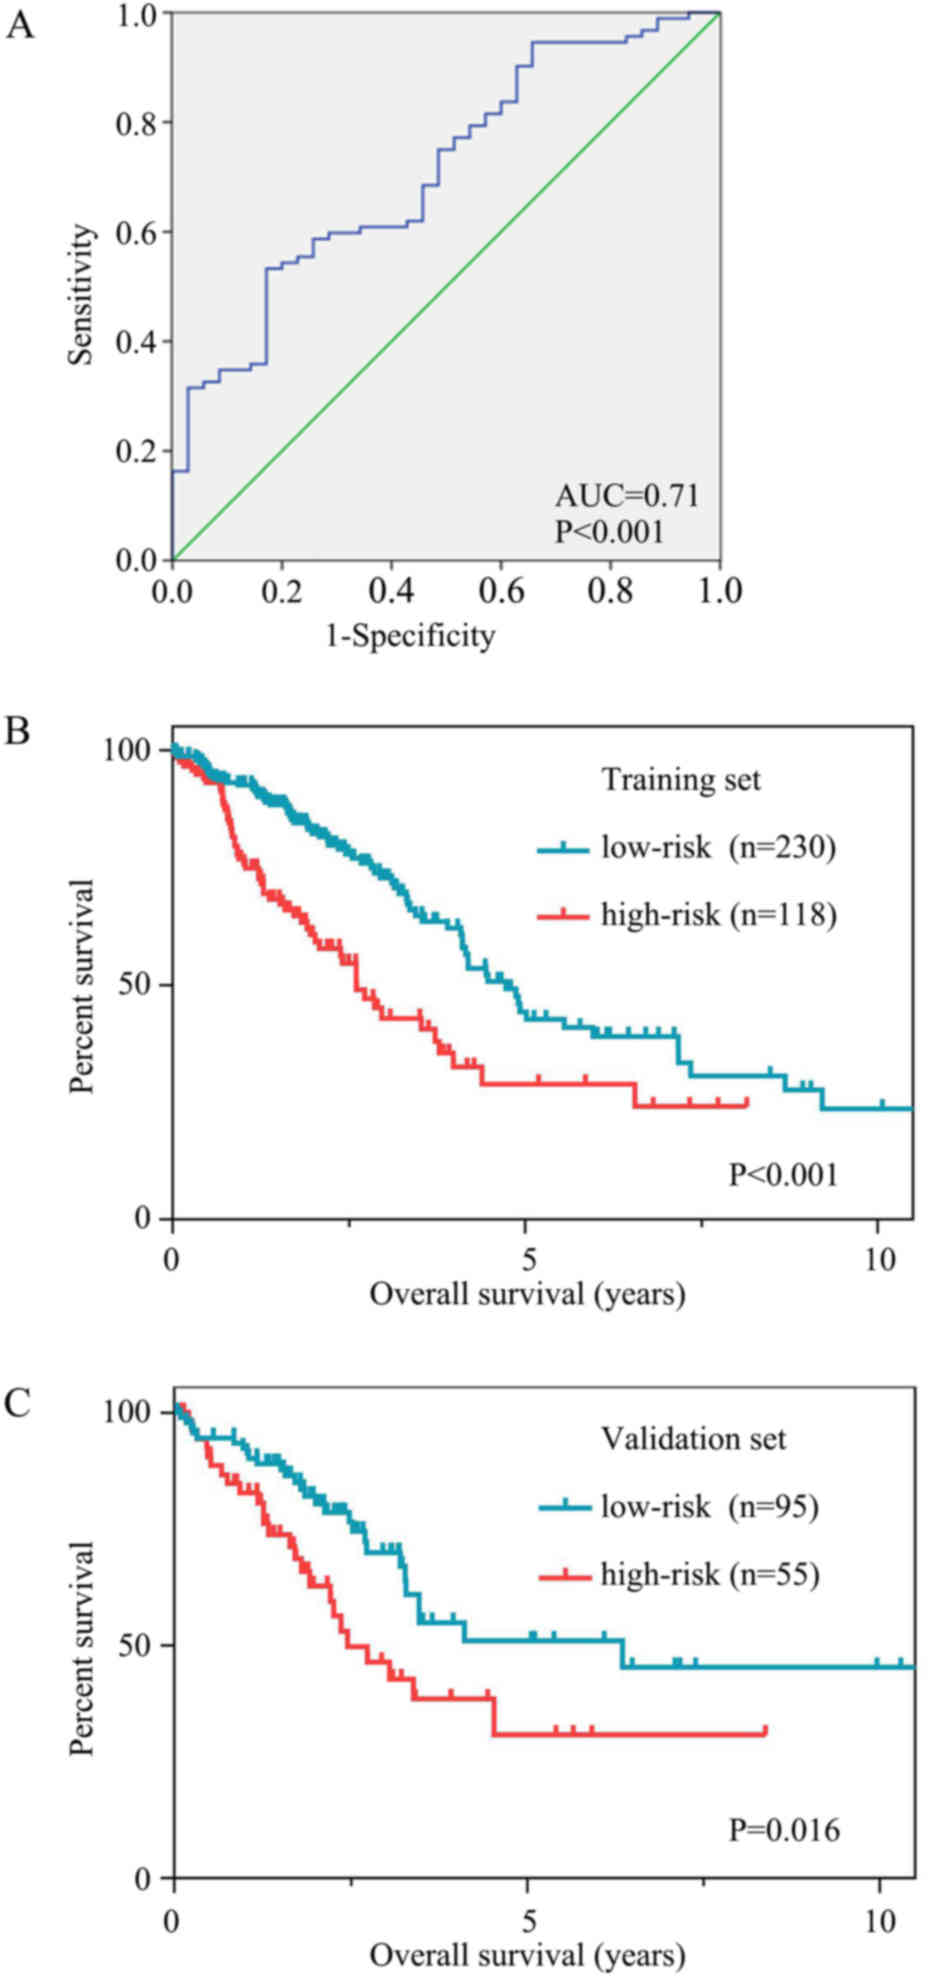
ROC curves were used to assess the prognostic power
based on OS at 3 years (Fig. 6A).
The cut-off risk score was determined to be 0.216. Patients in the
high-risk group had significantly poorer OS time than those in the
low-risk group. The mean OS time was 44.6 months [95% confidence
interval (CI), 35.9–53.3] in the high-risk group and 95.0 months
(95% CI, 73.2–116.9) in the low-risk group (P<0.001; Fig. 6B).
The results were similar for the validation set. The
mean OS time was 48.4 months (95% CI, 35.0–61.7) in the high-risk
group and 93.2 months (95% CI, 71.7–114.6) in the low-risk group
(P=0.016; Fig. 6C).
Risk was then verified as an independent prognostic
factor for OS. Univariable and multivariable analyses of potential
prognostic factors in the total set for OS were performed. The risk
score and TNM stage were associated with OS in the univariable
analysis. Following the multivariable analysis, the risk score and
TNM stage remained prognostic factors for OS (Table I). Patients with LAC who had a
high-risk score experienced poorer OS time (HR, 1.699; 95% CI,
1.242–2.324; P=0.001).
 | Table I.Univariable and multivariable Cox
regression analysis of prognosis factors in the total set for
OS. |
Table I.
Univariable and multivariable Cox
regression analysis of prognosis factors in the total set for
OS.
|
| Univariate
analysis | Multivariable
analysis |
|---|
|
|
|
|
|---|
| OS variable | HR | 95% CI | P-value | HR | 95% CI | P-value |
|---|
| Risk score (high
vs. low) | 1.989 | 1.478–2.679 | <0.001 | 1.699 | 1.242–2.324 |
0.001 |
| TNM stage |
| (Stage
II vs. I) | 2.468 | 1.710–3.562 | <0.001 | 2.111 | 1.437–3.103 | <0.001 |
| (Stage
III vs. I) | 3.623 | 2.473–5.307 | <0.001 | 2.973 | 2.009–4.399 | <0.001 |
| (Stage
IV vs. I) | 3.880 | 2.234–6.740 | <0.001 | 3.355 | 1.929–5.845 | <0.001 |
| Age (≥60 vs. <60
years) | 1.007 | 0.723–1403 |
0.967 |
|
|
|
Clinical and pathological TNM staging serves an
important role in predicting the prognosis of patients with LAC.
The 5-year survival rate is 77–92% for clinical stage IA, 68% for
stage IB; 60% for stage IIA and 53% for stage IIB. For pathological
stage, the 5-year survival is 80–90% for stage IA, 73% for stage
IB, 65% for stage IIA and 56% for stage IIB (6). In the present study, when comparing TNM
stage on multivariable analysis, stage II (HR, 2.111), stage III
(HR, 2.973) and stage IV (HR, 3.355) patients had poorer OS
compared with stage I patients (all P<0.001). Age had no effect
on LAC prognosis (Table I).
Discussion
In the present study, a survival-associated risk
score for LAC was identified using the combination of WGCNA and the
LASSO Cox regression model in order to investigate a new molecular
characterization of LAC that was associated with prognosis, and a
risk model was produced to aid its diagnosis and management. A
training set consisting of 348 LAC samples with gene expression and
clinical information was analyzed to detect survival-associated
biomarkers, and the results were verified in a validation set
comprising 150 LAC samples. The results from the present study
suggested that these four novel markers could effectively be of
diagnostic and therapeutic value for the management of LAC.
WGCNA provides a comprehensive set of functions for
performing a weighted correlation network analysis, and is designed
to construct a gene network at very large scales (9). The Cox regression model (20) is used for regression analyses of
censored survival data. However, the standard maximum Cox partial
likelihood method cannot be applied directly to genes with very
high dimensionality and highly correlated expression levels
(16). Tibshirani (14) expanded the LASSO method for variable
selection in the Cox model and proposed minimizing the log partial
likelihood subject to the sum of the absolute values of the
parameters being bounded by a constant in order to obtain the
parameter estimates. This method facilitates model fitting in
situations where there are as many, or even more, explanatory
variables than there are observations, and only a few variables are
relevant to explaining the data (21). As long as the training set is not
smaller than the number of predictors, this procedure can be
applied directly to the genes selected by WGCNA.
Recent research constructed prognostic models for
LAC based on the gene expression data, with the aim of improving
its early diagnosis and personalized treatment (22). Zhao et al (23) integrated differential expression and
regression analyses for LAC datasets from TCGA and GEO. The AUCs of
their 4-gene and 20-gene models were 0.5731 and 0.615,
respectively. Mao et al (12)
considered DEGs in non-smokers with LAC and defined the threshold
for DEGs as a fold-change >2, with an adjusted P-value of
<0.05. DEGs from the assigned datasets were submitted to WGCNA.
This study highlighted two gene modules associated with non-smoking
LAC through WGCNA and built a prognostic signature with 17
candidate genes, which provided a novel compendium of biomarkers to
act as a guide for therapy in non-smokers with LAC (12). However, these previous models did not
consider protein-coding genes that were below the threshold for
DEGs. Being designed to be an unsupervised analysis method, WGCNA
clusters genes based on their expression profiles. Since
low-expression or non-varying genes usually represent noise, it is
suggested to filter genes by mean expression or variance. Filtering
genes by differential expression is not recommended, as it would
invalidate the scale-free topology assumption leading to the
creation of a few highly correlated modules. In addition, it fails
to select soft thresholding power by scale-free topology (24).
Studies regarding the use of liquid biopsies, such
as tumor-educated platelets, cell-free DNA, circulating tumor cells
and extracellular vesicles, have markedly increased in number and
may radically change the future management of tumors (22,25,26). In
the present study, the LASSO Cox regression model construction of
the hub genes in the dark red module identified OPN3, GALNT2,
FAM83A and KYNU as the most valuable genes associated with LAC
survival. The risk score tends to be larger with increasing
expression of these genes, and patients with LAC that had high risk
scores had significantly poorer OS times. However, to the best of
our knowledge, there are relatively few studies regarding these
genes, particularly OPN3. It cannot yet be concluded that they play
an important role in the survival of patients with LAC. OPN3 is
highly expressed in the brain and testes, and weakly expressed in
the liver, placenta, heart, lung, skeletal muscle, kidney and
pancreas (27). Acquired resistance
to 5-fluorouracil in hepatocellular carcinoma cells can be reversed
by overexpression of OPN3 (28).
Yoshimoto et al (29)
identified that OPN3-knockdown reversed the effect of decreased
colon cancer cell viability following blue LED irradiation. GALNT2
encodes the polypeptide N-acetylgalactosaminyltransferase 2, which
is involved in O-linked protein glycosylation (30). GALNT2 has been identified as a
candidate gene in lipid metabolism by genome-wide association
studies, and its single nucleotide polymorphisms may be correlated
with plasma lipids (31,32). The overexpression of GALNT2 can
promote the invasive potential of oral squamous cell carcinoma
(OSCC) cells by modifying the O-glycosylation of proteins and
increasing the activity of epidermal growth factor receptor (EGFR),
which plays an important role in the invasive behavior of OSCC
cells (33). Imielinski et al
(34) confirmed the high mutation
rate of EGFR (17%) in LAC. Therefore, whether the role of GALNT2 in
the glycosylation of O-protein is involved in the occurrence and
development of LAC disease remains to be further studied. FAM83A
encodes the protein family member with sequence similarity 83
(FAM83A), also known as tumor antigen BJ-TSA-9. Lee et al
(35) identified that FAM83A was a
candidate cancer-associated gene capable of conferring resistance
to EGFR-tyrosine kinase inhibitors, and that FAM83A interacted with
and caused phosphorylation of c-RAF and phosphoinositide 3 kinase
p85, upstream of MAPK and downstream of EGFR in breast cancer cells
and in mice (35). Li et al
(36) identified a tumor-specific
antigen, TSA-9, which was highly expressed in lung cancer tissues.
Liu et al (37) detected
circulating cancer cells in lung cancer patients using a panel of
marker genes including BJ-TSA-9. In addition, cigarette smoking can
induce the expression of FAM83A (38). KYNU encodes kynureninase, which is
involved in the biosynthesis of nicotinamide adenine dinucleotide
cofactors from tryptophan. KYNU expression was demonstrated to be
decreased in invasive ductal carcinoma and osteosarcoma cell lines
compared with normal fibroadenoma (39,40).
KYNU may be associated with metabolic transformation in cancer
development. The transition from oxidative phosphorylation to
aerobic glycolysis is a sign of stem cell function in normal tissue
growth and differentiation. Overall, further in vivo and
in vitro experiments are required in order to clarify the
roles of OPN3, GALNT2 and KYNU in lung cancer, and the clinical
significance of FAM83A in LAC requires further investigation.
However, the prognostic model of the present study
had certain limitations. First, further validation, such as a
reverse transcription-quantitative PCR validation, in an
independent set is required in order to confirm the diagnostic
value of the model used. Secondly, other clinical information that
may have influenced OS was not obtained, such as primary health
problems and follow-up treatment. Thirdly, it is uncertain as to
whether the risk score is feasible for use with metastatic tumors,
as the samples used in the present study were from primary tumors,
the initial site of cancer. The risk score was obtained from the
dark red module, which demonstrated the strongest negative
correlation with survival time. Further investigations are required
in order to detect the markers from other modules.
In conclusion, WGCNA and LASSO Cox regression
analysis were applied to the LAC data from TCGA, and a
four-gene-based risk score was obtained that may support the
development of diagnostic and therapeutic strategies for LAC
management.
Acknowledgements
Not applicable.
Funding
The present study was supported by the President
Foundation of Nanfang Hospital, Southern Medical University,
Guangzhou, China (grant no. 2016B018).
Availability of data and materials
The datasets used and/or analyzed during the present
study are available from the corresponding author upon reasonable
request, and from TCGA (https://cancergenome.nih.gov/).
Authors' contributions
KC was a major contributor in designing the study.
HeW, DL and XGL performed the data analyses. HeW was a major
contributor in writing the manuscript. JJJ suggested analysis of
the data based on stratified randomization and was a contributor in
writing the manuscript. SYF contributed to data collection and data
analysis. XYD and XSS were responsible for data pretreatment. HFW
contributed to the conception of the study, and was responsible for
figure processing, table generation and discussion drafting. HuW
and GX revised the manuscript and interpreted the data. All authors
read and approved the final manuscript.
Ethics approval and consent to
participate
Not applicable.
Patient consent for publication
Not applicable.
Competing interests
The authors declare that they have no competing
interests.
References
|
1
|
Torre LA, Bray F, Siegel RL, Ferlay J,
Lortet-Tieulent J and Jemal A: Global cancer statistics, 2012. CA
Cancer J Clin. 65:87–108. 2015. View Article : Google Scholar : PubMed/NCBI
|
|
2
|
Allemani C, Matsuda T, Di Carlo V,
Harewood R, Matz M, Nikšić M, Bonaventure A, Valkov M, Johnson CJ,
Estève J, et al: Global surveillance of trends in cancer survival
2000–14 (CONCORD-3): Analysis of individual records for 37 513 025
patients diagnosed with one of 18 cancers from 322 population-based
registries in 71 countries. Lancet. 391:1023–1075. 2018. View Article : Google Scholar : PubMed/NCBI
|
|
3
|
Sanchez-Salcedo P, Berto J, de-Torres JP,
Campo A, Alcaide AB, Bastarrika G, Pueyo JC, Villanueva A,
Echeveste JI, Lozano MD, et al: Lung cancer screening: Fourteen
year experience of the Pamplona early detection program (P-IELCAP).
Arch Bronconeumol. 51:169–176. 2015.(In English, Spanish).
View Article : Google Scholar : PubMed/NCBI
|
|
4
|
Vansteenkiste J, Crinò L, Dooms C,
Douillard JY, Faivre-Finn C, Lim E, Rocco G, Senan S, Van Schil P,
Veronesi G, et al: 2nd ESMO Consensus conference on lung cancer:
Early-stage non-small-cell lung cancer consensus on diagnosis,
treatment and follow-up. Ann Oncol. 25:1462–1474. 2014. View Article : Google Scholar : PubMed/NCBI
|
|
5
|
Hirsch FR, Scagliotti GV, Mulshine JL,
Kwon R, Curran WJ Jr, Wu YL and Paz-Ares L: Lung cancer: Current
therapies and new targeted treatments. Lancet. 389:299–311. 2017.
View Article : Google Scholar : PubMed/NCBI
|
|
6
|
Goldstraw P, Chansky K, Crowley J,
Rami-Porta R, Asamura H, Eberhardt WE, Nicholson AG, Groome P,
Mitchell A, Bolejack V, et al: The IASLC lung cancer staging
project: Proposals for revision of the TNM stage groupings in the
forthcoming (Eighth) edition of the TNM classification for lung
cancer. J Thorac Oncol. 11:39–51. 2016. View Article : Google Scholar : PubMed/NCBI
|
|
7
|
Chansky K, Sculier JP, Crowley JJ, Giroux
D, Van Meerbeeck J, Goldstraw P; International Staging Committee, ;
Participating Institutions: The international association for the
study of lung cancer staging project: Prognostic factors and
pathologic TNM stage in surgically managed non-small cell lung
cancer. J Thorac Oncol. 4:792–801. 2009. View Article : Google Scholar : PubMed/NCBI
|
|
8
|
Cancer Genome Atlas Research Network, ;
Weinstein JN, Collisson EA, Mills GB, Shaw KR, Ozenberger BA,
Ellrott K, Shmulevich I, Sander C and Stuart JM: The cancer genome
atlas pan-cancer analysis project. Nat Genet. 45:1113–1120. 2013.
View Article : Google Scholar : PubMed/NCBI
|
|
9
|
Langfelder P and Horvath S: WGCNA: An R
package for weighted correlation network analysis. BMC
Bioinformatics. 9:5592008. View Article : Google Scholar : PubMed/NCBI
|
|
10
|
Allen JD, Xie Y, Chen M, Girard L and Xiao
G: Comparing statistical methods for constructing large scale gene
networks. PLoS One. 7:e293482012. View Article : Google Scholar : PubMed/NCBI
|
|
11
|
Guo L, Zhang K and Bing Z: Application of
a co-expression network for the analysis of aggressive and
non-aggressive breast cancer cell lines to predict the clinical
outcome of patients. Mol Med Rep. 16:7967–7978. 2017. View Article : Google Scholar : PubMed/NCBI
|
|
12
|
Mao Q, Zhang L, Zhang Y, Dong G, Yang Y,
Xia W, Chen B, Ma W, Hu J, Jiang F and Xu L: A network-based
signature to predict the survival of non-smoking lung
adenocarcinoma. Cancer Manag Res. 10:2683–2693. 2018. View Article : Google Scholar : PubMed/NCBI
|
|
13
|
Chen J, Wang X, Hu B, He Y, Qian X and
Wang W: Candidate genes in gastric cancer identified by
constructing a weighted gene co-expression network. PeerJ.
6:e46922018. View Article : Google Scholar : PubMed/NCBI
|
|
14
|
Tibshirani R: The lasso method for
variable selection in the Cox model. Stat Med. 16:385–395. 1997.
View Article : Google Scholar : PubMed/NCBI
|
|
15
|
Tibshirani R: Regression shrinkage and
selection via the lasso. J R Stat Soc Ser A Stat Soc. 73:273–282.
2011. View Article : Google Scholar
|
|
16
|
Gui J and Li H: Penalized Cox regression
analysis in the high-dimensional and low-sample size settings, with
applications to microarray gene expression data. Bioinformatics.
21:3001–3008. 2005. View Article : Google Scholar : PubMed/NCBI
|
|
17
|
Langfelder P, Zhang B and Horvath S:
Defining clusters from a hierarchical cluster tree: The dynamic
tree cut package for R. Bioinformatics. 24:719–720. 2008.
View Article : Google Scholar : PubMed/NCBI
|
|
18
|
Shannon P, Markiel A, Ozier O, Baliga NS,
Wang JT, Ramage D, Amin N, Schwikowski B and Ideker T: Cytoscape: A
software environment for integrated models of biomolecular
interaction networks. Genome Res. 13:2498–2504. 2003. View Article : Google Scholar : PubMed/NCBI
|
|
19
|
Tripathi S, Pohl MO, Zhou Y,
Rodriguez-Frandsen A, Wang G, Stein DA, Moulton HM, DeJesus P, Che
J, Mulder LC, et al: Meta- and orthogonal integration of influenza
‘OMICs’ data defines a role for UBR4 in virus budding. Cell Host
Microbe. 18:723–735. 2015. View Article : Google Scholar : PubMed/NCBI
|
|
20
|
Cox DR: Regression models and
life-tablesSpringer; New York: 1992
|
|
21
|
Pasanen L, Holmström L and Sillanpää MJ:
Bayesian LASSO, scale space and decision making in association
genetics. PLoS One. 10:e01200172015. View Article : Google Scholar : PubMed/NCBI
|
|
22
|
Bracht JWP, Mayo-de-Las-Casas C, Berenguer
J, Karachaliou N and Rosell R: The present and future of liquid
biopsies in non-small cell lung cancer: Combining four biosources
for diagnosis, prognosis, prediction, and disease monitoring. Curr
Oncol Rep. 20:702018. View Article : Google Scholar : PubMed/NCBI
|
|
23
|
Zhao K, Li Z and Tian H: Twenty-gene-based
prognostic model predicts lung adenocarcinoma survival. OncoTargets
Ther. 11:3415–3424. 2018. View Article : Google Scholar
|
|
24
|
Langfelder P and Horvath S: WGCNA package
FAQ. https://horvath.genetics.ucla.edu/html/CoexpressionNetwork/Rpackages/WGCNA/faq.html2017
December 24–2017
|
|
25
|
Friedrich MJ: Going with the flow: The
promise and challenge of liquid biopsies. JAMA. 318:1095–1097.
2017. View Article : Google Scholar : PubMed/NCBI
|
|
26
|
Siravegna G, Marsoni S, Siena S and
Bardelli A: Integrating liquid biopsies into the management of
cancer. Nat Rev Clin Oncol. 14:531–548. 2017. View Article : Google Scholar : PubMed/NCBI
|
|
27
|
Fagerberg L, Hallström BM, Oksvold P,
Kampf C, Djureinovic D, Odeberg J, Habuka M, Tahmasebpoor S,
Danielsson A, Edlund K, et al: Analysis of the human
tissue-specific expression by genome-wide integration of
transcriptomics and antibody-based proteomics. Mol Cell Proteomics.
13:397–406. 2014. View Article : Google Scholar : PubMed/NCBI
|
|
28
|
Jiao J, Hong S, Zhang J, Ma L, Sun Y,
Zhang D, Shen B and Zhu C: Opsin3 sensitizes hepatocellular
carcinoma cells to 5-fluorouracil treatment by regulating the
apoptotic pathway. Cancer Lett. 320:96–103. 2012. View Article : Google Scholar : PubMed/NCBI
|
|
29
|
Yoshimoto T, Morine Y, Takasu C, Feng R,
Ikemoto T, Yoshikawa K, Iwahashi S, Saito Y, Kashihara H, Akutagawa
M, et al: Blue light-emitting diodes induce autophagy in colon
cancer cells by Opsin 3. Ann Gastroenterol Surg. 2:154–161. 2018.
View Article : Google Scholar : PubMed/NCBI
|
|
30
|
Yang B, Yan S, Yan J, Li Y, Khurwolah MR,
Wang L and Chen Z: A study of the association of rs12040273 with
susceptibility and severity of coronary artery disease in a Chinese
Han population. BMC Cardiovasc Disord. 18:102018. View Article : Google Scholar : PubMed/NCBI
|
|
31
|
Willer CJ, Sanna S, Jackson AU, Scuteri A,
Bonnycastle LL, Clarke R, Heath SC, Timpson NJ, Najjar SS,
Stringham HM, et al: Newly identified loci that influence lipid
concentrations and risk of coronary artery disease. Nat Genet.
40:161–169. 2008. View
Article : Google Scholar : PubMed/NCBI
|
|
32
|
Kathiresan S, Melander O, Guiducci C,
Surti A, Burtt NP, Rieder MJ, Cooper GM, Roos C, Voight BF,
Havulinna AS, et al: Six new loci associated with blood low-density
lipoprotein cholesterol, high-density lipoprotein cholesterol or
triglycerides in humans. Nat Genet. 40:189–197. 2008. View Article : Google Scholar : PubMed/NCBI
|
|
33
|
Lin MC, Huang MJ, Liu CH, Yang TL and
Huang MC: GALNT2 enhances migration and invasion of oral squamous
cell carcinoma by regulating EGFR glycosylation and activity. Oral
Oncol. 50:478–484. 2014. View Article : Google Scholar : PubMed/NCBI
|
|
34
|
Imielinski M, Berger AH, Hammerman PS,
Hernandez B, Pugh TJ, Hodis E, Cho J, Suh J, Capelletti M,
Sivachenko A, et al: Mapping the hallmarks of lung adenocarcinoma
with massively parallel sequencing. Cell. 150:1107–1120. 2012.
View Article : Google Scholar : PubMed/NCBI
|
|
35
|
Lee SY, Meier R, Furuta S, Lenburg ME,
Kenny PA, Xu R and Bissell MJ: FAM83A confers EGFR-TKI resistance
in breast cancer cells and in mice. J Clin Invest. 122:3211–3220.
2012. View Article : Google Scholar : PubMed/NCBI
|
|
36
|
Li Y, Dong X, Yin Y, Su Y, Xu Q, Zhang Y,
Pang X, Zhang Y and Chen W: BJ-TSA-9, a novel human tumor-specific
gene, has potential as a biomarker of lung cancer. Neoplasia.
7:1073–1080. 2005. View Article : Google Scholar : PubMed/NCBI
|
|
37
|
Liu L, Liao GQ, He P, Zhu H, Liu PH, Qu
YM, Song XM, Xu QW, Gao Q, Zhang Y, et al: Detection of circulating
cancer cells in lung cancer patients with a panel of marker genes.
Biochem Biophys Res Commun. 372:756–760. 2008. View Article : Google Scholar : PubMed/NCBI
|
|
38
|
Li Y, Xiao X, Ji X, Liu B and Amos CI:
RNA-seq analysis of lung adenocarcinomas reveals different gene
expression profiles between smoking and nonsmoking patients. Tumour
Biol. 36:8993–9003. 2015. View Article : Google Scholar : PubMed/NCBI
|
|
39
|
Perou CM, Sørlie T, Eisen MB, van de Rijn
M, Jeffrey SS, Rees CA, Pollack JR, Ross DT, Johnsen H, Akslen LA,
et al: Molecular portraits of human breast tumours. Nature.
406:747–752. 2000. View Article : Google Scholar : PubMed/NCBI
|
|
40
|
Lauvrak SU, Munthe E, Kresse SH, Stratford
EW, Namløs HM, Meza-Zepeda LA and Myklebost O: Functional
characterisation of osteosarcoma cell lines and identification of
mRNAs and miRNAs associated with aggressive cancer phenotypes. Br J
Cancer. 109:2228–2236. 2013. View Article : Google Scholar : PubMed/NCBI
|