Introduction
Gastric cancer (GC) is one of the most common
malignancies worldwide (1). Global
cancer statistics have revealed that approximately 951,600 new
cases of GC and 723,100 deaths were reported in 2012 (1). Cancer stem cells (CSCs) have been
suggested to be associated with tumor initiation, drug resistance,
invasion, metastasis and tumor recurrence, and therefore may play
an important role in cancer-associated mortality (2). CSCs are also known as tumor-initiating
cells, with self-renewal and proliferative characteristics
(3). By studying different CSCs, one
can select various individualized chemotherapies and improve the
survival rate of patients with GC. In some studies (3,4), CSCs,
such as cluster of differentiation (CD)-24, CD26, CD44, CD90, CD133
and aldehyde dehydrogenase-1A1 (ALDH1A1), have been detected in GC,
which were expressed with high carcinogenicity in animal
experiments.
CD133 is a glycoprotein with five transmembrane
domains (5). Initially, CD133 was
considered to be a surface marker for hematopoietic stem and
progenitor cells (6). An increasing
number of studies have reported that CD133 is also a marker for
colorectal (7), liver (8), prostate (9) and lung cancer (10), and it is often used to label and
isolate stem cells. Approximately half of human GC samples express
CD133+, and CD133 is associated with the development of
tumors. A high expression of CD133 always leads to shorter survival
(11,12).
ALDH1A1 is a type of intracellular enzyme with
self-renewal and multi-directional differentiation (13). It plays a part in the differentiation
of CSCs by stimulating the formation of retinoic acid, and
participates in the detoxification, differentiation and drug
resistance of cells (13). ALDH1A1
has already been reported in colorectal cancer, lung cancer, breast
cancer and other types of tumors, however to the best of our
knowledge, a limited number of studies have reported the role of
ALDH1A1 in GC. A number of studies have reported that ALDH1
overexpression is associated with low survival in malignant tumors
(14,15).
D2 gastrectomy has become the standard surgical
treatment for curable GC globally (16). Complete resection of the tumor is
critical; however, the tumor may recur even if it is completely
resected. In terms of further treatment after gastrectomy, two
landmark phase III clinical trials in Asia, the adjuvant
chemotherapy ACTS-GC and the CLASSIC trials (17,18),
reported that both monotherapy and combination chemotherapy were
associated with a reduced risk of death in GC compared with surgery
alone. In addition, standard postoperative adjuvant chemotherapy
was established. Subgroup analysis in the ACTS-GC trial revealed
the important benefits of S-1 monotherapy in patients with early
stage disease. By contrast, patients with late stage did not
exhibit any benefits and they required a more efficient treatment.
In the CLASSIC trial, despite the results demonstrating that the
XELOX therapy was beneficial for all disease stages (II, IIIA or
IIIB), there was still no standard for adjuvant chemotherapy for
the patients who were excluded.
In the present study, the response of different
chemotherapies under positive or negative expression of CD133 and
ALDH1A1 were investigated in order to examine the value of CD133
and ALDH1A1 in the treatment of GC.
Materials and methods
Patients and tissue samples
The objective was to evaluate the association
between different adjuvant chemotherapies and the expression of
CSCs in patients with stage III, GC who had undergone curative
resection. The present study was approved by the Institutional
Review Board and Human Ethics Committee of The First Affiliated
Hospital of Anhui Medical University. All the patients signed
written consent for the use of their samples for research purposes.
Cancerous and para-tumor tissues were obtained after surgery from
the Department of Pathology, The First Affiliated Hospital of Anhui
Medical University. Hematoxylin & eosin (H&E)-stained
slides of gastric cancer and normal gastric mucosa were obtained
from the same department.
In the present retrospective analysis, a total of 91
patients were enrolled, including 69 males and 22 females. Patient
age ranged from 32 to 76 years, and the median age was 53 years.
The gastrectomies were performed between January 2012 and December
2017. The inclusion criteria were: i) Age between 18 and 80 years;
ii) Eastern Cooperation Oncology Group score between 0 and 2
(19); iii) R0 gastrectomy with D2
or more extensive lymphadenectomy; iv) pathological stage confirmed
as stage III (according to The 8th edition of the AJCC Cancer
Staging Manual (20), resulting in a
slightly different stage III population between this study and
other ones); v) no radiotherapy and/or immunotherapy; vi) complete
clinical data; and vii) baseline examination met the requirements
of chemotherapy (adequate hematologic function, hepatic function,
and renal function).
Immunohistochemical staining and
assessment
Immunohistochemistry was carried out according to a
procedure previously reported (21,22).
Paraffin-embedded blocks were cut into 4-µm sections. Firstly,
samples were deparaffinized twice in xylene for 10 min, and then
dehydrated in a graded ethanol series (100% ethanol twice, then 95
and 75% ethanol). Secondly, antigen retrieval in 0.01 M sodium
citrate buffer (pH 6.0) was performed at a high temperature and
high pressure using a pressure cooker, then endogenous peroxidase
activity was quenched by 10 min incubation in 3%
H2O2 solution after cooling to room
temperature, followed by 3 washes for 3 min each with PBS (pH 7.4).
The sections were incubated with 3% H2O2
solution for 10 min at room temperature to inhibit endogenous
peroxidase activity. After 30 min of blocking in 10% goat serum
(cat. no. SP KIT-B1; Maxim Biotech, Inc.) at room temperature, the
sections were incubated with primary antibodies: anti-ALDH1A1
(Abcam; cat. no. ab52492; dilution 1:200) and anti-CD133 (Abcam;
cat. no. ab222782; dilution 1:500), in a refrigerator at 4°C
overnight. The next day, the sections were rinsed three times for 3
min each with PBS, followed by incubating array slides with
anti-mouse/rabbit secondary antibodies [MaxvisionTM3 HRP-Polymer
(Mouse/Rabbit) IHC kit, Maxim Biotech, Inc.; cat. no. KIT-5220] for
20 min at 37°C. Samples were then stained using a DAB kit for 10
min at room temperature, and hematoxylin for 1 min at room
temperature before dehydration and transparency of slides; finally,
samples were mounted on slides. The staining was observed using a
light microscope (magnification, ×100, ×200 and ×400).
A total of 10 high-power fields were randomly
selected for each slice, and 100 tumor cells were counted in each
field of view. The assessments of the two CSCs were: If the number
of positive cells was <5, 5–24, 25–49, 50–75 or >75%, the
slice was marked as 0, 1, 2, 3 or 4 points, respectively. Judging
the intensity of the two indicators: The range of intensities was
from 0 to 3, for colorless, yellow, brown and tan, respectively.
Finally, the positive expression rate score and the intensity score
were multiplied. The present study considered the scores 0, 2–4,
5–8 and 9–12, for CD133 and ALDH1A1, equal to negative, weakly
positive, positive and strongly positive, respectively.
Immunohistochemical studies for ALDH1A1 and CD133 were performed
and scored semiquantitatively by two pathologists based on the
percent and intensity of positive cells as previously described
(21,22). The assessments of slices were
conducted using the double-blind method.
Treatment and assessment
All patients were enrolled in postoperative
chemotherapy, under the combination of two [platinum +
5-fluorouracil (5-FU)] or three drug (taxane + platinum + 5-FU)
treatments. Patients who were treated with two-drug combinations
received XELOX chemotherapy (capecitabine 1,000 mg/m2 PO
BID on days 1–14 and oxaliplatin 130 mg/m2 IV on day 1,
cycled every 21 days for 6–8 cycles) with SOX (S-1 80
mg/m2 PO BID on days 1–14 and oxaliplatin 130
mg/m2 IV on day 1, cycled every 21 days for 6–8 cycles)
chemotherapy, or 12 cycles of mFOLFOX6 chemotherapy (oxaliplatin 85
mg/m2 IV on day 1 and leucovorin 400 mg/m2 IV
on day 1, 5-FU 400 mg/m2 IV bolus on day 1, then 1,200
mg/m2/d IV continuous infusion on days 1 to 2, repeated
every 2 weeks). Patients treated with three-drug combinations
received DCF (docetaxel 75 mg/m2 IV on day 1 and
cisplatin 75 mg/m2 IV on day 1, 5-FU 750
mg/m2 IV on days 1 to 5) or mDCF (docetaxel 40
mg/m2 IV on day 1, leucovorin 400 mg/m2 IV on
day 1, 5-FU 400 mg/m2 IV on day 1, 5-FU 1,200
mg/m2 IV continuous infusion over 24 h on day 1 and 2,
cycled every 14 days). The present study adhered to the principles
of ‘NCCN Clinical Practice Guidelines on Oncology, Gastric Cancer’
(23). Before chemotherapy, the
patient's hematopoiesis, liver and kidney functions were assessed
and recorded. Tumor assessment was conducted using tumor markers,
computed tomography or magnetic resonance imaging, and gastroscopy
every 2 cycles during chemotherapy. According to the results it was
unknown whether the tumor recurred or metastasized. Adverse events
were evaluated according to the National Cancer Institute's Common
Terminology Criteria for Adverse Events (version 3.0) (24). If patients had serious hematologic
toxic effects, neurological adverse events, intolerant digestive
tract reactions or severe hand-foot syndrome, dose reductions were
allowed. In cases of reducing the dose, patients that could not
tolerate chemotherapy were allowed to interrupt and/or withdraw
from the study.
Follow-up
The follow-up of patients was mainly conducted by
telephone and by using the hospital medical records. Follow-up was
performed every 3 months from the first to second year after
gastrectomy, and every 6 months in the last 2–5 years. The primary
endpoint was disease-free survival (DFS) and overall survival (OS).
DFS was defined as the time from the date of gastrectomy to the
date of the recurrence of the original GC or end of the follow-up.
OS was defined as the date from gastrectomy to the date of death or
the last follow-up.
Statistical analysis
The statistical analyses were conducted using IBM
SPSS version 25.0 (IBM Corp.). Data are expressed as the mean ±
standard deviation. Comparison of the categorical data was
performed by the χ2 test. Fisher's exact test with a
residual analysis as a post-hoc test (only in the group of the
association between T/N stage and expression of ALDH1A1 and CD133)
was performed. The Spearman rank correlation test was used for
correlation analysis. The Kaplan-Meier survival curves were
constructed to estimate the cumulative survival. The survival rate
between two chemotherapy groups was compared by a two-sided
log-rank test. The statistically significant variables with
P<0.05 in the univariate analysis were included in the Cox
proportional hazards model. The survival curves were drawn using
GraphPad Prism 7 (GraphPad Software, Inc.). Immunohistochemical
staining and assessment were repeated 3 times.
Results
Association between ALDH1A1 and CD133
with clinicopathological features
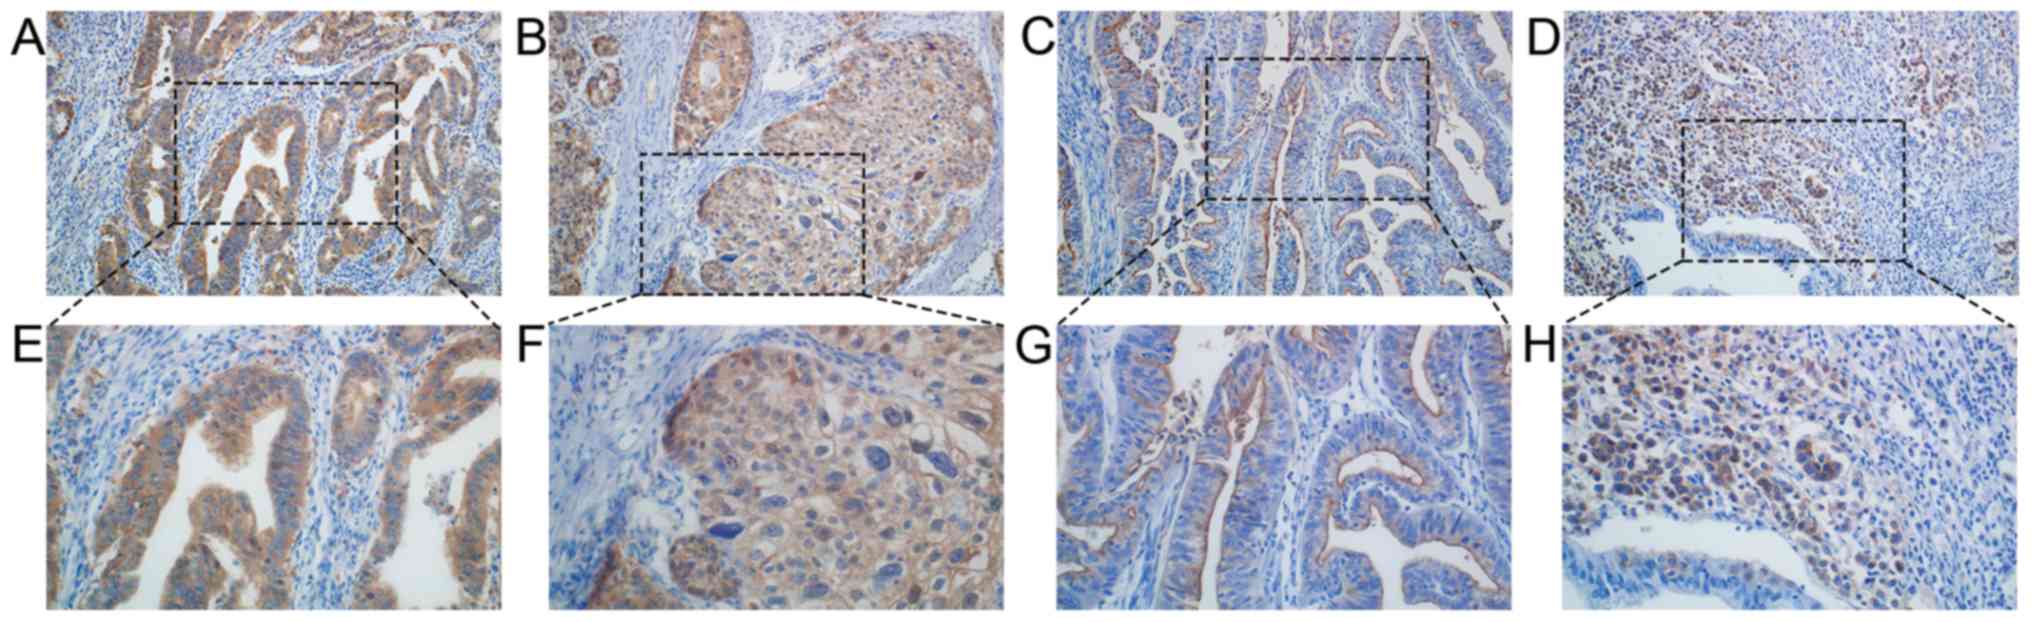
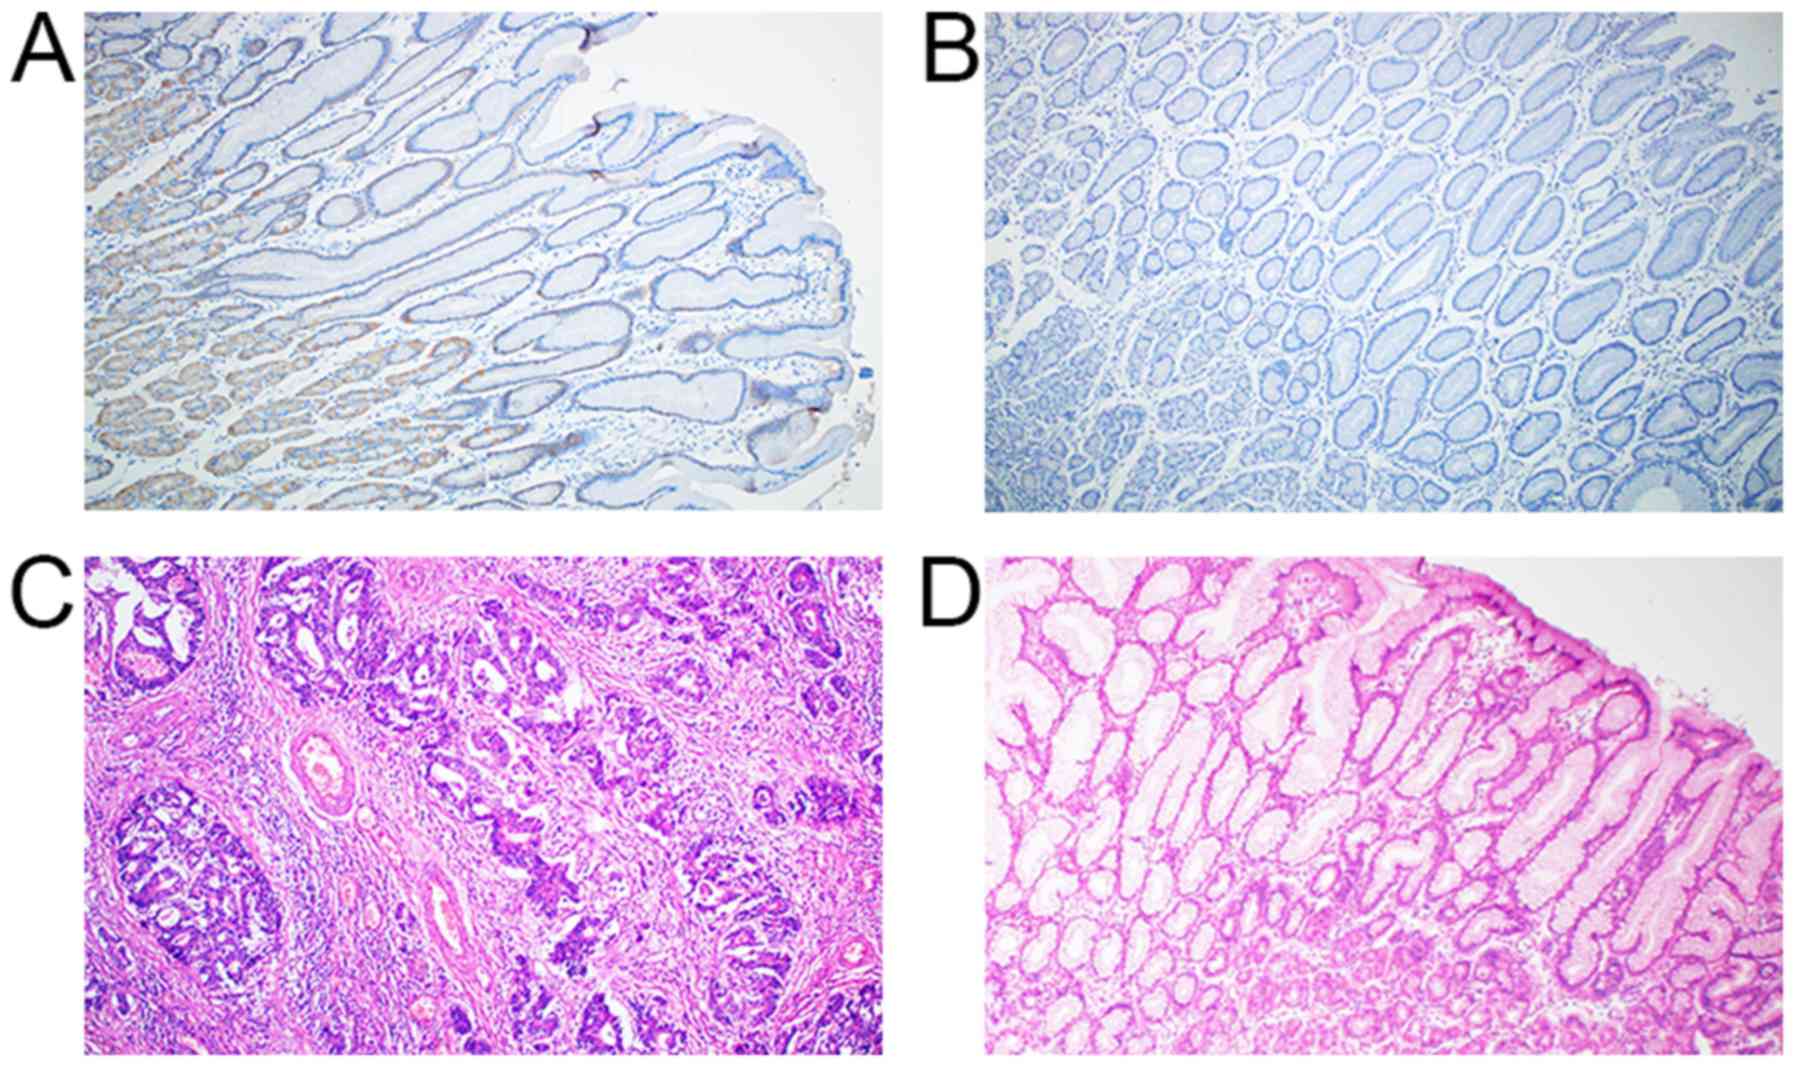
According to the immunohistochemistry results, 57/91
(62%) were positive for ALDH1A1 and 60/91 (66%) were positive for
CD133. Expression of ALDH1A1 was mainly observed in the cytoplasm
of GC cells, which were stained yellow, brown and tan. Not only
were the tumor cells stained but they were also strongly active in
normal gastric mucosa cells, especially parietal cells. CD133 was
detected in the cytomembrane, but not in normal gastric epithelial
and stromal cells (Figs. 1 and
2). The results of the univariate
analysis indicated that T stage (P=0.012), N stage (P=0.023), and
histological type (P=0.020) were significantly associated with
positive ALDH1A1 expression. After analysis by the post-hoc test,
ALDH1A1− tended to indicate T2 or N1 stage, while
ALDH1A1+ tended to indicate T4b stage. In addition,
there was an interaction between T stage (P=0.007) and
CD133+ (Table I). After
analysis via post-hoc tests, CD133− tended to indicate
T2 stage, and CD133+ tended to indicate T4a stage. It
was also found that the level of expression was associated with the
stages as determined by Spearman's rank correlation coefficient,
i.e., the higher the ALDH1A1 expression, the later the T stage
(r=0.224; P=0.011). However, neither the N stage nor the level of
CD133 expression reflected this association.
 | Table I.Association between clinical
characteristics and expression of ALDH1A1 and CD133 in 91 cases of
gastric cancer. |
Table I.
Association between clinical
characteristics and expression of ALDH1A1 and CD133 in 91 cases of
gastric cancer.
|
| ALDH1A1 |
| CD133 |
|
|---|
|
|
|
|
|
|
|---|
|
Characteristics | Positive | Negative | P-value | Positive | Negative | P-value |
|---|
| Sex (%) |
|
| 0.368 |
|
| 0.794 |
|
Male | 45 (78.9) | 24 (70.6) |
| 46 (76.7) | 23 (74.2) |
|
|
Female | 12 (21.1) | 10 (29.4) |
| 14 (23.3) | 8 (25.8) |
|
| Age, years (%) |
|
| 0.802 |
|
| 0.142 |
|
<60 | 32 (56.1) | 20 (58.8) |
| 31 (51.7) | 21 (67.7) |
|
|
≥60 | 25 (43.9) | 14 (41.2) |
| 29 (48.3) | 10 (32.3) |
|
| TNM stage (%) |
|
| 0.879 |
|
| 0.900 |
|
IIIA | 28 (49.1) | 15 (44.1) |
| 28 (46.7) | 15 (48.4) |
|
|
IIIB | 19 (33.3) | 13 (38.2) |
| 22 (36.7) | 10 (32.2) |
|
|
IIIC | 10 (17.5) | 6 (17.6) |
| 10 (16.7) | 6 (19.4) |
|
| T Stage (%) |
|
| 0.012a |
|
| 0.007a |
| T2 | 0 | 3 (8.8) |
| 0 | 3 (9.7) |
|
| T3 | 20 (35.1) | 17 (50.0) |
| 23 (38.3) | 14 (45.2) |
|
|
T4a | 31 (54.4) | 14 (41.2) |
| 35 (58.3) | 10 (32.3) |
|
|
T4b | 6 (10.5) | 0.000 |
| 2 (3.3) | 4 (12.9) |
|
| N Stage (%) |
|
| 0.023a |
|
| 0.865 |
| N0 | 3 (5.3) | 0.000 |
| 2 (3.3) | 1 (3.2) |
|
| N1 | 11 (19.3) | 0.000 |
| 9 (15.0) | 2 (6.5) |
|
| N2 | 15 (26.3) | 12 (35.3) |
| 17 (28.3) | 10 (32.3) |
|
|
N3a | 19 (33.3) | 16 (47.1) |
| 22 (36.7) | 13 (41.9) |
|
|
N3b | 9 (15.8) | 6 (17.6) |
| 10 (16.7) | 5 (16.1) |
|
| Tumor size, cm
(%) |
|
| 0.098 |
|
| 0.556 |
|
<5 | 25 (43.9) | 21 (61.8) |
| 29 (48.3) | 17 (54.8) |
|
| ≥5 | 32 (56.1) | 13 (38.2) |
| 31 (51.7) | 14 (45.2) |
|
| Histological type
(%) |
|
| 0.020a |
|
| 0.287 |
|
Differentiated | 12 (21.1) | 15 (44.1) |
| 20 (33.3) | 7 (22.6) |
|
|
Undifferentiated | 45 (78.9) | 19 (55.9) |
| 40 (66.7) | 24 (77.4) |
|
| Vascular invasion
(%) |
|
| 0.716 |
|
| 0.859 |
|
Positive | 24 (42.1) | 13 (38.2) |
| 24 (40.0) | 13 (41.9) |
|
|
Negative | 33 (57.9) | 21 (61.8) |
| 36 (60.0) | 18 (58.1) |
|
| Nerve invasion
(%) |
|
| 0.939 |
|
| 0.372 |
|
Positive | 18 (31.6) | 11 (32.4) |
| 21 (35.0) | 8 (25.8) |
|
|
Negative | 39 (68.4) | 23 (67.6) |
| 39 (65.0) | 23 (74.2) |
|
Effect of tumor ALDH1A1 and CD133
protein level on prognosis
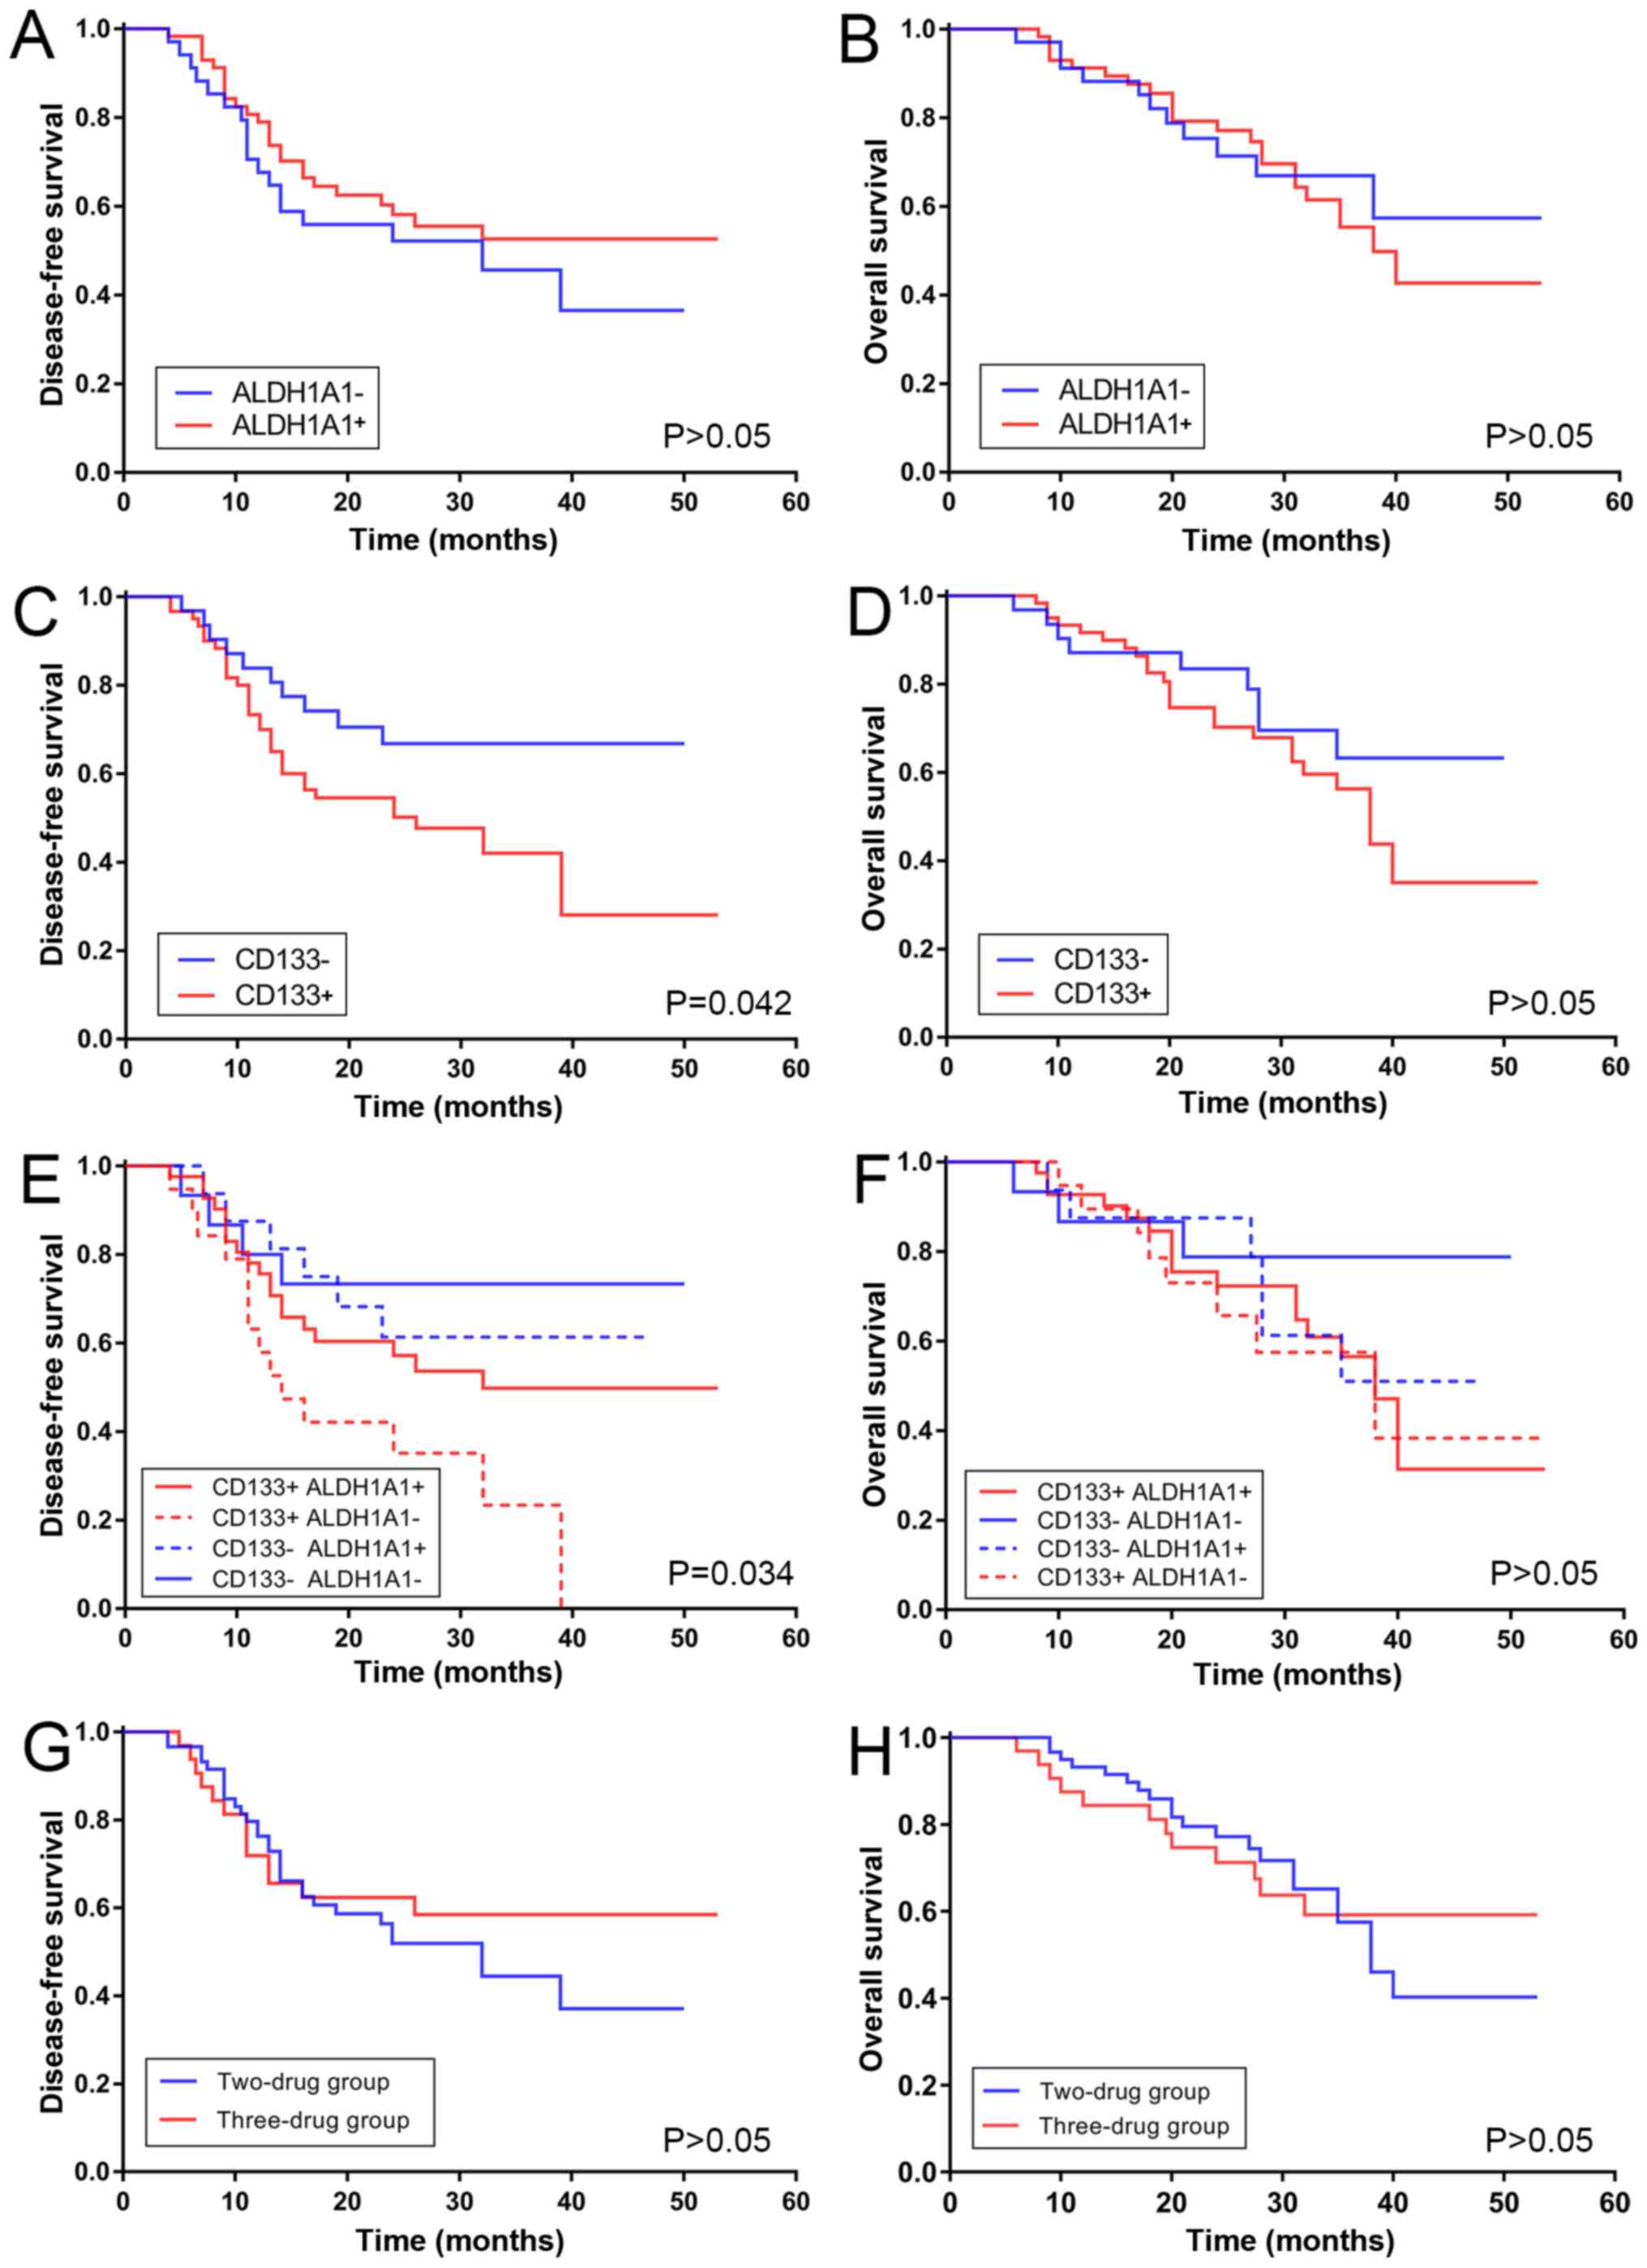
Kaplan-Meier analysis proved that a significant
difference for DFS was observed between positive and negative CD133
expression (P=0.042); however, this did not apply for the OS curve.
High expression of CD133 was associated with poor DFS. By contrast,
the DFS curve of ALDH1A1+ expression did not indicate a
significant difference compared with the ALDH1A1−
expression. The same applied for the OS curve. High expression of
ALDH1A1 was not associated with better DFS, and no statistical
significance was revealed after the log-rank test (Fig. 3A-D).
CD133 and ALDH1A1 co-expression, which refers to the
combined expression of two markers, was also associated with DFS.
Patients with CD133+ and ALDH1A1− expression
exhibited a significant decrease in DFS (P=0.034); by contrast,
patients with CD133− and ALDH1A1− expression
exhibited a slow decrease (Fig. 3E and
F). A poor positive correlation was revealed between the degree
of ALDH1A1 and CD133 expression by using Spearman's rank
correlation coefficient (rs=0.240; P=0.022).
Association between chemotherapies and
clinical characteristics
The endpoint of the follow-up date was September 31,
2018, with a median follow-up of 27 months. The present study
detected the association between clinical characteristics and
different chemotherapies. All patients had complete clinical data
and successful follow-ups. There was a significant difference
between patient age and therapy (P<0.05). The patients who were
60 years of age were predominantly treated with a combination of
two drugs. The remaining general data showed no statistical
significance (P>0.05). A total of 59 patients (64.8%) were
treated with two drugs, and 32 patients (35.2%) were treated with
three drugs. The three-drug group included the addition of taxane
when compared with two-drug group. The specific treatment regimen
was as follows: 36 patients (39.6%) received XELOX, 19 patients
(20.9%) received SOX, 4 patients received mFOLFOX6 (4.4%), 11
patients (12.1%) received DCF and 21 patients (23.1%) received mDCF
(data not shown).
Effect of different chemotherapies on
prognosis
The DFS and OS rates at 1, 2 and 3 years were
calculated using the χ2 test. The results revealed that
there were no significant differences between the 1-year DFS,
2-year DFS and the OS for the two groups (1-year DFS, P=0.645;
2-year DFS, P=0.537; 1-year OS, P=0.357; 2-year OS, P=0.521; 3-year
OS, P=0.833). Although the 3-year DFS of the two-drug group was
~10% higher than the three-drug group, statistical significance was
not indicated after the χ2 test (P=0.42; Table II)
| Table II.Survival rate comparison between the
two-drug group and three-drug group. |
Table II.
Survival rate comparison between the
two-drug group and three-drug group.
| Variable | Disease-free
survival rate (%) | Overall survival
rate (%) |
|---|
| Time (years) | 1 | 2 | 3 | 1 | 2 | 3 |
| Two drugs | 76.3 | 52.9 | 37.8 | 93.2 | 76.5 | 52.8 |
| Three drugs | 71.9 | 60.0 | 48.0 | 87.5 | 70.0 | 50.0 |
| P-value | 0.645 | 0.537 | 0.426 | 0.357 | 0.521 | 0.833 |
Fig. 3G and H
presents DFS and OS curves for all patients with stage III disease
involved in the present study. No statistically significant
difference was observed. The mean DFS was 30.1 and 35.6 months in
the two- and three-drug groups, respectively. The median DFS of the
two-drug group was 32.0 months [95% confidence interval (CI):
20.8–43.2], however the median DFS of the three-drug group was not
reached. Statistical significance was not observed in the DFS curve
(P=0.423). As with DFS, statistical significance was also not
observed for the OS for the two groups. The mean OS was 37.9 and
39.0 months in the two- and three-drug groups, respectively. The
median DFS of the two-drug group was 38.0 months (95% CI,
32.4–43.6), and the median DFS of the three-drug group was not
reached.
Multivariate Cox regression of
prognosis
To evaluate the independent prognostic factors of
ALDH1A1 and CD133 overexpression, univariate Kaplan-Meier survival
curves for tumor size, stage, vascular invasion, and CD133 and
ALDH1A1 expression were generated. Then multivariate analysis was
performed using a Cox proportional hazards model in which a
significant difference was observed. CD133 expression [hazard ratio
(HR), 2.292; 95% CI, 1.114–4.713; P=0.024], sex (HR, 0.383; 95% CI,
0.171–0.855; P=0.019), stage IIIB vs. IIIA (HR, 2.746; 95% CI,
1.306–5.773; P=0.004) and vascular invasion (HR, 0.627; 95% CI,
1.003–3.494; P=0.049) were independent prognostic factors for DFS
after eliminating the influence of treatments. In addition, sex
(HR, 0.296; 95% CI, 0.112–0.786; P=0.015), tumor size (HR, 2.320;
95% CI, 1.125–4.784; P=0.023), and vascular invasion (HR, 2.516;
95% CI, 1.227–3.162; P=0.012) were independent prognostic factors
for OS after eliminating the influence of treatments (Tables III and IV).
| Table III.Multivariate analysis showing factors
associated with disease free survival rate in 91 cases of gastric
cancer. |
Table III.
Multivariate analysis showing factors
associated with disease free survival rate in 91 cases of gastric
cancer.
| Variable | B | Hazard ratio | Lower | Upper | P-value |
|---|
| CD133 | 0.829 | 2.292 | 1.114 | 4.713 | 0.024 |
| Sex | −0.961 | 0.383 | 0.171 | 0.855 | 0.019 |
| Stage (IIIB vs.
IIIA) | 1.010 | 2.746 | 1.306 | 5.773 | 0.004 |
| Vascular
invasion | 0.627 | 1.872 | 1.003 | 3.494 | 0.049 |
| Table IV.Multivariate analysis showing factors
associated with overall survival rate in 91 cases of gastric
cancer. |
Table IV.
Multivariate analysis showing factors
associated with overall survival rate in 91 cases of gastric
cancer.
| Variable | B | Hazard ratio | Lower | Upper | P-value |
|---|
| Sex | −1.216 | 0.296 | 0.112 | 0.786 | 0.015 |
| Tumor size | 0.841 | 2.320 | 1.125 | 4.784 | 0.023 |
| Vascular
invasion | 0.923 | 2.516 | 1.227 | 5.162 | 0.012 |
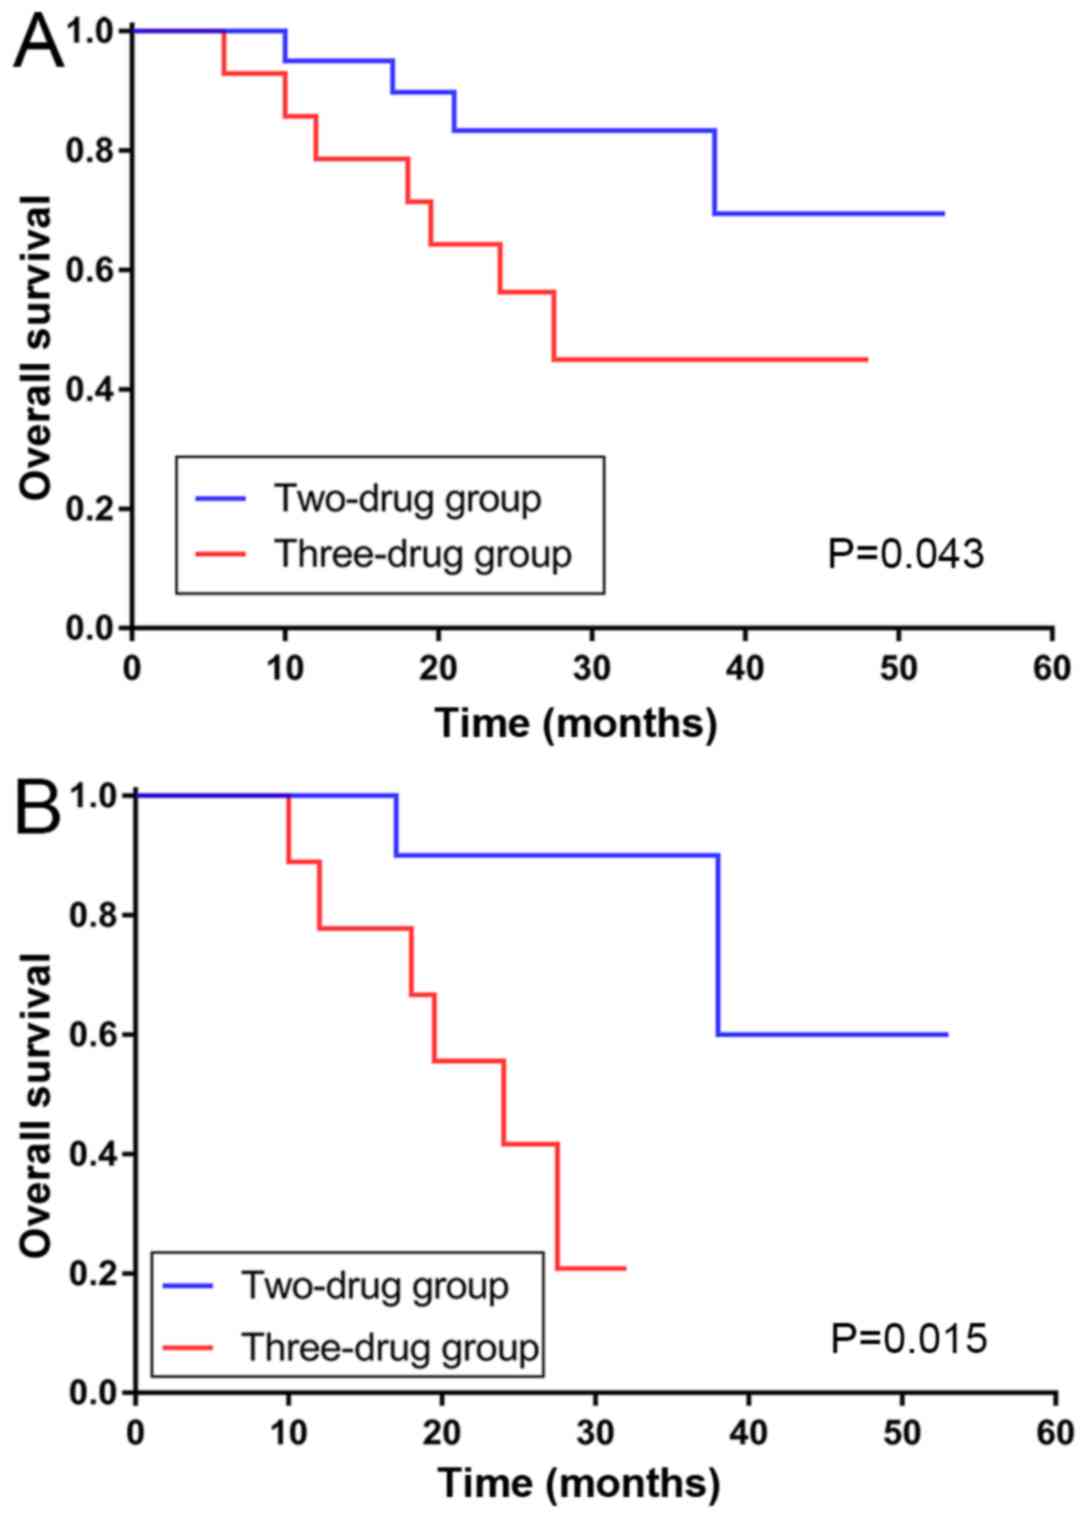
Subgroup analysis
The present study also performed subgroup analysis
of these cases as presented in Fig.
3. After Kaplan-Meier analysis, the DFS of different
chemotherapies was not significantly altered in the
ALDH1A1− or ALDH1A1+ expression subgroups. By
contrast, the OS survival curve revealed that patients in the
ALDH1A1− subgroup could achieve better survival time
with two drugs, while patients in the ALDH1A1+ subgroup
exhibited a longer survival time with three drugs. Statistical
analyses demonstrated that two drugs were better for improving the
OS of the ALDH1A1− subgroup (P=0.043; Fig. 4A), however the positive subgroup was
not significantly different (P=0.078). No difference was observed
in the two chemotherapies groups regardless of positive or negative
CD133 expression.
Associations in the chemotherapies were also
observed in the various CD133 and ALDH1A1 co-expression groups.
Patients with CD133+ and ALDH1A1− expression
benefited more in regard to OS from the combination of two drugs
(P=0.015; Fig. 4B). In patients with
CD133− and ALDH1A1+ expression as well as
CD133+ and ALDH1A1+ expression, the curve of
the three-drug group was separated from the other in regard to DFS
and OS, however no significant differences were observed.
The present study also separated patients who had
vascular metastasis or not into two subgroups, and the results
indicated whether there was metastasis in the vasculature that also
had a different reaction to chemotherapies. The DFS of patients
with no vascular invasion exhibited a better reaction to three-drug
therapy (P=0.039), while there was no statistical difference in the
DFS of patients with vascular invasion. The same applied for the OS
in the two subgroups (data not shown).
Safety of treatment
Table V presents the
adverse events reported in 91 patients. Leukopenia was reported
with significant differences in the two-drug group when compared
with the three-drug group (P=0.039). In the two-drug group, the
reported adverse events of any grade included leukopenia, anemia,
gastrointestinal reactions, thrombocytopenia and peripheral
neuropathy. In the three-drug group, the reported adverse events of
any grade included leukopenia, anemia, thrombocytopenia, liver and
kidney toxicity, gastrointestinal reactions, and peripheral
neuropathy. The most common adverse events in the two groups were
neutropenia, anemia and gastrointestinal reactions. Adverse events
were significantly improved after receiving dose reductions.
| Table V.Adverse events in two drugs and three
drugs groups. |
Table V.
Adverse events in two drugs and three
drugs groups.
|
| Grade (n=91) | Treatment
(n=91) |
|---|
|
|
|
|
|---|
| Adverse events | 0 | 1 | 2 | 3 | 4 | Two drugs | Three drugs | P-value |
|---|
| Leukopenia | 46 | 27 | 15 | 3 | 0 | 24 | 21 | 0.039a |
| Anemia | 67 | 19 | 5 | 0 | 0 | 12 | 12 | 0.180 |
|
Thrombocytopenia | 83 | 5 | 3 | 0 | 0 | 5 | 3 | 0.972 |
| Gastrointestinal
reactions | 76 | 15 | 4 | 0 | 0 | 12 | 7 | 0.307 |
| Peripheral
neuropathy | 87 | 3 | 1 | 0 | 0 | 2 | 2 | 0.611 |
| Liver and kidney
toxicity | 90 | 1 | 0 | 0 | 0 | 0 | 1 | 0.172 |
| Hand-foot
syndrome | 91 | 0 | 0 | 0 | 0 | 0 | 0 | N/A |
Discussion
Expression of CSC markers have been reported to
exist in normal adult stem/progenitor cells as well as in CSCs
(25,26), and ALDH1+ cells are mainly
located at the normal crypt bottom in the colon and stomach
(15,27). The present study examined the
expression of two CSC markers (ALDH1A1 and CD133) in the normal and
cancerous tissue of the stomach. Positive staining for ALDH1A1 was
detected at the crypt bottom of the stomach, especially in parietal
cells. Immunoreactivity in the tumors was stronger than in normal
tissues; however, staining for CD133 was not detected in the normal
stomach tissues.
In the cancerous tissue of the stomach, ALDH1A1 was
detected in 62% (57/91) of cases. ALDH1A1+ was
associated with T/N stage and histological type. It has been
previously reported that patients with advanced T/N stage, as well
as undifferentiated have poor survival (20). However, the results of the present
study suggest that overexpression of ALDH1A1 is not significantly
associated with survival for DFS or OS. The separation of survival
curves was observed between ALDH1A1+ and
ALDH1A1− for DFS, in spite of no statistical
significance, and ALDH1A1− showed slightly better DFS.
It was hypothesized that diverse chemotherapies may have changed
the survival of these cases through various mechanisms. In contrast
to these results, Levi et al (28) reported that ALDH1 was expressed in
very low levels in normal human gastric mucosa, however was
significantly increased in gastric adenocarcinomas. Li et al
(29) also observed that ALDH1A1 was
a poor independent prognostic factor for both OS and
recurrence-free survival. However, it has been documented that high
ALDH1A1 expression does not always associate with highly malignant
phenotypes and poor clinical outcomes in GCs. Wakamatsu et
al (30) reported that the
expression of ALDH1 had no prognostic impact on the 5-year OS. Li
et al (31) used an online
database and determined that unlike breast cancer, the mRNA
expression of ALDH1A1 in GC was not significantly associated with
the OS of patients with GC. ALDH1 is able to convert aldehydes into
carboxylic acids in several types of normal tissues such as liver
and lungs (27,28). Recently, an increasing body of
evidence has revealed that ALDH1, especially ALDH1A1, can modulate
cell differentiation, proliferation, survival, and the cellular
responses to oxidative stress in CSCs (13). ALDH1A1 has also been shown to mediate
epithelial-to-mesenchymal transition, an important phenomenon
associated with tumor invasion and metastasis (32). This study suggested that ALDH1A1 was
associated with local tumor invasion and lymphatic metastasis;
however, the impact on prognosis requires further
investigation.
CD133 is a marker that plays an important role in
the invasiveness of tumor cells (11,12). In
the present study, CD133 was detected in 66% (60/91) of cases.
CD133+ was sociated with advanced T stage and poor DFS
in patients with GC, while N stage, differentiation and poor OS
were not associated. CD133 expression could be broadly divided into
two types: Glandular-luminal cell membrane surface expression
(luminal expression, L-type) and cytoplasmic expression (C-type)
(11). L-type was more common in
differentiated GC, while C-type was more common in undifferentiated
GC; both expression types were observed in the tissue sections used
in the present study. Previous studies demonstrated that
overexpression of CD133 was associated with poor prognosis,
especially for III/IV stage disease (30,33). Lee
et al (34) reported that
CD133 was expressed in differentiated GCs and undifferentiated GCs,
despite CD133+ GCs having significantly poorer
prognosis. By contrast, there has also been previous research that
has revealed that undifferentiated GC expressed increased levels of
CD133 than differentiated GC, and high levels of CD133 expression
led to an increase in the malignancy grades of GC (35). Further research is required to
elucidate the cause of this difference. These results reveal that
positive CD133 expression can predict clinicopathological features
and poorer survival in patients with GC. In addition, CD133 may
play a critical role in the pathophysiology, integration and
complementation of GC. Yu et al (36) demonstrated that inhibition of
CD133 gene expression reduced the ability of GC cells to
proliferate, invade, form clonal sphere, and induce
chemo-resistance, as well as form tumors in nude mice, which
further supports the results of the present study. Furthermore, it
has been reported that CD133 may inhibit 5-FU-induced apoptosis by
regulating the expression of P-gp and the Bcl-2 family mediated by
the phosphoinositide 3-kinase/Akt/p70S6K signaling pathway in GC
cells (37), which provides further
evidence for the drug resistance associated with CD133
expression.
In addition, the co-expression of ALDH1A1 and CD133
was also associated with DFS in the present study. Patients with
ALDH1A1− and CD133+ had poor DFS, and those
with ALDH1A1− and CD133− had better DFS
(P=0.034). This difference was not observed in OS. A larger sample
size is required to examine and conduct further research to verify
these differences.
Surgery has become a principle treatment for
resectable GC (16). For further
treatment, the GASTRIC team (38)
conducted a meta-analysis involving 17 randomized, controlled
trials over the past few decades. The results verified that
adjuvant chemotherapy displayed statistically significant
advantages than surgery alone. In addition, the ACTS-GC (17) and CLASSIC (18) trials established fundamental
principles of adjuvant chemotherapy. The NCCN Gastric Cancer
Clinical Practice Guidelines in Oncology (version 1.2018) (23) suggest that DCF/mDCF could be used for
locally advanced patients with GC. The aim of the present study was
to evaluate the relevance of adding taxane and the survival of
patents with stage III disease, and different ALDH1A1 and CD133
expression levels.
In general, patients with stage III GC have deeper
local invasion, and a large number of cases have lymph node
metastasis (20). For these
patients, it is necessary to examine whether increasing the
intensity of drug treatment benefits the patient's survival. Liu
et al (39) published a study
that compared whether the three-drug combination was superior to
the two-drug combination. Subgroup analysis revealed no significant
difference between the two groups. The patients enrolled in the
present study were treated with three drugs (DCF or mDCF) or two
drugs (XELOX with SOX or mFOLFOX). The results revealed that there
was no statistical difference between the two- and three-drug
groups in regard to DFS and OS for all 91 patients. The addition of
taxane did not induce significant survival benefits to
patients.
In regard to subgroup analysis, the
ALDH1A1− subgroup exhibited a better response to
two-drug therapy. The addition of taxane was shown to induce few
benefits for ALDH1A1+. Larzabal et al (40) indicated that in in vivo
experiments in lung cancer, paclitaxel, although reducing primary
tumor growth, promoted the selection of ALDH+ cells that
likely modify the lung microenvironment to foster metastasis.
Świerczewska et al (41)
reported that in the W1 cell line, short-term treatment with PAC
upregulated the expression of the ALDH1A1 gene. That study
hypothesized that by adding taxane to traditional adjuvant
chemotherapy, the level of ALDH1A1 may rise, which in turn leads to
poorer survival for these patients, and promotes metastatic
spread.
The CD133− and CD133+
subgroups did not show any associations with chemotherapies.
Patients with CD133+ had stronger drug resistance,
higher relapse rates and lower 5-year survival rates compared with
patients with CD133– (34). In the present study, it was concluded
that CD133+ equated to a poorer DFS, however the
addition of taxane in traditional adjuvant chemotherapy did not
produce significant benefits for both CD133− and
CD133+ expression. Future work should investigate
whether CD133 expression was associated with drug resistance, and
whether targeting CD133 with specific drugs could be of clinical
benefit in patients.
However, the present study has limitations. Further
investigation is vital to clarify the role of ALDH1A1 and CD133 in
drug resistance of GC, as well as the specific cellular regulatory
mechanism of ALDH1A1 and CD133 in the tumorigenesis. In addition, a
larger sample of research is required to further prove the
association of ALDH1A1 with DFS and OS for patients with GC.
Based on the results of the present study, it was
concluded that ALDH1A1 plays an important role in tumor invasion
and metastasis. In addition, CD133 may be strongly associated with
tumor invasion and prognosis. Furthermore, the taxane-based triple
chemotherapeutic regimen produced no benefits for patients, which
may help to guide future clinical therapies.
Acknowledgements
Not applicable.
Funding
The present study was supported by Major Projects of
Natural Science Technology Research of University in Anhui Province
(grant no. KJ2018ZD019) and Projects of Anhui Province Natural
Science Fund (grant no. 1808085MH306).
Availability of data and materials
All data generated or analyzed during this study are
included in this published article.
Authors' contributions
WTL and KSG conceived and designed the present
study. YYZ, MG and WBL contributed to the design of the present
study. WTL and WBL obtained the tumor samples and the clinical
data. WTL and MG analyzed the data. KSG and YYZ reviewed and edited
the manuscript. All authors read and approved the manuscript and
agree to be accountable for all aspects of the research in ensuring
that the accuracy or integrity of any part of the work are
appropriately investigated and resolved.
Ethics approval and consent to
participate
The present study was approved by the Ethics
Committee of The First Affiliated Hospital of Anhui Medical
University, and written informed consent was obtained from all
patients involved.
Patient consent for publication
Not applicable.
Competing interests
The authors declare that they have no competing
interests.
References
|
1
|
Torre LA, Bray F, Siegel RL, Ferlay J,
Lortet-Tieulent J and Jemal A: Global cancer statistics, 2012. CA
Cancer J Clin. 65:87–108. 2015. View Article : Google Scholar : PubMed/NCBI
|
|
2
|
Reya T, Morrison SJ, Clarke MF and
Weissman IL: Stem cells, cancer, and cancer stem cells. Nature.
414:105–111. 2001. View
Article : Google Scholar : PubMed/NCBI
|
|
3
|
Taniguchi H, Moriya C, Igarashi H, Saitoh
A, Yamamoto H, Adachi Y and Imai K: Cancer stem cells in human
gastrointestinal cancer. Cancer Sci. 107:1556–1562. 2016.
View Article : Google Scholar : PubMed/NCBI
|
|
4
|
Garvalov BK and Acker T: Cancer stem
cells: A new framework for the design of tumor therapies. J Mol Med
(Berl). 89:95–107. 2011. View Article : Google Scholar : PubMed/NCBI
|
|
5
|
Corbeil D, Karbanová J, Fargeas CA and
Jászai J: Prominin-1 (CD133): Molecular and cellular features
across species. Adv Exp Med Biol. 777:3–24. 2013. View Article : Google Scholar : PubMed/NCBI
|
|
6
|
Yin AH, Miraglia S, Zanjani ED,
Almeida-Porada G, Ogawa M, Leary AG, Olweus J, Kearney J and Buck
DW: AC133, a novel marker for human hematopoietic stem and
progenitor cells. Blood. 90:5002–5012. 1997.PubMed/NCBI
|
|
7
|
Huang R, Mo D, Wu J, Ai H and Lu Y: CD133
expression correlates with clinicopathologic features and poor
prognosis of colorectal cancer patients: An updated meta-analysis
of 37 studies. Medicine (Baltimore). 97:e104462018. View Article : Google Scholar : PubMed/NCBI
|
|
8
|
Sukowati CHC: Heterogeneity of hepatic
cancer stem cells. Adv Exp Med Biol. 1139:59–81. 2019. View Article : Google Scholar : PubMed/NCBI
|
|
9
|
Reyes EE, Gillard M, Duggan R, Wroblewski
K, Kregel S, Isikbay M, Kach J, Brechka H, Weele DJ, Szmulewitz RZ
and Griend DJ: Molecular analysis of CD133-positive circulating
tumor cells from patients with metastatic castration-resistant
prostate cancer. J Transl Sci. 1:2015.PubMed/NCBI
|
|
10
|
Chen E, Zeng Z, Bai B, Zhu J and Song Z:
The prognostic value of CSCs biomarker CD133 in NSCLC: A
meta-analysis. Oncotarget. 7:56526–56539. 2016.PubMed/NCBI
|
|
11
|
Ishigami S, Ueno S, Arigami T, Uchikado Y,
Setoyama T, Arima H, Kita Y, Kurahara H, Okumura H, Matsumoto M, et
al: Prognostic impact of CD133 expression in gastric carcinoma.
Anticancer Res. 30:2453–2457. 2010.PubMed/NCBI
|
|
12
|
Hashimoto K, Aoyagi K, Isobe T, Kouhuji K
and Shirouzu K: Expression of CD133 in the cytoplasm is associated
with cancer progression and poor prognosis in gastric cancer.
Gastric Cancer. 17:97–106. 2014. View Article : Google Scholar : PubMed/NCBI
|
|
13
|
Tomita H, Tanaka K, Tanaka T and Hara A:
Aldehyde dehydrogenase 1A1 in stem cells and cancer. Oncotarget.
7:11018–11032. 2016. View Article : Google Scholar : PubMed/NCBI
|
|
14
|
Ginestier C, Hur MH, Charafe-Jauffret E,
Monville F, Dutcher J, Brown M, Jacquemier J, Viens P, Kleer CG,
Liu S, et al: ALDH1 is a marker of normal and malignant human
mammary stem cells and a predictor of poor clinical outcome. Cell
Stem Cell. 1:555–567. 2007. View Article : Google Scholar : PubMed/NCBI
|
|
15
|
Huang EH, Hynes MJ, Zhang T, Ginestier C,
Dontu G, Appelman H, Fields JZ, Wicha MS and Boman BM: Aldehyde
dehydrogenase 1 is a marker for normal and malignant human colonic
stem cells (SC) and tracks SC overpopulation during colon
tumorigenesis. Cancer Res. 69:3382–3389. 2009. View Article : Google Scholar : PubMed/NCBI
|
|
16
|
Cardoso R, Coburn NG, Seevaratnam R, Mahar
A, Helyer L, Law C and Singh S: A systematic review of patient
surveillance after curative gastrectomy for gastric cancer: A brief
review. Gastric Cancer. 15 (Suppl 1):S164–S167. 2012. View Article : Google Scholar : PubMed/NCBI
|
|
17
|
Sakuramoto S, Sasako M, Yamaguchi T,
Kinoshita T, Fujii M, Nashimoto A, Furukawa H, Nakajima T, Ohashi
Y, Imamura H, et al: Adjuvant chemotherapy for gastric cancer with
S-1, an oral fluoropyrimidine. N Engl J Med. 357:1810–1820. 2007.
View Article : Google Scholar : PubMed/NCBI
|
|
18
|
Bang YJ, Kim YW, Yang HK, Chung HC, Park
YK, Lee KH, Lee KW, Kim YH, Noh SI, Cho JY, et al: Adjuvant
capecitabine and oxaliplatin for gastric cancer after D2
gastrectomy (CLASSIC): A phase 3 open-label, randomised controlled
trial. Lancet. 379:315–321. 2012. View Article : Google Scholar : PubMed/NCBI
|
|
19
|
Oken MM, Creech RH, Tormey DC, Horton J,
Davis TE, McFadden ET and Carbone PP: Toxicity and response
criteria of the Eastern Cooperative Oncology Group. Am J Clin
Oncol. 5:649–655. 1982. View Article : Google Scholar : PubMed/NCBI
|
|
20
|
Ilhan E, Ureyen O and Meral UM: Ongoing
problems concerning 7th TNM staging system and proposals for 8th
TNM staging system of gastric cancer. Prz Gastroenterol.
11:223–225. 2016.PubMed/NCBI
|
|
21
|
Oo AKK, Calle AS, Nair N, Mahmud H,
Vaidyanath A, Yamauchi J, Khayrani AC, Du J, Alam MJ, Seno A, et
al: Up-regulation of PI 3-kinases and the activation of PI3K-Akt
signaling pathway in cancer stem-like cells through DNA
hypomethylation mediated by the cancer microenvironment. Transl
Oncol. 11:653–663. 2018. View Article : Google Scholar : PubMed/NCBI
|
|
22
|
Jiang Q, Zhang Q, Wang S, Xie S, Fang W,
Liu Z, Liu J and Yao K: A fraction of CD133+ CNE2 cells
is made of giant cancer cells with morphological evidence of
asymmetric mitosis. J Cancer. 6:1236–1244. 2015. View Article : Google Scholar : PubMed/NCBI
|
|
23
|
Network NCCN, . (NCCN) Clinical Practice
Guidelines in Oncology. Gastric cancer. version 1. 2018. 2018.
https://www.nccn.org/professionals/physician_gls/pdf/gastric.pdf
|
|
24
|
Basch E, Iasonos A, McDonough T, Barz A,
Culkin A, Kris MG, Scher HI and Schrag D: Patient versus clinician
symptom reporting using the National Cancer Institute Common
Terminology criteria for adverse events: Results of a
questionnaire-based study. Lancet Oncol. 7:903–909. 2006.
View Article : Google Scholar : PubMed/NCBI
|
|
25
|
Clevers H: The cancer stem cell: Premises,
promises and challenges. Nat Med. 17:313–319. 2011. View Article : Google Scholar : PubMed/NCBI
|
|
26
|
Mills JC and Shivdasani RA: Gastric
epithelial stem cells. Gastroenterology. 140:412–424. 2011.
View Article : Google Scholar : PubMed/NCBI
|
|
27
|
Deng S, Yang X, Lassus H, Liang S, Kaur S,
Ye Q, Li C, Wang LP, Roby KF, Orsulic S, et al: Distinct expression
levels and patterns of stem cell marker, aldehyde dehydrogenase
isoform 1 (ALDH1), in human epithelial cancers. PLoS One.
5:e102772010. View Article : Google Scholar : PubMed/NCBI
|
|
28
|
Levi E, Sochacki P, Khoury N, Patel BB and
Majumdar AP: Cancer stem cells in Helicobacter pylori
infection and aging: Implications for gastric carcinogenesis. World
J Gastrointest Pathophysiol. 5:366–372. 2014. View Article : Google Scholar : PubMed/NCBI
|
|
29
|
Li XS, Xu Q, Fu XY and Luo WS: ALDH1A1
overexpression is associated with the progression and prognosis in
gastric cancer. BMC cancer. 14:7052014. View Article : Google Scholar : PubMed/NCBI
|
|
30
|
Wakamatsu Y, Sakamoto N, Oo HZ, Naito Y,
Uraoka N, Anami K, Sentani K, Oue N and Yasui W: Expression of
cancer stem cell markers ALDH1, CD44 and CD133 in primary tumor and
lymph node metastasis of gastric cancer. Pathol Int. 62:112–119.
2012. View Article : Google Scholar : PubMed/NCBI
|
|
31
|
Li K, Guo X, Wang Z, Li X, Bu Y, Bai X,
Zheng L and Huang Y: The prognostic roles of ALDH1 isoenzymes in
gastric cancer. Onco Targets Ther. 9:3405–3414. 2016.PubMed/NCBI
|
|
32
|
Biddle A, Liang X, Gammon L, Fazil B,
Harper LJ, Emich H, Costea DE and Mackenzie IC: Cancer stem cells
in squamous cell carcinoma switch between two distinct phenotypes
that are preferentially migratory or proliferative. Cancer Res.
71:5317–5326. 2011. View Article : Google Scholar : PubMed/NCBI
|
|
33
|
Lu L, Wu M, Sun L, Li W, Fu W, Zhang X and
Liu T: Clinicopathological and prognostic significance of cancer
stem cell markers CD44 and CD133 in patients with gastric cancer: A
comprehensive meta-analysis with 4,729 patients involved. Medicine
(Baltimore). 95:e51632016. View Article : Google Scholar : PubMed/NCBI
|
|
34
|
Lee HH, Seo KJ, An CH, Kim JS and Jeon HM:
CD133 expression is correlated with chemoresistance and early
recurrence of gastric cancer. J Surg Oncol. 106:999–1004. 2012.
View Article : Google Scholar : PubMed/NCBI
|
|
35
|
Jiang Y, He Y, Li H, Li HN, Zhang L, Hu W,
Sun YM, Chen FL and Jin XM: Expressions of putative cancer stem
cell markers ABCB1, ABCG2, and CD133 are correlated with the degree
of differentiation of gastric cancer. Gastric Cancer. 15:440–450.
2012. View Article : Google Scholar : PubMed/NCBI
|
|
36
|
Yu JW, Wang SL, Wu JG, Lu RQ, Ni XC, Cai C
and Jiang BJ: Study on the biological characteristics of CD133(+)
cells interfered by RNA interference in gastric cancer. ISRN
Gastroenterol. 2014:3295192014. View Article : Google Scholar : PubMed/NCBI
|
|
37
|
Zhu Y, Yu J, Wang S, Lu R, Wu J and Jiang
B: Overexpression of CD133 enhances chemoresistance to
5-fluorouracil by activating the PI3K/Akt/p70S6K pathway in gastric
cancer cells. Oncol Rep. 32:2437–2444. 2014. View Article : Google Scholar : PubMed/NCBI
|
|
38
|
Paoletti X, Oba K, Burzykowski T, Michiels
S, Ohashi Y, Pignon JP, Rougier P, Sakamoto J, Sargent D, et al:
GASTRIC (Global Advanced/Adjuvant Stomach Tumor Research
International Collaboration) Group: Benefit of adjuvant
chemotherapy for resectable gastric cancer: A meta-analysis. JAMA.
303:1729–1737. 2010. View Article : Google Scholar : PubMed/NCBI
|
|
39
|
Liu T, Li W, Sun Y and Shen K: Adjuvant
chemotherapy for gastric cancer: Less drug, same efficacy. J Clin
Oncol. 29:1142011. View Article : Google Scholar
|
|
40
|
Larzabal L, El-Nikhely N, Redrado M,
Seeger W, Savai R and Calvo A: Differential effects of drugs
targeting cancer stem cell (CSC) and non-CSC populations on lung
primary tumors and metastasis. PLoS One. 8:e797982013. View Article : Google Scholar : PubMed/NCBI
|
|
41
|
Świerczewska M, Klejewski A, Brązert M,
Kaźmierczak D, Iżycki D, Nowicki M, Zabel M and Januchowski R: New
and old genes associated with primary and established responses to
paclitaxel treatment in ovarian cancer cell lines. Molecules.
23:E8912018. View Article : Google Scholar : PubMed/NCBI
|