Introduction
Gliomas are one of the common primary neoplasms of
the brain, and it is caused by carcinogenesis of the brain and
spinal glial cells (1). The annual
incidence is 3–8 cases per 100,000. Just as with other types of
tumor (such as gastric, breast and colorectal cancer), gliomas are
also induced by the interaction between genetic high-risk factors
and environmental factors, including air pollution and ionizing
radiation (2). Certain known
diseases are also genetic susceptibility factors of gliomas, such
as neurofibromatosis (type I) and tuberculous sclerotic diseases
(3). According to the grading system
set by the World Health Organization (WHO) (4), gliomas are classified into four grades:
Grade 1, the slightest with the most favorable prognosis; to grade
4, the most severe with the worst prognosis of all grades. The
anaplastic gliomas, in terms of traditional cytopathology, are
classified as grade 3, and glioblastoma (GBM) is classified as
grade 4 (5).
GBM is the most common and lethal malignant primary
brain tumor in adults, and is a member of a group of tumors known
as gliomas (6). GBM is evolved from
astroid neuroglial cell lineage that supports neurocytes, and it
accounts for 12–15% of intracranial tumors, and 50–60% of
astrocytic tumors (7). The molecular
mechanism underlying GBM progression remains unclear, however there
is an increasing number of studies suggesting genetic mutations
(8–10).
Numerous previous studies have performed
bioinformatic analyses to investigate differentially expressed
genes (DEGs) in patients with GBM, as well as their roles in
different pathways, molecular functions and biological processes
(11–13). The overall survival rate is different
in patients with GBM to those with different mutation statuses of
isocitrate dehydrogenase (IDH), and a previous study has
demonstrated that patients with GBM that possess mutated
IDH1 have an improved prognosis (14). A total of 23 differently expressed
microRNAs (miRNAs) were selected in patients with GMB that
possessed mutated and wild IDH1, and these miRNAs were identified
as IDH1 mutation miRNAs (11). A
molecular marker consisting of 10 miRNAs was identified and
validated in the GBM in a previous study; among these, 7 were
considered dangerous miRNAs (mir-31, mir-222, mir-148a, mir-221,
mir-146b, mir-200b and mir-193a), while the other 3 were considered
protective (mir-20a, mir-106a and mir-17-5p) (12). The study screened 3 prognostic genes,
including formyl peptide receptor 3, IKBKB interacting protein and
S100 calcium binding protein A9, in the mRNA expression profile of
a Coarse Grained Parallel Genetic Algorithm, and the biomarker
composed of these 3 genes was indicated to serve a prognostic value
in patients with GBM with promoter methylation of
O(6)-methylguanine DNA methyltransferase (MGMT) (13). A previous study aimed to predict the
prognosis of patients with GBM by screening immune-associated
molecular markers (15).
Arimappamagan et al (16)
identified 14 prognostic genes in patients with GBM, and through
pathway analysis of the Database for Annotation, Visualization and
Integrated Discovery (DAVID), it was revealed that these
differential genes were gathering in the inflammatory and immune
response pathways (16).
Microarray technology allows simultaneous analysis
of changes in the expression of multiple genes to obtain gene sets
that could predict GBM (17). DEGs
are associated with the grade of tumor and the prognosis of
patients with glioma (18). Key
molecular markers may serve as independent impact factors (19). Further studies should investigate the
underlying mechanisms associated with the abnormally expressed
genetic molecular markers. These genetic molecular markers have an
impact on the occurrence and malignant progression of GBM, and
could serve as therapeutic targets (20). Therefore, the detection and analysis
of reliable gene targets of GBM is required (21,22).
The present study aimed to analyze two microarray
databases of human gene sets from public datasets, and identify
DEGs between patients with GBM and healthy individuals.
Subsequently, the Kyoto Encyclopedia of Genes and Genomes (KEGG)
pathway and Gene Ontology (GO) analyses were performed. In
addition, protein-protein interaction (PPI) network analyses, and
co-expression network analyses were conducted to help demonstrate
molecular targets underlying carcinogenesis of GBM. Overall, 10 hub
genes and 341 DEGs were authenticated, which may serve as potential
molecular biomarkers for GBM.
Materials and methods
Access to public data
The Gene Expression Omnibus (GEO; http://www.ncbi.nlm.nih.gov/geo) is an open
platform to store genetic data (23). Two expression profiling datasets
[GSE122498 (GPL570 platform) (24)
and GSE104291 (GPL570 platform) (25)] were obtained from the GEO. The
datasets of GSE122498 contained 1 normal sample and 16 GBM samples.
Similarly, GSE104291 consisted of 2 normal samples and 24 GBM
samples.
DEGs identified by GEO2R
GEO2R (https://www.ncbi.nlm.nih.gov/geo/geo2r/) is an
interactive online tool to identify DEGs from GEO series (26). GEO2R could be applied to distinguish
DEGs between normal brain tissue and GBM tissue samples. According
to the method by Benjamini and Hochberg (false discovery rate)
(27), the tool could alter the
P-values, so as to obtain the adjusted P-values (adj. P), and to
maintain a balance between the possibility of false-positives and
detection of statistically significant genes. If one probe set does
not have the homologous gene, or if one gene has numerous probe
sets, the data will be removed. The rule of statistical
significance is that adj. P≤0.01 and fold change (FC) ≥2 were
considered to indicate a statistically significant result.
Functional annotation for DEGs with
the KEGG and GO analysis
DAVID (https://david.ncifcrf.gov/home.jsp; version 6.8), is
an online analysis tool suite with the function of Integrated
Discovery and Annotation (28). GO
is an ontology tool widely used in bioinformatics, which covers
three aspects of biology, including ‘biological process (BP)’,
‘cellular component (CC)’ and ‘molecular function (MF)’ (29). KEGG (www.kegg.jp), is
one of the most commonly used biological information databases in
the world (30). To analyze GO and
the biological pathway information of the DEGs, the DAVID online
tool was implemented. P<0.05 was considered to indicate a
statistically significant result. The UCSC Genome Browser
(genome.ucsc.edu) is a graphical viewer for
exploring genome annotations and was used to hierarchically cluster
key genes.
Construction of the PPI network and
identification of significant modules
Search Tool for the Retrieval of Interacting Genes
(STRING; string.embl.de), an online open tool,
was applied to construct one the PPI network (31). Cytoscape (version 3.6.1), a free
visualization software, was used to present the network (32). A confidence score >0.4 was
considered the criterion of judgment. The Molecular Complex
Detection (MCODE) (version 1.5.1; a plug-in of Cytoscape)
subsequently identified the most important module of the network
map (33). The criteria of the MCODE
analysis is that the degree of cut-off=2, MCODE scores >5, Max
depth=100, node score cut-off=0.2, and k-score=2.
Analysis and identification of hub
genes
When the degrees were set (degrees ≥10), the hub
genes were excavated. Subsequently, with the KEGG and GO analysis
in the DAVID database, functional annotation for the hub genes was
performed. One co-expression network of these hub genes and a
survival analysis was obtained using cBioPortal (www.cbioportal.org) (34). Furthermore, The Biological Networks
Gene Oncology tool (version 3.0.3) was used to analyze and
visualize the hub genes’ ‘CC’, ‘BP’ and ‘MF’ (35). The clustering analysis of hub genes
was performed using OmicShare (version: 2015–2019; www.omicshare.com/tools/index.php), and
the University of California Santa Cruz (UCSC) Xena software
(xena.ucsc.edu/welcome-to-ucsc-xena) was used to
securely analyze and visualize the hub genes in the scope of public
genomic datasets. The expression profiles of these hub genes were
analyzed and displayed using the online database Gene Expression
Profiling Interactive Analysis (GEPIA; gepia.cancer-pku.cn). The
unpaired Student's t-test was used make the comparisons between the
normal sample and GBM samples. P<0.05 was used to indicate
statistically significant results. The Kaplan-Meier plotter
(www.kmplot.com) was used to perform the overall
survival rate analysis. The log rank test was used to compare
survival curves.
Results
Screening of DEGs in GBM samples
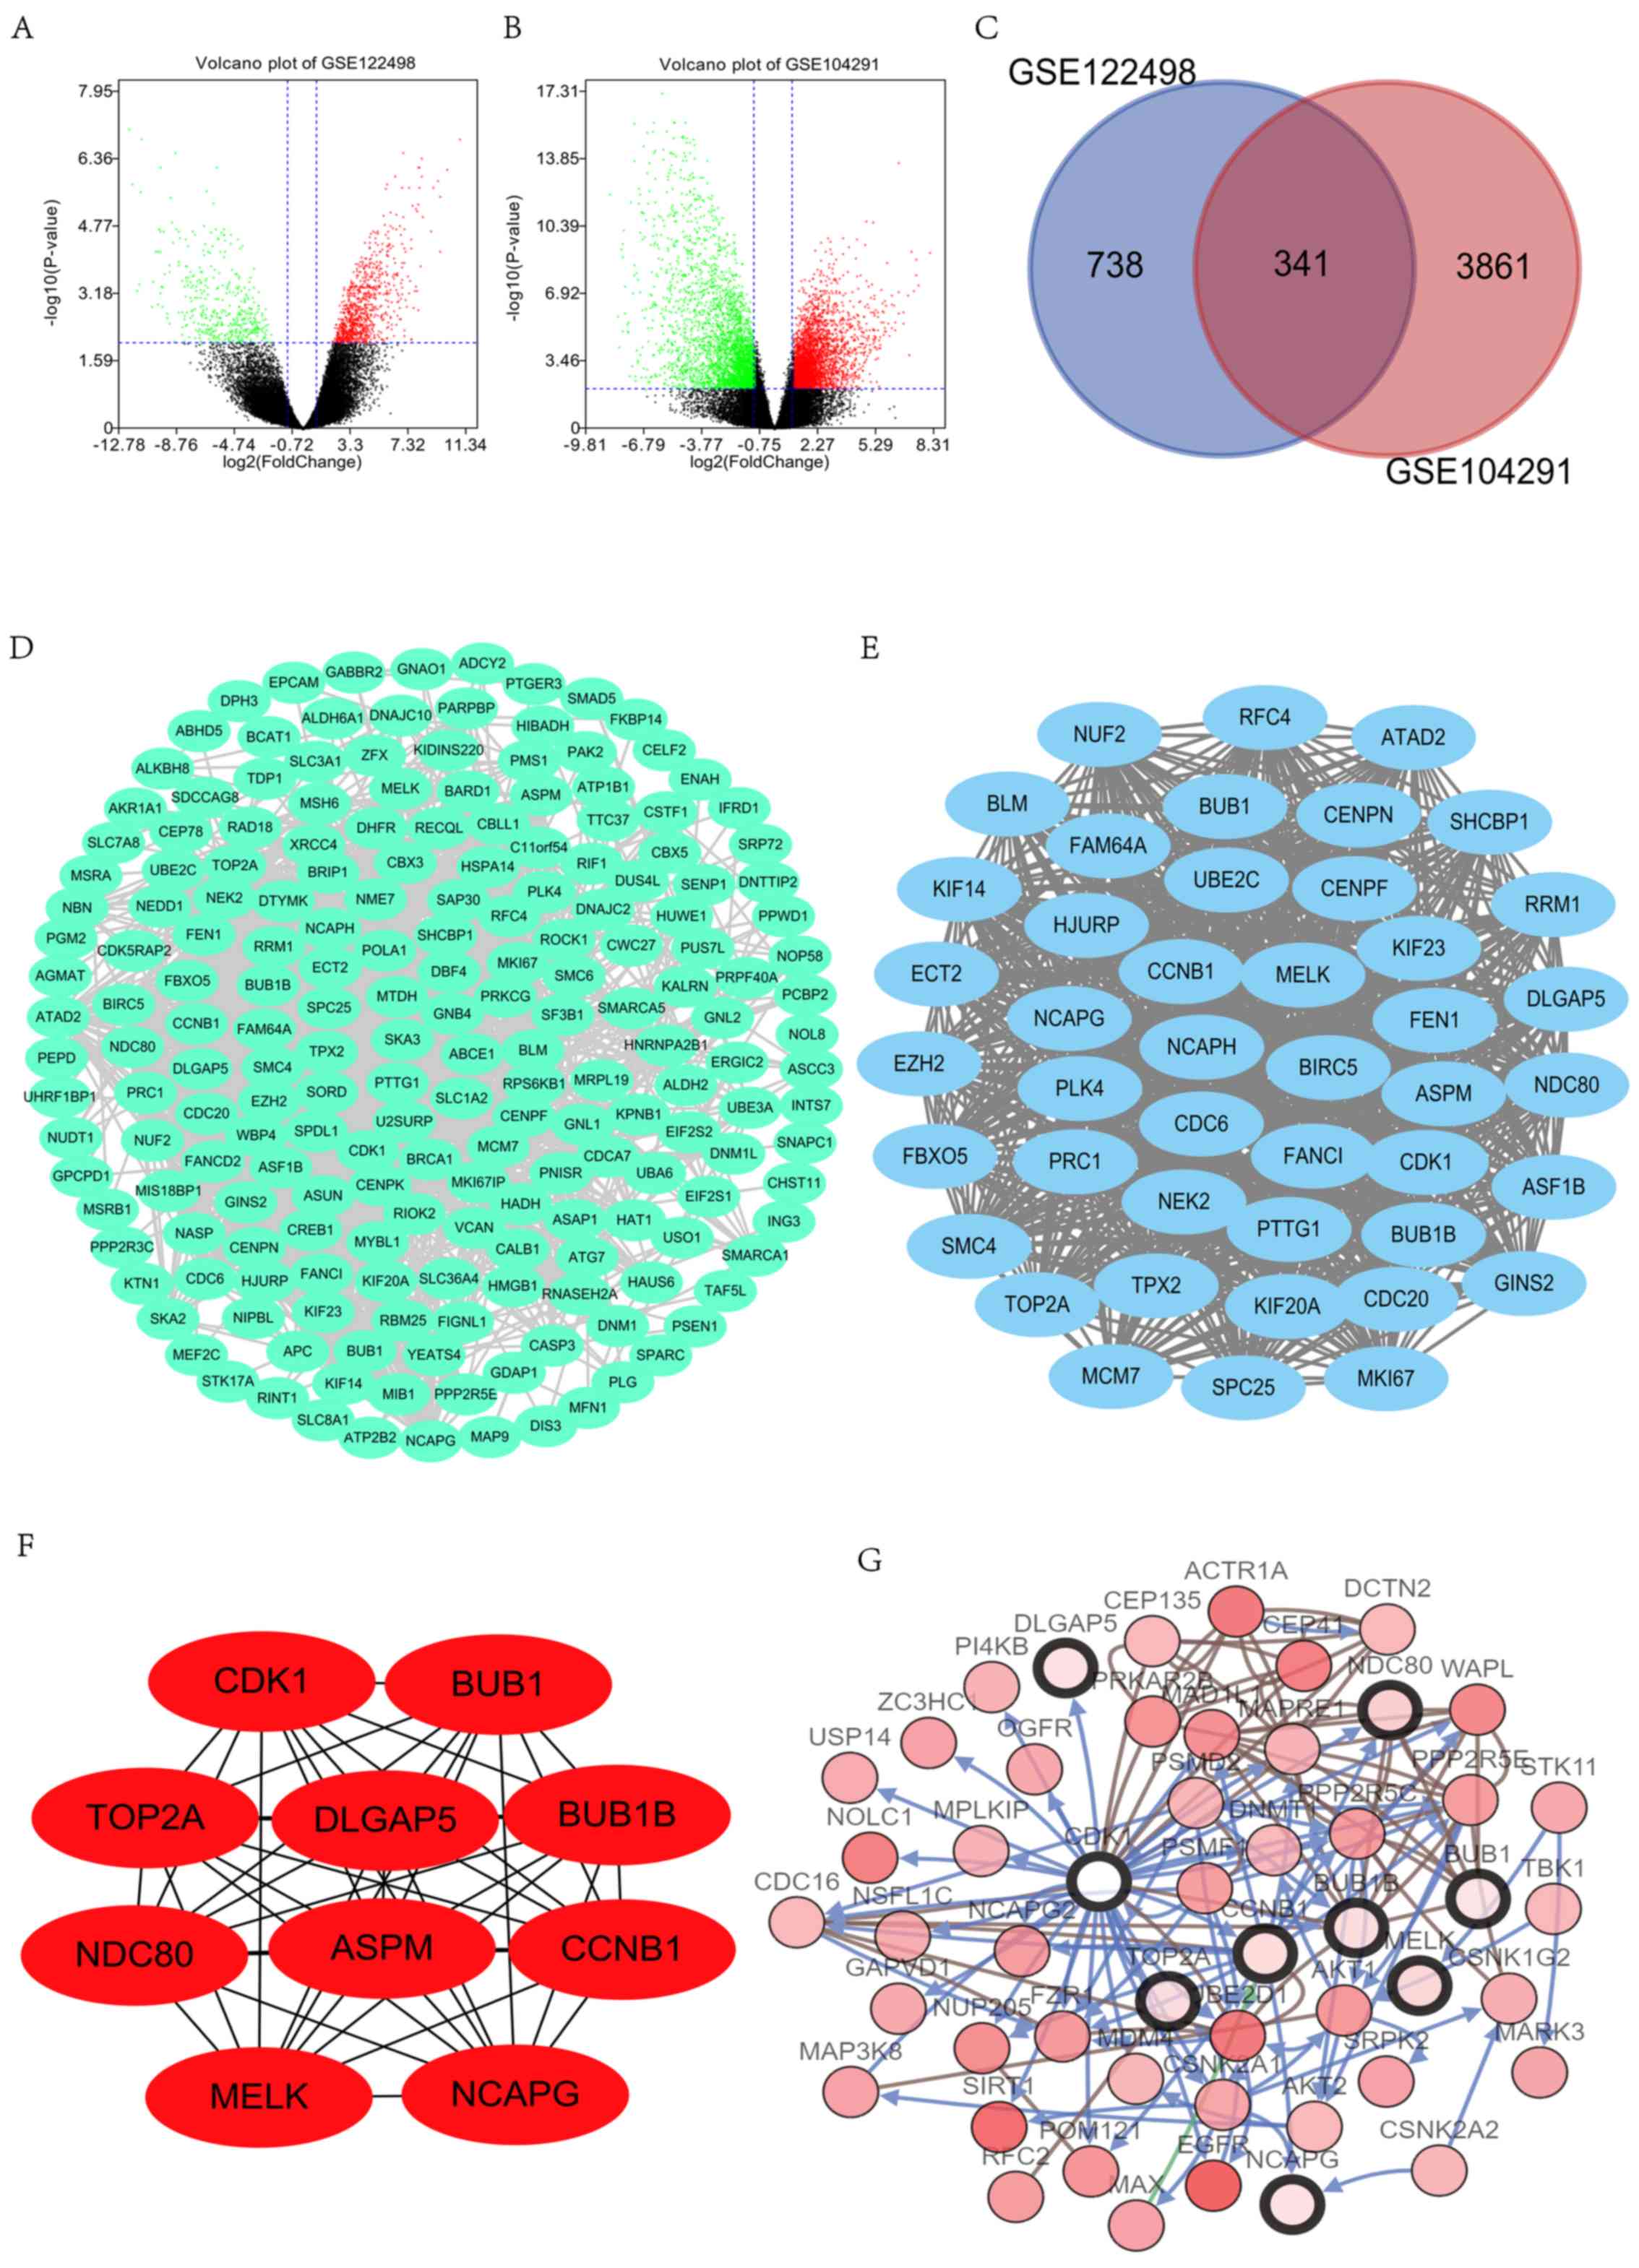
Following the analysis of the datasets (GSE122498
and GSE104291) with GEO2R, the differences between control and GBM
tissues were presented in volcano plots (Fig. 1A and B). The analysis of GSE122498
and GSE104291 identified 1,079 and 4,202 DEGs, respectively
(Fig. 1C). The Venn diagram revealed
that the common part between the 2 datasets included 341 DEGs.
Functional annotation for DEGs with
the KEGG and GO analysis
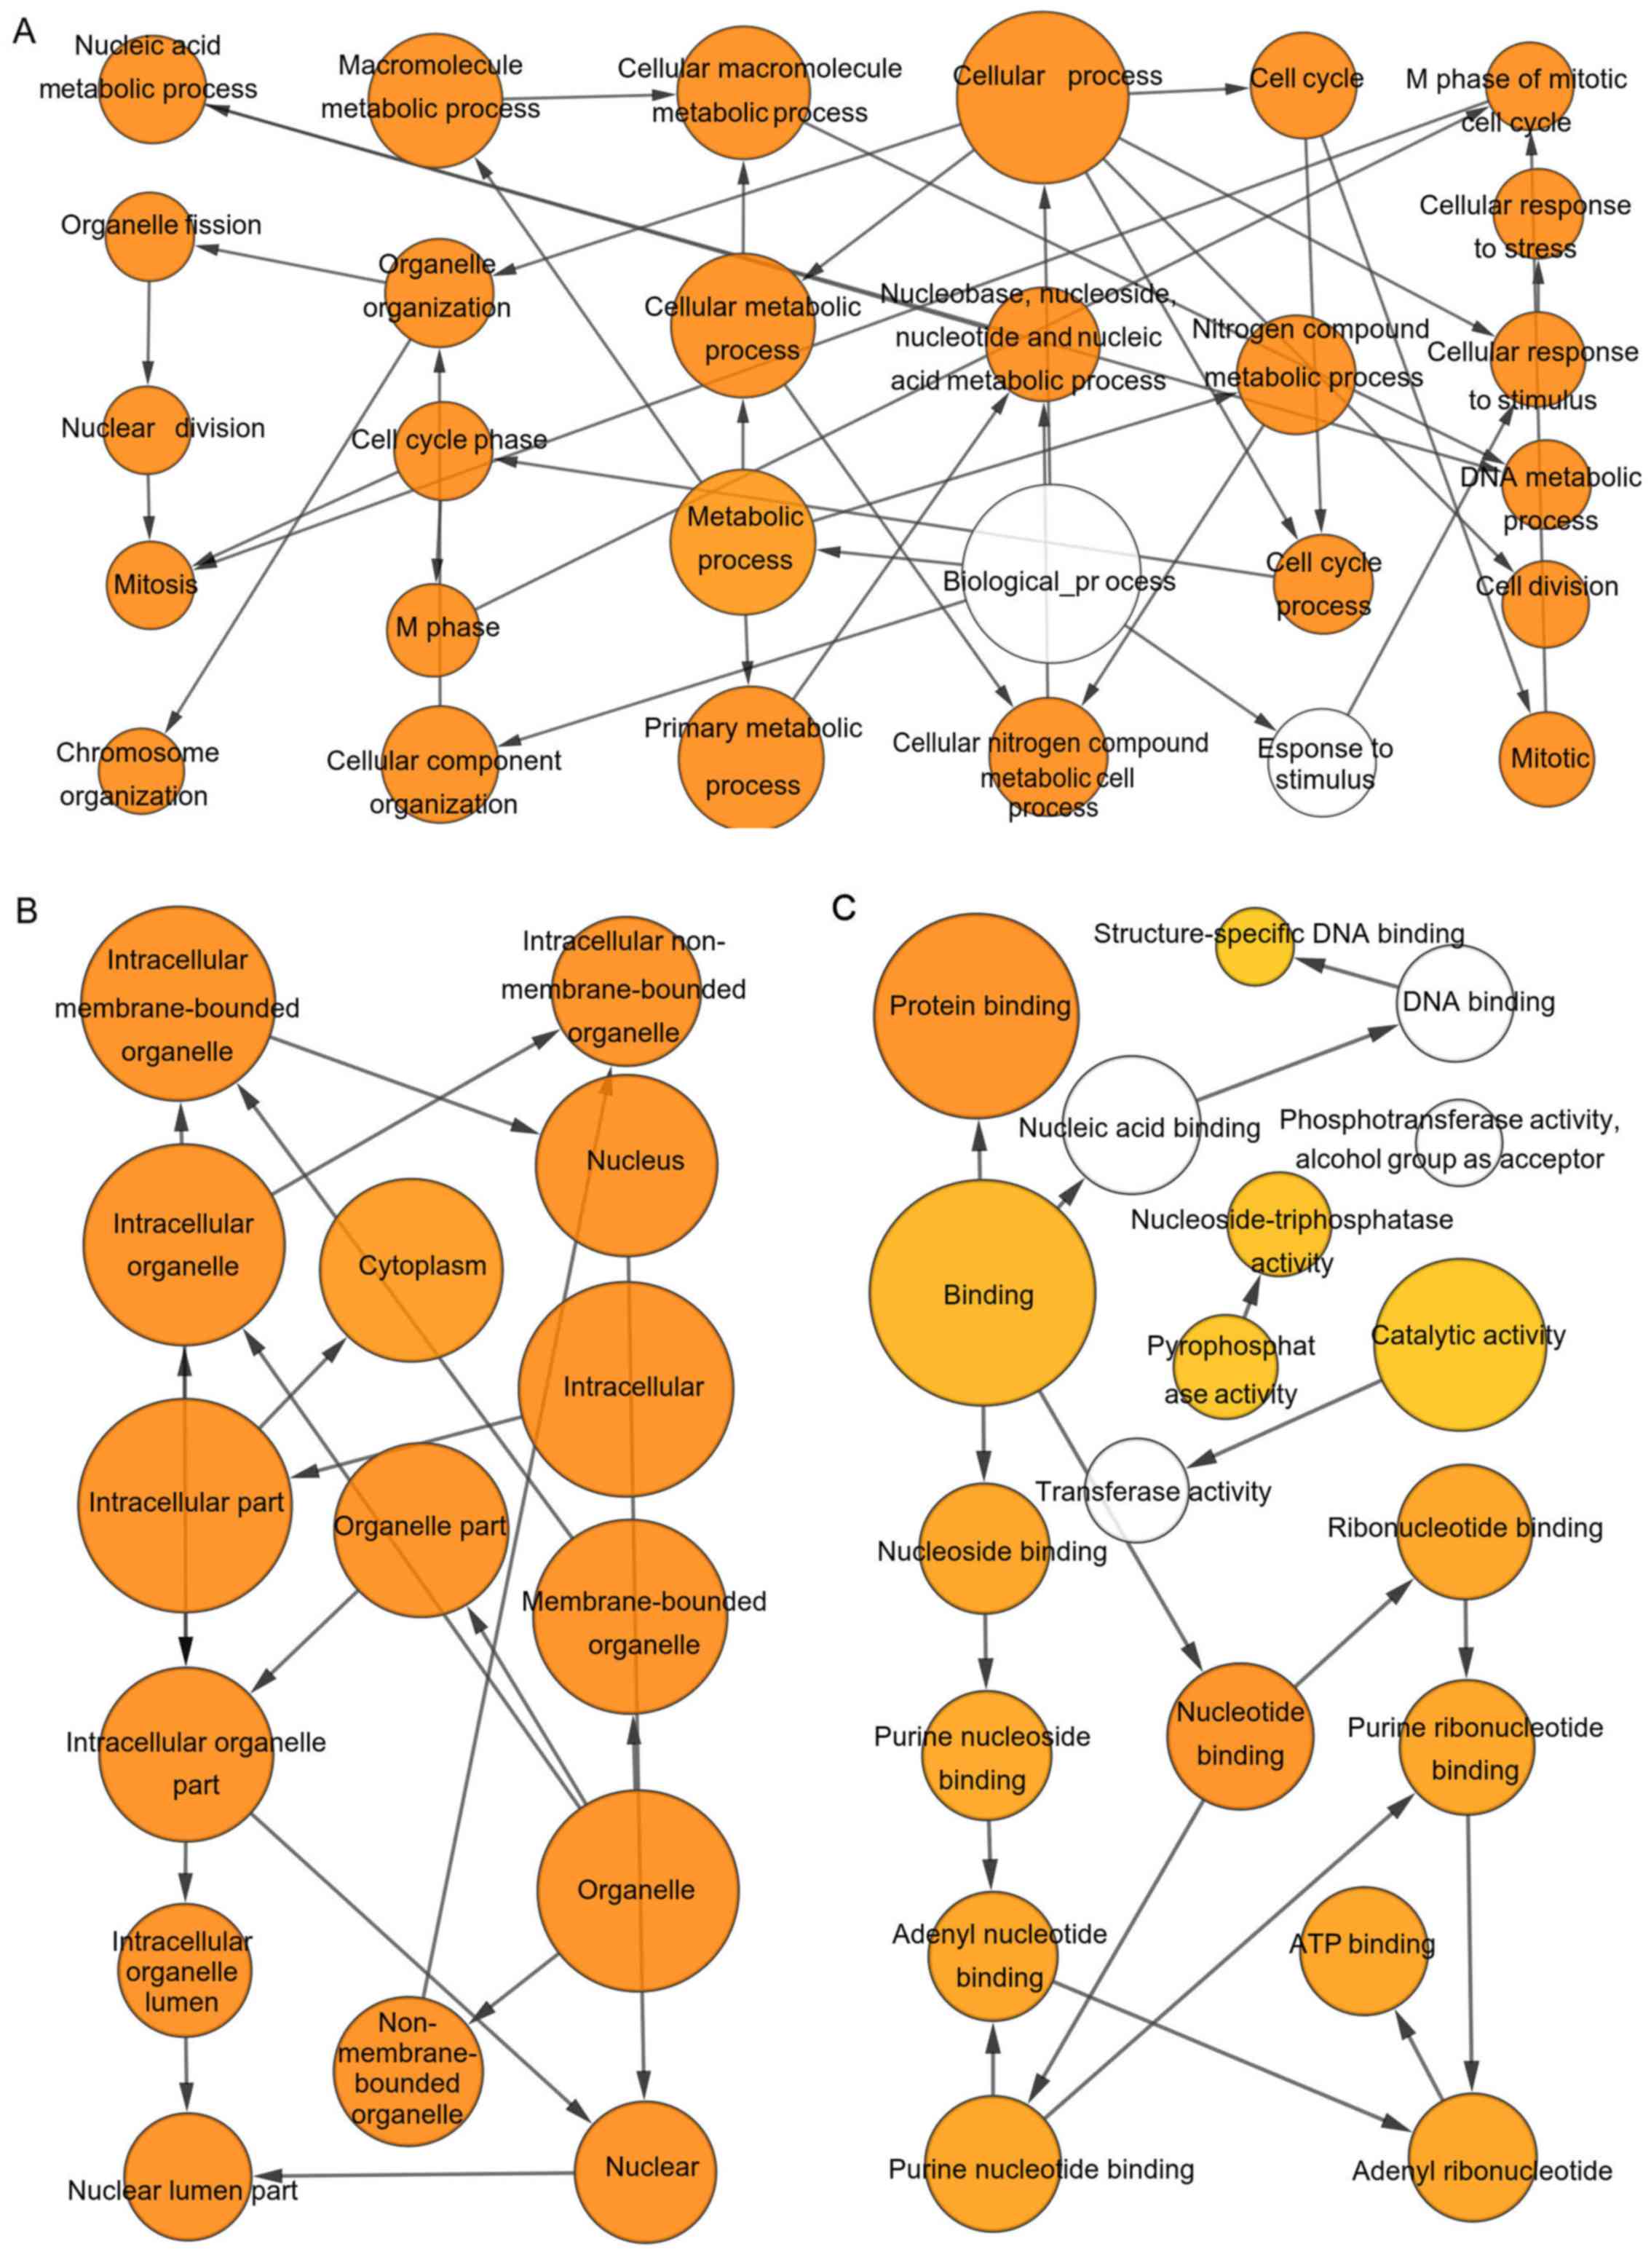
The results of the GO analysis demonstrated that
variations in the BP were primarily enriched in ‘cell division’,
‘mitotic nuclear division’ and ‘DNA replication’. Changes in CC
were primarily enriched in the nucleoplasm, cytosol and nucleus.
The variations in MF were enriched in protein binding, ATP binding
and protein C-terminus binding. The KEGG analysis demonstrated that
DEGs were prevailingly enriched in the ‘cell cycle’, ‘DNA
replication’, ‘oocyte meiosis’, ‘valine, leucine and isoleucine
degradation’, ‘fanconi anemia pathway’, ‘GABAergic synapse’,
‘dopaminergic synapse’, and ‘endocrine and other factor-regulated
calcium reabsorption’ (Table I).
 | Table I.GO and KEGG pathway enrichment
analysis of DEGs in glioblastoma samples. |
Table I.
GO and KEGG pathway enrichment
analysis of DEGs in glioblastoma samples.
| Term | Description | Count in gene
set | P-value |
|---|
| GO:0051301 | Cell division | 30 |
1.16×10⁻¹¹ |
| GO:0007067 | Mitotic nuclear
division | 24 |
1.85×10⁻¹⁰ |
| GO:0006260 | DNA
replication | 18 |
3.67×10⁻⁹ |
| GO:0005654 | Nucleoplasm | 112 |
2.52×10⁻¹⁸ |
| GO:0005829 | Cytosol | 106 |
1.73×10⁻¹⁰ |
| GO:0005634 | Nucleus | 149 |
2.35×10⁻¹⁰ |
| GO:0005515 | Protein
binding | 203 |
1.93×10⁻⁸ |
| GO:0005524 | ATP binding | 51 |
7.77×10⁻⁶ |
| GO:0008022 | Protein C-terminus
binding | 12 |
3.99×10⁻⁴ |
| hsa04110 | Cell cycle | 9 | 0.002 |
| hsa03030 | DNA
replication | 5 | 0.004 |
| hsa04114 | Oocyte meiosis | 8 | 0.004 |
| hsa00280 | Valine, leucine and
isoleucine degradation | 5 | 0.010 |
| hsa03460 | Fanconi anemia
pathway | 5 | 0.016 |
| hsa04727 | GABAergic
synapse | 6 | 0.019 |
| hsa04728 | Dopaminergic
synapse | 7 | 0.030 |
| hsa04961 | Endocrine and other
factor-regulated calcium reabsorption | 4 | 0.049 |
Construction of the PPI network and
identification of significant module and hub genes
The PPI network was constructed and significant
modules were identified, with 1,799 edges and 237 nodes in the PPI
network (Fig. 1D), and 884 edges and
44 nodes in the significant module (Fig.
1E). Degrees ≥10 were considered as the criterion of judgment,
which was the criterion to determine significance. Overall, 10
genes were identified as hub genes within Cytoscape: CDK1,
BUB1B, NDC80, NCAPG, BUB1, CCNB1, TOP2A, DLGAP5, ASPM and
MELK (Fig. 1F). Among the hub
genes, CDK1 and BUB1B had the highest scores,
suggesting that they may play important roles in the occurrence or
development of GBM. With DAVID, the KEGG and GO analyses of DEGs
involved in hub genes were analyzed. The results revealed that
these genes were prevailingly enriched in ‘cell division’, ‘mitotic
nuclear division’, ‘cell proliferation’, ‘condensed nuclear
chromosome outer kinetochore’, ‘kinetochore’, ‘condensed chromosome
kinetochore’, ‘protein kinase activity’, ‘protein serine/threonine
kinase activity’ and ‘histone kinase activity’. Analyses of the
KEGG pathway indicated that significant genes were primarily
enriched in the ‘cell cycle’, ‘progesterone-mediated oocyte
maturation’, ‘oocyte meiosis’ and the ‘p53 signaling pathway’
(Table II).
| Table II.GO and KEGG pathway enrichment
analysis of DEGs in the most significant module. |
Table II.
GO and KEGG pathway enrichment
analysis of DEGs in the most significant module.
| Pathway ID | Pathway
description | Count in gene
set | P-value |
|---|
| GO:0051301 | Cell division | 6 |
4.50×10⁻⁷ |
| GO:0007067 | Mitotic nuclear
division | 5 |
5.52×10⁻⁶ |
| GO:0008283 | Cell
proliferation | 5 |
2.57×10⁻⁵ |
| GO:0000942 | Condensed nuclear
chromosome outer kinetochore | 3 |
1.30×10⁻⁶ |
| GO:0000776 | Kinetochore | 3 |
6.88×10⁻⁴ |
| GO:0000777 | Condensed
chromosome kinetochore | 3 |
7.94×10⁻⁴ |
| GO:0004672 | Protein kinase
activity | 4 |
7.28×10⁻⁴ |
| GO:0004674 | Protein
serine/threonine kinase activity | 4 |
8.33×10⁻⁴ |
| GO:0035173 | Histone kinase
activity | 2 | 0.002 |
| hsa04110 | Cell cycle | 4 |
5.72×10⁻⁶ |
| hsa04914 |
Progesterone-mediated oocyte
maturation | 3 |
4.70×10⁻⁴ |
| hsa04114 | Oocyte meiosis | 3 |
7.66×10⁻⁴ |
| hsa04115 | p53 signaling
pathway | 2 | 0.029 |
Hub genes analysis
According to the Gene cards, summaries for the
function of the 10 hub genes were obtained (Table III). A co-expression network of
these significant genes was obtained using cBioPortal (Fig. 1G). The BP, CC and MF analysis for
these genes is presented in Fig.
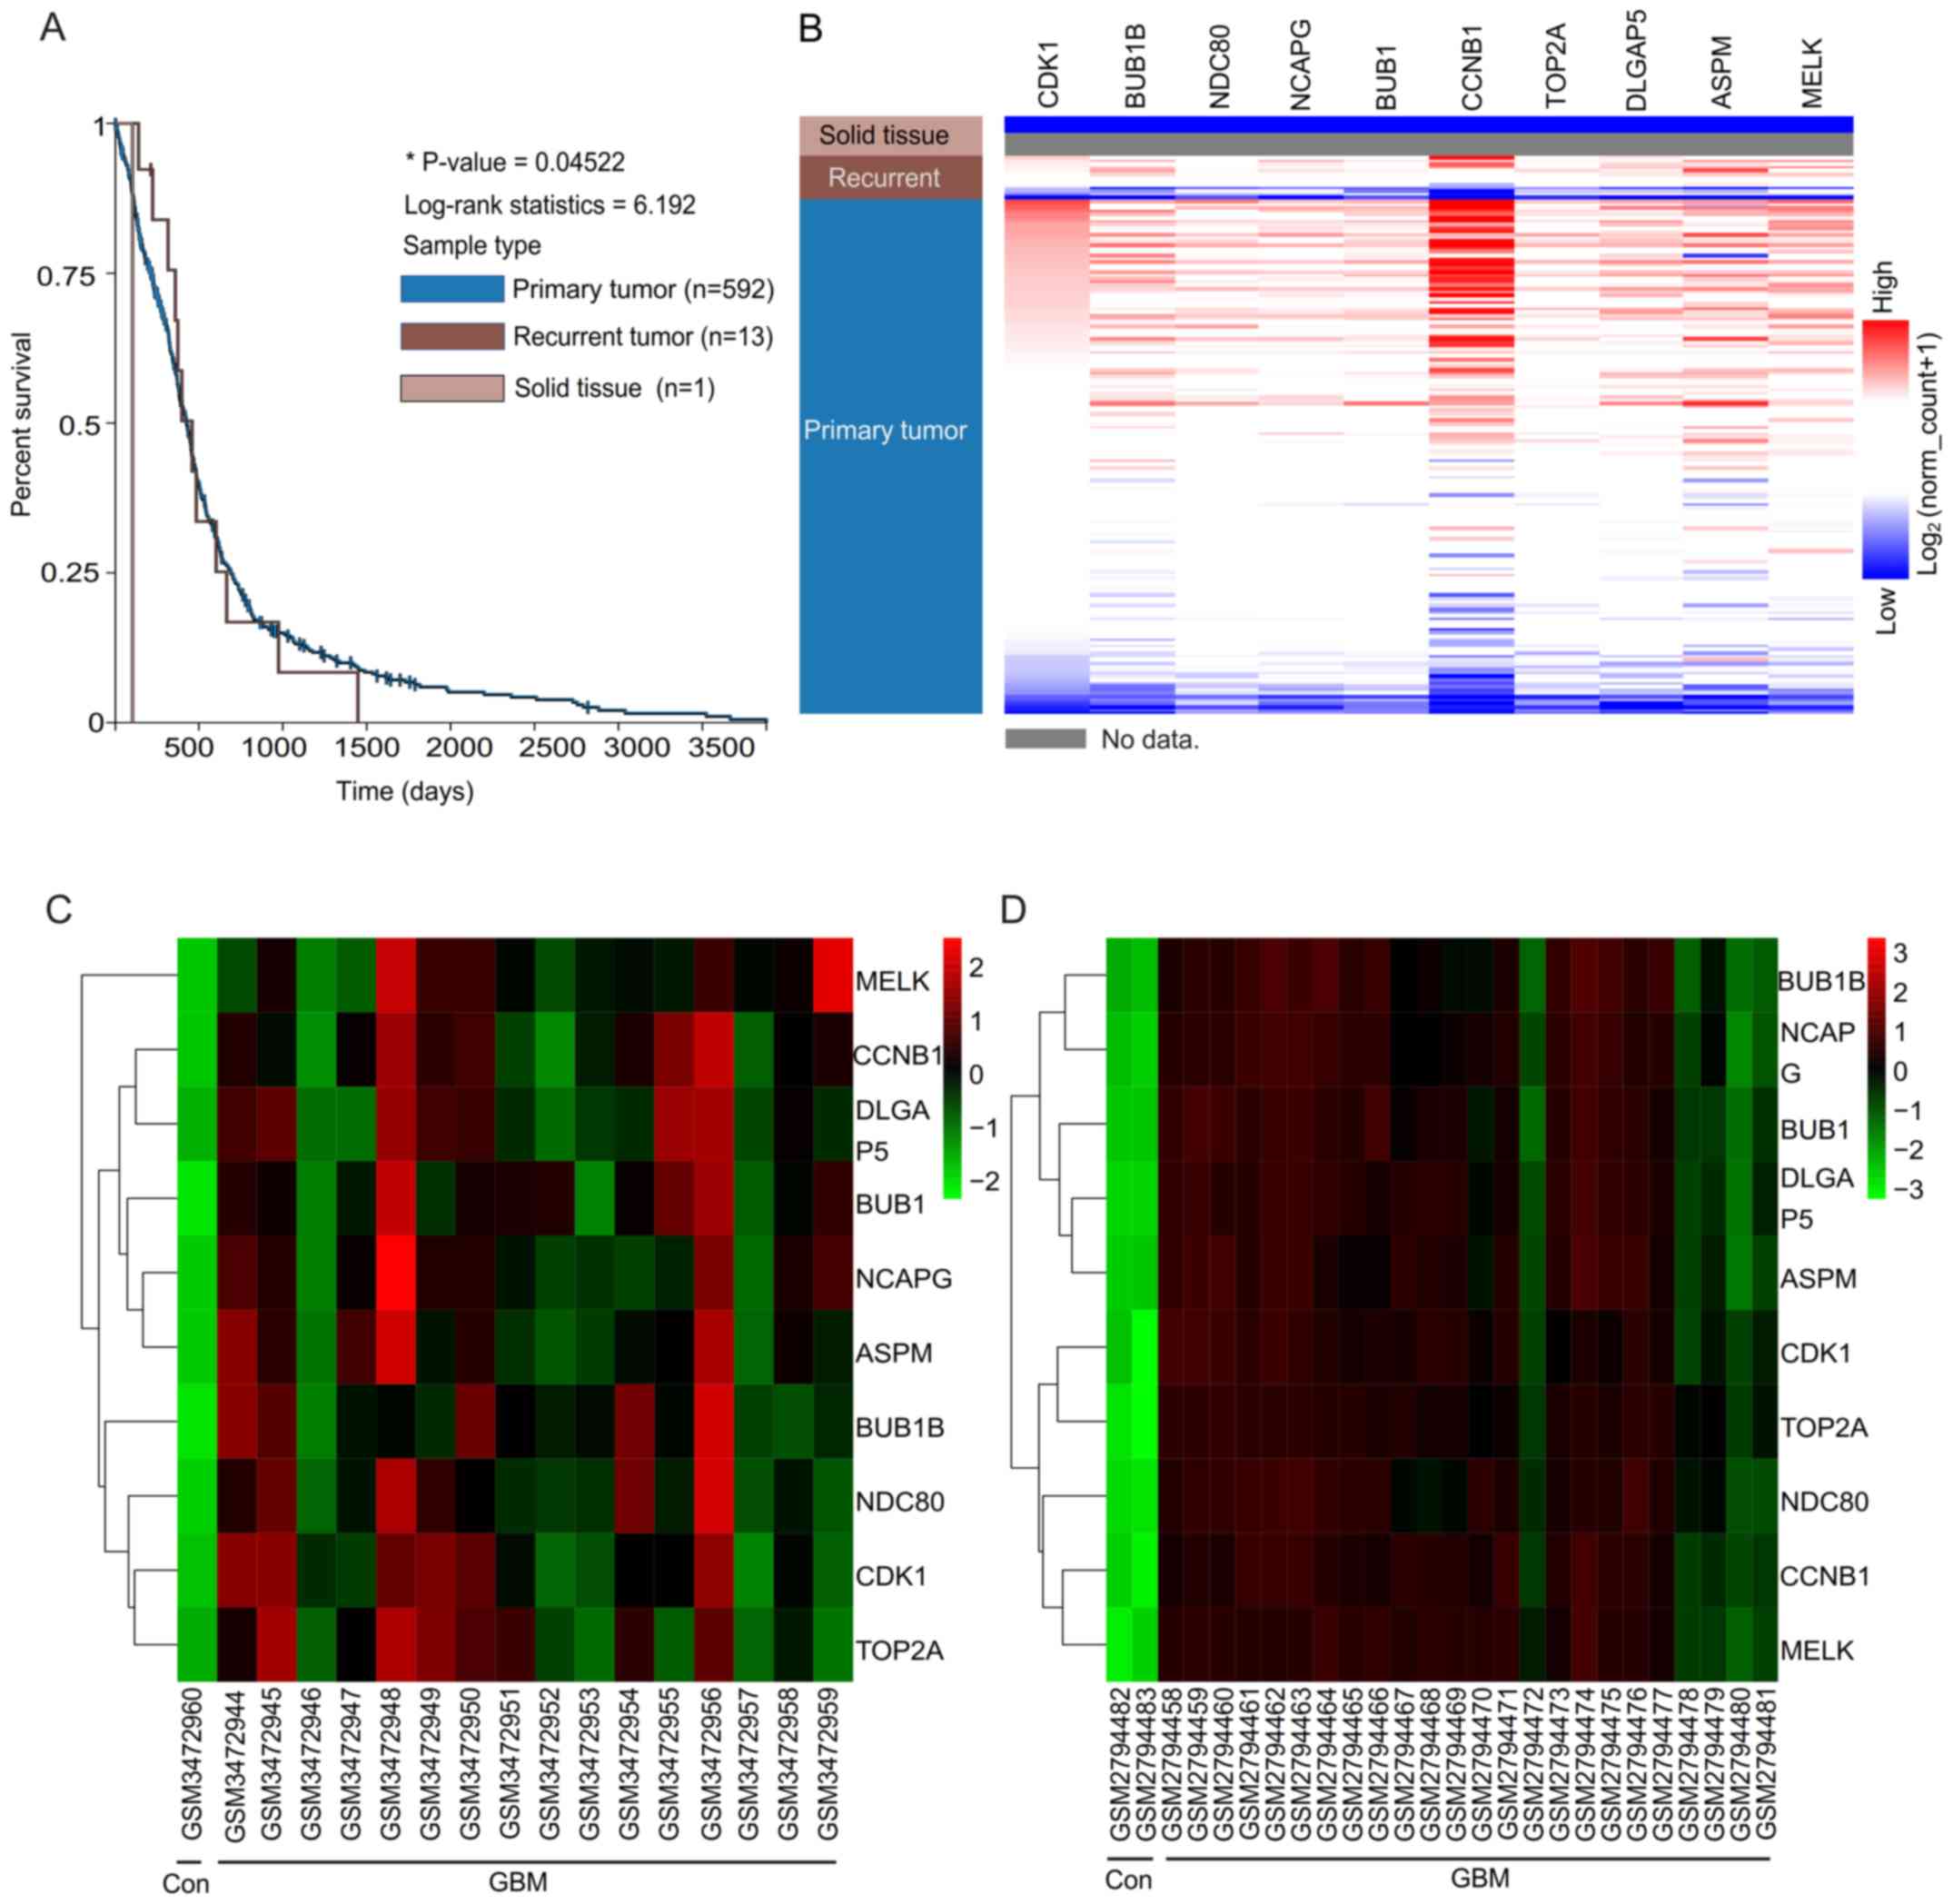
2A-C. Then, a Kaplan-Meier plotter was used to perform the
survival analysis. Patients with recurrent GBM demonstrated worse
overall survival rate (Fig. 3A).
According to the UCSC analysis, hierarchical clustering indicated
that these hub genes may differentiate those individuals with GBM
from the normal individuals (Fig.
3B). The hub genes were identified between non-GBM samples and
GBM samples. It was demonstrated that the expressions of hub genes
were upregulated in the GBM (including recurrent and primary GBM),
when compared with the solid tissue, non-GBM samples (Fig. 3B). Therefore, the expression patterns
of hub genes did not seem to demonstrate any significant difference
between primary tumors and recurrent tumors, although relapsed
tumors often demonstrated higher aggressiveness compared with
primary tumors. The authors suggested that if a differentiation
between the recurrent tumor and the primary tumor is required, the
initiatory groups should be set as recurrent and primary GBM in the
GEO database. Heat maps revealed that the hub genes could
differentiate the GBM samples from the non-GBM samples (Fig. 3C and D). Fig. 3C primarily presents the expression
levels of hub genes in the GSE122498, but it could also demonstrate
that the expression levels of all hub genes in the non-GBM samples
were downregulated when compared with the GBM samples. This study
may further verify the aforementioned differences in the expression
levels of hub genes between non-GBM samples and GBM samples
(Fig. 3D).
| Table III.Summaries for the function of 10 hub
genes. |
Table III.
Summaries for the function of 10 hub
genes.
| No. | Gene symbol | Full name | Function |
|---|
| 1 | CDK1 | Cyclin dependent
kinase 1 | Plays a key role in
the control of the eukaryotic cell cycle by modulating the
centrosome cycle as well as mitotic onset; promotes G2-M
transition, and regulates G1 progress and
G1-S transition via association with multiple interphase
cyclins. |
| 2 | BUB1B | BUB1 mitotic
checkpoint serine/threonine kinase B | Implicated in
triggering apoptosis in polyploid cells that exit aberrantly from
mitotic arrest. May play a role for tumor suppression. |
| 3 | NDC80 | NDC80, kinetochore
complex component | Acts as a component
of the essential kinetochore-associated NDC80 complex, which is
required for chromosome segregation and spindle checkpoint
activity. |
| 4 | NCAPG | Non-SMC condensin I
complex subunit G | Regulatory subunit
of the condensin complex, a complex required for conversion of
interphase chromatin into mitotic-like condense chromo somes. |
| 5 | BUB1 | BUB1 mitotic
checkpoint |
Serine/threonine-protein kinase that
performs 2 crucial functions during mitosis: It is essential for
spindle-assembly checkpoint signaling and for correct chromosome
alignment. |
| 6 | CCNB1 | Cyclin B1 | Essential for the
control of the cell cycle at the G2/M (mitosis)
transition. |
| 7 | TOP2A | Topoisomerase | Diseases associated
with TOP2A include Female Breast Cancer and |
|
|
| (DNA) II alpha | Malignant
Peripheral Nerve Sheath Tumor. Among its related pathways are Cell
Cycle, Mitotic and SUMOylation. |
| 8 | DLGAP5 | DLG associated
protein 5 | Potential cell
cycle regulator that may play a role in carcinogenesis of cancer
cells. Mitotic phosphoprotein regulated by the ubiquitin-
proteasome pathway. |
| 9 | ASPM | Abnormal spindle
microtubule assembly | Involved in mitotic
spindle regulation and coordination of mitotic. processes |
| 10 | MELK | Maternal embryonic
leucine zipper kinase | Diseases associated
with MELK include Uterine Corpus Endometrial Carcinoma. Among its
related pathways are Neuroscience. |
As there were different samples or individuals
between the GSE122498 and GSE104291 databases, the names of the
different samples are presented at the bottom of Fig. 3C and D. In addition, individual
variation exists between the different samples. Therefore, the
clustering patterns between datasets GSE122498 and GSE104291 were
similar, but not identical. The expression profile of hub genes in
human tissue was demonstrated using GEPIA. It was revealed that
these genes in GBM were present in higher levels when compared with
the matched normal samples (Fig.
4).
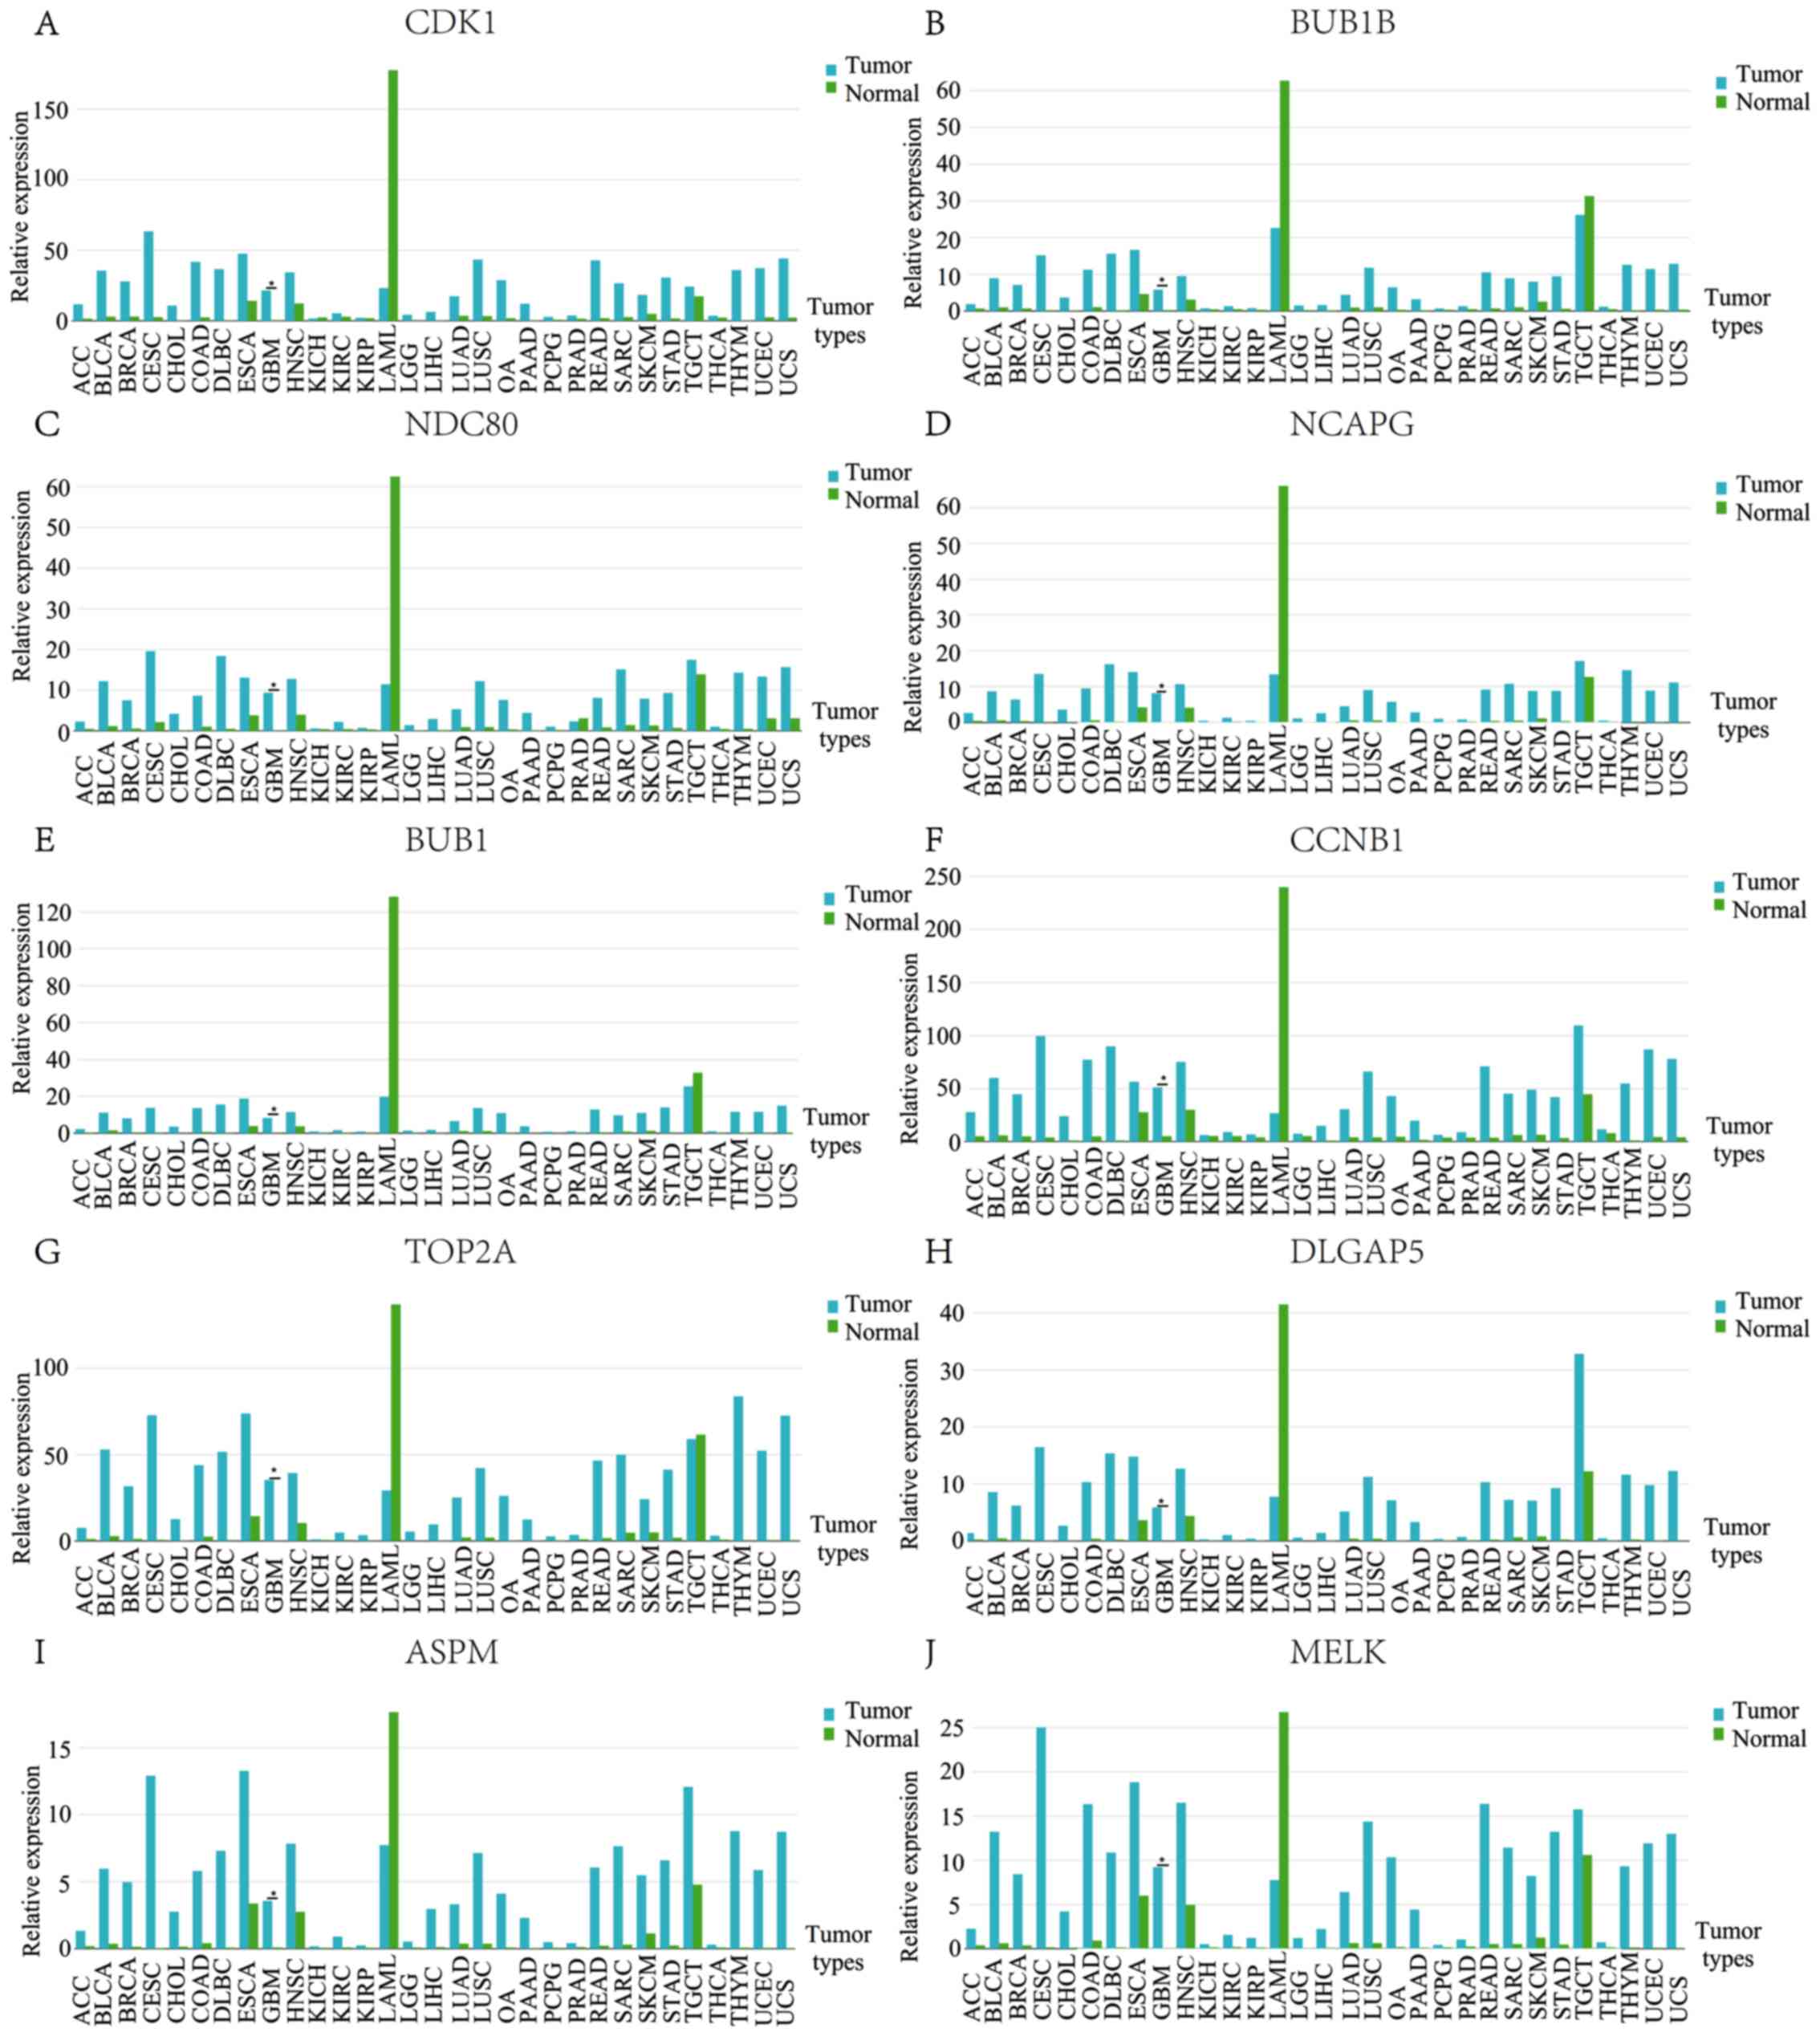 | Figure 4.Expression profiles of 10 hub genes
in human tissue. (A) CDK1, (B) BUB1B, (C)
NDC80, (D) NCAPG, (E) BUB1, (F) CCNB1,
(G) TOP2A, (H) DLGAP5, (I) ASPM, and (J)
MELK. ACC, Adrenocortical carcinoma; BLCA, Bladder
Urothelial Carcinoma; BRCA, Breast invasive carcinoma; CESC,
Cervical squamous cell carcinoma and endocervical adenocarcinoma;
CHOL, Cholangio carcinoma; COAD, Colon adenocarcinoma; DLBC,
Lymphoid Neoplasm Diffuse Large B-cell Lymphoma; ESCA, Esophageal
carcinoma; GBM, Glioblastoma multiforme; HNSC, Head and Neck
squamous cell carcinoma; KICH, Kidney Chromophobe; KIRC, Kidney
renal clear cell carcinoma; KIRP, Kidney renal papillary cell
carcinoma; LAML, Acute Myeloid Leukemia; LGG, Brain Lower Grade
Glioma; LIHC, Liver hepatocellular carcinoma; LUAD, Lung
adenocarcinoma; LUSC, Lung squamous cell carcinoma; OA, Ovarian
serous cystadenocarcinoma; PAAD, Pancreatic adenocarcinoma; PCPG,
Pheochromocytoma and Paraganglioma; PRAD, Prostate adenocarcinoma;
READ, Rectum adenocarcinoma; SARC, Sarcoma; SKCM, Skin Cutaneous
Melanoma; STAD, Stomach adenocarcinoma; TGCT, Testicular Germ Cell
Tumors; THCA, Thyroid carcinoma; THYM, Thymoma; UCEC, Uterine
Corpus Endometrial Carcinoma; UCS, Uterine Carcinosarcoma. |
Discussion
Gliomas are one of the most common primary malignant
tumors of the brain, and there are different histological grades
and classifications for it (19).
According to the WHO, gliomas are classified into four grades:
Grade I–IV; and into three pathological types: Astrocytoma,
oligodendroglioma and mixed (astrocytoma and oligodendroglioma)
gliomas (19). GBM belongs to grade
IV glioma with high fatality rate and different severity and
histological subtypes (36,37). It is not sensitive to radiotherapy or
chemotherapy, and is prone to malignant progression; it lacks clear
molecular classification, therapeutic targets and associated
targeted drugs (19). The standard
treatment for GBM is surgery, followed by radiotherapy, or
radiotherapy combined with chemotherapy. If surgery is not
practical, radiotherapy or radiotherapy/chemotherapy could be given
(38). GBM is capable of extensively
invading and infiltrating the normal surrounding brain tissue,
making it impossible to completely remove the tumor tissue
(5). Following surgery, radiotherapy
could kill the remaining tumor cells and prevent recurrence, but it
can damage a large number of normal brain cells (38). Even with the best treatment, the
recurrence rate of GBM remains high, and was estimated to be
3.20/100,000 worldwide in 2018 (39). Therefore, research into an accurate
understanding of the underlying molecular mechanism and reliable
therapeutic targets of GBM has generated wide concern.
With the progress of gene-sequencing technology, a
large number of DEGs have been identified in a number of other
types of tumor (such as gastric, breast and colorectal cancer)
(21,22). DEGs may serve a variety of functions
in the occurrence and development of diseases, such as
transcription, post-transcriptional processing and the regulation
of protein expression. The present study aimed to identify the DEGs
that play a key role in the occurrence and malignant process of
gliomas and that may serve as molecular markers and therapeutic
targets for GBM.
CDK1 is a cell cycle regulatory gene
(40). According to the results from
the present study, the expression levels of CDK1 in GBM
tissues were significantly increased compared with normal tissues.
The occurrence of tumors is a complex process with multiple damages
to normal cell genomes (41). These
damages include not only oncogene activation, but also inactivation
or deletion of tumor suppressor gene (42). A previous study has revealed that the
functional effects of polygene would eventually aggregate into the
cell cycle mechanism (43). Among
them, the two key checkpoints of the G1/S and
G2/M phases of the cell cycle are the primary causes of
malignant proliferation (44).
However, a compound formed by combining CDK1 with Cyclin
B1, the mitotic promoting factor, plays an important role in
the G2/M checkpoint of the cell cycle (45). A previous study indicated that the
positive degree of CDK1 expression could reflect the
malignant degree of tongue squamous cell carcinoma (46). This in turn suggests that CDK1
overexpression may induce genetic mutations and chromosome
structural abnormalities, leading to failure of checkpoint
regulation of the cell cycle G2/M, which accelerates the
progression of the cell cycle and excessive cell proliferation,
resulting in tumor development (46). Overexpression of CDK1 was also
observed in pancreatic cancer and lung cancer (47,48).
Therefore, CDK1 has been indicated to play an important role
in tumor occurrence as it may be associated with the occurrence and
development of GBM, and the result may provide potential novel
insights for further research into the association between GBM and
CDK1 expression.
According to the results of the present study,
compared with normal tissues, the expression of BUB1B in GBM
tissues increased significantly. Mitosis is the process by which a
eukaryotic cell divides into two identical cells, and it plays a
crucial role in the evolution and homeostasis of multicellular
organisms (49). The mitotic
checkpoint is the core regulator during this process, acting as a
signal-regulating mechanism that prevents the cell from entering
the late stage of mitosis before all chromosomes adhere to the
spindle (50). Abnormalities in
mitotic checkpoints have been observed in numerous different types
of tumor (such as gastric, breast and colorectal cancer), and one
of the consequences of abnormalities of mitotic checkpoints is
chromosomal instability that make cells more susceptible to
malignancy (51). BUB1B is an
important constituent protein of the mitotic checkpoint, and is a
multidomain protein kinase that responds to centromere tension
(52,53). Studies have demonstrated that
BUB1B is overexpressed in various different types of tumor,
such as renal and breast carcinoma, and its mutation and
overexpression are associated with chromosomal instability
(54–56). Therefore, further investigation on
BUB1B may lead to a greater understanding of its importance
in the GBM process, and novel ideas for investigating its molecular
mechanisms and establishing more effective treatments.
The NDC80 complex is located on the outer
layer of the kinetochore, linking the kinetochore and microtubules
(57). It is involved in regulating
the normal separation of chromosomes in mitosis, and is also
crucial for spindle assembly checkpoints (58). NDC80 is the main component of
the NDC80 compound and is highly expressed in actively
dividing cells, such as tumor cells. NDC80 plays an
important role in normal mitosis, the assembly of kinetochore, the
spindle checkpoint, maintenance of chromosomal stability and the
occurrence and development of tumors (59,60).
According to the results from the present study, the expression
levels of NDC80 in GBM tissues were significantly increased
compared with normal tissues. Another study indicated that
overexpression of NDC80 could result in sustained
hyperactivation of mitotic checkpoints and therefore induce tumor
formation (61). The expression
levels of Mad2 were also significantly increased in mice
with high expression of NDC80, and a previous report has
demonstrated that overexpression of the Mad2 gene would
cause hyperactivation of mitotic checkpoints, resulting in the
production of aneuploid chromosomes, which induces tumor formation
(62). In summary, the present study
revealed that NDC80 is highly expressed in GBM, and high
expression levels of NDC80 may play an important role in the
occurrence and development of GBM. Studies on the molecular
mechanism of NDC80 in the occurrence and development of GBM
are useful for investigating the role of NDC80 as a target
of intervention for GBM treatment. Future studies could observe
tumor changes in a GBM animal model following knockdown of
BUB1B (or NDC80). Upregulation of BUB1B
expression (or NDC80) could then be observed and variations
in the tumor could be recorded. If the knockdown of BUB1B
(or NDC80) could decrease the size of GBM and upregulation
of BUB1B (or NDC80) could deteriorate the GBM, then
it could be suggested that a high expression level of BUB1B
(or NDC80) is a risk factor for GBM development. Clinical
trials could then be performed in order to verify the curative
effect of gene therapy via downregulation of BUB1B (or
NDC80) in patients with GBM.
The present study, however, has certain limitations.
The screening of 10 key genes is based on bioinformatics analysis,
which is an observational study that could only provide clues for
further studies on the mechanisms underlying the occurrence and
development of GBM. The screened target genes were validated by
sequencing databases, such as The Cancer Genome Atlas and GEPIA. In
addition, clinical samples need to be collected in order to verify
the aforementioned conclusions. However, the present study only
provides a potential theory or idea for the mechanism and/or
development of a treatment strategy for GBM. Finally, the sample
size of this research is small, and it maybe cause the false
positive result. Further investigation on the association between
mutations in IDHs or the methylation status of the MGMT promoter
and the expression levels of hub genes identified in the present
study is required.
In conclusion, the present study aimed to identify
differentially expressed genes that may be present in the
occurrence or development of GBM. Finally, 341 DEGs and 10 hub
genes were identified between GBM samples and normal samples, which
could be used as diagnostic and therapeutic biomarkers for GBM.
Acknowledgements
The authors would like to acknowledge Dr Ya-lun Dai
from the Epidemiology Department of the Beijing Hospital, National
Center of Gerontology, for her statistical assistance and
suggestions during the submitting process.
Funding
This study was funded by the Capital Characteristic
Clinical Application Research. (grant. no. Z161100000516236).
Availability of data and materials
The datasets used and/or analyzed during the current
study are available from the corresponding author on reasonable
request.
Authors' contributions
YFZ and LBM performed the experiment, and were major
contributors in writing and submitting the manuscript. XY made
substantial contributions to research conception and also drafted
the research protocol. ZKH made substantial contributions to
analysis and interpretation of data. MJS made substantial
contributions to research conception and analysis and
interpretation of data. In addition MJS was involved in drafting
the manuscript. CHH and DYW were responsible for analyzing the gene
expression data and generating the figures. All authors read and
approved the final manuscript.
Ethics approval and consent to
participate
Not applicable.
Patient consent for publication
Not applicable.
Competing interests
The authors declare that they have no competing
interests.
Glossary
Abbreviations
Abbreviations:
|
GBM
|
glioblastoma
|
|
DAVID
|
Database for Annotation, Visualization
and Integrated Discovery
|
|
STRING
|
Search Tool for the Retrieval of
Interacting Genes
|
|
GEPIA
|
Gene Expression Profiling Interactive
Analysis
|
|
DEGs
|
differentially expressed genes
|
|
WHO
|
World Health Organization
|
|
IDH
|
isocitrate dehydrogenase
|
|
MGMT
|
methylguanine DNA
methyltransferase
|
|
KEGG
|
Kyoto Encyclopedia of Genes and
Genomes
|
|
GO
|
Gene Ontology
|
|
PPI
|
protein-protein interaction
|
|
GEO
|
Gene Expression Omnibus
|
|
BP
|
biological process
|
|
CC
|
cellular component
|
|
MF
|
molecular function
|
|
MCODE
|
Molecular Complex Detection
|
|
UCSC
|
University of California Santa
Cruz
|
References
|
1
|
Laug D, Glasgow SM and Deneen B: A glial
blueprint for gliomagenesis. Nat Rev Neurosci. 19:393–403. 2018.
View Article : Google Scholar : PubMed/NCBI
|
|
2
|
Amirian ES, Armstrong GN, Zhou R, Lau CC,
Claus EB, Barnholtz-Sloan JS, Il'yasova D, Schildkraut J, Ali-Osman
F, Sadetzki S, et al: The Glioma international case-control study:
A report from the genetic epidemiology of glioma international
consortium. Am J Epidemiol. 183:85–91. 2016.PubMed/NCBI
|
|
3
|
Benenemissi IH, Sifi K, Sahli LK, Semmam
O, Abadi N and Satta D: Angiotensin-converting enzyme
insertion/deletion gene polymorphisms and the risk of glioma in an
Algerian population. Pan Afr Med J. 32:1972019. View Article : Google Scholar : PubMed/NCBI
|
|
4
|
Hempel JM, Schittenhelm J, Bisdas S,
Brendle C, Bender B, Bier G, Skardelly M, Tabatabai G, Castaneda
Vega S, Ernemann U and Klose U: In vivo assessment of tumor
heterogeneity in WHO 2016 glioma grades using diffusion kurtosis
imaging: Diagnostic performance and improvement of feasibility in
routine clinical practice. J Neuroradiol. 45:32–40. 2018.
View Article : Google Scholar : PubMed/NCBI
|
|
5
|
Cancer Genome Atlas Research Networ, ;
Brat DJ, Verhaak RG, Aldape KD, Yung WK, Salama SR, Cooper LA,
Rheinbay E, Miller CR, Vitucci M, et al: Comprehensive, integrative
genomic analysis of diffuse Lower-Grade gliomas. N Engl J Med.
372:2481–2498. 2015. View Article : Google Scholar : PubMed/NCBI
|
|
6
|
Schmid RS, Simon JM, Vitucci M, McNeill
RS, Bash RE, Werneke AM, Huey L, White KK, Ewend MG, Wu J and
Miller CR: Core pathway mutations induce de-differentiation of
murine astrocytes into glioblastoma stem cells that are sensitive
to radiation but resistant to temozolomide. Neuro Oncol.
18:962–973. 2016. View Article : Google Scholar : PubMed/NCBI
|
|
7
|
Fischer U, Struss AK, Hemmer D, Michel A,
Henn W, Steudel WI and Meese E: PHF3 expression is frequently
reduced in glioma. Cytogenet Cell Genet. 94:131–136. 2001.
View Article : Google Scholar : PubMed/NCBI
|
|
8
|
Lewis PW, Muller MM, Koletsky MS, Cordero
F, Lin S, Banaszynski LA, Garcia BA, Muir TW, Becher OJ and Allis
CD: Inhibition of PRC2 activity by a gain-of-function H3 mutation
found in pediatric glioblastoma. Science. 340:857–861. 2013.
View Article : Google Scholar : PubMed/NCBI
|
|
9
|
Schwartzentruber J, Korshunov A, Liu XY,
Jones DT, Pfaff E, Jacob K, Sturm D, Fontebasso AM, Quang DA,
Tönjes M, et al: Driver mutations in histone H3.3 and chromatin
remodelling genes in paediatric glioblastoma. Nature. 482:226–231.
2012. View Article : Google Scholar : PubMed/NCBI
|
|
10
|
Ceccon G, Werner JM, Dunkl V, Tscherpel C,
Stoffels G, Brunn A, Deckert M, Fink GR and Galldiks N: Dabrafenib
treatment in a patient with an Epithelioid Glioblastoma and BRAF
V600E Mutation. Int J Mol Sci. 19:E10902018. View Article : Google Scholar : PubMed/NCBI
|
|
11
|
Wang Z, Bao Z, Yan W, You G, Wang Y, Li X
and Zhang W: Isocitrate dehydrogenase 1 (IDH1) mutation-specific
microRNA signature predicts favorable prognosis in glioblastoma
patients with IDH1 wild type. J Exp Clin Cancer Res. 32:592013.
View Article : Google Scholar : PubMed/NCBI
|
|
12
|
Srinivasan S, Patric IR and Somasundaram
K: A ten-microRNA expression signature predicts survival in
glioblastoma. PLoS One. 6:e174382011. View Article : Google Scholar : PubMed/NCBI
|
|
13
|
Wang W, Zhang L, Wang Z, Yang F, Wang H,
Liang T, Wu F, Lan Q, Wang J and Zhao J: A three-gene signature for
prognosis in patients with MGMT promoter-methylated glioblastoma.
Oncotarget. 7:69991–69999. 2016.PubMed/NCBI
|
|
14
|
Karsy M, Guan J, Cohen AL, Jensen RL and
Colman H: New molecular considerations for glioma: IDH, ATRX, BRAF,
TERT, H3 K27M. Curr Neurol Neurosci Rep. 17:192017. View Article : Google Scholar : PubMed/NCBI
|
|
15
|
Solanki C, Sadana D, Arimappamagan A, Rao
KV, Rajeswaran J, Subbakrishna DK, Santosh V and Pandey P:
Impairments in quality of life and cognitive functions in long-term
survivors of glioblastoma. J Neurosci Rural Pract. 8:228–235. 2017.
View Article : Google Scholar : PubMed/NCBI
|
|
16
|
Arimappamagan A, Somasundaram K,
Thennarasu K, Peddagangannagari S, Srinivasan H, Shailaja BC,
Samuel C, Patric IR, Shukla S, Thota B, et al: A fourteen gene GBM
prognostic signature identifies association of immune response
pathway and mesenchymal subtype with high risk group. PLoS One.
8:e620422013. View Article : Google Scholar : PubMed/NCBI
|
|
17
|
Vastrad B, Vastrad C, Godavarthi A and
Chandrashekar R: Molecular mechanisms underlying gliomas and
glioblastoma pathogenesis revealed by bioinformatics analysis of
microarray data. Med Oncol. 34:1822017. View Article : Google Scholar : PubMed/NCBI
|
|
18
|
Zhong S, Wu B, Dong X, Han Y, Jiang S,
Zhang Y, Bai Y, Luo SX, Chen Y, Zhang H and Zhao G: Identification
of driver genes and key pathways of glioblastoma shows JNJ-7706621
as a novel antiglioblastoma drug. World Neurosurg. 109:e329–e342.
2018. View Article : Google Scholar : PubMed/NCBI
|
|
19
|
Aldape K, Zadeh G, Mansouri S,
Reifenberger G and von Deimling A: Glioblastoma: Pathology,
molecular mechanisms and markers. Acta Neuropathol. 129:829–848.
2015. View Article : Google Scholar : PubMed/NCBI
|
|
20
|
Poon CC, Sarkar S, Yong VW and Kelly JJP:
Glioblastoma-associated microglia and macrophages: Targets for
therapies to improve prognosis. Brain. 140:1548–1560. 2017.
View Article : Google Scholar : PubMed/NCBI
|
|
21
|
Kim SM, Kwon IJ, Myoung H, Lee JH and Lee
SK: Identification of human papillomavirus (HPV) subtype in oral
cancer patients through microarray technology. Eur Arch
Otorhinolaryngol. 275:535–543. 2018. View Article : Google Scholar : PubMed/NCBI
|
|
22
|
Cheng Y, Ping J and Chen J: Identification
of potential gene network associated with HCV-Related
hepatocellular carcinoma using microarray analysis. Pathol Oncol
Res. 24:507–514. 2018. View Article : Google Scholar : PubMed/NCBI
|
|
23
|
Edgar R, Domrachev M and Lash AE: Gene
expression omnibus: NCBI gene expression and hybridization array
data repository. Nucleic Acids Res. 30:207–210. 2002. View Article : Google Scholar : PubMed/NCBI
|
|
24
|
Hilf N, Kuttruff-Coqui S, Frenzel K, Bukur
V, Stevanovic S, Gouttefangeas C, Platten M, Tabatabai G, Dutoit V,
van der Burg SH, et al: Actively personalized vaccination trial for
newly diagnosed glioblastoma. Nature. 565:240–245. 2019. View Article : Google Scholar : PubMed/NCBI
|
|
25
|
Bady P, Diserens AC, Castella V, Kalt S,
Heinimann K, Hamou MF, Delorenzi M and Hegi ME: DNA fingerprinting
of glioma cell lines and considerations on similarity measurements.
Neuro Oncol. 14:701–711. 2012. View Article : Google Scholar : PubMed/NCBI
|
|
26
|
Barrett T, Wilhite SE, Ledoux P,
Evangelista C, Kim IF, Tomashevsky M, Marshall KA, Phillippy KH,
Sherman PM, Holko M, et al: NCBI GEO: Archive for functional
genomics data sets-update. Nucleic Acids Res 41 (Database Issue).
D991–D995. 2013.
|
|
27
|
Solari A and Goeman JJ: Minimally adaptive
BH: A tiny but uniform improvement of the procedure of Benjamini
and Hochberg. Biom J. 59:776–780. 2017. View Article : Google Scholar : PubMed/NCBI
|
|
28
|
Huang DW, Sherman BT, Tan Q, Collins JR,
Alvord WG, Roayaei J, Stephens R, Baseler MW, Lane HC and Lempicki
RA: The DAVID gene functional classification tool: A novel
biological module-centric algorithm to functionally analyze large
gene lists. Genome Biol. 8:R1832007. View Article : Google Scholar : PubMed/NCBI
|
|
29
|
Ashburner M, Ball CA, Blake JA, Botstein
D, Butler H, Cherry JM, Davis AP, Dolinski K, Dwight SS, Eppig JT,
et al: Gene ontology: Tool for the unification of biology. The Gene
Ontology Consortium. Nat Genet. 25:25–29. 2000. View Article : Google Scholar : PubMed/NCBI
|
|
30
|
Kanehisa M: The KEGG database. Novartis
Found Symp. 247:91–103, 119-128, 244–252. 2002. View Article : Google Scholar : PubMed/NCBI
|
|
31
|
Szklarczyk D, Franceschini A, Wyder S,
Forslund K, Heller D, Huerta-Cepas J, Simonovic M, Roth A, Santos
A, Tsafou KP, et al: STRING v10: Protein-protein interaction
networks, integrated over the tree of life. Nucleic Acids Res.
43:D447–D452. 2015. View Article : Google Scholar : PubMed/NCBI
|
|
32
|
Smoot ME, Ono K, Ruscheinski J, Wang PL
and Ideker T: Cytoscape 2.8: New features for data integration and
network visualization. Bioinformatics. 27:431–432. 2011. View Article : Google Scholar : PubMed/NCBI
|
|
33
|
Bader GD and Hogue CW: An automated method
for finding molecular complexes in large protein interaction
networks. BMC Bioinformatics. 4:22003. View Article : Google Scholar : PubMed/NCBI
|
|
34
|
Cerami E, Gao J, Dogrusoz U, Gross BE,
Sumer SO, Aksoy BA, Jacobsen A, Byrne CJ, Heuer ML, Larsson E, et
al: The cBio cancer genomics portal: An open platform for exploring
multidimensional cancer genomics data. Cancer Discov. 2:401–404.
2012. View Article : Google Scholar : PubMed/NCBI
|
|
35
|
Maere S, Heymans K and Kuiper M: BiNGO: A
Cytoscape plugin to assess overrepresentation of gene ontology
categories in biological networks. Bioinformatics. 21:3448–3449.
2005. View Article : Google Scholar : PubMed/NCBI
|
|
36
|
Bian EB, Li J, Xie YS, Zong G, Li J and
Zhao B: LncRNAs: New players in gliomas, with special emphasis on
the interaction of lncRNAs With EZH2. J Cell Physiol. 230:496–503.
2015. View Article : Google Scholar : PubMed/NCBI
|
|
37
|
Ostrom QT, Bauchet L, Davis FG, Deltour I,
Fisher JL, Langer CE, Pekmezci M, Schwartzbaum JA, Turner MC, Walsh
KM, et al: The epidemiology of glioma in adults: A ‘state of the
science’ review. Neuro Oncol. 16:896–913. 2014. View Article : Google Scholar : PubMed/NCBI
|
|
38
|
Perry JR, Laperriere N, O'Callaghan CJ,
Brandes AA, Menten J, Phillips C, Fay M, Nishikawa R, Cairncross
JG, Roa W, et al: Short-course radiation plus Temozolomide in
elderly patients with Glioblastoma. N Engl J Med. 376:1027–1037.
2017. View Article : Google Scholar : PubMed/NCBI
|
|
39
|
Peñaranda Fajardo NM, Meijer C and Kruyt
FA: The endoplasmic reticulum stress/unfolded protein response in
gliomagenesis, tumor progression and as a therapeutic target in
glioblastoma. Biochem Pharmacol. 118:1–8. 2016. View Article : Google Scholar : PubMed/NCBI
|
|
40
|
Sacristan MP, Ovejero S and Bueno A: Human
Cdc14A becomes a cell cycle gene in controlling Cdk1 activity at
the G2/M transition. Cell Cycle. 10:387–391. 2011.
View Article : Google Scholar : PubMed/NCBI
|
|
41
|
Glousker G, Touzot F, Revy P, Tzfati Y and
Savage SA: Unraveling the pathogenesis of Hoyeraal-Hreidarsson
syndrome, a complex telomere biology disorder. Br J Haematol.
170:457–471. 2015. View Article : Google Scholar : PubMed/NCBI
|
|
42
|
Rooj AK, Mineo M and Godlewski J: MicroRNA
and extracellular vesicles in glioblastoma: Small but powerful.
Brain Tumor Pathol. 33:77–88. 2016. View Article : Google Scholar : PubMed/NCBI
|
|
43
|
Liau BB, Sievers C, Donohue LK, Gillespie
SM, Flavahan WA, Miller TE, Venteicher AS, Hebert CH, Carey CD,
Rodig SJ, et al: Adaptive chromatin remodeling drives glioblastoma
stem cell plasticity and drug tolerance. Cell Stem Cell.
20:233–246.e7. 2017. View Article : Google Scholar : PubMed/NCBI
|
|
44
|
Yamashita T, Nishimura K, Saiki R,
Okudaira H, Tome M, Higashi K, Nakamura M, Terui Y, Fujiwara K,
Kashiwagi K and Igarashi K: Role of polyamines at the G1/S boundary
and G2/M phase of the cell cycle. Int J Biochem Cell Biol.
45:1042–1050. 2013. View Article : Google Scholar : PubMed/NCBI
|
|
45
|
Castedo M, Perfettini JL, Roumier T,
Yakushijin K, Horne D, Medema R and Kroemer G: The cell cycle
checkpoint kinase Chk2 is a negative regulator of mitotic
catastrophe. Oncogene. 23:4353–4361. 2004. View Article : Google Scholar : PubMed/NCBI
|
|
46
|
Wada S, Yue L and Furuta I: Prognostic
significance of p34cdc2 expression in tongue squamous cell
carcinoma. Oral Oncol. 40:164–169. 2004. View Article : Google Scholar : PubMed/NCBI
|
|
47
|
Zhang R, Loganathan S, Humphreys I and
Srivastava SK: Benzyl isothiocyanate-induced DNA damage causes G2/M
cell cycle arrest and apoptosis in human pancreatic cancer cells. J
Nutr. 136:2728–2734. 2006. View Article : Google Scholar : PubMed/NCBI
|
|
48
|
Soria JC, Jang SJ, Khuri FR, Hassan K, Liu
D, Hong WK and Mao L: Overexpression of cyclin B1 in early-stage
non-small cell lung cancer and its clinical implication. Cancer
Res. 60:4000–4004. 2000.PubMed/NCBI
|
|
49
|
Girke P and Seufert W: Compositional
reorganization of the nucleolus in budding yeast mitosis. Mol Biol
Cell. 30:591–606. 2019. View Article : Google Scholar : PubMed/NCBI
|
|
50
|
Guerrero PA, Tchaicha JH, Chen Z, Morales
JE, McCarty N, Wang Q, Sulman EP, Fuller G, Lang FF, Rao G and
McCarty JH: Glioblastoma stem cells exploit the αvβ8 integrin-TGFβ1
signaling axis to drive tumor initiation and progression. Oncogene.
36:6568–6580. 2017. View Article : Google Scholar : PubMed/NCBI
|
|
51
|
Shing JC, Choi JW, Chapman R, Schroeder
MA, Sarkaria JN, Fauq A and Bram RJ: A novel synthetic 1,3-phenyl
bis-thiourea compound targets microtubule polymerization to cause
cancer cell death. Cancer Biol Ther. 15:895–905. 2014. View Article : Google Scholar : PubMed/NCBI
|
|
52
|
Nagarajan P, Curry JL, Ning J, Piao J,
Torres-Cabala CA, Aung PP, Ivan D, Ross MI, Levenback CF, Frumovitz
M, et al: Tumor thickness and mitotic rate robustly predict
melanoma-specific survival in patients with primary vulvar
melanoma: A retrospective review of 100 cases. Clin Cancer Res.
23:2093–2104. 2017. View Article : Google Scholar : PubMed/NCBI
|
|
53
|
Jun DY, Lee JY, Park HS, Lee YH and Kim
YH: Tumor suppressor protein p53-mediated repression of human
mitotic centromere-associated kinesin gene expression is exerted
via down-regulation of Sp1 level. PLoS One. 12:e01896982017.
View Article : Google Scholar : PubMed/NCBI
|
|
54
|
Pinto M, Vieira J, Ribeiro FR, Soares MJ,
Henrique R, Oliveira J, Jerónimo C and Teixeira MR: Overexpression
of the mitotic checkpoint genes BUB1 and BUBR1 is associated with
genomic complexity in clear cell kidney carcinomas. Cell Oncol.
30:389–395. 2008.PubMed/NCBI
|
|
55
|
Myrie KA, Percy MJ, Azim JN, Neeley CK and
Petty EM: Mutation and expression analysis of human BUB1 and BUB1B
in aneuploid breast cancer cell lines. Cancer Lett. 152:193–199.
2000. View Article : Google Scholar : PubMed/NCBI
|
|
56
|
Scintu M, Vitale R, Prencipe M, Gallo AP,
Bonghi L, Valori VM, Maiello E, Rinaldi M, Signori E, Rabitti C, et
al: Genomic instability and increased expression of BUB1B and
MAD2L1 genes in ductal breast carcinoma. Cancer Lett. 254:298–307.
2007. View Article : Google Scholar : PubMed/NCBI
|
|
57
|
Herman JA, Toledo CM, Olson JM, DeLuca JG
and Paddison PJ: Molecular pathways: Regulation and targeting of
kinetochore-microtubule attachment in cancer. Clin Cancer Res.
21:233–239. 2015. View Article : Google Scholar : PubMed/NCBI
|
|
58
|
DeLuca JG, Dong Y, Hergert P, Strauss J,
Hickey JM, Salmon ED and McEwen BF: Hec1 and nuf2 are core
components of the kinetochore outer plate essential for organizing
microtubule attachment sites. Mol Biol Cell. 16:519–531. 2005.
View Article : Google Scholar : PubMed/NCBI
|
|
59
|
Iemura K and Tanaka K: Chromokinesin Kid
and kinetochore kinesin CENP-E differentially support chromosome
congression without end-on attachment to microtubules. Nat Commun.
6:64472015. View Article : Google Scholar : PubMed/NCBI
|
|
60
|
Shrestha RL and Draviam VM: Lateral to
end-on conversion of chromosome-microtubule attachment requires
kinesins CENP-E and MCAK. Curr Biol. 23:1514–1526. 2013. View Article : Google Scholar : PubMed/NCBI
|
|
61
|
Diaz-Rodriguez E, Sotillo R, Schvartzman
JM and Benezra R: Hec1 overexpression hyperactivates the mitotic
checkpoint and induces tumor formation in vivo. Proc Natl Acad Sci
USA. 105:16719–16724. 2008. View Article : Google Scholar : PubMed/NCBI
|
|
62
|
Sotillo R, Hernando E, Diaz-Rodriguez E,
Teruya-Feldstein J, Cordón-Cardo C, Lowe SW and Benezra R: Mad2
overexpression promotes aneuploidy and tumorigenesis in mice.
Cancer Cell. 11:9–23. 2007. View Article : Google Scholar : PubMed/NCBI
|