Introduction
The 5-year mortality rate of liver cancer ranks
third among all types of tumors, and the incidence in female and
male patients under the age of 40 years has been increasing
annually in recent years (1).
Hepatocellular carcinoma (HCC) is the most common primary malignant
liver tumor, accounting for approximately 70–85% of all cases of
primary liver cancer (2). HCC
metastasis and relapse commonly occur, and lack of effective
therapeutic strategies is the biggest obstacle to its treatment and
favourable prognosis (3). Therefore,
it is urgent to identify prognostic biomarkers or potential
therapeutic targets to improve the survival rate of HCC
patients.
Currently, there are two conventional research
strategies of screening for biomarkers or potential therapeutic
targets of liver cancer. The first strategy is to perform
confirmatory tests on previously reported proteins that influence
cell proliferation and prolong cell growth cycle in HCC cell line.
For instance, it has been reported that transforming growth
factor-α/epidermal growth factor receptor aberrant expression is
associated with the progression of liver tumors (4). The second strategy involves screening
therapeutic targets by analysing copy number changes and gene
expression profiles in limited tumor tissue samples collected at
medical institutions. For instance, it has been reported that
overexpression of vascular endothelial growth factor A in HCC
suggests a non-cell-autonomous mechanism of oncogene activation
(5). However, both of these
strategies have limitations. The first strategy is the
reconfirmation of the reported proteins and studies using the
second screening strategy will be influenced by the lack of sample
capacity.
The Cancer Genome Atlas (TCGA) database contains a
large number of gene microarray data collected from cancer
patients. Several previous studies have used bioinformatics
analysis of such gene microarray data in order to identify key
genes in HCC (6–8). In contrast to these earlier studies,
the present study focuses on analysing the protein-protein
interaction (PPI) networks using a number of different topological
analysis methods to identify the hub genes. The use of different
topological analysis methods can provide more biological
information due to different prominent topological features or
scoring strategies.
In the current study, based on large-scale medical
data on HCC extracted from the TCGA database, genome wide data were
obtained by bioinformatics analysis, and then hub genes were
identified among differentially expressed genes (DEGs) and PPI
networks (9). Next, hub genes
associated with clinical prognosis and pathological parameters of
patients were screened. Furthermore, Gene Set Enrichment Analysis
(GSEA) was used to investigate the Kyoto Encyclopaedia of Genes and
Genomes (KEGG) pathways associated with the high CTAG2
expression group, which may potentially provide hints for future
research into the molecular mechanisms underlying HCC. Overall, the
aim of the present study was to establish an effective method for
screening potential therapeutic targets.
Materials and methods
Data processing
RNA sequencing (RNA-Seq) and clinical data were
downloaded from TCGA database (https://portal.gdc.cancer.gov; accessed on January 18,
2018), including 374 HCC samples and 50 paired paracancerous
samples. The present study adheres to TCGA publication guidelines
and data access policies. The open source software Bioconductor was
used for bioinformatics analysis, and EdgerR package (version 3.4)
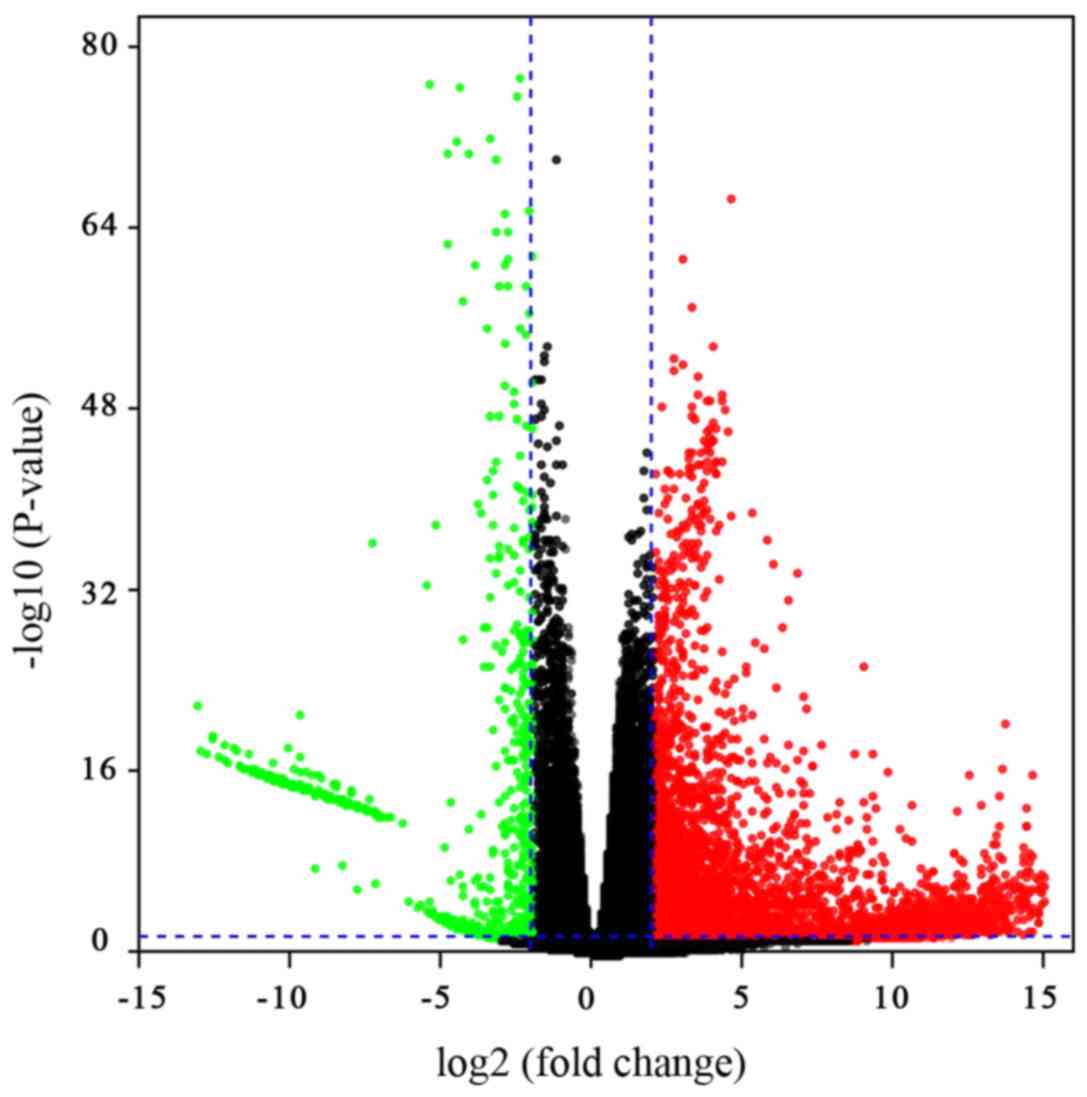
was downloaded from Bioconductor and applied to screen DEGs. DEGs
meeting the criteria of P<0.05 and |log2 fold
change|≥2 were considered as statistically significant. Next, a
volcano plot was used to present these DEGs. Gene Ontology (GO)
analysis of the significant DEGs was also performed based on DAVID
tools (https://david.ncifcrf.gov) with a
cut-off criteria of P<0.05.
Building the protein-protein interaction (PPI)
network and identifying hub genes. Search Tool for the Retrieval of
Interacting Genes/Proteins (STRING; http://string.embl.de/) is a database used to search
known and predicted interactions between proteins. The interaction
between proteins includes direct physical interaction and indirect
functional correlation. The present study focused on the first
1,000 upregulated DEGs with the most significant difference, and
these were analysed with the STRING online software in order to
construct the PPI network. Network visualization and analysis were
performed with Cytoscape software (version 3.5.1) (10), using the cytoHubba plug-in to sort
biological network nodes. Specifically, four of the most accurate
topological analysis methods (11),
including the maximal clique centrality (MCC), density of maximum
neighbourhood component (DMNC), maximum neighbourhood component
(MNC) and degree methods, were applied to construct the
subnetworks. The topological characteristics of each topological
analysis were different, and therefore the scores are different.
Six hub genes were obtained from the intersection of the top 10
genes scored by each of the four topological analyses.
Patients and tissue specimens
Tissue samples, including 51 tumor and 51 paired
adjacent tissue specimens, were collected from patients at the
Department of Hepatobiliary Surgery of the First Affiliated
Hospital of China Medical University (Shenyang, China) between
March 2013 and December 2015. All patients were diagnosed with HCC
and had not received treatment with chemotherapy, radiotherapy or
immunotherapy prior to surgery. The study was approved by the
Medical Ethics Committee of China Medical University. The Ethics
Committee waived the need for the patients to sign a written
informed consent due to the retrospective nature of this study.
Prior to tissue sample collection, the patients had been informed
that their tissue samples would be used for diagnosis and
scientific research for clinical treatment at the hospital. Tumor
staging was performed by two pathologists, according to the
American Joint Committee on Cancer guidelines (version 8, 2017)
(12). Primary tumor staging was
evaluated in 47 of the HCC patients as follows: T1 (n=6), T2
(n=25), T3 (n=15) and T4 (n=1). A total of 4 medical records did
not record the T-stage of the patient. In addition, the present
study excluded five patients whose samples had slipped off the
microscope slide. So only 46 of 51 patients were in accordance with
the inclusion criteria for the patients' tissues to be evaluated
via IHC. Clinicopathological data were retrospectively retrieved
from the medical records of patients.
Tissue microarray (TMA) and
immunohistochemistry (IHC)
All 102 collected tissues were embedded in paraffin
blocks, and the representative positions, the location rich in
cancer cells rather than a large number of interstitial cells, were
marked by checking the slides of the haematoxylin and eosin. The
1.5-mm tissue cores were extracted from the representative position
of each sample and carefully transferred to a TMA paraffin receptor
block (Pathology Devices, Inc., San Diego, CA, USA). Sections (4
µm) obtained from the TMA blocks were mounted on
poly-L-lysine-coated glass slides and prepared for IHC.
For IHC, the slices were deparaffinised and
rehydrated, soaked in xylene for 30 min, and then gradually added
to ethanol and distilled water for hydration. The slices were
immersed in 0.01 M citrate buffer (pH 6.0) at high pressure of 80
kPa for 8 min. Next, 3% H2O2 was used to
block endogenous peroxidase activity for 10 min at room
temperature, followed by incubation with 10% normal goat serum at
37°C for 30 min to block the binding sites of nonspecific proteins.
Subsequently, the slices were incubated overnight at 4°C with
diluted primary antibody against CTAG2 (dilution, 1:400;
cat. no. bs-6807R; Bioss, Inc., Woburn, MA, USA), and then
incubated at 37°C for 30 min with diluted biotinylated secondary
antibody (1:200; cat. no. KIT-0105R; MXB Biotechnologies). The
slices were further incubated with streptavidin-horseradish
peroxidase conjugate at 37°C for 30 min (LSAB kit; Dako, Glostrup,
Demark) and dyed with DAB for 25 sec, following which any excess
dyestuff was removed by PBS. In the negative control group, the
anti-CTAG2 antibody was replaced by PBS, while other steps
remained unchanged. For IHC, the slices were conducted under high
pressure which made some samples fall off the glass, and so only 46
of 51 paired tissues could be evaluated by IHC.
Evaluation of IHC
The histochemical staining level of TMA blocks was
evaluated with blind testing by two experienced clinical
pathologists under a light microscope. It is known that
CTAG2 is distributed throughout the cell, while a fraction
of CTAG2 is highly enriched in a single punctate focus near
the nucleus (13). Therefore,
evaluation of CTAG2 positive staining was mainly conducted
in the cytoplasm. In total, 10 visual fields was selected randomly
in each slice under high magnification (×400), and 100 cells were
counted in each field of view. Next, the percentage of positive
cells was calculated and the mean value was obtained. The
immunoreactive score (IRS) was obtained by multiplying the cell
staining percentage (0–100%) by the staining intensity score (where
a score of 0 indicated no staining, 1 indicated weak staining, 2
indicated moderate staining, and 3 indicated strong staining)
(14). The obtained IRS ranged
between 0 and 300%.
GSEA and KEGG pathway analysis
GSEA is a method used to analyse genome wide
expression profiles at the level of gene sets, which include genes
with the same common biological function (http://software.broadinstitute.org/gsea/index.jsp). In
the present study, the genome wide expression profiles of 374 HCC
patients from TCGA were classified into the high and low
CTAG2 expression groups and then analysed with GSEA (version
3.0) (15).
KEGG is a database resource applied to understand
high-level functions of biological systems (http://www.genome.jp/kegg). Kegg.v6.1.symbols.gmt that
derived from KEGG database is a gene set in the GSEA website's
MsigDB database. In the present study, GSEA was conducted by
default weighted enrichment statistics, with 1,000 random
combinations. The results of GSEA suggested that samples with high
CTAG2 expression were significantly enriched in 7 KEGG
pathways, according to the calculating criteria of P<0.05,
normalized enrichment score (NES) of >1 and false discovery rate
(FDR) of <25%.
Statistical analysis
The HCC patient samples from TCGA were divided into
the high and low CTAG2 expression groups based on their
median value. Survival was analysed by constructing Kaplan-Meier
curves (log-rank test), while Cox regression analysis was used to
performed univariable and multivariable analysis. Wilcoxon rank-sum
test was used to analyse the IHC data. Receiver operating
characteristic (ROC) curves were used to select the cut-off value
for the expression of CTAG2. Pearson's χ2 test or
Fisher's exact test was used to analyse the correlation between the
expression of CTAG2 and the clinicopathological
characteristics of HCC patients. All the aforementioned statistical
tests were completed using SPSS software, version 16.0 (SPSS, Inc.,
Chicago, IL, USA). In all analyses, P<0.05 was considered as an
indicator of a statistically significant difference.
Results
Screening for DEGs
Based on high-throughput RNA-Seq data from TCGA
Liver Hepatocellular Carcinoma (TCGA LIHC) project, 5,516 DEGs were
obtained, among which 4,750 were upregulated and 766 were
downregulated in HCC. In order to visualise the DEGs, a volcano
plot was constructed to view their distribution. The red and green
points in the plot represent the DEGs with a significantly
different expression (Fig. 1).
Subsequently, GO analysis of the significant DEGs was performed
using DAVID database tools. The results revealed that the
significant DEGs are associated with the regulation of
transcription and transcription corepressor activity (Table I). A previous study by Wong et
al (16) has suggested that a
complex of corepressor and proteins promotes cell cycle
progression, which in turn promotes tumorigenesis. Therefore, the
DEGs associated with transcription corepressor may contribute to
tumorigenesis by affecting cell cycle progression.
 | Table I.GO analysis of the significant
differentially expressed genes. |
Table I.
GO analysis of the significant
differentially expressed genes.
| Category | GO term | Count | P-value |
|---|
| BP | Regulation of
transcription, DNA-templated | 34 | 0.001676 |
| BP | G-protein coupled
receptor signaling pathway | 22 | 0.006075 |
| BP | Multicellular
organism development | 16 | 0.003145 |
| BP |
Spermatogenesis | 15 |
4.78×10−04 |
| BP | Proteolysis | 15 | 0.005383 |
| CC | Extracellular
space | 35 |
2.22×10−04 |
| CC | Transcription
factor complex | 9 | 0.004335 |
| CC | Extracellular
region | 34 | 0.00815 |
| CC | Intermediate
filament | 6 | 0.017465 |
| MF | Sequence-specific
DNA binding | 22 |
3.06×10−04 |
| MF | G-protein coupled
receptor activity | 20 | 0.001877 |
| MF | Olfactory receptor
activity | 14 | 0.003646 |
| MF | Transcription
co-repressor activity | 8 | 0.01541 |
| MF | Serine-type
endopeptidase activity | 9 | 0.016567 |
Establishment of PPI network and hub
gene selection
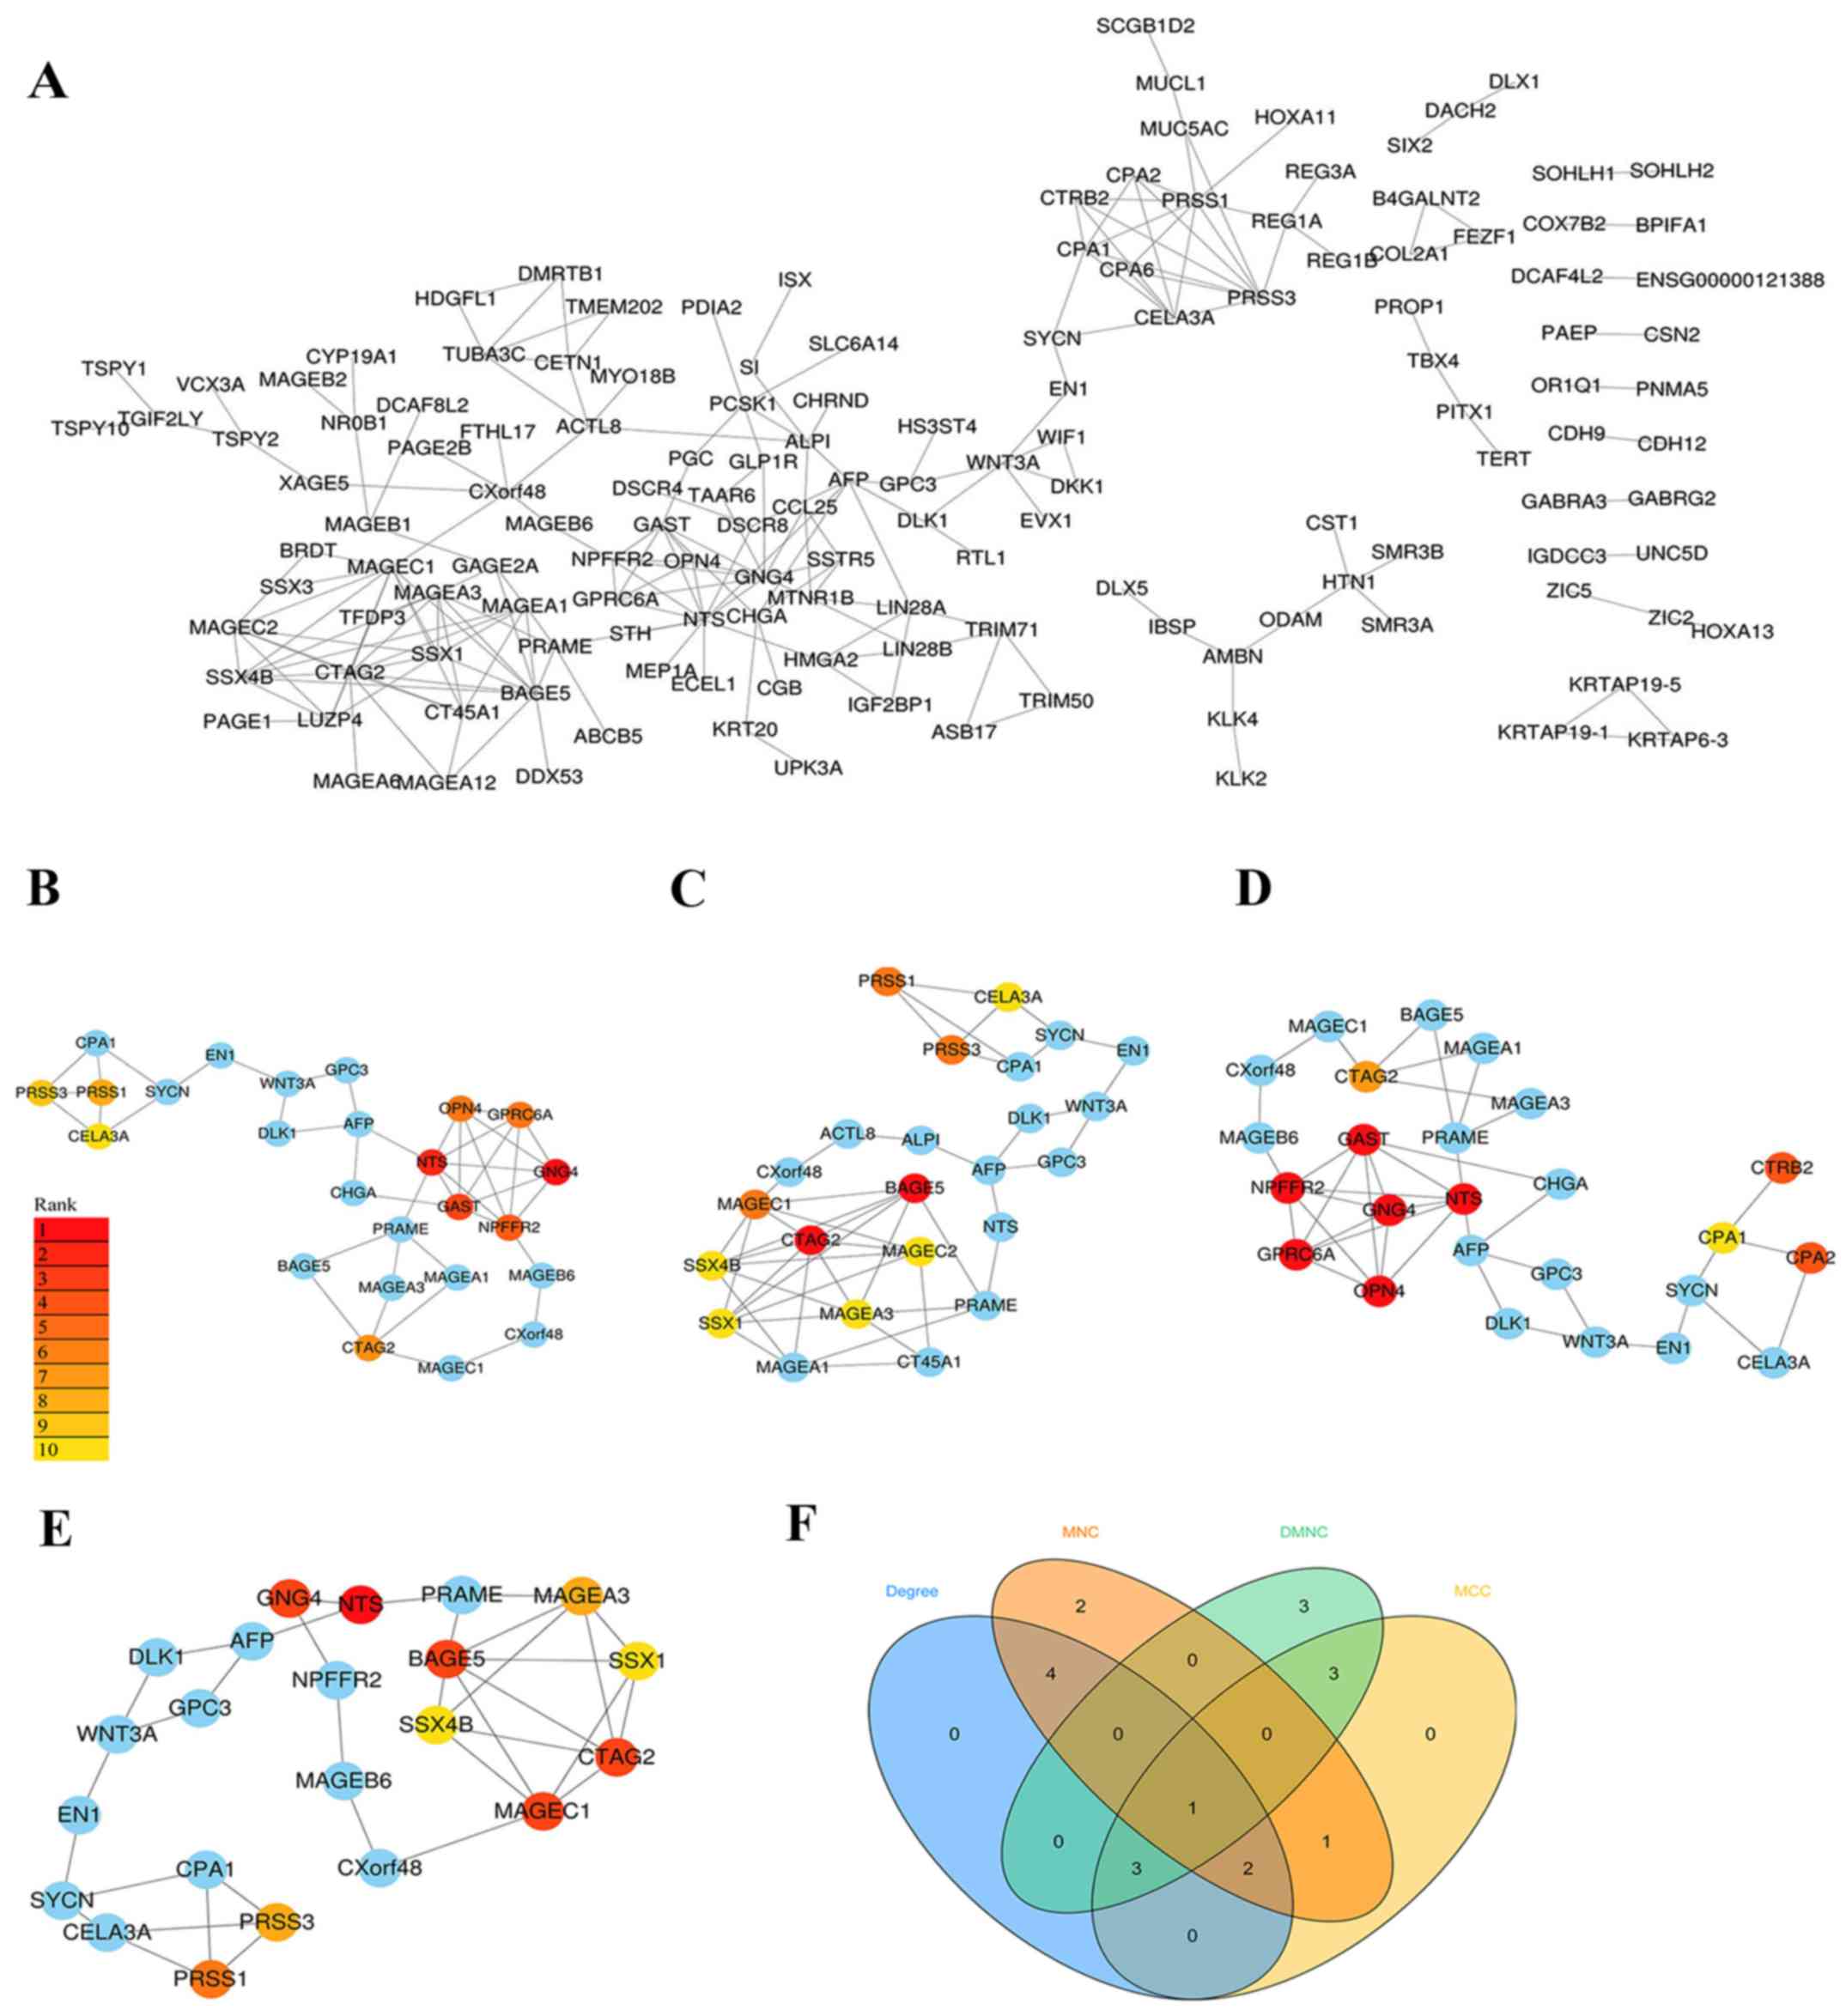
The PPI network was built using the STRING database
and visualised with Cytoscape software (Fig. 2A). The PPI enrichment P-value was
<1.0×10⁻¹⁶, which indicates that the interaction
between the proteins themselves was greater than that of random
proteins and that these proteins as a group are at least partially
bioconjugated.
Since biological networks are heterogeneous, it is
necessary to search for hub genes using different topological
analysis methods. There are 11 topological analysis methods in the
cytoHubba plug-in of Cytoscape software platform. In the current
study, four comparatively accurate methods of topological analysis,
including the MCC, MNC, DMNC and degree methods (8), were selected to construct the
subnetworks of the PPI network (Fig.
2B-E). Subsequently, based on the hub gene score from the four
corresponding models, the intersection was identified with a Venn
diagram (Fig. 2F). In total, 6 hub
genes appeared in at least three topological analysis methods,
including CTAG2, NTS, GNG4, GAST, PRSS1 and PRSS3
(Table II).
| Table II.Hub gene score according to the four
topological analysis methods. |
Table II.
Hub gene score according to the four
topological analysis methods.
| Gene name | MCC | MNC | DMNC | Degree |
|---|
| CTAG2 | 63 | 9 | 0.48 | 10 |
| NTS | 127 | – | 0.65 | 12 |
| GNG4 | 128 | – | 0.65 | 10 |
| GAST | 122 | – | 0.65 | 7 |
| PRSS1 | 59 | 8 | – | 9 |
| PRSS3 | 58 | 8 | – | 8 |
Association of hub gene expression and
prognostic value
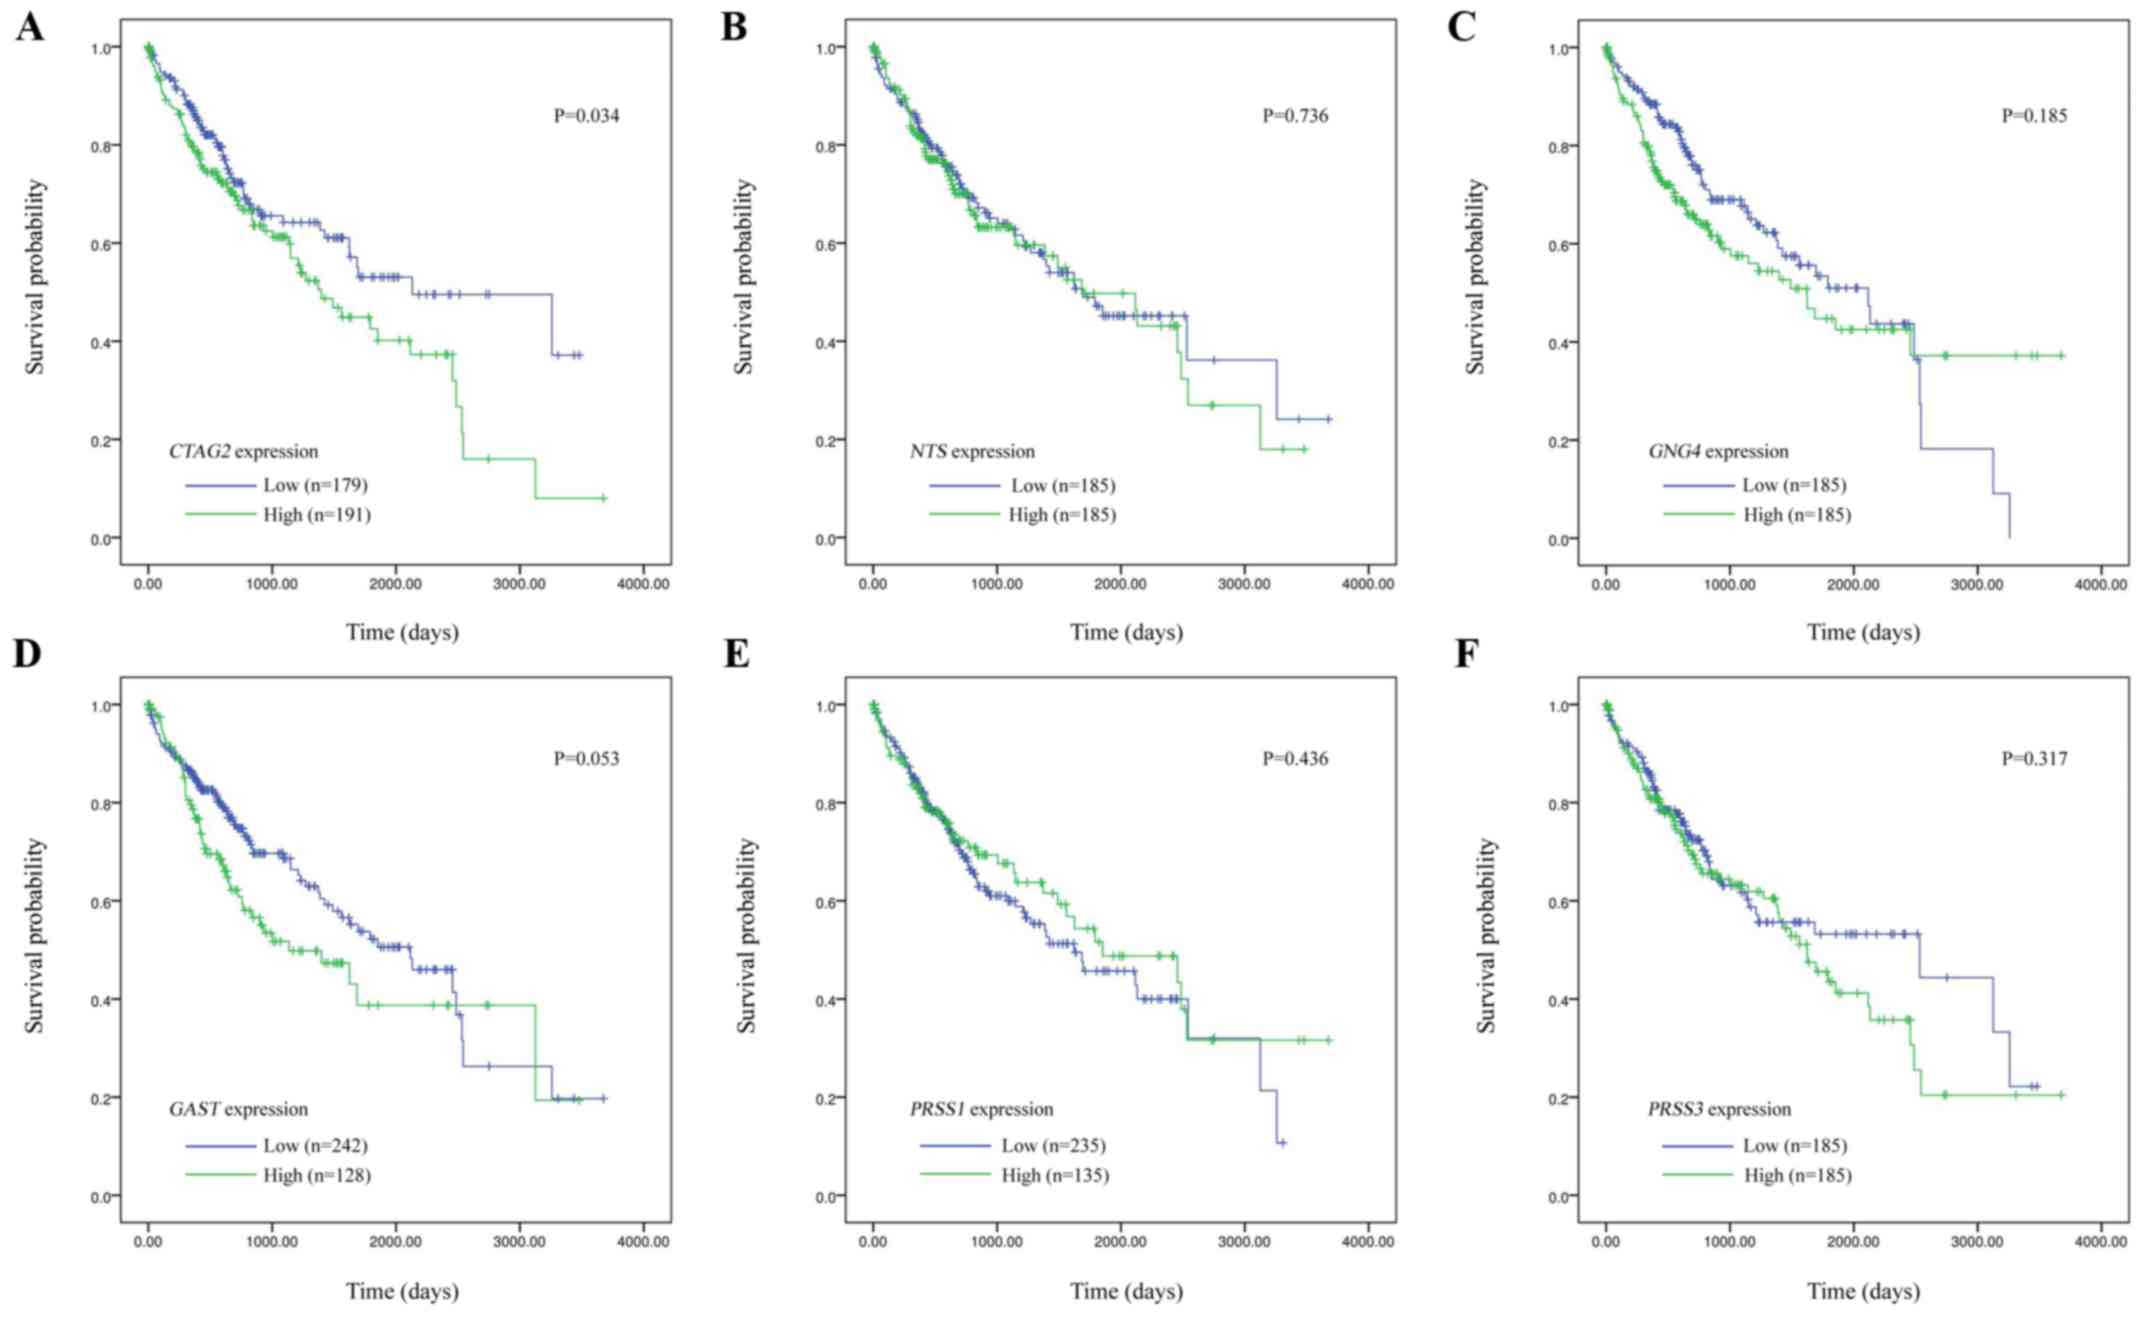
The correlation of hub gene expression with the
overall survival of HCC patients from TCGA database was evaluated
by Kaplan-Meier survival curves (Fig.
3). According to the RNA-seq expression of tumor tissues of
patients in the TCGA LIHC database, the expression levels of
CTAG2, NTS, GNG4, GAST, PRSS1 and PRSS3 was grouped
into the high-expression and low-expression groups based on the
median value. The results revealed that only CTAG2
expression was significantly correlated with prognosis (P=0.034),
and the overall survival time of the high-expression group was
significantly reduced. By contrast, there was no significant
correlation between the expression of other hub genes and patient
prognosis (NTS, P=0.736; GNG4, P=0.185; GAST,
P=0.053; PRSS1, P=0.436; and PRSS3, P=0.317).
Therefore, CTAG2 was regarded as the most important hub
gene. Furthermore, based on the univariate Cox regression analysis,
TNM stage (P<0.001), α-fetoprotein (AFP) expression (P=0.010)
and CTAG2 expression (P=0.035) were found to be
significantly correlated with the prognosis of patients. Further
multivariate Cox regression analysis (Table III) revealed that the TNM stage,
AFP expression and CTAG2 expression were not independent
risk factors that influence prognosis.
| Table III.Univariate and multivariate Cox
regression analysis of clinicopathological data correlated with
overall survival in hepatocellular carcinoma patients. |
Table III.
Univariate and multivariate Cox
regression analysis of clinicopathological data correlated with
overall survival in hepatocellular carcinoma patients.
|
|
| Univariate
analysis | Multivariate
analysis (n=264) |
|---|
|
|
|
|
|
|---|
| Factor | n | HR (95% CI) | P-value | HR (95% CI) | P-value |
|---|
| Age, years
(>60/≤60) | 370 | 1.212
(0.854–1.720) | 0.281 | 1.420
(0.875–2.303) | 0.156 |
| Gender
(male/female) | 370 | 1.225
(0.859–1.745) | 0.262 | 1.348
(0.838–2.167) | 0.218 |
| TNM stage
(1/2-4) | 346 | 1.661
(1.355–2.036) | <0.001 | 1.348
(0.846–2.148) | 0.209 |
| AFP level
(high/low) | 277 | 1.855
(1.159–2.970) | 0.010 | 1.528
(0.936–2.495) | 0.090 |
| CTAG2
expression (high/low) | 370 | 1.457
(1.028–2.066) | 0.035 | 1.440
(0.893–2.324) | 0.135 |
Association between CTAG2 expression
and the clinicopathological characteristics of HCC patients
included in TCGA database
The association of CTAG2 expression with the
clinicopathological characteristics of HCC patients included in the
TCGA database were investigated. The clinicopathological features
of HCC patients from TCGA are displayed in Table SI. According to the RNA-seq
expression data of tumor tissue included in TCGA LIHC, the
expression of CTAG2 was not associated with the patient
gender, but was significantly associated with the patient age
(P=0.003), T stage (P=0.028), TNM stage (P=0.028) and AFP
expression (P=0.045; Table IV).
| Table IV.Association of CTAG2
expression with the clinicopathological features of hepatocellular
carcinoma patients from The Cancer Genome Atlas database. |
Table IV.
Association of CTAG2
expression with the clinicopathological features of hepatocellular
carcinoma patients from The Cancer Genome Atlas database.
|
|
|
| CTAG2
expression, n (%) |
|
|---|
|
|
|
|
|
|
|---|
| Characteristic | Categories | n | Low | High | P-value |
|---|
| Sex | Female | 121 |
56
(46.3) |
65
(53.7) | 0.598 |
|
| Male | 250 |
123
(49.2) |
127
(50.8) |
|
| Age, years | <60 | 169 |
96
(56.8) |
73
(43.2) | 0.003 |
|
| ≥60 | 201 |
83
(41.3) |
118
(58.7) |
|
| T stage | 1 | 181 |
96
(53.0) |
85
(47.0) | 0.028 |
|
| 2 | 94 |
39
(41.5) |
55
(58.5) |
|
|
| 3 | 80 |
40
(50) |
40
(50) |
|
|
| 4 | 13 |
2
(15.4) |
11
(84.6) |
|
| TNM stage | 1 | 171 |
93
(54.4) |
78
(45.6) | 0.028 |
|
| 2–4 | 176 |
75
(42.6) |
101
(57.4) |
|
| AFP level | Low (<upper
limit) | 120 |
67
(55.8) |
53
(44.2) | 0.045 |
|
| High (≥upper
limit) | 158 |
69
(43.7) |
89
(56.3) |
|
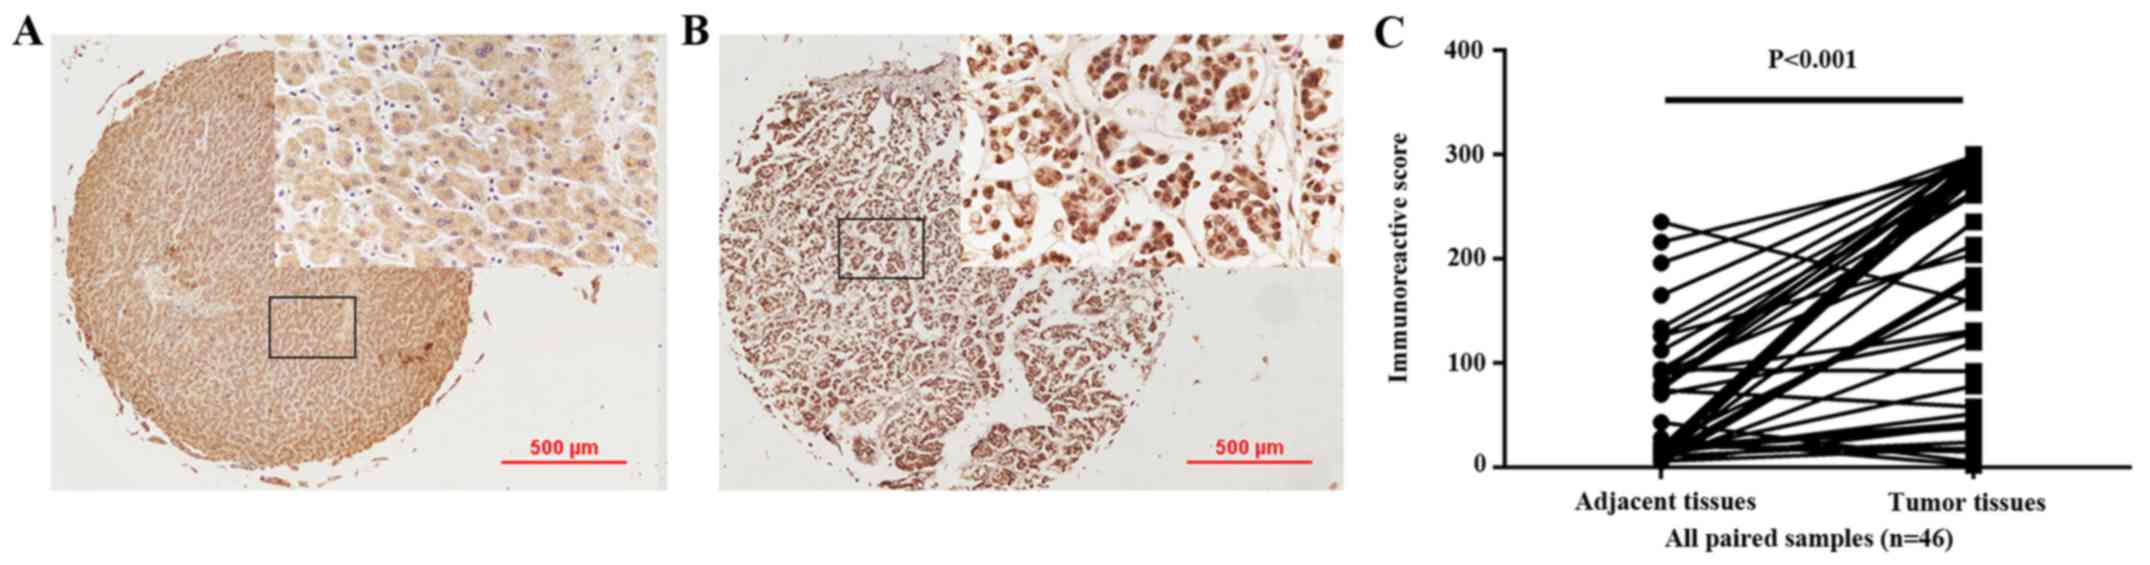
Immunostaining of CTAG2 in HCC tissue
samples from our hospital
In the present study, immunohistochemical staining
was conducted to detect CTAG2 expression in 46 hepatoma and
46 paired adjacent tissues collected at the First Affiliated
Hospital of China Medical University (Fig. 4). Among the 46 paired tissues
included in the TMA, the median IRS in the cancer tissues was
224.25% (interquartile range, 73.00–290.25%), whereas the median
IRS in the cancer adjacent tissues was 22.00% (interquartile range,
13–90.25%). These results suggested that the positive expression of
CTAG2 was significantly higher in carcinoma tissue compared
with that in adjacent tissues (P<0.001; Fig. 4C).
Association between CTAG2 expression
and clinicopathological characteristics of HCC patients from our
hospital
The clinicopathological parameters of HCC patients
from the First Affiliated Hospital of China Medical University are
displayed in Table SII. In order to
determine the correlation between the CTAG2 expression and
clinicopathological factors, the IRS cut-off value of the high and
low protein expression was defined by the ROC curves. The ROC curve
analysis with respect to AFP expression level was used to determine
the cut-point (208.5%; P=0.011) of the IRS (Fig. S1). Next, the association of
CTAG2 expression with the clinicopathological data of HCC
patients admitted to our hospital was examined. As shown in
Table V, the results demonstrated
that the expression of CTAG2 was statistically irrelevant to
the patient gender, age at diagnosis, carcinoembryonic antigen
expression, glypican-3 expression and differentiation level. By
contrast, CTAG2 expression was found to be significantly
associated with the hepatitis B virus (HBV) status (P=0.010) and
AFP expression (P=0.004) of patients, and marginally significantly
with the T stage (P=0.056).
| Table V.Association of CTAG2 expression with
the clinicopathological features of hepatocellular carcinoma
patients from the First Affiliated Hospital of China Medical
University. |
Table V.
Association of CTAG2 expression with
the clinicopathological features of hepatocellular carcinoma
patients from the First Affiliated Hospital of China Medical
University.
|
|
|
| CTAG2 expression, n
(%) |
|
|---|
|
|
|
|
|
|
|---|
|
|
|
|
|
|
|---|
| Characteristic | Category | n | Low | High | P-value |
|---|
| Sex | Female | 8 |
5
(62.5) |
3
(37.5) | 0.361 |
|
| Male | 38 |
17
(44.7) |
21
(55.3) |
|
| Age, years | <60 | 34 |
14
(41.2) |
20
(58.8) | 0.129 |
|
| ≥60 | 12 |
8
(66.7) |
4
(33.3) |
|
| T stage | 1–2 | 28 |
16
(57.1) |
12
(42.9) | 0.056 |
|
| 3–4 | 15 |
4
(26.7) |
11
(73.3) |
|
| HBV status | Negative | 11 |
9
(81.8) |
2
(18.2) | 0.010 |
|
| Positive | 35 |
13
(37.1) |
22
(76.1) |
|
| AFP level | Low (<upper
limit) | 18 |
13
(72.2) |
5
(27.8) | 0.004 |
|
| High (≥upper
limit) | 25 |
7
(28.0) |
18
(72.0) |
|
|
Differentiation | High | 17 |
9
(52.9) |
8
(47.1) | 0.494 |
|
| Low | 26 |
11
(42.3) |
15
(57.7) |
|
| CEA | Negative | 8 |
5
(62.5) |
3
(37.5) | 0.199 |
|
| Positive | 12 |
4
(33.3) |
8
(66.7) |
|
| GPC-3 | Negative | 7 |
3
(42.9) |
4
(57.1) | 0.606 |
|
| Positive | 26 |
14
(53.8) |
12
(46.2) |
|
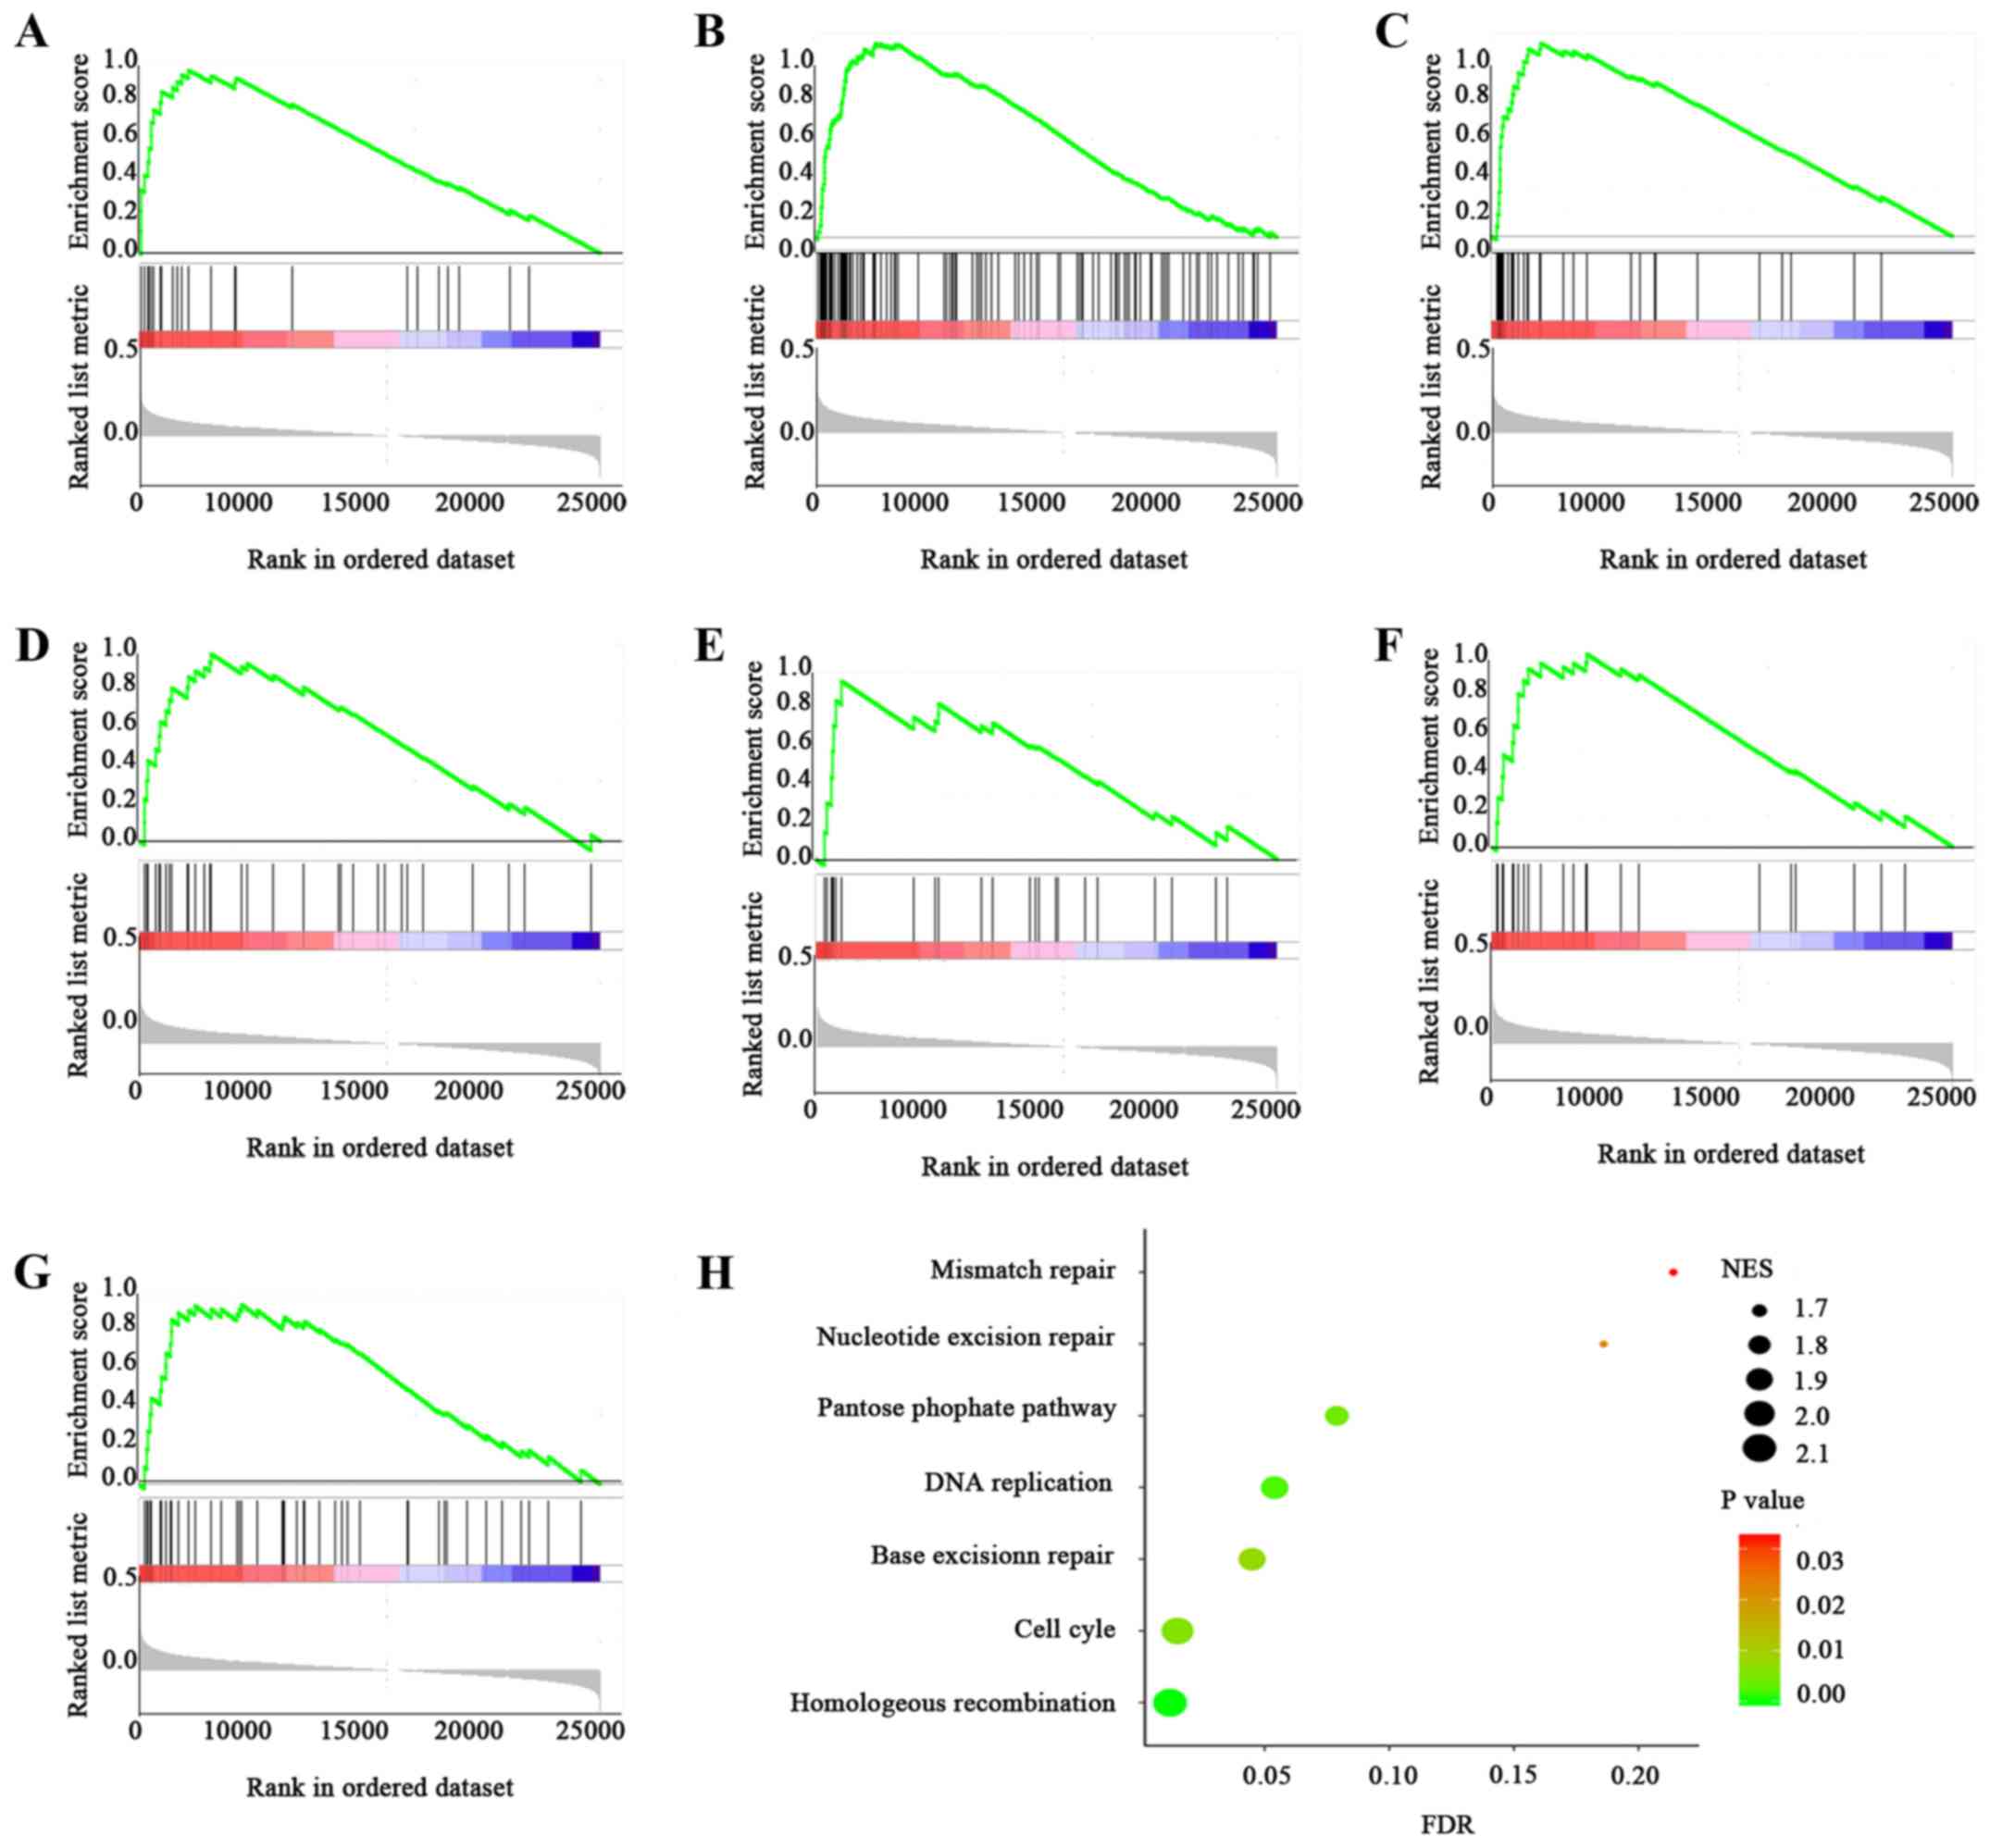
GSEA of HCC samples in TCGA
database
In order to obtain functional level information of
CTAG2, the GSEA method was used based on KEGG database. The
samples of 374 HCC patients included in TCGA database were divided
into two groups according to CTAG2 expression, and GSEA was
performed. The results suggested that samples with high
CTAG2 expression were associated with enrichment in 7
pathways (Fig. 5), including
homologous recombination (P<0.001), cell cycle (P=0.006), DNA
replication (P=0.002), base resection and repair (P=0.008), pentose
phosphate pathway (P=0.004), mismatch repair (P=0.032) and
nucleotide excision repair (P=0.022). Among these, the genes
involved in cell cycle pathway were significantly enriched in the
high CTAG2 expression group (NES=2.05, P=0.006, FDR=0.016).
The GSEA thus indicated that the function of CTAG2 in HCC
may be correlated to cell cycle and DNA replication signalling
pathways.
Discussion
At present, the main treatments for HCC include
surgical resection, tumor ablation and liver transplantation;
however, the therapeutic effect of these methods is limited for
numerous patients, and the recurrence rate of HCC within 5 years
after surgical resection has been reported to be 70% (17). According to the survival data
available in the SEER database, the 5-year survival rate of HCC
patients is <20% (18). The poor
prognosis is associated with the inaccuracy of the existing HCC
staging system, which results in patients not receiving adequate
personalised treatment and monitoring. For instance, the TNM system
of the Union for International Cancer Control is a tumor staging
system commonly used to evaluate tumor progression in patients
(19). However, there are great
differences between the recurrence risk and survival conditions
among patients with similar staging (20). Therefore, it is urgent and essential
to identify suitable biomarkers and classify molecular subtypes to
supplement the TNM staging system. Meanwhile, the biomarkers
screened may also be developed into potential therapeutic targets,
providing support for the development of new drugs for the
treatment of HCC.
In the present study, 374 liver cancer and 50 paired
paracancerous samples from the TCGA database were analysed, and the
DEGs were detected. A PPI network was built using STRING database,
while the subnetworks were constructed with four different
topological analysis methods (21).
It has been reported that the four methods used in the current
study, including the MCC, DMNC, MNC and degree methods, are more
accurate when analysing PPIs in the biological network (11). For instance, using MCC, a greater
number of required proteins can be selected from the top ranked
list, from high to low degree scores (11). In addition, different basic proteins
are identified by DMNC, which scores the biological network with
different methods. Therefore, these methods of topological analysis
were used in the present study to construct the protein
subnetworks. Subsequently, the intersection was determined
according to the Venn graph, and six pivotal genes were identified
in each subnetwork, which were as follows: CTAG2, NTS, GNG4,
GAST, PRSS1 and PRSS3. The correlation between the
expression levels of the six hub genes and the prognosis of HCC was
then analysed, and CTAG2 was finally selected as the key
research object. The aforementioned analytical methods may provide
a new perspective for screening hub genes.
The CTA family includes tumor-associated antigens
with a specific expression pattern (22,23). CTA
proteins recognised by immune cells are encoded in tumor cells by
certain special genes. These genes are normally silent in cells
other than the human normal testicular and malignant cells.
CTAG2 is a member of the CTA family that is mainly used for
tumor diagnosis, metastasis monitoring and tumor treatment
(24–26). It is highly expressed in numerous
tumors, such as melanoma (27),
multiple myeloma (28), urothelial
carcinoma (29), prostate cancer
(30), colorectal cancer (31) and breast cancer (9). Previous research was only conducted in
a small number of samples and reported that the mRNA expression of
CTAG2 in HCC tissues was higher than that in normal tissues
(32). In the current study, a large
number of samples were used to confirm the high expression of
CTAG2 in HCC. According to our study, examination of the
association of CTAG2 expression in 374 HCC patients included
in the TCGA database with various clinicopathological indexes
indicated that the expression of CTAG2 was significantly
correlated with patient age (P=0.003), T stage (P=0.028), TNM stage
(P=0.028) and AFP level (P=0.045). Furthermore, according to
univariate Cox analysis, CTAG2 expression (overall survival,
P=0.035) was correlated with the prognosis of the patients with
HCC. By contrast, a previous study reported that the level of
CTAG2 mRNA expression was not significantly correlated with
clinical pathological parameters in patients (28). The discrepancy in the results
obtained in the present study and those of the previous report may
be due to the difference in the sample size and source. In
addition, bioinformatics analysis of different racial
classifications could not be contacted, since the majority of TCGA
data involve Caucasian patients. Therefore, tissues from Chinese
patients were further analysed by IHC in the present study. The
results revealed that the positive expression of CTAG2 in
carcinoma tissues was significantly higher when compared with that
in adjacent tissues. Thus, it is possible that CTAG2 is
highly expressed in tumor tissues for different ethnic groups.
Available research has reported the mRNA expression
of CTAG2 in HCC, without investigating the protein level. In
the current study, IHC was conducted and confirmed that
CTAG2 was highly expressed in HCC tissues at the protein
level. Subsequently, the clinical data revealed that the expression
of CTAG2 was correlated with the HBV status (P=0.010) and
AFP level (P=0.004). These results are basically consistent with
the results of the TCGA data analytics in the present study.
Analysing the association of CTAG2 with KEGG
pathways may be beneficial for revealing the molecular mechanism of
its influence on HCC. It has been reported that GSEA has
significant advantages over traditional gene expression analysis
(33). This method aims to detect
biological processes in the whole gene network by focusing on gene
sets. GSEA was conducted in the present study and demonstrated that
CTAG2 expression was associated with several signalling
pathways, including the cell cycle pathway. CTAG2 is known
to affect the cell cycle due to being involved in mitosis by
interacting with the centrosomal protein pericentrin (13). Meanwhile, according to the analysis
performed in the present study, the expression of CTAG2 was
associated with the T stage (primary tumor topography). Therefore,
it is suggested that CTAG2 may influence the tumor size by
affecting the cell cycle. Numerous antineoplastic drugs work by
influencing the cell cycle, while CTAG2 promotes tumor
growth by influencing the cell cycle; therefore, CTAG2 may
serve as a cell cycle-specific therapeutic target.
In conclusion, the current research aimed to analyse
the PPI networks in HCC by using different topological analysis
methods to identify the hub genes. The study revealed that data and
immunohistochemical analyses are effective methods for screening
potential therapeutic targets. Based on the results, it can be
inferred that CTAG2 can be used as a potential HCC
therapeutic target or prognostic biomarker, and thus patients with
high expression of CTAG2 should be monitored and treated
appropriately. However, further research is needed in the future to
reveal the mechanism underlying the effect of CTAG2 on the
development of HCC.
Supplementary Material
Supporting Data
Acknowledgements
Not applicable.
Funding
The present study was supported in part by grants
from the National Natural Science Foundation of China (grant no.
81601370) and Shenyang S&T Projects (grant nos. F16-094-1-00
and Z18-4-020).
Availability of data and materials
RNA-Seq data analysed during the present study are
available in The Cancer Genome Atlas (https://portal.gdc.cancer.gov).
Authors' contributions
HG was the major contributor in designing this study
and provided guidance for bioinformatic analysis. MW participated
in designing this work and revised the manuscript for important
intellectual content, and provided approval for the final version
to be published. JL drafted the manuscript and performed the
experiments. JL performed the bioinformatic analysis. ZY
participated in drafting of the manuscript for important
intellectual content and evaluated the histochemical staining level
of TMA blocks. QL assisted in samples collection and evaluated the
histochemical staining level of TMA blocks. MS participated in the
bioinformatic analysis and conducted the statistical analyses on
the data. All authors agreed to be accountable for all aspects of
the present study in ensuring that questions related to the
accuracy or integrity of the work are appropriately resolved.
Ethics approval and consent to
participate
The study was approved by the Medical Ethics
Committee of China Medical University. The Ethics Committee waived
the need for the patient to sign a written informed consent due to
the retrospective nature of the study.
Patient consent for publication
Not applicable.
Competing interests
The authors declare that they have no competing
interests.
References
|
1
|
Siegel RL, Miller KD and Jemal A: Cancer
statistics, 2018. CA Cancer J Clin. 68:7–30. 2018. View Article : Google Scholar : PubMed/NCBI
|
|
2
|
Perz JF, Armstrong GL, Farrington LA,
Hutin YJ and Bell BP: The contributions of hepatitis B virus and
hepatitis C virus infections to cirrhosis and primary liver cancer
worldwide. J Hepatol. 45:529–538. 2006. View Article : Google Scholar : PubMed/NCBI
|
|
3
|
Hung AK and Guy J: Hepatocellular
carcinoma in the elderly: Meta-analysis and systematic literature
review. World J Gastroenterol. 21:12197–12210. 2015. View Article : Google Scholar : PubMed/NCBI
|
|
4
|
Kiss A, Wang NJ, Xie JP and Thorgeirsson
SS: Analysis of transforming growth factor (TGF)-alpha/epidermal
growth factor receptor, hepatocyte growth Factor/c-met, TGF-beta
receptor type II, and p53 expression in human hepatocellular
carcinomas. Clin Cancer Res. 3:1059–1066. 1997.PubMed/NCBI
|
|
5
|
Chiang DY, Villanueva A, Hoshida Y, Peix
J, Newell P, Minguez B, LeBlanc AC, Donovan DJ, Thung SN, Solé M,
et al: Focal gains of VEGFA and molecular classification of
hepatocellular carcinoma. Cancer Res. 68:6779–6788. 2008.
View Article : Google Scholar : PubMed/NCBI
|
|
6
|
Liao H, Liao M, Xu L, Yan X, Ren B, Zhu Z,
Yuan K and Zeng Y: Integrative analysis of h-prune as a potential
therapeutic target for hepatocellular carcinoma. EBioMedicine.
41:310–319. 2019. View Article : Google Scholar : PubMed/NCBI
|
|
7
|
Jin B, Wang W, Du G, Huang GZ, Han LT,
Tang ZY, Fan DG, Li J and Zhang SZ: Identifying hub genes and
dysregulated pathways in hepatocellular carcinoma. Eur Rev Med
Pharmacol Sci. 19:592–601. 2015.PubMed/NCBI
|
|
8
|
Zheng Y, Long J, Wu L, Zhang H, Li L,
Zheng Y, Wang A, Lin J, Yang X, Sang X, et al: Identification of
hub genes involved in the development of hepatocellular carcinoma
by transcriptome sequencing. Oncotarget. 8:60358–60367.
2017.PubMed/NCBI
|
|
9
|
Xiong Y, You W, Wang R, Peng L and Fu Z:
prediction and validation of hub genes associated with colorectal
cancer by integrating PPI network and gene expression data. BioMed
Res Int. 2017:24214592017. View Article : Google Scholar : PubMed/NCBI
|
|
10
|
Shannon P, Markiel A, Ozier O, Baliga NS,
Wang JT, Ramage D, Amin N, Schwikowski B and Ideker T: Cytoscape: A
software environment for integrated models of biomolecular
interaction networks. Genome Res. 13:2498–2504. 2003. View Article : Google Scholar : PubMed/NCBI
|
|
11
|
Chin CH, Chen SH, Wu HH, Ho CW, Ko MT and
Lin CY: cytoHubba: Identifying hub objects and sub-networks from
complex interactome. BMC Syst Biol. 8 (Suppl 4):S112014. View Article : Google Scholar : PubMed/NCBI
|
|
12
|
Amin MB, Greene FL, Edge SB, Compton CC,
Gershenwald JE, Brookland RK, Meyer L, Gress DM, Byrd DR and
Winchester DP: The Eighth Edition AJCC Cancer Staging Manual:
Continuing to build a bridge from a population-based to a more
‘personalized’ approach to cancer staging. CA Cancer J Clin.
67:93–99. 2017. View Article : Google Scholar : PubMed/NCBI
|
|
13
|
Maine EA, Westcott JM, Prechtl AM, Dang
TT, Whitehurst AW and Pearson GW: The cancer-testis antigens
SPANX-A/C/D and CTAG2 promote breast cancer invasion.
Oncotarget. 7:14708–14726. 2016. View Article : Google Scholar : PubMed/NCBI
|
|
14
|
Han Q, Sun ML, Liu WS, Zhao HS, Jiang LY,
Yu ZJ and Wei MJ: Upregulated expression of ACTL8 contributes to
invasion and metastasis and indicates poor prognosis in colorectal
cancer. Onco Targets Ther. 12:1749–1763. 2019. View Article : Google Scholar : PubMed/NCBI
|
|
15
|
Wang J, Chen W, Wei W and Lou J: Oncogene
TUBA1C promotes migration and proliferation in hepatocellular
carcinoma and predicts a poor prognosis. Oncotarget. 8:96215–96224.
2017.PubMed/NCBI
|
|
16
|
Wong PP, Miranda F, Chan KV, Berlato C,
Hurst HC and Scibetta AG: Histone demethylase KDM5B collaborates
with TFAP2C and Myc to repress the cell cycle inhibitor p21(cip)
(CDKN1A). Mol Cell Biol. 32:1633–1644. 2012. View Article : Google Scholar : PubMed/NCBI
|
|
17
|
Forner A, Llovet JM and Bruix J:
Hepatocellular carcinoma. Lancet. 379:1245–1255. 2012. View Article : Google Scholar : PubMed/NCBI
|
|
18
|
Wang S, Sun H, Xie Z, Li J, Hong G, Li D,
Mallampati S, Zhou X, Zhou C, Zhang H, et al: Improved survival of
patients with hepatocellular carcinoma and disparities by age, race
and socioeconomic status by decade, 1983–2012. Oncotarget.
7:59820–59833. 2016.PubMed/NCBI
|
|
19
|
Chan AC, Fan ST, Poon RT, Cheung TT, Chok
KS, Chan SC and Lo CM: Evaluation of the seventh edition of the
American Joint Committee on Cancer tumor-node-metastasis (TNM)
staging system for patients undergoing curative resection of
hepatocellular carcinoma: Implications for the development of a
refined staging system. HPB (Oxford). 15:439–448. 2013. View Article : Google Scholar : PubMed/NCBI
|
|
20
|
Greene FL and Sobin LH: The staging of
cancer: A retrospective and prospective appraisal. CA Cancer J
Clin. 58:180–190. 2008. View Article : Google Scholar : PubMed/NCBI
|
|
21
|
Gao H, Wang H and Yang W: Identification
of key genes and construction of microRNA-mRNA regulatory networks
in multiple myeloma by integrated multiple GEO datasets using
bioinformatics analysis. Int J Hematol. 106:99–107. 2017.
View Article : Google Scholar : PubMed/NCBI
|
|
22
|
Almeida LG, Sakabe NJ, deOliveira AR,
Silva MC, Mundstein AS, Cohen T, Chen YT, Chua R, Gurung S, Gnjatic
S, et al: CTdatabase: A knowledge-base of high-throughput and
curated data on cancer-testis antigens. Nucleic Acids Res 37
(Database Issue). D816–D819. 2009. View Article : Google Scholar
|
|
23
|
Chen YT, Scanlan MJ, Venditti CA, Chua R,
Theiler G, Stevenson BJ, Iseli C, Gure AO, Vasicek T, Strausberg
RL, et al: Identification of cancer/testis-antigen genes by
massively parallel signature sequencing. Proc Natl Acad Sci USA.
102:7940–7945. 2005. View Article : Google Scholar : PubMed/NCBI
|
|
24
|
Caballero OL and Chen YT: Cancer/testis
(CT) antigens: Potential targets for immunotherapy. Cancer Sci.
100:2014–2021. 2009. View Article : Google Scholar : PubMed/NCBI
|
|
25
|
Yao J, Caballero OL, Yung WK, Weinstein
JN, Riggins GJ, Strausberg RL and Zhao Q: Tumor subtype-specific
cancer-testis antigens as potential biomarkers and
immunotherapeutic targets for cancers. Cancer Immunol Res.
2:371–379. 2014. View Article : Google Scholar : PubMed/NCBI
|
|
26
|
Hofmann O, Caballero OL, Stevenson BJ,
Chen YT, Cohen T, Chua R, Maher CA, Panji S, Schaefer U, Kruger A,
et al: Genome-wide analysis of cancer/testis gene expression. Proc
Natl Acad Sci USA. 105:20422–20427. 2008. View Article : Google Scholar : PubMed/NCBI
|
|
27
|
Lotem M, Merims S, Frank S, Hamburger T,
Nissan A, Kadouri L, Cohen J, Straussman R, Eisenberg G,
Frankenburg S, et al: Adjuvant autologous melanoma vaccine for
macroscopic stage III disease: Survival, biomarkers, and improved
response to CTLA-4 blockade. J Immunol Res. 2016:81219852016.
View Article : Google Scholar : PubMed/NCBI
|
|
28
|
van Duin M, Broyl A, de Knegt Y,
Goldschmidt H, Richardson PG, Hop WC, van der Holt B,
Joseph-Pietras D, Mulligan G, Neuwirth R, et al: Cancer testis
antigens in newly diagnosed and relapse multiple myeloma:
Prognostic markers and potential targets for immunotherapy.
Haematologica. 96:1662–1669. 2011. View Article : Google Scholar : PubMed/NCBI
|
|
29
|
Dyrskjot L, Zieger K, Kissow Lildal T,
Reinert T, Gruselle O, Coche T, Borre M and Ørntoft TF: Expression
of MAGE-A3, NY-ESO-1, LAGE-1 and PRAME in urothelial carcinoma. Br
J Cancer. 107:116–122. 2012. View Article : Google Scholar : PubMed/NCBI
|
|
30
|
Kulkarni P, Shiraishi T, Rajagopalan K,
Kim R, Mooney SM and Getzenberg RH: Cancer/testis antigens and
urological malignancies. Nat Rev Urol. 9:386–396. 2012. View Article : Google Scholar : PubMed/NCBI
|
|
31
|
Shantha Kumara HM, Grieco MJ, Caballero
OL, Su T, Ahmed A, Ritter E, Gnjatic S, Cekic V, Old LJ, Simpson
AJ, et al: MAGE-A3 is highly expressed in a subset of colorectal
cancer patients. Cancer Immu. 12:162012.
|
|
32
|
Wang XY, Chen HS, Luo S, Zhang HH, Fei R
and Cai J: Comparisons for detecting NY-ESO-1 mRNA expression
levels in hepatocellular carcinoma tissues. Oncol Rep. 21:713–719.
2009.PubMed/NCBI
|
|
33
|
Subramanian A, Tamayo P, Mootha VK,
Mukherjee S, Ebert BL, Gillette MA, Paulovich A, Pomeroy SL, Golub
TR, Lander ES and Mesirov JP: Gene set enrichment analysis: A
knowledge-based approach for interpreting genome-wide expression
profiles. Proc Natl Acad Sci USA. 102:15545–15550. 2005. View Article : Google Scholar : PubMed/NCBI
|