Introduction
Primary liver cancer is the sixth most frequent
cancer (6%) and the second leading cause of cancer-associated
mortality (9%) worldwide (1). Liver
hepatocellular carcinoma (LIHC) accounts for 75% of all primary
liver cancers (2). The therapy for
LIHC has focused primarily on traditional resection and recurrence
rates following resection can exceed 70% (3). Sorafenib, a drug that inhibits the
activity of tyrosine protein kinases, was recently approved for use
in patients and could improve the overall survival (OS) of patients
with advanced LIHC from 7.9 to 10.7 months (4). Thus, identifying novel therapeutic
targets is urgent for LIHC.
Peptidylprolyl isomerase A (PPIA), also known as
cyclophilin A or rotamase A, is an enzyme encoded by the PPIA gene
on chromosome 7 (5,6). The PPIA protein catalyzes the
cis-trans isomerization of proline imidic peptide bonds,
which allows it to regulate a number of biological processes,
including intracellular signaling, transcription, inflammation and
apoptosis (7–10). PPIA has been reported to interact
with molecules that could impact on various pathological processes
(11). PPIA could inhibit the
activity of interleukin-2 tyrosine kinase (ITK), leading to
decreased activation of T cells (12). Basigin (BSG), also known as
extracellular matrix metalloproteinase inducer or cluster of
differentiation 147 (CD147), which is a member of the
immunoglobulin superfamily (13–15),
plays fundamental roles in the intercellular recognition involved
in various immunological phenomena, including differentiation and
development (16). Activation of
CD147 receptor with recombinant human PPIA could stimulate the
phosphorylation of extracellular signal-regulated kinase 1/2, c-jun
NH2-terminal kinase, p38 kinase, protein kinase B and IKB (17–19).
PPIA/CD147 signaling has been reported to lead to cell migration,
proliferation and differentiation (20–22).
PPIA has been reported to interact with signal transducer and
activator of transcription 3 (STAT3) in myeloma cells (23). PPIA has been implicated in a broad
range of pathological processes, including inflammatory diseases,
aging and the progression of cancer metastasis (11). Previous studies have demonstrated
that overexpression of PPIA plays key roles in different types of
cancer, including hepatocellular carcinoma, lung cancer, pancreatic
cancer, breast cancer, colorectal cancer, squamous cell carcinoma
and melanoma (24,25). These results were primarily based on
laboratory studies; therefore the question remains unanswered as to
whether PPIA could serve as a prognostic factor and potential
target for therapy in the future. Former studies have suggested
that the differences in steady-state between protein levels are
largely explained by the variations in transcript concentrations,
which means that by examining the different RNA concentrations of
the genes, the correlated protein levels of these genes may be
identified (26–30). With this hypothesis, the present
study analyzed the associations between PPIA expression levels and
the survival of different populations with cancer in database
platforms such as Oncomine, PrognoScan and UALCAN. In addition, as
there have been studies demonstrating the associations between
patients' survival and immune cell infiltration in the tumor
microenvironment, the present study also investigated the
association between immune infiltrates in the tumor
microenvironment and PPIA expression levels, with the aim of
identifying a link between PPIA expression and immune cell
infiltration. The present study aimed to elucidate the association
between PPIA expression and cancer prognoses. The associations
between the transcription levels of ITK, BSG, STAT3 and PPIA were
investigated in order to identify the underlying molecular
mechanisms.
Materials and methods
Analysis using the Oncomine
database
Oncomine (https://www.oncomine.org/resource/login.html) is a
web-based online database containing 715 datasets and 86,733
samples (31,32). This platform provides a powerful set
of analysis functions that calculate gene expression signatures,
clusters and gene-set modules, automatically extracting biological
insights from the data. The expression level of PPIA in different
types of cancer was obtained from the Oncomine database. The
threshold values were P=0.001, fold-change=1.5.
Analysis in the PrognoScan
database
The correlation between the expression level of PPIA
and survival in cancer was analyzed using the PrognoScan database
(33) (http://www.abren.net/PrognoScan). This database was
based on publicly available cancer datasets, which provides
Kaplan-Meier plots of gene transcription and survival time in
accordance with individual datasets (32). The threshold values were corrected
P=0.05 and Cox P=0.05.
Analysis in UALCAN
UALCAN (http://ualcan.path.uab.edu/index.html) provides graphs
and plots depicting gene expression and patient survival
information for different types of cancer (34). The association between the expression
level of PPIA and survival for the different types of cancer that
were filtered by PrognoScan was analyzed using UALCAN. In addition,
the present study also investigated the types of cancer not
included in the PrognoScan, such as liver cancer. The threshold
value was P=0.05.
Kaplan-Meier plotter database
analysis
A Kaplan-Meier plotter can assess the effect of
54,675 genes on survival using 10,461 cancer samples. The
association between PPIA expression and survival in liver cancer
was analyzed using the Kaplan-Meier Plotter at (http://kmplot.com/analysis) (35).
Analysis in Tumor IMmune Estimation
Resource (TIMER)
TIMER is a resource for the analysis of immune cell
infiltrates in the microenvironment of various different types of
cancer (36,37) (https://cistrome.shinyapps.io/timer). TIMER applies
the deconvolution method to infer levels of tumor-infiltrating
immune cells including B cells, CD4+ T cells,
CD8+ T cells, neutrophils, macrophages and dendritic
cells from gene expression profiles (32). TIMER also identifies the association
between tumor purity and expression level of the input gene. Those
genes that are highly expressed in the microenvironment are
expected to demonstrate negative associations with tumor purity,
while the opposite is expected for genes that are highly expressed
in the tumor cells. The present study analyzed the association
between PPIA expression with levels of immune infiltrates, as well
as the associations between expression levels of PPIA and genes, of
which the proteins were reported to interact with PPIA. By default,
TIMER currently only provides information regarding the
associations between PPIA expression and B cells, CD4+ T
cells, CD8+ T cells, macrophages, neutrophils and
dendritic cells. In addition to analyzing the associations between
PPIA expression and the aforementioned cell types, the present
study also investigated the associations between the immunomarkers
of other immune cells, including natural killer cells, Treg cells
and T cell exhaustion, and the expression levels of PPIA in order
to gain an accurate representation of these immune cells and PPIA
expression. The biomarkers for natural killer cells were killer
cell immunoglobulin-like receptor (KIR)3DL1, KIR2DS4, KIR2DL1,
KIR3DL2, KIR2DL3, natural cytotoxicity triggering receptor 2 and
CD244 (38–42). The biomarker selected for regulatory
T cells was forkhead box protein P3 (43–45).
PDCD1 and interleukin (IL)10 were selected as biomarkers for T cell
exhaustion (46).
Statistical analysis
Survival curves were generated using UALCAN and
Kaplan-Meier Plotter. The results generated by Oncomine are
presented with P-values, fold-changes and ranks. The threshold
values of PrognoScan were corrected P=0.05 and Cox P=0.05. The
results of the UALCAN and Kaplan-Meier Plotter analyses are
presented with the hazard ratio (HR) and P-value, or Cox P-values
from a log-rank test. The correlations in gene expression were
assessed using Spearman's correlation tests to determine
statistical significance and the strength of the correlation was
determined by following a guide for the absolute value: 0.00–0.19,
very weak; 0.20–0.39, weak; 0.40–0.59, moderate; 0.60–0.79, strong
and 0.80–1.00, very strong. P<0.05 was considered to indicate a
statistically significant difference.
Results
Transcription levels of PPIA in
cancer
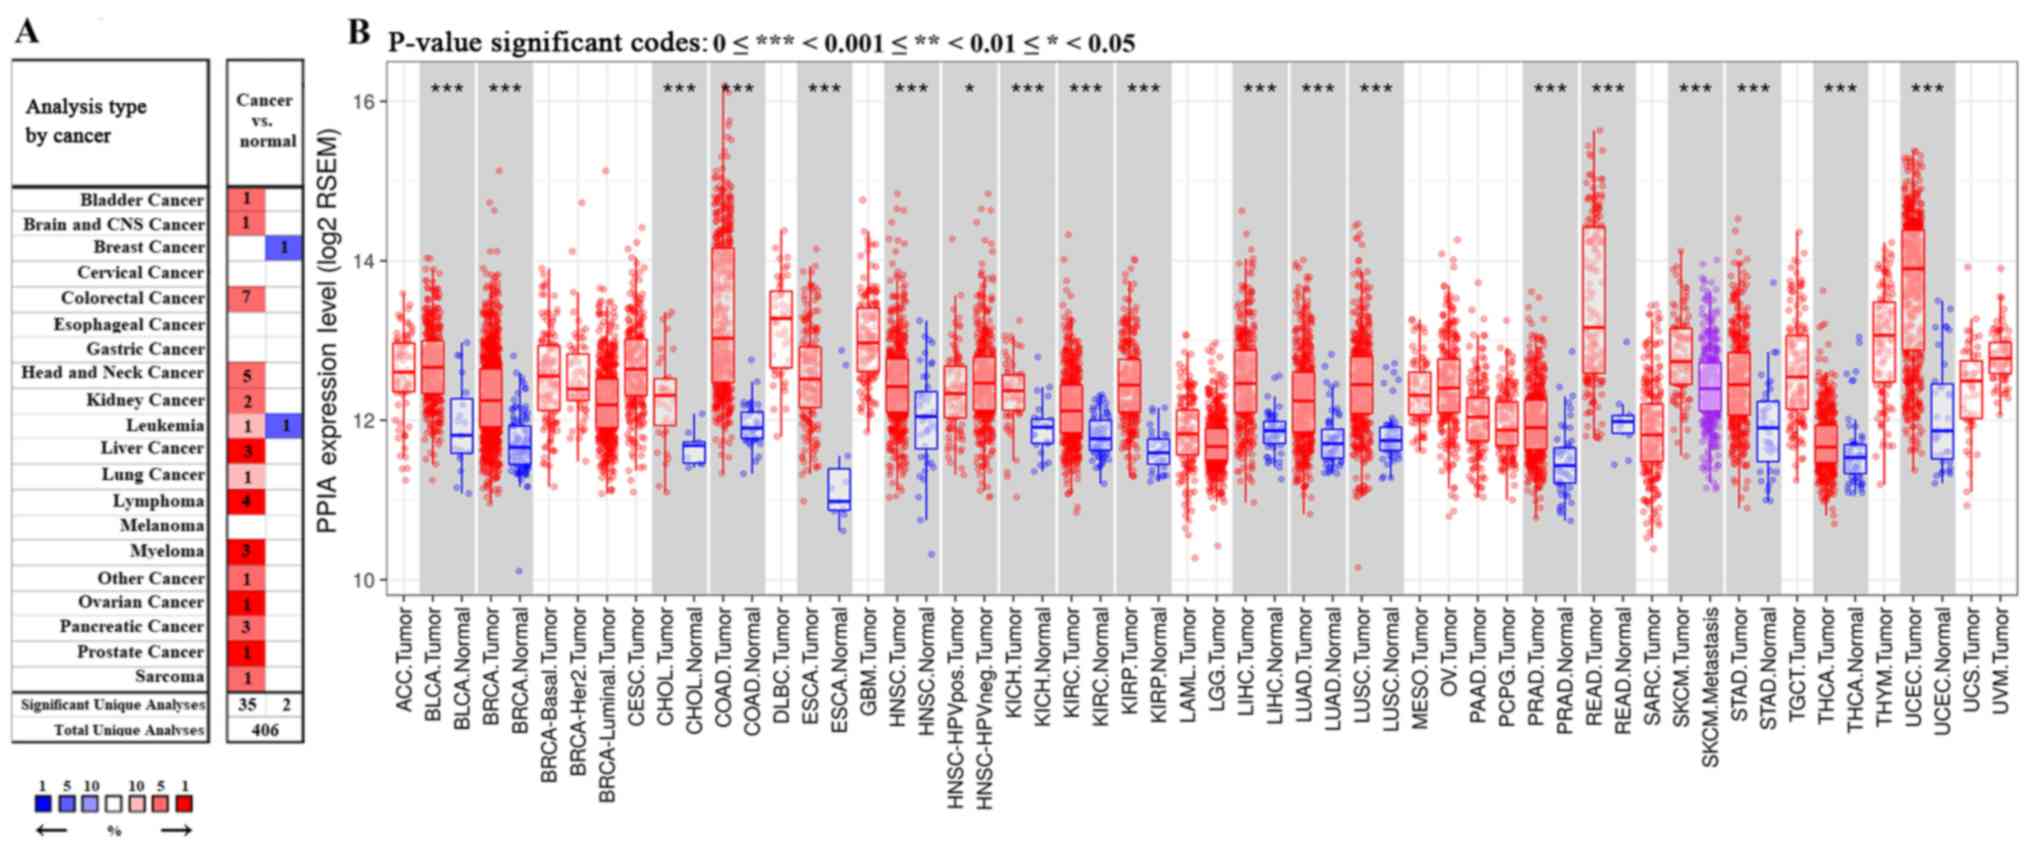
Among the 20 assigned cancer types compared with
normal tissues in the present study, under the criteria of a
fold-change of 1.5, PPIA transcription levels were upregulated in
35 datasets with 15 different types of cancer, including bladder
cancer, brain cancer, colorectal cancer, head and neck cancer,
kidney cancer, leukemia, liver cancer, lung cancer, lymphoma,
myeloma, ovarian cancer, pancreatic cancer, prostate cancer and
sarcoma. The PPIA transcription levels were downregulated in 2
datasets with 2 different types of cancer, including breast cancer
and leukemia in the Oncomine database. In particular, PPIA was
included in the top 1% of those upregulated in the five cancer
types, including liver cancer, lymphoma, myeloma, ovarian cancer
and prostate cancer (Fig. 1A).
Further consultation in TIMER based on The cancer genome atlas
(TCGA) demonstrated that the PPIA transcription levels were all
significantly upregulated in the 17 different types of cancer
available, including bladder cancer, breast cancer, bile duct
carcinoma, colorectal cancer, esophageal carcinoma, head and neck
cancer, kidney chromophobe renal cell carcinoma, kidney renal clear
cell carcinoma, kidney renal papillary cell carcinoma, liver
hepatocellular carcinoma, lung adenocarcinoma, lung squamous cell
carcinoma, prostate adenocarcinoma, rectum adenocarcinoma, stomach
adenocarcinoma, thyroid carcinoma and uterine corpus endometrial
carcinoma, compared with normal adjacent tissue (P<0.001;
Fig. 1B).
Prognostic potential of PPIA
expression levels in cancer
The present study used PrognoScan to identify the
association between PPIA expression levels and cancer prognoses.
The survival rates of patients with lung cancer, breast cancer,
colorectal cancer, brain cancer, ovarian cancer, skin cancer and
blood cancer were associated with PPIA transcription level in
various datasets (Table I).
Overexpression of PPIA was associated with poor relapse free
survival of lung adenocarcinoma in datasets GSE32210 and GSE8894
using various primers, and poor OS in datasets GSE32210, GSE13213,
jacob-00182-UM and GSE13213. The OS in patients with squamous cell
carcinoma of the lung was also associated with PPIA overexpression,
as presented in Table I in dataset
GSE4573 (HR, 5.57). In breast cancer, there was a certain level of
contradiction, although the OS was revealed to be positively
correlated with PPIA expression level (HR, 0.83) in dataset
GSE9893, the other survival values of breast cancer were negatively
correlated with PPIA expression, such as disease free survival in
GSE4922-GPL96 (HR, 6.99 and 6.07 with different primers), relapse
free survival in GSE1456-GPL96 (HR, 7.41 and 7.12 with different
primers), distant metastasis free survival in GSE11121, GSE9195 and
GSE2990, and disease specific survival in GSE3494-GPL96 and
GSE1456-GPL96. These results indicated that overexpression of PPIA
was a risk factor for breast cancer progression and metastasis, and
may be harnessed as a therapeutic target. The overexpression of
PPIA was associated with the survival rates of patients with brain
cancer (HR of OS, 8.47 and 7.34 with different primers), skin
cancer (HR of OS, 209.26 and 151.59 with different primers) and
multiple myeloma (HR of disease specific survival, 2.29; Table I). The only type of cancer where the
survival values were coherently negatively correlated with PPIA
expression was ovarian cancer (HR, 0.20 for OS; HR, 0.29 for
disease free survival in dataset GSE26712) as presented in Table I. The data of the different primers
in colorectal cancer from within the same dataset, GSE17537, were
inconsistent, suggesting additional datasets were required.
 | Table I.Prognostic value of PPIA mRNA
expression in different datasets determined by PrognoScan. |
Table I.
Prognostic value of PPIA mRNA
expression in different datasets determined by PrognoScan.
| Dataset | Cancer type | Endpoint | Corrected
P-value | COX P-value | HR (95% CI) |
|---|
| GSE31210 | LUAD | Relapse free
survival |
1.58×10⁻¹⁰ |
2.98×10⁻¹¹ | 455.47
(74.93–2768.73) |
| GSE31210 | LUAD | Relapse free
survival |
1.36×10⁻¹⁰ |
4.44×10⁻¹¹ | 395.74
(66.79–2344.72) |
| GSE31210 | LUAD | Overall
survival |
2.10×10−06 |
1.94×10−05 | 191.57
(17.18–2136.01) |
| GSE31210 | LUAD | Overall
survival |
4.05×10−05 |
3.09×10−05 | 159.62
(14.68–1735.14) |
| GSE9893 | BRCA | Overall
survival | 0.001131 | 0.000161 | 0.83
(0.75–0.91) |
| GSE13213 | LUAD | Overall
survival | 0.001964 | 0.000172 | 2.55
(1.56–4.15) |
| GSE13213 | LUAD | Overall
survival | 0.001602 | 0.000288 | 2.46
(1.51–3.99) |
| GSE4922-GPL96 | BRCA | Disease free
survival | 0.000787 | 0.00043 | 6.99
(2.37–20.65) |
| GSE8894 | NSCLC | Relapse free
survival | 0.011737 | 0.000637 | 3.50
(1.71–7.19) |
| GSE1456-GPL96 | BRCA | Relapse free
survival | 0.013126 | 0.000821 | 7.41
(2.29–23.98) |
| GSE8894 | NSCLC | Relapse free
survival | 0.020635 | 0.000857 | 3.36
(1.65–6.85) |
| GSE1456-GPL96 | BRCA | Relapse free
survival | 0.006499 | 0.001082 | 7.12
(2.19–23.09) |
| GSE4922-GPL96 | BRCA | Disease Free
survival | 0.002932 | 0.002276 | 6.07
(1.91–19.34) |
| jacob-00182-UM | LUAD | Overall
survival | 0.041268 | 0.002379 | 0.46
(0.28–0.76) |
| GSE11121 | BRCA | Distant metastasis
free survival | 0.01496 | 0.003358 | 17.39
(2.58–117.31) |
| GSE17537 | COADREAD | Disease free
survival | 0.008844 | 0.004248 | 0.01
(0.00–0.20) |
| GSE9195 | BRCA | Distant metastasis
free survival | 0.008393 | 0.004407 | 29.78
(2.88–307.85) |
| GSE26712 | OV | Overall
survival | 0.004054 | 0.004925 | 0.20
(0.06–0.61) |
| GSE4412-GPL96 | LGG | Overall
survival | 0.036877 | 0.004997 | 8.47
(1.91–37.66) |
| GSE9195 | BRCA | Distant metastasis
free survival | 0.024659 | 0.00592 | 26.26
(2.56–269.20) |
| GSE3494-GPL96 | BRCA | Disease specific
survival | 0.047207 | 0.008505 | 6.92
(1.64–29.27) |
| GSE3494-GPL96 | BRCA | Disease specific
survival | 0.002599 | 0.009594 | 5.69
(1.53–21.20) |
| GSE4412-GPL96 | LGG | Overall
survival | 0.000433 | 0.009663 | 7.34
(1.62–33.25) |
| GSE4573 | LUSD | Overall
survival | 0.0207 | 0.010494 | 5.57
(1.49–20.73) |
| GSE1456-GPL96 | BRCA | Disease specific
survival | 0.006336 | 0.013111 | 5.75
(1.44–22.92) |
| GSE2658 | Multiple
myeloma | Disease specific
survival | 0.034132 | 0.013804 | 2.29
(1.18–4.44) |
| GSE13213 | LUAD | Overall
survival | 0.012258 | 0.014126 | 2.17
(1.17–4.02) |
| GSE26712 | OV | Disease free
survival | 0.008361 | 0.016461 | 0.29
(0.11–0.80) |
| GSE13213 | LUAD | Overall
survival | 0.021354 | 0.018883 | 1.94
(1.12–3.37) |
| GSE19234 | SKCM | Overall
survival | 0.002576 | 0.019303 | 209.26
(2.38–18399.93) |
| GSE13213 | LUAD | Overall
survival | 0.012258 | 0.022418 | 2.07
(1.11–3.86) |
| GSE19234 | SKCM | Overall
survival | 0.002576 | 0.023501 | 151.59
(1.97–11682.11) |
| GSE17537 | COADREAD | Disease free
survival | 0.006344 | 0.024266 | 20.40
(1.48–281.27) |
| GSE17537 | COADREAD | Disease free
survival | 0.009107 | 0.026693 | 18.60
(1.40–246.70) |
| GSE13213 | LUAD | Overall
survival | 0.011179 | 0.031871 | 1.83
(1.05–3.17) |
| GSE2990 | BRCA | Distant metastasis
free survival | 0.030163 | 0.044086 | 5.10
(1.04–24.91) |
As these outcomes were obtained from individual
datasets for each type of cancer, the present study used UALCAN for
further investigation into the prognostic potential of PPIA based
on the type of cancer. Poor OS of low-grade glioma (LGG), acute
myeloid leukemia (LMAL), lung adenocarcinoma (LUAD) and skin
cutaneous melanoma (SKCM) were revealed to be associated with PPIA
overexpression with P-values of 0.019, 0.00025, 0.0039 and 0.039,
respectively (Fig. 2A, C, D and E).
Given the lack of LIHC datasets in PrognoScan and the early
indication of the PPIA-LIHC association, the present study also
investigated the LIHC data in UALCAN and Kaplan-Meier Plotter. It
was revealed that overexpression of PPIA was also significantly
correlated with poor OS of LIHC (P<0.0001; Fig. 2B and F).
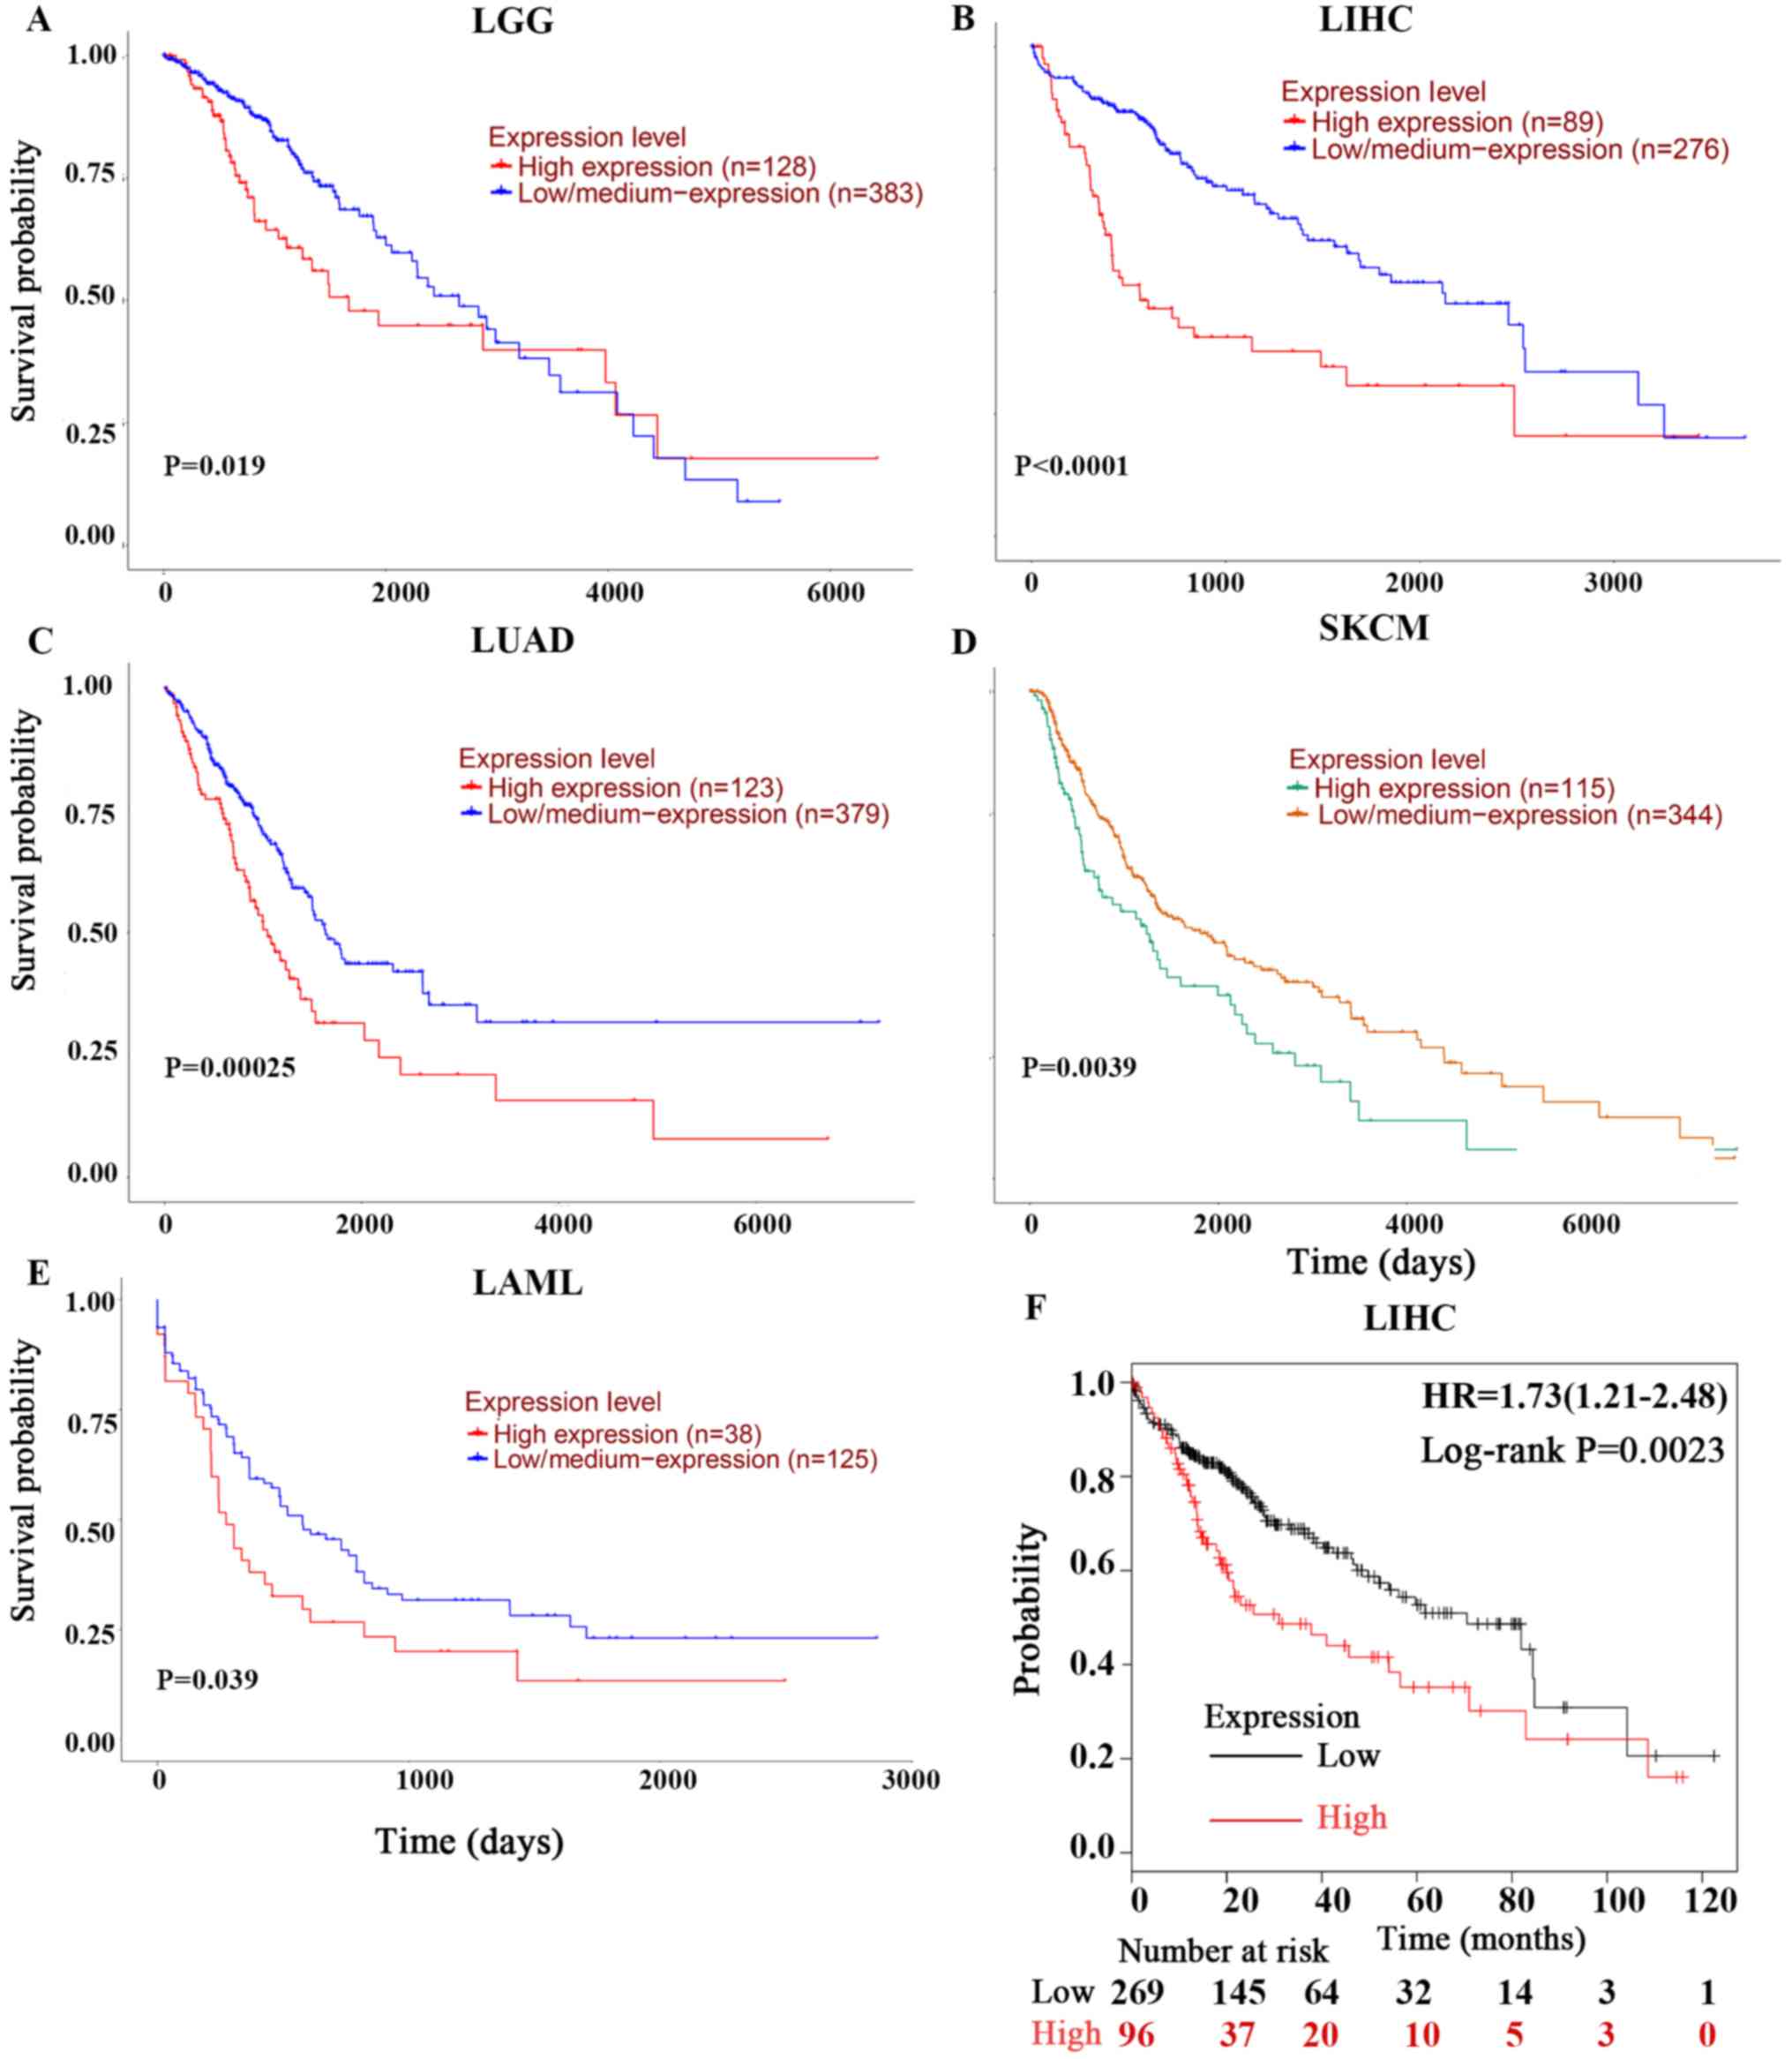 | Figure 2.Kaplan-Meier OS curves of cancer
patients comparing PPIA high and low expression levels by UALCAN
and Kaplan-Meier Plotter. The OS curves of (A) LGG, (B) LIHC, (C)
LUAD, (D) SKCM and (E) LMAL derived from UALCAN. (F) was derived
from Kaplan-Meier Plotter. OS, overall survival; PPIA,
peptidyl-prolyl cis-trans isomerase A; LGG, brain lower grade
glioma; LUAD, lung adenocarcinoma; SKCM, skin cutaneous melanoma;
LIHC, liver hepatocellular carcinoma; LMAL, acute myeloid
leukaemia. |
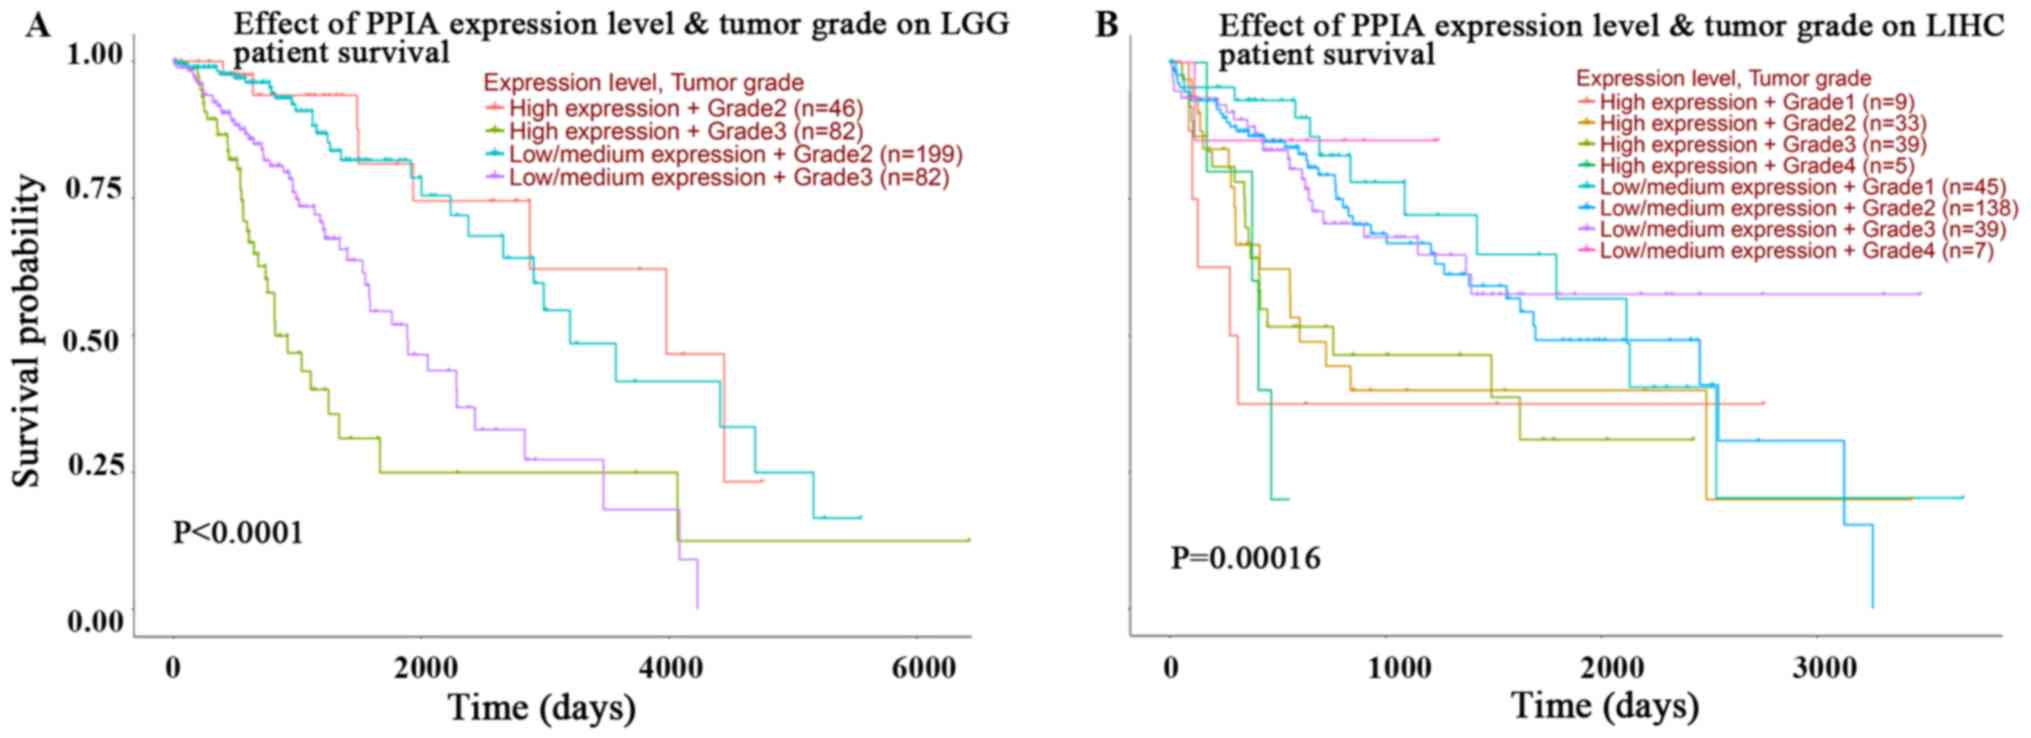
In order to improve the current understanding of the
prognostic effects of PPIA transcription, plots assessing tumor
grade and PPIA transcription level in LGG and LIHC were
investigated using UALCAN. The expression level of PPIA was an
independent and more effective predictor of OS than tumor grade in
LIHC, but not in LGG (Fig. 3A and
B). The prognoses of tumor grade 1, 2, 3 and 4 in those with
high PPIA expression levels were all poorer than the prognoses of
respective tumor grades with low or median PPIA expression levels
in LIHC. The prognosis of low or median PPIA expression in every
tumor grade was better than the prognosis of high PPIA expression
in every tumor grade, as presented in Fig. 3B. Even the prognosis of grade 4
tumors with low or median expression levels of PPIA was better than
the prognosis of grade 1 tumors with high PPIA expression levels,
indicating that the PPIA expression level was an independent
prognostic factor and that the prognostic value was more precise
than the prognostic value of tumor grade in LIHC (Fig. 3B).
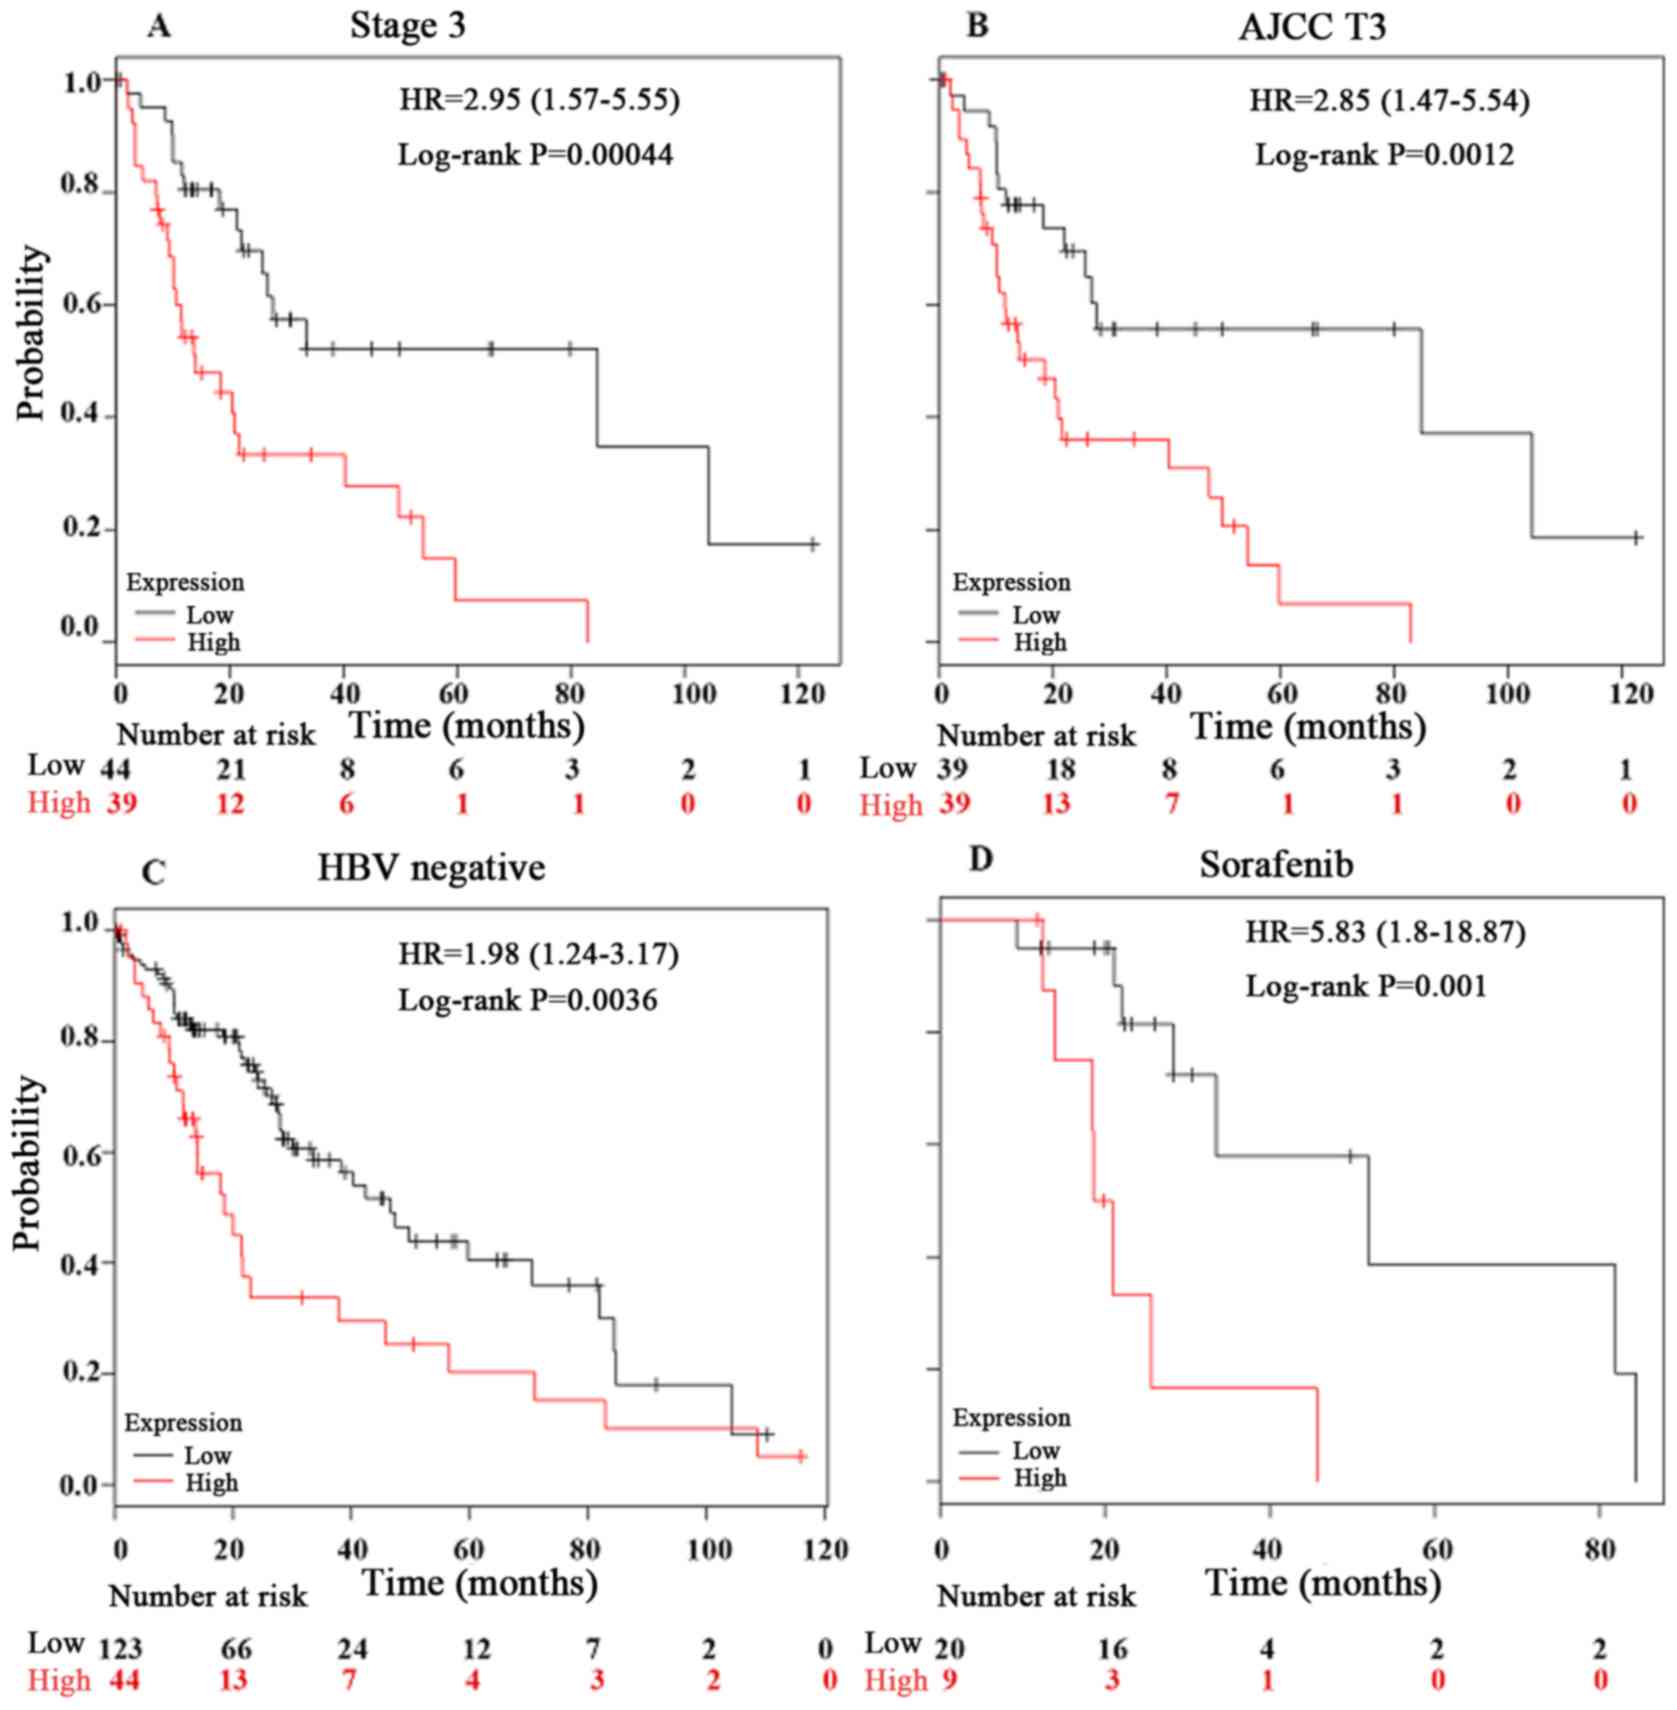
Furthermore, the present study investigated the
prognostic effect of PPIA expression in LIHC in detail using a
Kaplan-Meier Plotter. In the hepatitis B virus (HBV)-free, AJCC T3,
sorafenib-administered and stage 3 tumor groups, the PPIA
expression level was a more robust method of predicting prognosis,
with log rank P-values of 0.0036, 0.0012, 0.001 and 0.00044,
respectively (Fig. 4). The
prognostic value of PPIA overexpression in stage 3 and AJCC T3
groups implied that PPIA played a specific role in advanced LIHC,
and may possess therapeutic value in advanced LIHC. The prognostic
value of PPIA in the sorafenib-administered group also indicated
that PPIA served a specific role in LIHC progression in the poorer
OS subgroup of the sorafenib-administered group, which meant that
PPIA could serve as a therapeutic target specifically for
sorafenib-administered patients with LIHC.
Association between PPIA expression
levels and the immune cell infiltration levels in cancer
The association between PPIA expression levels and
immune cell infiltration levels in the tumor microenvironment was
investigated using TIMER in the present study. The purity of each
solid tumor tested was not associated with PPIA expression level,
suggesting that PPIA was not highly expressed by immune cells in
the tumor microenvironment, but was more likely to be overexpressed
in cancer cells (Table II).
However, certain associations were observed between PPIA expression
level and immune cell infiltration levels, including
CD4+ T cells and macrophages, in four solid tumors,
particularly in LUAD and SKCM (Table
II). By default, TIMER can currently only provide the
information regarding correlations between PPIA expression and B
cells, CD4+ T cells, CD8+ T cells,
macrophages, neutrophils and dendritic cells. In addition to
identifying the correlations between PPIA expression and the
aforementioned cell types, the present study also investigated the
immunomarkers of other immune cells, including natural killer
cells, Treg cells, T cell exhaustion and the expression level of
PPIA in order to gain an accurate representation of the
associations between these immune cells and PPIA expression. The
associations between NK cells, Treg cells, T cell exhaustion and
PPIA expression were weak, with no biomarker observed as uniformly
associated with PPIA expression level (Table III).
| Table II.Correlations between immune
infiltrating cells and peptidyl-prolyl cis-trans isomerase A
transcription level. |
Table II.
Correlations between immune
infiltrating cells and peptidyl-prolyl cis-trans isomerase A
transcription level.
| Cancer | Cell types | Correlation
coefficient | P-value | Statistic
difference | Correlation
strength |
|---|
| LGG | Purity | −0.00865 | 0.850256 | No | Very weak |
|
| B Cell | −0.08926 | 0.051135 | No | Very weak |
|
| CD8+ T
cell | −0.03738 | 0.414905 | No | Very weak |
|
| CD4+ T
cell | −0.16085 | 0.000426 | Yes | Very weak |
|
| Macrophage | −0.19021 |
3.13×10−05 | Yes | Very weak |
|
| Neutrophil | −0.09131 | 0.04671 | Yes | Very weak |
|
| Dendritic cell | −0.05931 | 0.196445 | No | Very weak |
| LIHC | Purity | −0.02851 | 0.59712 | No | Very weak |
|
| B Cell | −0.04497 | 0.405739 | No | Very weak |
|
| CD8+ T
cell | −0.02699 | 0.618908 | No | Very weak |
|
| CD4+ T
cell | −0.21739 |
4.78×10−05 | Yes | Weak |
|
| Macrophage | −0.06422 | 0.236874 | No | Very weak |
|
| Neutrophil | −0.18394 | 0.000596 | Yes | Very weak |
|
| Dendritic cell | −0.1004 | 0.064432 | No | Very weak |
| LUAD | Purity | 0.090959 | 0.043308 | Yes | Very weak |
|
| B Cell | −0.27619 |
6.36×10⁻¹⁰ | Yes | Weak |
|
| CD8+ T
cell | −0.12476 | 0.005834 | Yes | Very weak |
|
| CD4+ T
cell | −0.38104 |
3.58×10⁻¹⁸ | Yes | Weak |
|
| Macrophage | −0.25887 |
7.24×10−09 | Yes | Weak |
|
| Neutrophil | −0.24369 |
5.84×10−08 | Yes | Weak |
|
| Dendritic cell | −0.21245 |
2.19×10−06 | Yes | Weak |
| SKCM | Purity | 0.038591 | 0.409982 | No | Very weak |
|
| B Cell | −0.13361 | 0.004615 | Yes | Very weak |
|
| CD8+ T
cell | −0.3377 |
3.82×10⁻¹³ | Yes | Weak |
|
| CD4+ T
cell | −0.33597 |
3.14×10⁻¹³ | Yes | Weak |
|
| Macrophage | −0.36791 |
5.75×10⁻¹⁶ | Yes | Weak |
|
| Neutrophil | −0.46714 |
7.02×10⁻²⁶ | Yes | Moderate |
| | Dendritic cell | −0.34575 |
5.73×10⁻¹⁴ | Yes | Weak |
| Table III.Correlation between transcription
levels of immune markers and peptidyl-prolyl cis-trans isomerase
A. |
Table III.
Correlation between transcription
levels of immune markers and peptidyl-prolyl cis-trans isomerase
A.
| Cancer type | Cell type | Genes | Correlation | P-value | Correlation
strength |
|---|
| LGG | NK | KIR3DL1 | 0.0015 | 0.97385 | Very weak |
|
|
| KIR2DS4 | 0.0112 | 0.80683 | Very weak |
|
|
| KIR2DL1 | 0.0820 | 0.07294 | Very weak |
|
|
| KIR3DL2 | 0.0208 | 0.64963 | Very weak |
|
|
| KIR2DL3 | 0.0412 | 0.36846 | Very weak |
|
|
| NCR2 | −0.0379 | 0.40798 | Very weak |
|
|
| CD244 | 0.1050 | 0.02149 | Very weak |
| | Treg | FOXP3 | −0.0679 | 0.13784 | Very weak |
|
| T cell
exhaustion | PDCD1 | 0.0772 | 0.09136 | Very weak |
| |
| IL10 | −0.0735 | 0.10823 | Very weak |
| LIHC | NK | KIR3DL1 | −0.1743 | 0.00113 | Very weak |
|
|
| KIR2DS4 | −0.0291 | 0.58918 | Very weak |
|
|
| KIR2DL1 | 0.0016 | 0.97592 | Very weak |
|
|
| KIR3DL2 | −0.0103 | 0.84931 | Very weak |
|
|
| KIR2DL3 | −0.0264 | 0.62414 | Very weak |
|
|
| NCR2 | 0.0622 | 0.24882 | Very weak |
|
|
| CD244 | 0.0603 | 0.26366 | Very weak |
| | Treg | FOXP3 | −0.2146 |
5.72×10−05 | Weak |
|
| T cell
exhaustion | PDCD1 | 0.0626 | 0.24587 | Very weak |
|
|
| IL10 | 0.0189 | 0.72558 | Very weak |
| LUAD | NK | KIR3DL1 | −0.0965 | 0.03209 | Very weak |
|
|
| KIR2DS4 | −0.0593 | 0.18822 | Very weak |
|
|
| KIR2DL1 | −0.0846 | 0.06032 | Very weak |
|
|
| KIR3DL2 | −0.0348 | 0.44042 | Very weak |
|
|
| KIR2DL3 | −0.0415 | 0.35798 | Very weak |
|
|
| NCR2 | −0.0189 | 0.67590 | Very weak |
|
|
| CD244 | −0.0532 | 0.23789 | Very weak |
| | Treg | FOXP3 | −0.0824 | 0.06729 | Very weak |
|
| T cell
exhaustion | PDCD1 | −0.0166 | 0.71271 | Very weak |
|
|
| IL10 | −0.0876 | 0.05174 | Very weak |
| SKCM | NK | KIR3DL1 | −0.0635 | 0.17510 | Very weak |
|
|
| KIR2DS4 | −0.0132 | 0.77886 | Very weak |
|
|
| KIR2DL1 | −0.0452 | 0.33463 | Very weak |
|
|
| KIR3DL2 | −0.1534 | 0.00099 | Very weak |
|
|
| KIR2DL3 | −0.1012 | 0.03030 | Very weak |
|
|
| NCR2 | −0.0941 | 0.04414 | Very weak |
|
|
| CD244 | −0.1413 | 0.00244 | Very weak |
| | Treg | FOXP3 | −0.0960 | 0.04015 | Very weak |
|
| T cell
exhaustion | PDCD1 | −0.1698 | 0.00027 | Very weak |
| |
| IL10 | −0.3034 |
3.33×10⁻¹¹ | Weak |
PPIA expression level is correlated
with BSG and STAT3 expression levels
BSG, STAT3 and ITK were reported to interact with
PPIA on the protein level, and so the present study further
investigated the associations between the expression levels of PPIA
and these genes. BSG and STAT3 were correlated with PPIA in each
cancer type, with a positive correlation for BSG, and a negative
correlation for STAT3 (Fig. 5). The
expression levels of ITK were negatively correlated with PPIA in
LIHC, LUAD and SKCM, but not LGG (Fig.
5).
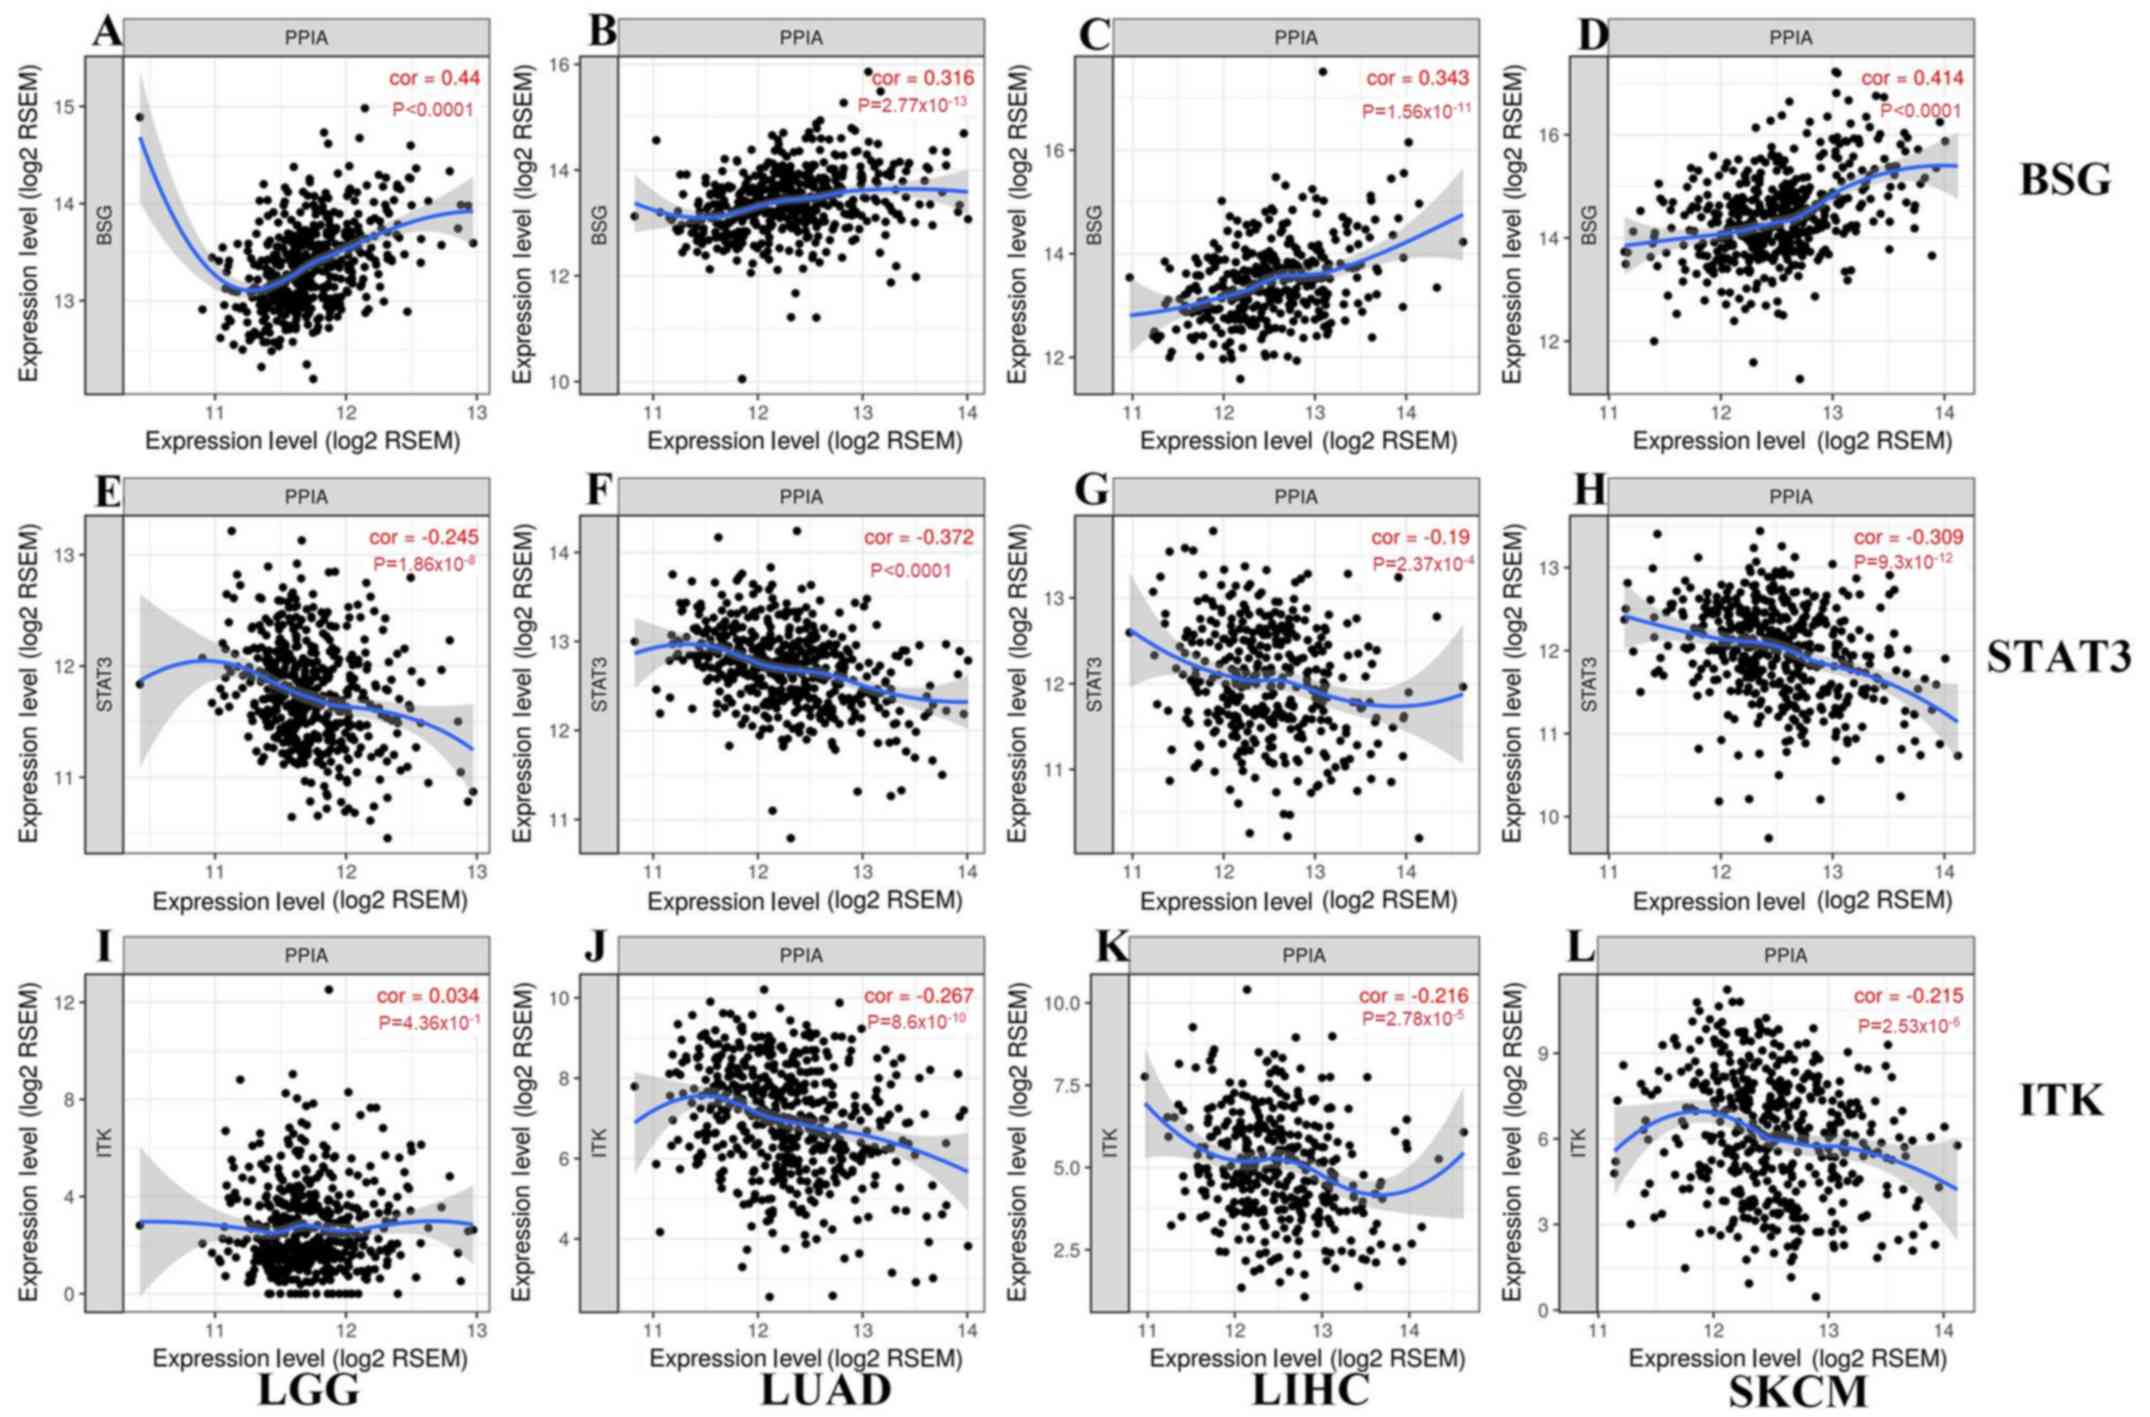 | Figure 5.Correlations between transcription
levels of BSG, STAT3, ITK and PPIA in each cancer type generated
from TIMER. As shown in (A-D) and (E-H), BSG and STAT3 correlated
with PPIA in each cancer type, with a (A-D) positive correlation
for BSG, and a (E-H) negative correlation for STAT3. As shown in
(J-L) and (I), the expression levels of ITK were negatively
correlated with PPIA in (K) LIHC, (J) LUAD and (L) SKCM, but not
(I) LGG. LGG, brain lower grade glioma; LIHC, liver hepatocellular
carcinoma; STAT3, signal transducer and activator of transcription
3; TIMER, Tumor IMmune Estimation Resource; BSG, basigin; PPIA,
peptidyl-prolyl cis-trans isomerase A; ITK, interleukin-2 tyrosine
kinase; LUAD, lung adenocarcinoma; SKCM, skin cutaneous
melanoma. |
Discussion
In the present study, the expression level of PPIA
was observed to be associated with the survival of patients with
different types of cancer by narrowing down cancer types in various
databases. The OS of patients with LGG, LMAL, LUAD, SKCM and LIHC
were associated with PPIA expression level. The OS of LIHC was
revealed to be highly associated with PPIA expression and the
prognostic effect was independent of tumor grade. The disease free
survival, relapse free survival, distant metastasis free survival
and disease specific survival of breast cancer were also negatively
associated with PPIA expression level.
Sorafenib was reported to improve the OS of
inoperable patients with LIHC (HR, 0.69), although PFS was not
improved (4). The OS of patients
with high PPIA expression levels was significantly decreased
compared with patients with low PPIA expression levels in the
sorafenib-administered group. This indicated that PPIA played a
specific role in the progression of LIHC in the poorer OS subgroup
of the sorafenib-administered group and that inhibition of PPIA
expression or PPIA inhibitor ciclosporin A may be beneficial for
sorafenib-administered patients. The association between PPIA
transcription level and OS of LIHC groups of
sorafenib-administered, HBV-free, AJCC T3 and stage 3 tumors was
more profound, suggesting that the high value of PPIA expression
level could act as a prognostic factor and demonstrates the
potential of PPIA as a new therapeutic target for advanced LIHC in
these settings.
There was no negative correlation observed between
tumor purity levels and the expression levels of PPIA in the
different types of cancer, suggesting that PPIA was not highly
expressed in immune cells in the tumor microenvironment, but was
more likely to be highly expressed in cancer cells. Notably, in the
cancer types with more positive correlations between tumor purity
and PPIA expression, the negative correlations between immune cells
and PPIA expression levels tended to be more visible, which also
implied that the PPIA expression upregulation occurred in cancer
cells rather than background immune cells. PPIA has been reported
to be ubiquitously expressed in all 27 normal tissues tested
(47). Furthermore, PPIA could be
secreted from cancer cells, such as head and neck squamous cell
carcinoma and HBV-positive hepatoma cell spontaneously, or from
epithelial breast cancer cells by irradiation (48–50).
PPIA was reported to interact with BSG, which could
lead to decreased activity and proliferation of lymphocytes
(19,51,52),
causing immune inhibition of cancer cells. Studies by Lu et
al (53) and de la Iglesia et
al (54) demonstrated that BSG
overexpression was highly associated with poor prognosis of lung
adenocarcinoma and breast cancer by stimulating the production of
matrix metalloproteinases. Zhao et al (55) demonstrated that downregulation of BSG
induced malignant melanoma cell apoptosis via the regulation of
IGFBP2 expression. Lu et al (53) revealed that basolateral CD147 induced
hepatocyte polarity loss by E-cadherin ubiquitination and
degradation in the progression of hepatocellular carcinoma.
Consistent with previous studies (19,51,52), the
present study demonstrated that high PPIA expression levels in
different types of cancer were positively correlated with high BSG
expression and negatively correlated with high immune cell
infiltrates, which could be a reason for the lower OS compared with
patients with low PPIA expression levels.
Previous studies indicated that STAT3 interacts with
PPIA (23), suppressing PTEN
loss-induced malignant cell transformation in astrocytes (54) and impairing invasiveness of
intestinal tumors (56,57). The results of the present study
revealed an inferior OS rate in the high PPIA and low STAT3
expression groups coincided with the results of the aforementioned
studies.
ITK is a protein tyrosine kinase that participates
in the intracellular signaling events leading to T cell activation
and it is highly expressed in T cells (58). The activity of ITK could be silenced
by PPIA (12). The present study
demonstrated that the PPIA expression levels was negatively
correlated with CD4+ T cell counts in three types of
cancer tissue, with LGG excluded, which, according to previous
studies (12,58), means that the expression levels of
PPIA and ITK should be negatively correlated. ITK expression was
negatively correlated with PPIA expression in three different types
of cancer, with the exception of LGG. Further investigations into
the literature revealed that glioblastoma and other types of cancer
introduced into the intracranial compartment could harbor
AIDS-level CD4 counts, which may be due to the sequestration of T
cells caused by S1P1 loss from the T cell surface (59). A similar phenomenon occurred in
immune cell infiltration, with CD4+ T cells being
negatively correlated with PPIA expression at a weak level in three
other types of cancer and the association with LGG was demonstrated
to be very weak, with a correlation coefficient of −0.16085.
Previous studies demonstrated that in inflammation, extracellular
PPIA could recruit leukocytes by interacting with CD147. However,
in the cancer-infiltrating environment, this aspect of PPIA has not
yet been studied and according to the results of the present study,
this leukocyte chemoattractant effect of PPIA in the tumor
infiltrating environment was not as strong as in the inflammation
environment demonstrated by former studies (19,60–62),
suggesting that there may be other stronger effectors in the tumor
environment. CD4+ T cells expressing more CD147 migrated
more readily to PPIA (60). The
association between PPIA and neutrophils remains to be elucidated.
The neutrophils in SKCM were moderately correlated with PPIA
expression in the present study, which to the best of our
knowledge, has not yet been reported, despite the abundance of
studies indicating that neutrophils regulated by CXCL5 played an
important role in the progression of melanoma (63–65).
Table III presents the
associations between PPIA expression and biomarkers of natural
killer cells, Treg cells and T cell exhaustion in the four
different types of cancer, which were very weak, with only two
exceptions of Treg cells in LIHC and IL10 in SKCM, which were both
weakly correlated with PPIA expression.
To conclude, the present study demonstrated that
PPIA expression was upregulated in all 17 types of cancer assessed
when compared with normal tissues. The upregulation of PPIA was
associated with poor OS of patients with LGG, LMAL, LUAD, SKCM and
LIHC. In LIHC, the upregulation was strongly associated with poor
overall of patients in the HBV-free, AJCC T3,
sorafenib-administered and tumor stage 3 groups, and the prognostic
effect was independent of tumor grade. The expression of PPIA in
these types of cancer may have a negative effect by interacting
with BSG and STAT3.
Acknowledgements
Not applicable.
Funding
The present study was supported by the National Key
Research and Development Program of China (grant no.
2018YFC1313200) and the Key Research and Development Program of
Shandong Province (grant no. 2016CYJS01A03).
Availability of data and materials
The datasets generated and/or analyzed during the
current study are available in the Gene Expression Omnibus
(www.ncbi.nlm.nih.gov/geo) and The Cancer
Genome Atlas (www.cancer.gov/about-nci/organization/ccg/research/structural-genomics/tcga)
repositories.
Authors' contributions
JY and SW designed the study. SW, ML and LX
performed the data analyses and drafted the manuscript. ML, LX, SW
and JY revised the paper. All the authors approved the final
version of the manuscript and agreed to be accountable for all
aspects of the work.
Ethics approval and consent to
participate
The present study was reviewed and approved by the
Institutional Review Board of Shandong Cancer Hospital affiliated
to Shandong University.
Patient consent for publication
Not applicable.
Competing interests
The authors declare that they have no competing
interests.
Glossary
Abbreviations
Abbreviations:
|
LIHC
|
liver hepatocellular carcinoma
|
|
LGG
|
low grade glioma
|
|
LMAL
|
acute myeloid leukemia
|
|
LUAD
|
lung adenocarcinoma
|
|
SKCM
|
skin cutaneous melanoma
|
|
PPIA
|
peptidyl-prolyl cis-trans isomerase
A
|
|
BSG (CD147)
|
basigin
|
|
STAT3
|
signal transducer and activator of
transcription 3
|
|
ITK
|
interleukin-2 tyrosine kinase
|
|
NK
|
natural killer
|
|
Treg
|
regulatory T cell
|
|
TCGA
|
the cancer genome atlas
|
References
|
1
|
Moore LE, Fung ET, McGuire M, Rabkin CC,
Molinaro A, Wang Z, Zhang F, Wang J, Yip C, Meng XY and Pfeiffer
RM: Evaluation of apolipoprotein A1 and posttranslationally
modified forms of transthyretin as biomarkers for ovarian cancer
detection in an independent study population. Cancer Epidemiol
Biomarkers Prev. 15:1641–1646. 2006. View Article : Google Scholar : PubMed/NCBI
|
|
2
|
Ahmed I and Lobo DN: Malignant tumours of
the liver. Surgery. 25:34–41. 2009.
|
|
3
|
Bruix J and Sherman M; American
Association for the Study of Liver Diseases, : Management of
hepatocellular carcinoma: An update. Hepatology. 53:1020–1022.
2011. View Article : Google Scholar : PubMed/NCBI
|
|
4
|
Llovet JM, Ricci S, Mazzaferro V, Hilgard
P, Gane E, Blanc JF, de Oliveira AC, Santoro A, Raoul JL, Forner A,
et al: Sorafenib in advanced hepatocellular carcinoma. N Engl J
Med. 359:378–390. 2008. View Article : Google Scholar : PubMed/NCBI
|
|
5
|
Haendler B and Hofer E: Characterization
of the human cyclophilin gene and of related processed pseudogenes.
Eur J Biochem. 190:477–482. 1990. View Article : Google Scholar : PubMed/NCBI
|
|
6
|
Holzman TF, Egan DA, Edalji R, Simmer RL,
Helfrich R, Taylor A and Burres NS: Preliminary characterization of
a cloned neutral isoelectric form of the human peptidyl prolyl
isomerase cyclophilin. J Biol Chem. 266:2474–2479. 1991.PubMed/NCBI
|
|
7
|
Hoffmann H and Schiene-Fischer C:
Functional aspects of extracellular cyclophilins. Biol Chem.
395:721–735. 2014. View Article : Google Scholar : PubMed/NCBI
|
|
8
|
Ramachandran S, Venugopal A, Kutty VR, A
V, G D, Chitrasree V, Mullassari A, Pratapchandran NS, Santosh KR,
Pillai MR and Kartha CC: Plasma level of cyclophilin A is increased
in patients with type 2 diabetes mellitus and suggests presence of
vascular disease. Cardiovasc Diabetol. 13:382014. View Article : Google Scholar : PubMed/NCBI
|
|
9
|
Wei Y, Jinchuan Y, Yi L, Jun W, Zhongqun W
and Cuiping W: Antiapoptotic and proapoptotic signaling of
cyclophilin A in endothelial cells. Inflammation. 36:567–572. 2013.
View Article : Google Scholar : PubMed/NCBI
|
|
10
|
Kazui T, Inoue N, Yamada O and Komatsu S:
Selective cerebral perfusion during operation for aneurysms of the
aortic arch: A reassessment. Ann Thorac Surg. 53:109–114. 1992.
View Article : Google Scholar : PubMed/NCBI
|
|
11
|
Nigro P, Pompilio G and Capogrossi MC:
Cyclophilin A: A key player for human disease. Cell Death Dis.
4:e8882013. View Article : Google Scholar : PubMed/NCBI
|
|
12
|
Brazin KN, Mallis RJ, Fulton DB and
Andreotti AH: Regulation of the tyrosine kinase Itk by the
peptidyl-prolyl isomerase cyclophilin A. Proc Natl Acad Sci USA.
99:1899–1904. 2002. View Article : Google Scholar : PubMed/NCBI
|
|
13
|
Kasinrerk W, Fiebiger E, Stefanová I,
Baumruker T, Knapp W and Stockinger H: Human leukocyte activation
antigen M6, a member of the Ig superfamily, is the species
homologue of rat OX-47, mouse basigin, and chicken HT7 molecule. J
Immunol. 149:847–854. 1992.PubMed/NCBI
|
|
14
|
Yurchenko V, Constant S and Bukrinsky M:
Dealing with the family: CD147 interactions with cyclophilins.
Immunology. 117:301–309. 2006. View Article : Google Scholar : PubMed/NCBI
|
|
15
|
Miyauchi T, Masuzawa Y and Muramatsu T:
The basigin group of the immunoglobulin superfamily: Complete
conservation of a segment in and around transmembrane domains of
human and mouse basigin and chicken HT7 antigen. J Biochem.
110:770–774. 1991. View Article : Google Scholar : PubMed/NCBI
|
|
16
|
Kanekura T, Chen X and Kanzaki T: Basigin
(CD147) is expressed on melanoma cells and induces tumor cell
invasion by stimulating production of matrix metalloproteinases by
fibroblasts. Int J Cancer. 99:520–528. 2002. View Article : Google Scholar : PubMed/NCBI
|
|
17
|
Jin ZG, Lungu AO, Xie L, Wang M, Wong C
and Berk BC: Cyclophilin A is a proinflammatory cytokine that
activates endothelial cells. Arterioscler Thromb Vasc Biol.
24:1186–1191. 2004. View Article : Google Scholar : PubMed/NCBI
|
|
18
|
Seko Y, Fujimura T, Taka H, Mineki R,
Murayama K and Nagai R: Hypoxia followed by reoxygenation induces
secretion of cyclophilin A from cultured rat cardiac myocytes.
Biochem Biophys Res Commun. 317:162–168. 2004. View Article : Google Scholar : PubMed/NCBI
|
|
19
|
Yurchenko V, Zybarth G, O'Connor M, Dai
WW, Franchin G, Hao T, Guo H, Hung HC, Toole B, Gallay P, et al:
Active site residues of cyclophilin A are crucial for its signaling
activity via CD147. J Biol Chem. 277:22959–22965. 2002. View Article : Google Scholar : PubMed/NCBI
|
|
20
|
Kim SH, Lessner SM, Sakurai Y and Galis
ZS: Cyclophilin A as a novel biphasic mediator of endothelial
activation and dysfunction. Am J Pathol. 164:1567–1574. 2004.
View Article : Google Scholar : PubMed/NCBI
|
|
21
|
Yang H, Li M, Chai H, Yan S, Lin P,
Lumsden AB, Yao Q and Chen C: Effects of cyclophilin A on cell
proliferation and gene expressions in human vascular smooth muscle
cells and endothelial cells. J Surg Res. 123:312–319. 2005.
View Article : Google Scholar : PubMed/NCBI
|
|
22
|
Obchoei S, Sawanyawisuth K, Wongkham C,
Kasinrerk W, Yao Q, Chen C and Wongkham S: Secreted cyclophilin A
mediates G1/S phase transition of cholangiocarcinoma cells via
CD147/ERK1/2 pathway. Tumour Biol. 36:849–859. 2015. View Article : Google Scholar : PubMed/NCBI
|
|
23
|
Bauer K, Kretzschmar AK, Cvijic H, Blumert
C, Löffler D, Brocke-Heidrich K, Schiene-Fischer C, Fischer G, Sinz
A, Clevenger CV and Horn F: Cyclophilins contribute to Stat3
signaling and survival of multiple myeloma cells. Oncogene.
28:2784–2795. 2009. View Article : Google Scholar : PubMed/NCBI
|
|
24
|
Lee J and Kim SS: Current implications of
cyclophilins in human cancers. J Exp Clin Cancer Res. 29:972010.
View Article : Google Scholar : PubMed/NCBI
|
|
25
|
Ye Y, Huang A, Huang C, Liu J, Wang B, Lin
K, Chen Q, Zeng Y, Chen H, Tao X, et al: Comparative mitochondrial
proteomic analysis of hepatocellular carcinoma from patients.
Proteomics Clin Appl. 7:403–415. 2013. View Article : Google Scholar : PubMed/NCBI
|
|
26
|
Schwanhäusser B, Busse D, Li N, Dittmar G,
Schuchhardt J, Wolf J, Chen W and Selbach M: Global quantification
of mammalian gene expression control. Nature. 473:337–342. 2011.
View Article : Google Scholar : PubMed/NCBI
|
|
27
|
Schwanhäusser B, Busse D, Li N, Dittmar G,
Schuchhardt J, Wolf J, Chen W and Selbach M: Corrigendum: Global
quantification of mammalian gene expression control. Nature.
495:126–127. 2013. View Article : Google Scholar : PubMed/NCBI
|
|
28
|
Li JJ and Biggin MD: Gene expression.
Statistics requantitates the central dogma. Science. 347:1066–1067.
2015. View Article : Google Scholar : PubMed/NCBI
|
|
29
|
Morimoto S and Yahara K: Identification of
stress responsive genes by studying specific relationships between
mRNA and protein abundance. Heliyon. 4:e005582018. View Article : Google Scholar : PubMed/NCBI
|
|
30
|
Liu Y, Beyer A and Aebersold R: On the
dependency of cellular protein levels on mRNA abundance. Cell.
165:535–550. 2016. View Article : Google Scholar : PubMed/NCBI
|
|
31
|
Rhodes DR, Yu J, Shanker K, Deshpande N,
Varambally R, Ghosh D, Barrette T, Pandey A and Chinnaiyan AM:
ONCOMINE: A cancer microarray database and integrated data-mining
platform. Neoplasia. 6:1–6. 2004. View Article : Google Scholar : PubMed/NCBI
|
|
32
|
Pan JH, Zhou H, Cooper L, Huang JL, Zhu
SB, Zhao XX, Ding H, Pan YL and Rong L: LAYN is a prognostic
biomarker and correlated with immune infiltrates in gastric and
colon cancers. Front Immunol. 10:62019. View Article : Google Scholar : PubMed/NCBI
|
|
33
|
Mizuno H, Kitada K, Nakai K and Sarai A:
PrognoScan: A new database for meta-analysis of the prognostic
value of genes. BMC Med Genomics. 2:182009. View Article : Google Scholar : PubMed/NCBI
|
|
34
|
Chandrashekar DS, Bashel B, Balasubramanya
SAH, Creighton CJ, Ponce-Rodriguez I, Chakravarthi BVSK and
Varambally S: UALCAN: A portal for facilitating tumor subgroup gene
expression and survival analyses. Neoplasia. 19:649–658. 2017.
View Article : Google Scholar : PubMed/NCBI
|
|
35
|
Menyhárt O, Nagy Á and Győrffy B:
Determining consistent prognostic biomarkers of overall survival
and vascular invasion in hepatocellular carcinoma. R Soc Open Sci.
5:1810062018. View Article : Google Scholar : PubMed/NCBI
|
|
36
|
Li T, Fan J, Wang B, Traugh N, Chen Q, Liu
JS, Li B and Liu XS: TIMER: A web server for comprehensive analysis
of tumor-infiltrating immune cells. Cancer Res. 77:e108–e110. 2017.
View Article : Google Scholar : PubMed/NCBI
|
|
37
|
Li B, Severson E, Pignon JC, Zhao H, Li T,
Novak J, Jiang P, Shen H, Aster JC, Rodig S, et al: Comprehensive
analyses of tumor immunity: Implications for cancer immunotherapy.
Genome Biol. 17:1742016. View Article : Google Scholar : PubMed/NCBI
|
|
38
|
Graef T, Moesta AK, Norman PJ, Abi-Rached
L, Vago L, Older Aguilar AM, Gleimer M, Hammond JA, Guethlein LA,
Bushnell DA, et al: KIR2DS4 is a product of gene conversion with
KIR3DL2 that introduced specificity for HLA-A*11 while diminishing
avidity for HLA-C. J Exp Med. 206:2557–2572. 2009. View Article : Google Scholar : PubMed/NCBI
|
|
39
|
Vivian JP, Duncan RC, Berry R, O'Connor
GM, Reid HH, Beddoe T, Gras S, Saunders PM, Olshina MA, Widjaja JM,
et al: Killer cell immunoglobulin-like receptor 3DL1-mediated
recognition of human leukocyte antigen B. Nature. 479:401–405.
2011. View Article : Google Scholar : PubMed/NCBI
|
|
40
|
Goodridge JP, Burian A, Lee N and Geraghty
DE: HLA-F and MHC class I open conformers are ligands for NK cell
Ig-like receptors. J Immunol. 191:3553–3562. 2013. View Article : Google Scholar : PubMed/NCBI
|
|
41
|
Cantoni C, Bottino C, Vitale M, Pessino A,
Augugliaro R, Malaspina A, Parolini S, Moretta L, Moretta A and
Biassoni R: NKp44, a triggering receptor involved in tumor cell
lysis by activated human natural killer cells, is a novel member of
the immunoglobulin superfamily. J Exp Med. 189:787–796. 1999.
View Article : Google Scholar : PubMed/NCBI
|
|
42
|
Eissmann P, Beauchamp L, Wooters J, Tilton
JC, Long EO and Watzl C: Molecular basis for positive and negative
signaling by the natural killer cell receptor 2B4 (CD244). Blood.
105:4722–4729. 2005. View Article : Google Scholar : PubMed/NCBI
|
|
43
|
Hori S, Nomura T and Sakaguchi S: Control
of regulatory T cell development by the transcription factor Foxp3.
Science. 299:1057–1061. 2003. View Article : Google Scholar : PubMed/NCBI
|
|
44
|
Fontenot JD, Gavin MA and Rudensky AY:
Foxp3 programs the development and function of CD4+CD25+ regulatory
T cells. Nat Immunol. 4:330–336. 2003. View
Article : Google Scholar : PubMed/NCBI
|
|
45
|
Fontenot JD, Rasmussen JP, Williams LM,
Dooley JL, Farr AG and Rudensky AY: Regulatory T cell lineage
specification by the forkhead transcription factor foxp3. Immunity.
22:329–341. 2005. View Article : Google Scholar : PubMed/NCBI
|
|
46
|
Wherry EJ: T cell exhaustion. Nat Immunol.
12:492–499. 2011. View Article : Google Scholar : PubMed/NCBI
|
|
47
|
Fagerberg L, Hallström BM, Oksvold P,
Kampf C, Djureinovic D, Odeberg J, Habuka M, Tahmasebpoor S,
Danielsson A, Edlund K, et al: Analysis of the human
tissue-specific expression by genome-wide integration of
transcriptomics and antibody-based proteomics. Mol Cell Proteomics.
13:397–406. 2014. View Article : Google Scholar : PubMed/NCBI
|
|
48
|
Chevalier F, Depagne J, Hem S, Chevillard
S, Bensimon J, Bertrand P and Lebeau J: Accumulation of cyclophilin
A isoforms in conditioned medium of irradiated breast cancer cells.
Proteomics. 12:1756–1766. 2012. View Article : Google Scholar : PubMed/NCBI
|
|
49
|
Ralhan R, Masui O, Desouza LV, Matta A,
Macha M and Siu KW: Identification of proteins secreted by head and
neck cancer cell lines using LC-MS/MS: Strategy for discovery of
candidate serological biomarkers. Proteomics. 11:2363–2376. 2011.
View Article : Google Scholar : PubMed/NCBI
|
|
50
|
Tian X, Zhao C, Zhu H, She W, Zhang J, Liu
J, Li L, Zheng S, Wen YM and Xie Y: Hepatitis B virus (HBV) surface
antigen interacts with and promotes cyclophilin a secretion:
Possible link to pathogenesis of HBV infection. J Virol.
84:3373–3381. 2010. View Article : Google Scholar : PubMed/NCBI
|
|
51
|
Igakura T, Kadomatsu K, Taguchi O,
Muramatsu H, Kaname T, Miyauchi T, Yamamura K, Arimura K and
Muramatsu T: Roles of basigin, a member of the immunoglobulin
superfamily, in behavior as to an irritating odor, lymphocyte
response, and blood-brain barrier. Biochem Biophys Res Commun.
224:33–36. 1996. View Article : Google Scholar : PubMed/NCBI
|
|
52
|
Staffler G, Szekeres A, Schütz GJ, Säemann
MD, Prager E, Zeyda M, Drbal K, Zlabinger GJ, Stulnig TM and
Stockinger H: Selective inhibition of T cell activation via CD147
through novel modulation of lipid rafts. J Immunol. 171:1707–1714.
2003. View Article : Google Scholar : PubMed/NCBI
|
|
53
|
Lu M, Wu J, Hao ZW, Shang YK, Xu J, Nan G,
Li X, Chen ZN and Bian H: Basolateral CD147 induces hepatocyte
polarity loss by E-cadherin ubiquitination and degradation in
hepatocellular carcinoma progress. Hepatology. 68:317–332. 2018.
View Article : Google Scholar : PubMed/NCBI
|
|
54
|
de la Iglesia N, Konopka G, Puram SV, Chan
JA, Bachoo RM, You MJ, Levy DE, Depinho RA and Bonni A:
Identification of a PTEN-regulated STAT3 brain tumor suppressor
pathway. Genes Dev. 22:449–462. 2008. View Article : Google Scholar : PubMed/NCBI
|
|
55
|
Zhao S, Wu L, Kuang Y, Su J, Luo Z, Wang
Y, Li J, Zhang J, Chen W, Li F, et al: Downregulation of CD147
induces malignant melanoma cell apoptosis via the regulation of
IGFBP2 expression. Int J Oncol. 53:2397–2408. 2018.PubMed/NCBI
|
|
56
|
Lee J, Kim JC, Lee SE, Quinley C, Kim H,
Herdman S, Corr M and Raz E: Signal transducer and activator of
transcription 3 (STAT3) protein suppresses adenoma-to-carcinoma
transition in Apcmin/+ mice via regulation of Snail-1 (SNAI)
protein stability. J Biol Chem. 287:18182–18189. 2012. View Article : Google Scholar : PubMed/NCBI
|
|
57
|
Musteanu M, Blaas L, Mair M, Schlederer M,
Bilban M, Tauber S, Esterbauer H, Mueller M, Casanova E, Kenner L,
et al: Stat3 is a negative regulator of intestinal tumor
progression in Apc(Min) mice. Gastroenterology.
138:1003–1011.e1-e5. 2010. View Article : Google Scholar : PubMed/NCBI
|
|
58
|
Gomez-Rodriguez J, Kraus ZJ and
Schwartzberg PL: Tec family kinases Itk and Rlk/Txk in T
lymphocytes: Cross-regulation of cytokine production and T-cell
fates. FEBS J. 278:1980–1989. 2011. View Article : Google Scholar : PubMed/NCBI
|
|
59
|
Chongsathidkiet P, Jackson C, Koyama S,
Loebel F, Cui X, Farber SH, Woroniecka K, Elsamadicy AA, Dechant
CA, Kemeny HR, et al: Sequestration of T cells in bone marrow in
the setting of glioblastoma and other intracranial tumors. Nat Med.
24:1459–1468. 2018. View Article : Google Scholar : PubMed/NCBI
|
|
60
|
Damsker JM, Bukrinsky MI and Constant SL:
Preferential chemotaxis of activated human CD4+ T cells by
extracellular cyclophilin A. J Leukoc Biol. 82:613–618. 2007.
View Article : Google Scholar : PubMed/NCBI
|
|
61
|
Sherry B, Yarlett N, Strupp A and Cerami
A: Identification of cyclophilin as a proinflammatory secretory
product of lipopolysaccharide-activated macrophages. Proc Natl Acad
Sci USA. 89:3511–3515. 1992. View Article : Google Scholar : PubMed/NCBI
|
|
62
|
Xu Q, Leiva MC, Fischkoff SA,
Handschumacher RE and Lyttle CR: Leukocyte chemotactic activity of
cyclophilin. J Biol Chem. 267:11968–11971. 1992.PubMed/NCBI
|
|
63
|
Forsthuber A, Lipp K, Andersen L,
Ebersberger S, Graña-Castro ', Ellmeier W, Petzelbauer P,
Lichtenberger BM and Loewe R: CXCL5 as regulator of neutrophil
function in cutaneous melanoma. J Invest Dermatol. 139:186–194.
2019. View Article : Google Scholar : PubMed/NCBI
|
|
64
|
Drewes CC, Alves AC, Hebeda CB, Copetti I,
Sandri S, Uchiyama MK, Araki K, Guterres SS, Pohlmann AR and Farsky
SH: Role of poly(ε-caprolactone) lipid-core nanocapsules on
melanoma-neutrophil crosstalk. Int J Nanomedicine. 12:7153–7163.
2017. View Article : Google Scholar : PubMed/NCBI
|
|
65
|
Hölzel M and Tüting T:
Inflammation-induced plasticity in melanoma therapy and metastasis.
Trends Immunol. 37:364–374. 2016. View Article : Google Scholar : PubMed/NCBI
|