Introduction
Gastric cancer (GC) is the second most common
malignancy in Eastern Asia (particularly in Korea, Mongolia, Japan,
and China) and has a five-years survival rate as low as 31.5%
(1). The histopathological type is
an independent prognostic factor in GC, and a predictor of lymph
node metastasis (2–6). Different histopathological types have
distinct clinical outcomes and unique biological characteristics.
The overall survival (OS) rate for patients with
well-differentiated GC is higher than that for patients with poorly
differentiated GC. Moreover, different types are associated with
specific molecular mechanisms, treatment strategies and prognoses
(7–9). However, the exact causes and mechanisms
involved in the different types remain unclear. Therefore, it is
necessary to further investigate the mechanisms underlying GC
differentiation.
Weighted gene co-expression network analysis (WGCNA)
has been used to explore the correlations between clinical features
of disease and gene clusters (10).
WGCNA transforms gene expression data into co-expression modules
and provides insights into signaling networks that may be
responsible for clinical indicators of tumor progression, including
tumor stages, grades and metastasis (11–13).
WGCNA is a comprehensive collection of R functions (14), and is widely used to identify
candidate biomarkers or therapeutic targets (15,16). In
the present study, a co-expression module was constructed using
expression data from patients with GC of different histological
grades. Gene Ontology (GO) enrichment analysis was subsequently
performed on selected modules to identify the hub genes, which may
serve as potential therapeutic, diagnostic or prognostic
markers.
Materials and methods
Preparation of genetic and clinical
data
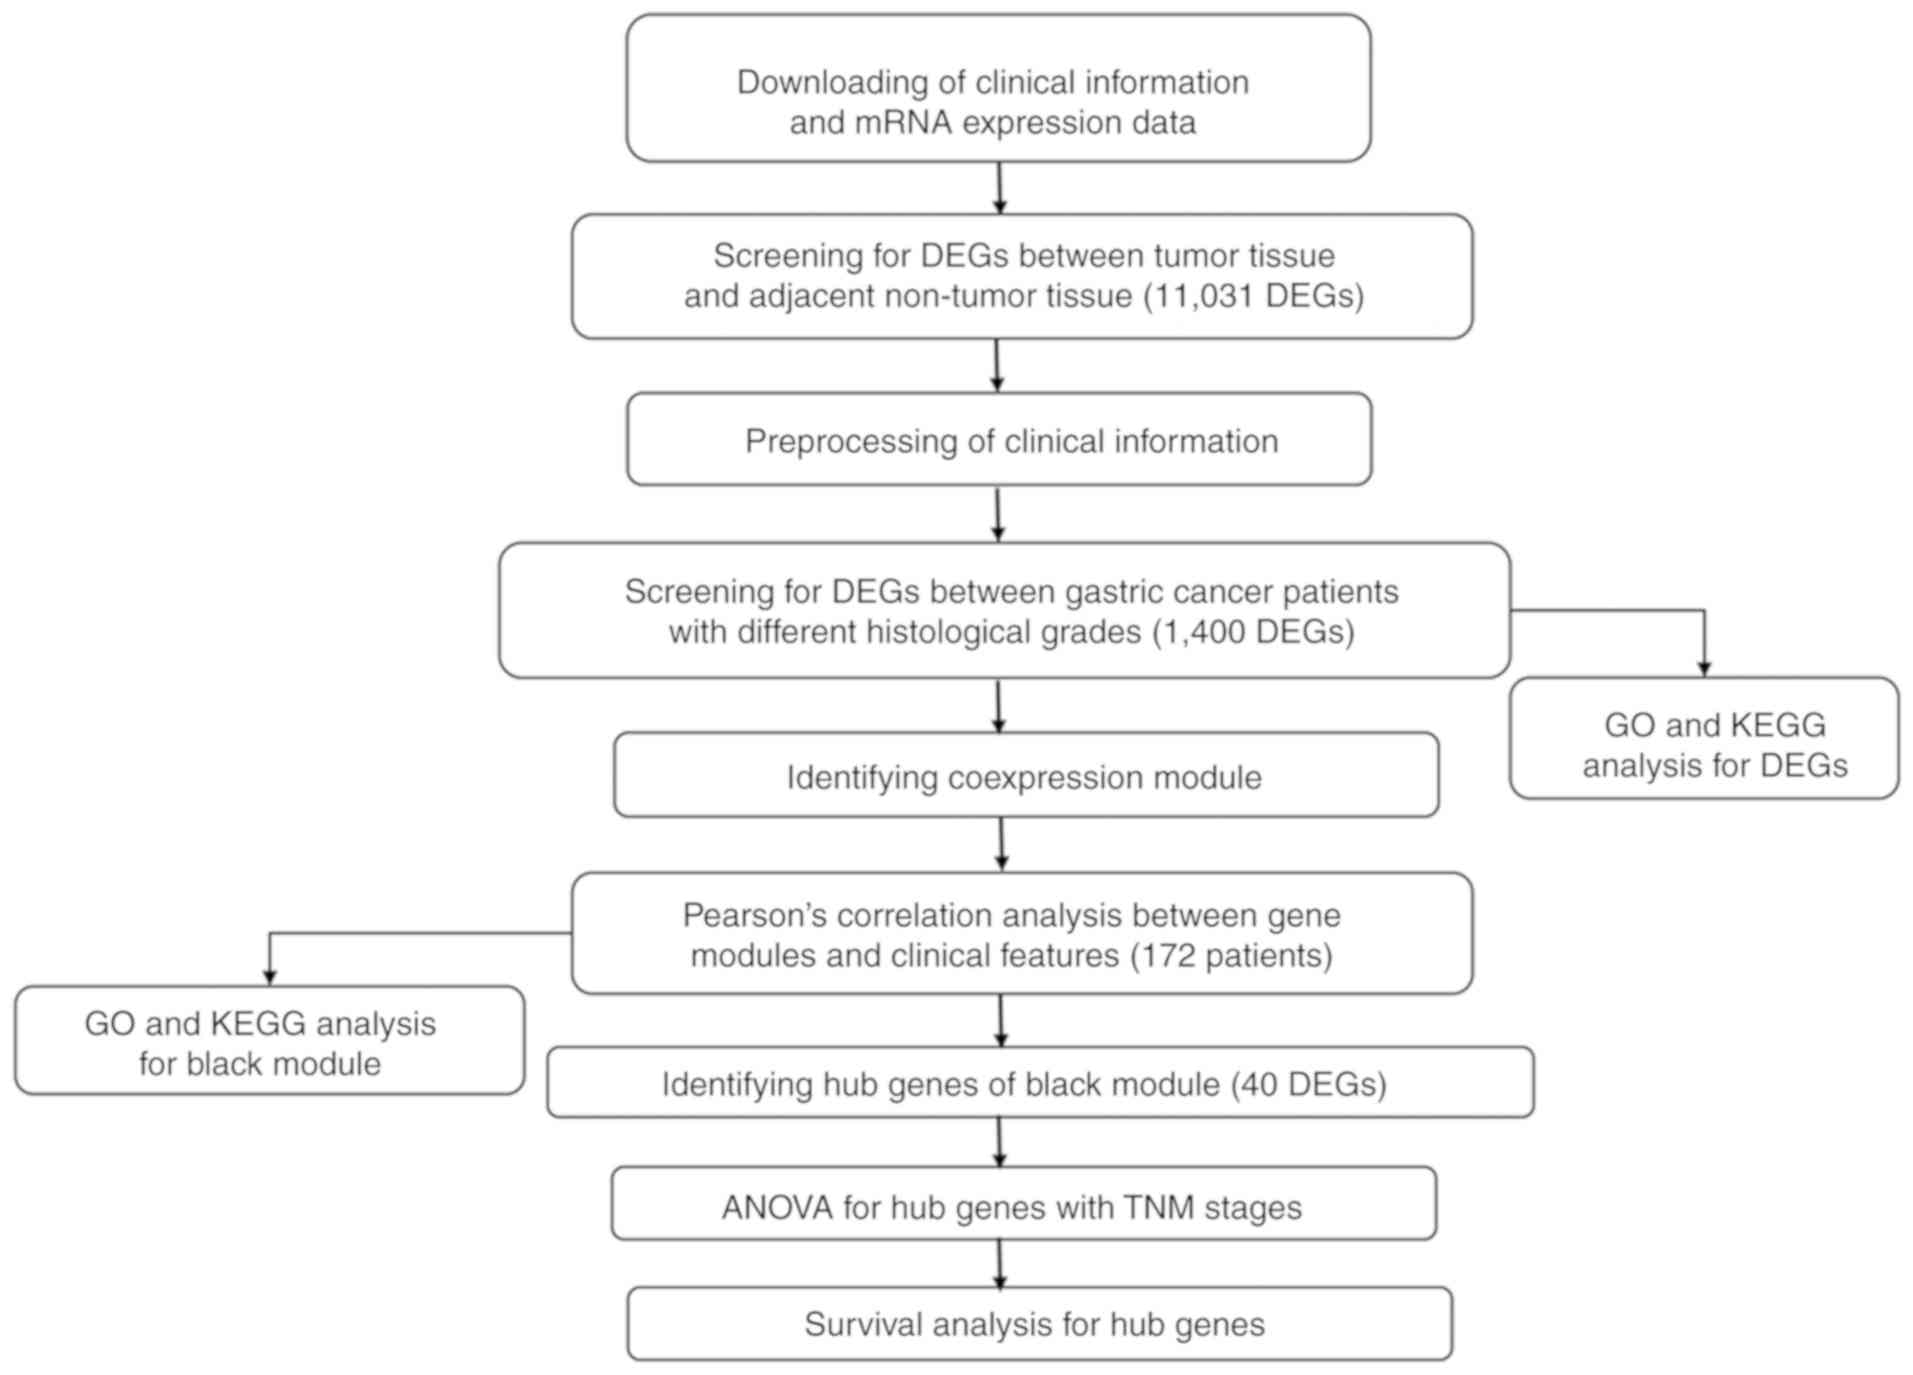
The workflow for the current study is presented in
Fig. 1. The TCGA database included
the mRNA sequencing data of 32 normal stomach samples and 376
stomach adenocarcinoma samples, and the clinical data of 408
patients with STAD. Level-3 RNA sequencing data were obtained using
an Illumina HiSeq RNAseq v2 RSEM platform. Patients without
complete histological grade information were eliminated and 366
patients were available for the next screen. Patients without
complete follow-up information or complete clinical information
were excluded. A total of 172 patients were included in the WGCNA
analysis. Other clinical information, including neoplasm
histological grade, American Joint Committee on Cancer pathological
tumor-node-metastasis (TNM) stage (17) and anatomic neoplasm subdivision, were
retrieved for WGCNA analysis.
Screening for differentially expressed
genes (DEGs)
R (version 3.4.2) and RStudio (version 1.1.383)
(18,19) and two R packages (limma and edgeR,
Bioconductor version 3.6; bioconductor.org/), were used to identify DEGs between
cancer and normal samples. Additionally, patients were divided into
poorly- and moderately/well-differentiated groups to identify the
DEGs associated tumor differentiation. The DEG threshold was set at
an adjusted P<0.05 and a log2 fold-change >2.
Gene co-expression network
construction and module analysis
The gradient method was used to test the
independence and average connectivity of different modules with
different power values (10). The
power values ranged from 1 to 20. The appropriate power value was
determined when the degree of independence was 0.9 which was set to
eight in the present study, and the module construction was
continued using the WGCNA algorithm. In addition, the corresponding
gene information for each module was extracted. The WGCNA algorithm
may be used to identify co-expression modules (10). WGCNA was implemented in the R package
(WGCNA Version 1.68; cloud.r-project.org/) and the heatmaps package
(Bioconductor version, 3.6) was used to analyze the strength of
interactions.
Identification of the module of
interest and functional annotation
The correlation between the modules and the clinical
features such as TNM Stage, OS, Division and Grade were assessed by
the Pearson's correlation test. Modules with the highest
correlation with clinical features were selected as modules of
interest. To explore the potential mechanisms by which the genes
affect the relevant clinical features, all genes in the module of
interest were uploaded to the Database for Annotation,
Visualization, and Integrated Discovery (DAVID version 6.8,
david.ncifcrf.gov/) (20) and subjected to GO functional
(geneontology.org/)and Kyoto Encyclopedia of Genes
and Genomes (KEGG, http://www.kegg.jp/). The specific cut-off used for
terms and pathways was 0.05.
Hub gene identification and
correlation analysis
The modules of interest were visualized using
Cytoscape software (version 3.6.0; cytoscape.org/), and the top ten genes with the
greatest number of edges were identified as the hub genes (21). A one-way ANOVA with a post-hoc
Dunnett's test was used to test for associations between hub genes
and the corresponding clinical features (SPSS version 21; IBM
Corp.). The patients were subsequently divided into two groups
based on the expression of each hub gene (high vs. low; cut-off
point, 50%). Survival analysis was performed for all hub genes
using the survival package (version 2.42–3, cloud.r-project.org/) in R (22). Kaplan-Meier analysis and a log-rank
test were used to assess the effect of hub gene expression on
overall survival time. In addition, the online software
Kaplan-Meier plotter (kmplot.com/analysis) (23), which performs log-rank tests based on
data from Gene Expression Omnibus (GEO) datasets (GSE14210,
GSE15459, GSE22377, GSE29272, GSE51105 and GSE62254), was used for
further verification.
Results
DEGs screening
DEG analysis was performed on the RNA sequencing
data of 376 STAD tissues and 32 adjacent non-tumor tissue samples
and a total of 11,031 DEGs were identified using edgeR and limma.
The tumor samples were subsequently divided into two groups
according to the histological grade: i) The poorly differentiated
group (219 samples); ii) and the moderately to well-differentiated
group (147 samples). A total of 1,400 DEGs (836 upregulated and 564
downregulated) were identified.
Functional annotation of DEGs between
patients with poorly and moderately to well-differentiated GC
To explore the functional significance of DEGs in GC
differentiation, the aforementioned 1,400 DEGs were subjected to
unbiased GO term and KEGG pathway enrichment analyses. For DEGs
associated with GC differentiation, the terms ‘digestion’ [false
discovery rate (FDR)=2.08×10−04], ‘extracellular space’
(FDR=4.97×10⁻²¹) and ‘structural molecule activity’
(FDR=8.54×10−09) were the most significantly enriched
biological process, cellular component and molecular function,
respectively, while ‘neuroactive ligand-receptor interaction’ was
the most significantly enriched pathway (Table I).
 | Table I.List of the top GO terms and KEGG
pathways in DEGs. |
Table I.
List of the top GO terms and KEGG
pathways in DEGs.
| A, GO biological
process |
|---|
|
|---|
| Term | Gene count | P-Value | FDR |
|---|
| GO:0007586
digestion | 15 |
1.17×10−07 |
2.08×10−04 |
| GO:0010951 negative
regulation of endopeptidase activity | 17 |
2.12×10−05 |
3.70×10−02 |
| GO:0002027
regulation of heart rate | 9 |
3.20×10−05 |
5.70×10−02 |
| GO:1903779
regulation of cardiac conduction | 11 |
5.77×10−05 |
1.02×10−01 |
| GO:0006936 muscle
contraction | 15 |
7.72×10−05 |
1.37×10−01 |
|
| B, Cellular
component |
|
| Term | Gene
count | P-Value | FDR |
|
| GO:0005615
extracellular space | 136 |
3.61×10⁻²⁴ |
4.97×10⁻²¹ |
| GO:0005576
extracellular region | 149 |
8.50×10⁻²³ |
1.17×10⁻¹⁹ |
| GO:0030018 Z
disc | 23 |
1.44×10−09 |
1.99×10−06 |
| GO:0072562 blood
microparticle | 24 |
3.90×10−08 |
5.37×10−05 |
| GO:0043204
perikaryon | 17 |
4.67×10−06 |
6.00×10−03 |
|
| C, GO molecular
function |
|
| Term | Gene
count | P-Value | FDR |
|
| GO:0005198
structural molecule activity | 37 |
5.61×10⁻¹² |
8.54×10−09 |
| GO:0008201 heparin
binding | 24 |
5.09×10−08 |
7.74×10−05 |
| GO:0005179 hormone
activity | 18 |
9.67×10−08 |
1.47×10−04 |
| GO:0008307
structural constituent of muscle | 9 |
1.71×10−04 |
2.60×10−01 |
| GO:0005102 receptor
binding | 29 |
2.54×10−04 |
3.85×10−01 |
|
| D, KEGG
analysis |
|
| Pathway | Gene
count | P-Value | FDR |
|
|
hsa04080:Neuroactive ligand-receptor
interaction | 28 |
4.48×10−06 |
6.00×10−03 |
| hsa04970:Salivary
secretion | 14 |
1.67×10−05 |
2.10×10−02 |
| hsa04971:Gastric
acid secretion | 10 |
1.50×10−03 | 1.96 |
| hsa04972:Pancreatic
secretion | 11 |
2.50×10−03 | 3.11 |
| hsa04610:Complement
and coagulation cascades | 9 |
4.10×10−03 | 5.15 |
Co-expression network construction and
module analysis
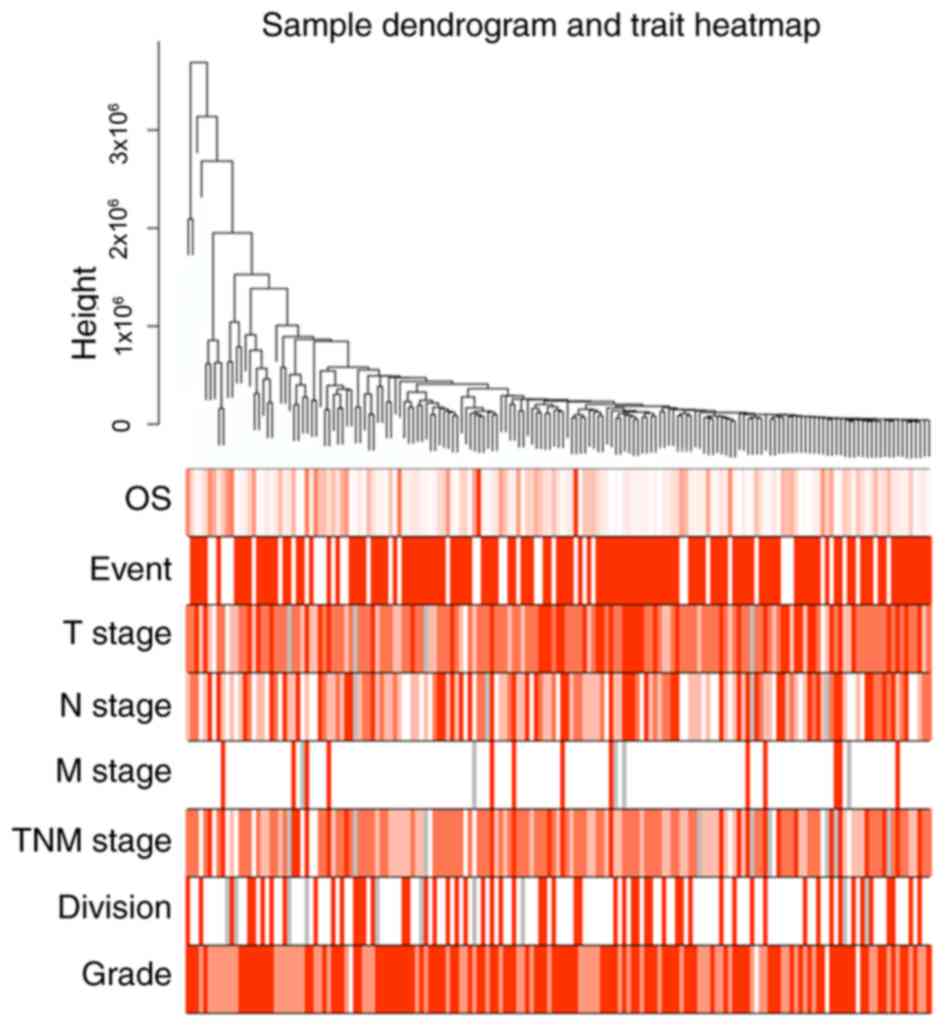
To explore the functional modules in patients with
GC with different histological grades, the 1,400 DEGs were
subjected to WGCNA. Clinical characters, including neoplasm
histological grade, TNM stage and anatomic neoplasm subdivision,
were retrieved for WGCNA analysis. A total of 172 patients were
included in the WGCNA (Fig. 2).
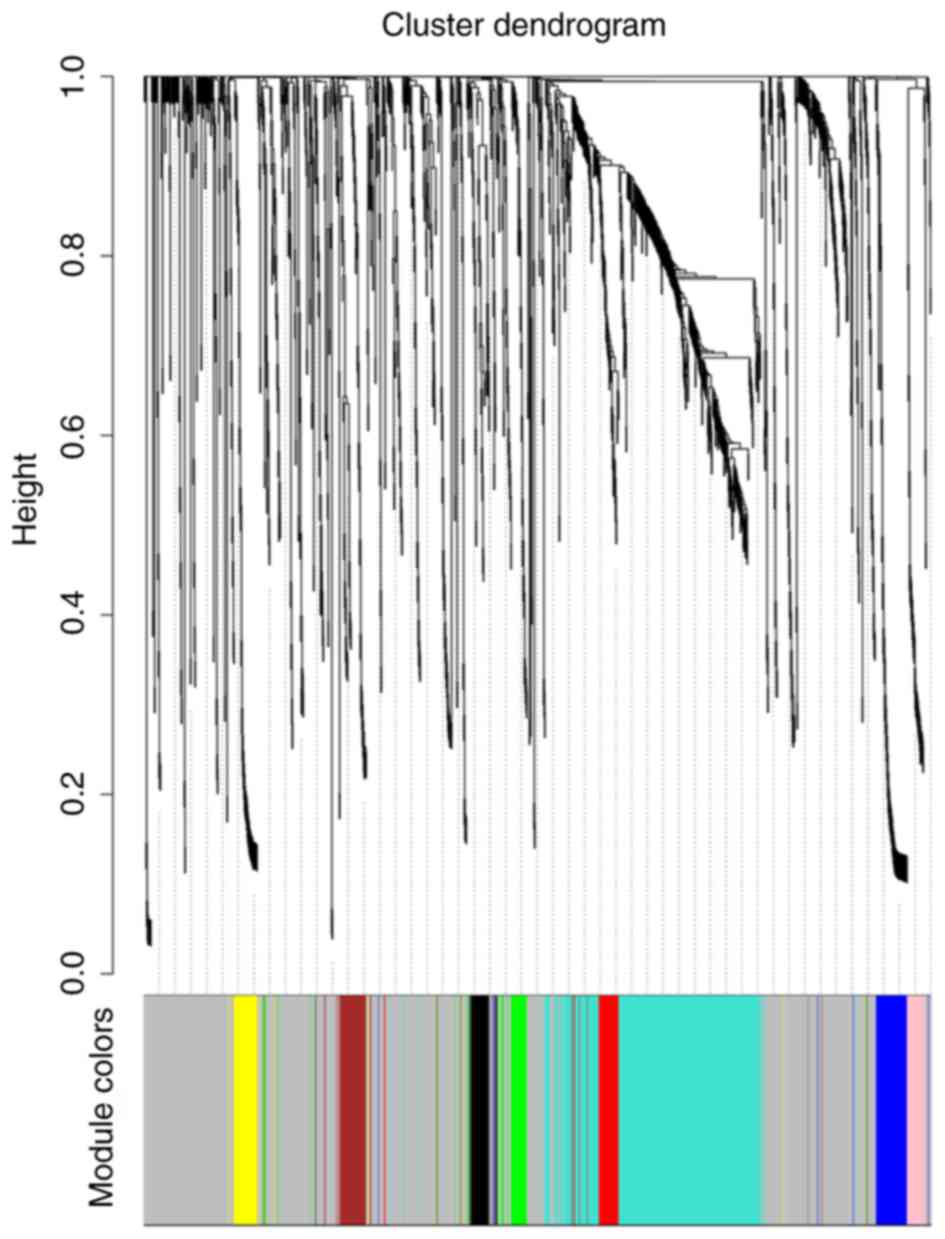
Three outlier samples were discarded. The connectivity between the
genes in the gene network satisfied the scale-free network
distribution (Fig. S1). Nine
co-expressed modules, ranging in size from 34 to 734 genes, were
subsequently identified. Each module was assigned a color for
reference. The grey module was reserved for genes that had been
identified as not co-expressed (Figs.
3 and S2). The genes in each
module are listed in Table SI.
Identification of key modules and
functional annotation
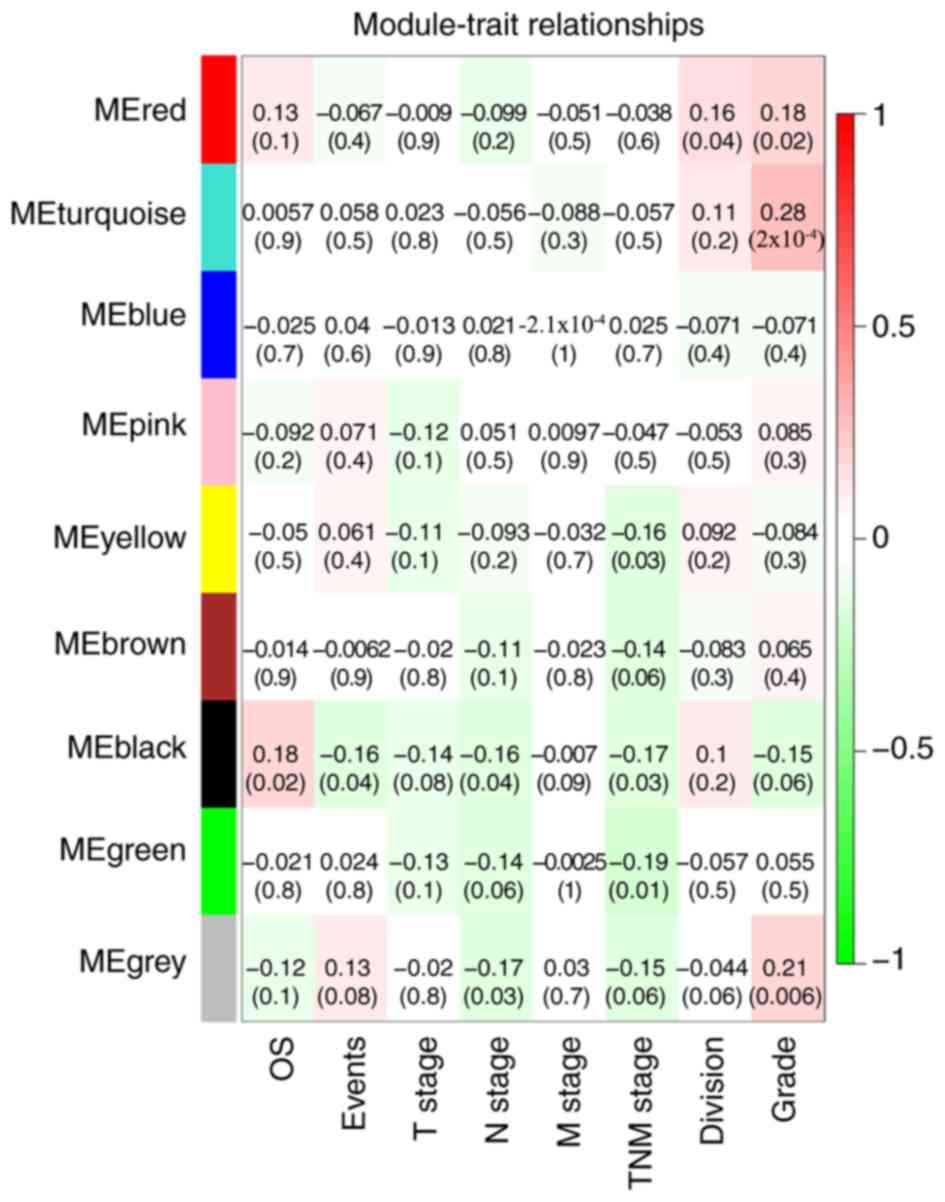
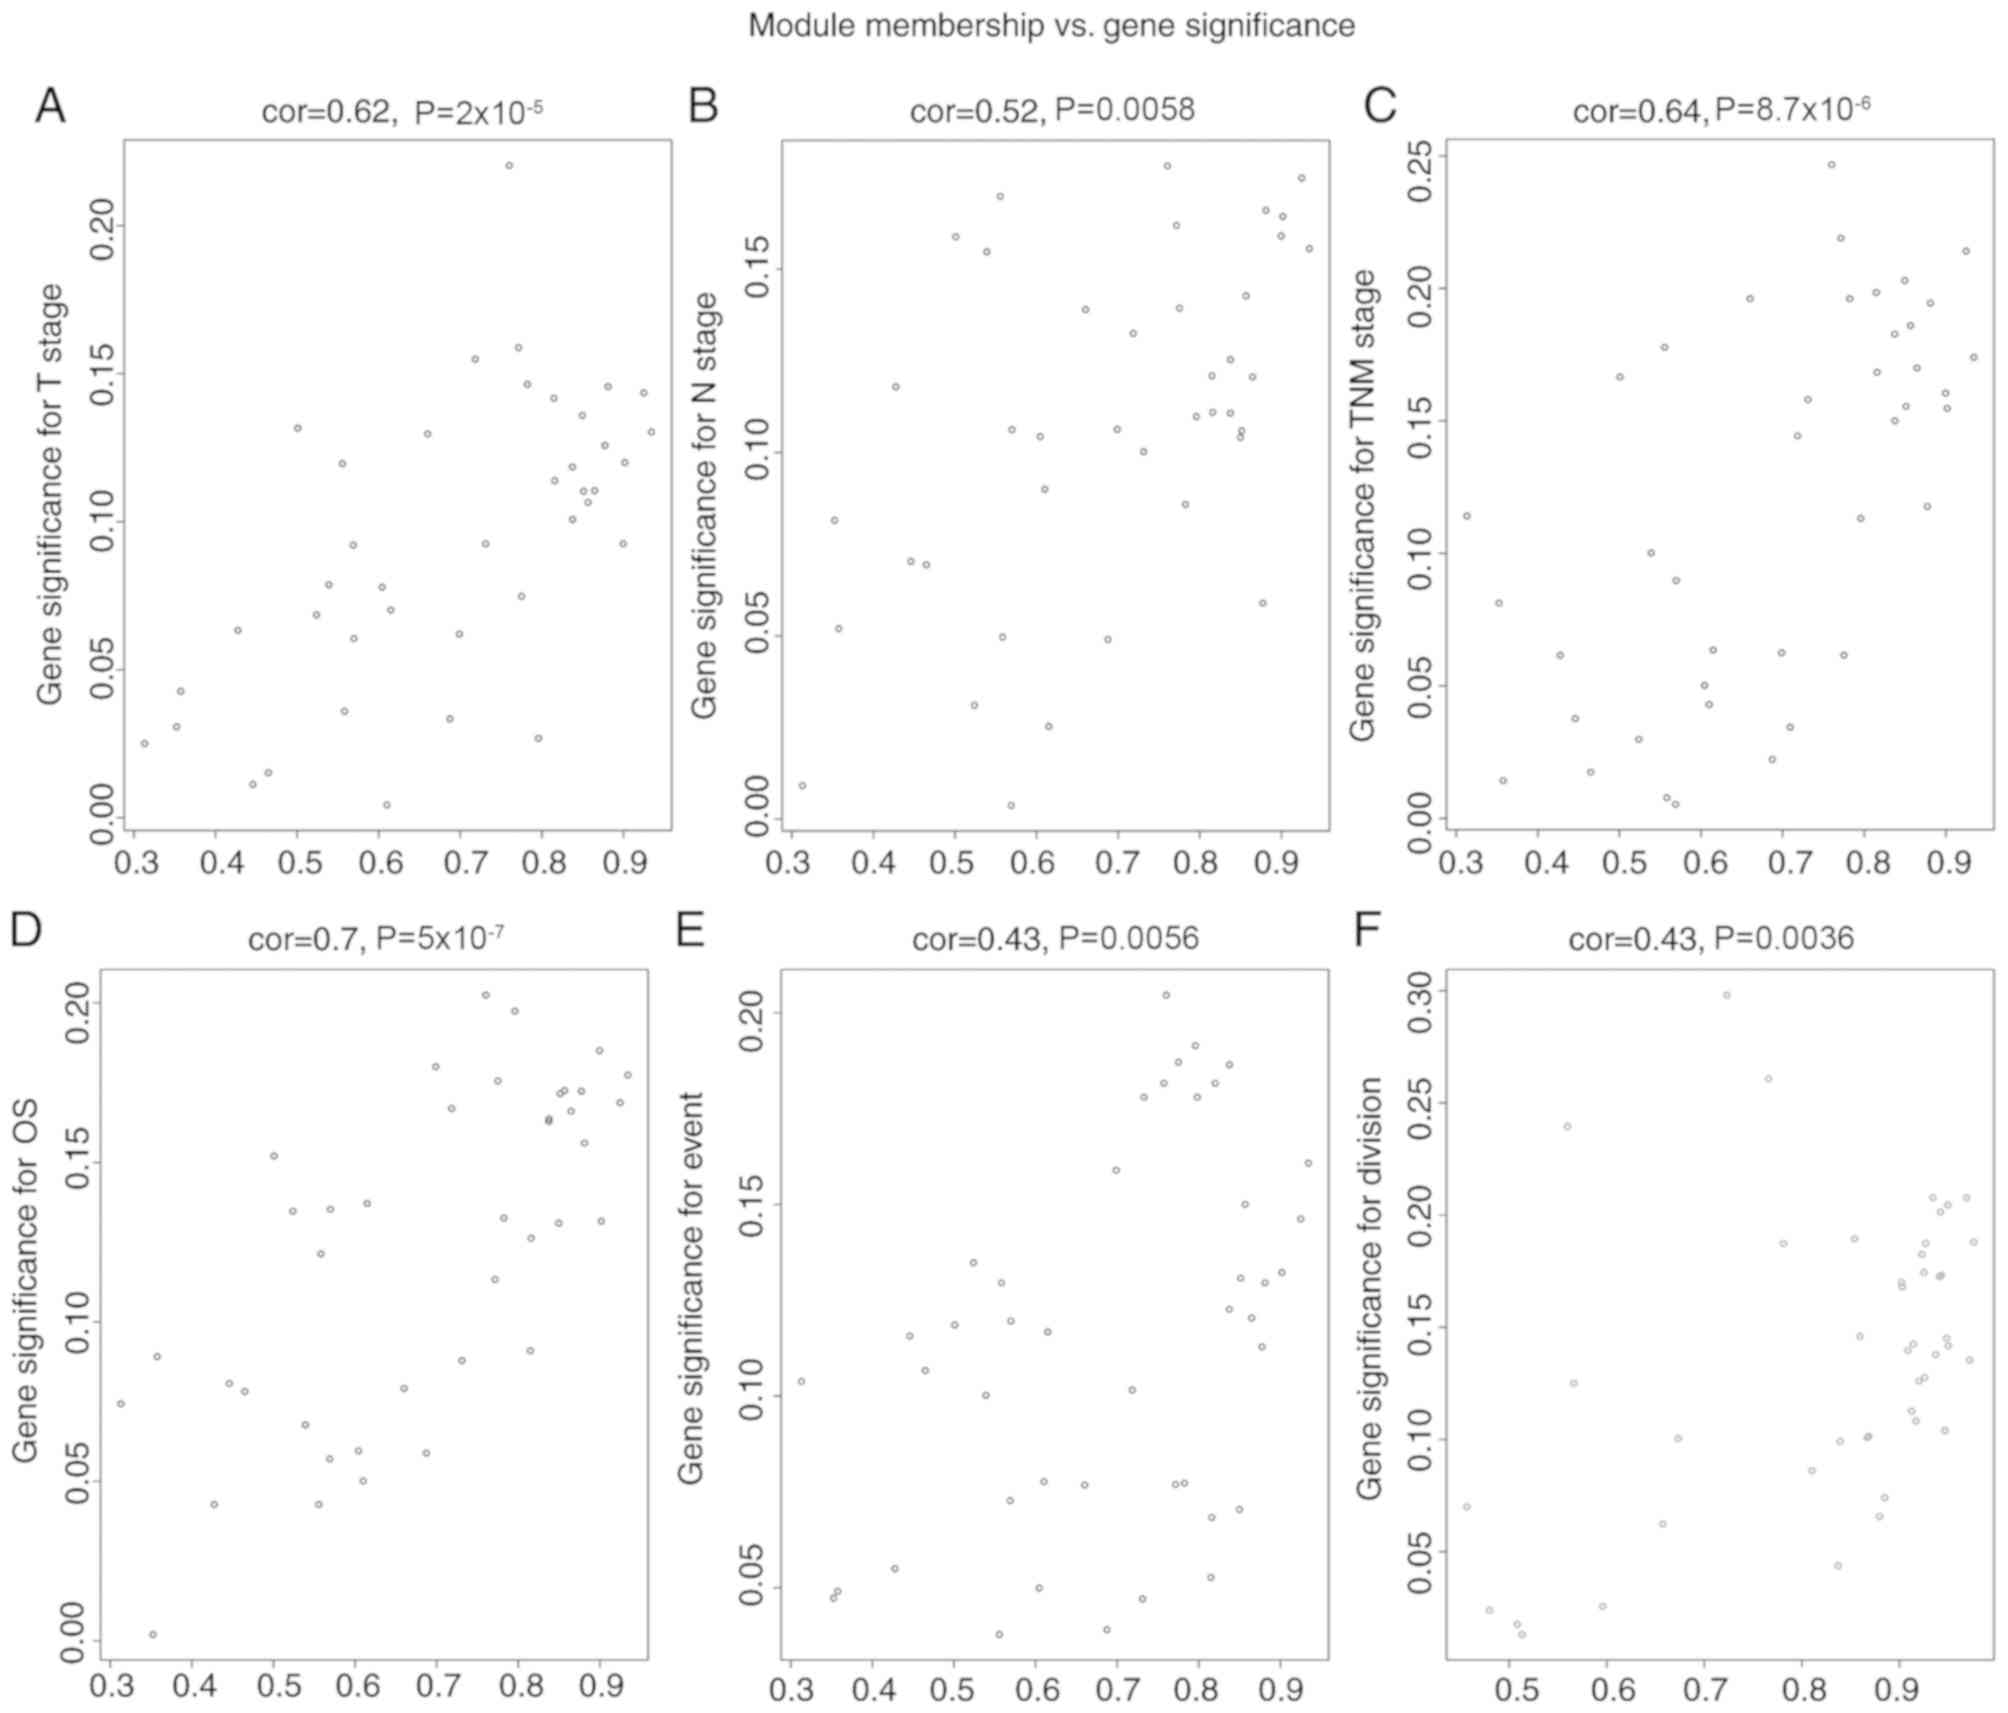
The black module exhibited a greater correlation
with OS, event, N stage and TNM stage than the other modules
(P<0.05; Fig. 4), and was
correlated with the T stage (P=0.08). The genes in the black module
may therefore be associated with the survival and prognosis of
patients. However, each module was correlated with different
clinical features and the red module was correlated with anatomic
neoplasm subdivision (P=0.04). Scatterplots of gene significance
vs. specific module membership were plotted (Fig. 5). The black module was selected as
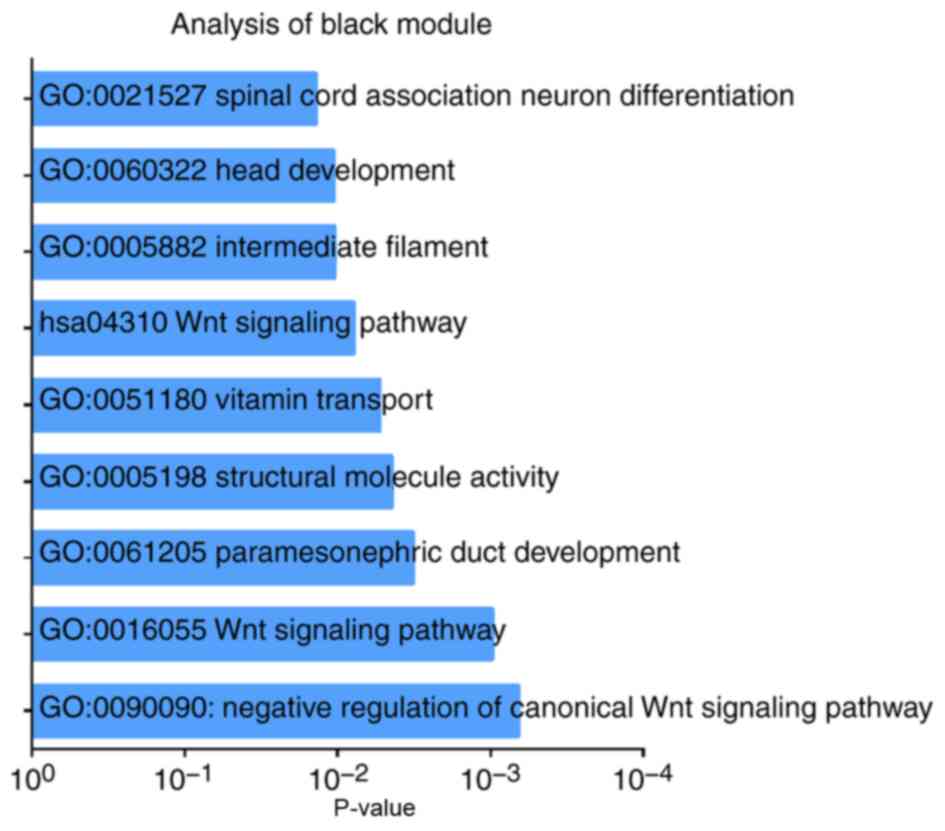
the module of interest and was subsequently analyzed. To identify
the functional involvement of the black module, the 40 genes in the
black module were uploaded onto DAVID for KEGG pathway enrichment
and GO analyses. Biological processes of the black module included
‘Wnt signaling pathway’ (P=9.80×10−04), ‘structural
molecule activity’ (P=0.004) and ‘vitamin transport’ (P=0.005).
KEGG pathway analysis revealed that ‘Wnt signaling pathway’ was the
only significant pathway (P=0.008; Fig.
6; Table SII).
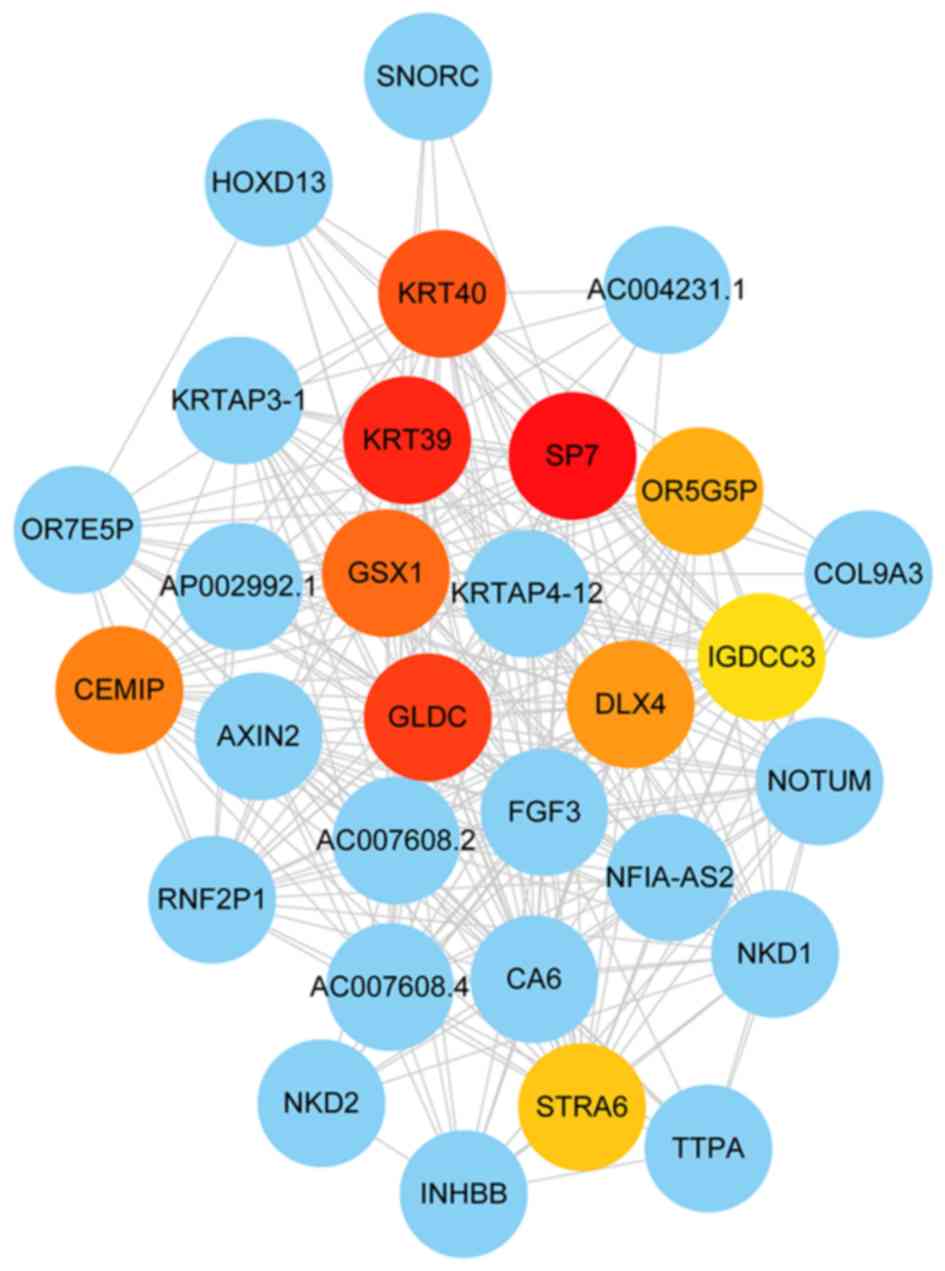
Hub gene identification and
correlation analysis
Cytoscape software was used to construct the
co-expression network modules, and the intramodular connectivity
was calculated. Genes with high intramodular connectivity were
considered as intramodular hub genes (Table SIII). The hub genes in the black
module are presented in Fig. 7 (the
top ten hub genes, including GLDC, KRT40, GS homeobox 1 (GSX1),
keratin associated protein 4–12, distal-less homeobox 4 (DLX4),
NFIA antisense RNA 2, Sp7 transcription factor, KRT39 and olfactory
receptor family 5 subfamily G member 5 pseudogene). Significant
differences (P<0.05) between the hub genes and TNM stages were
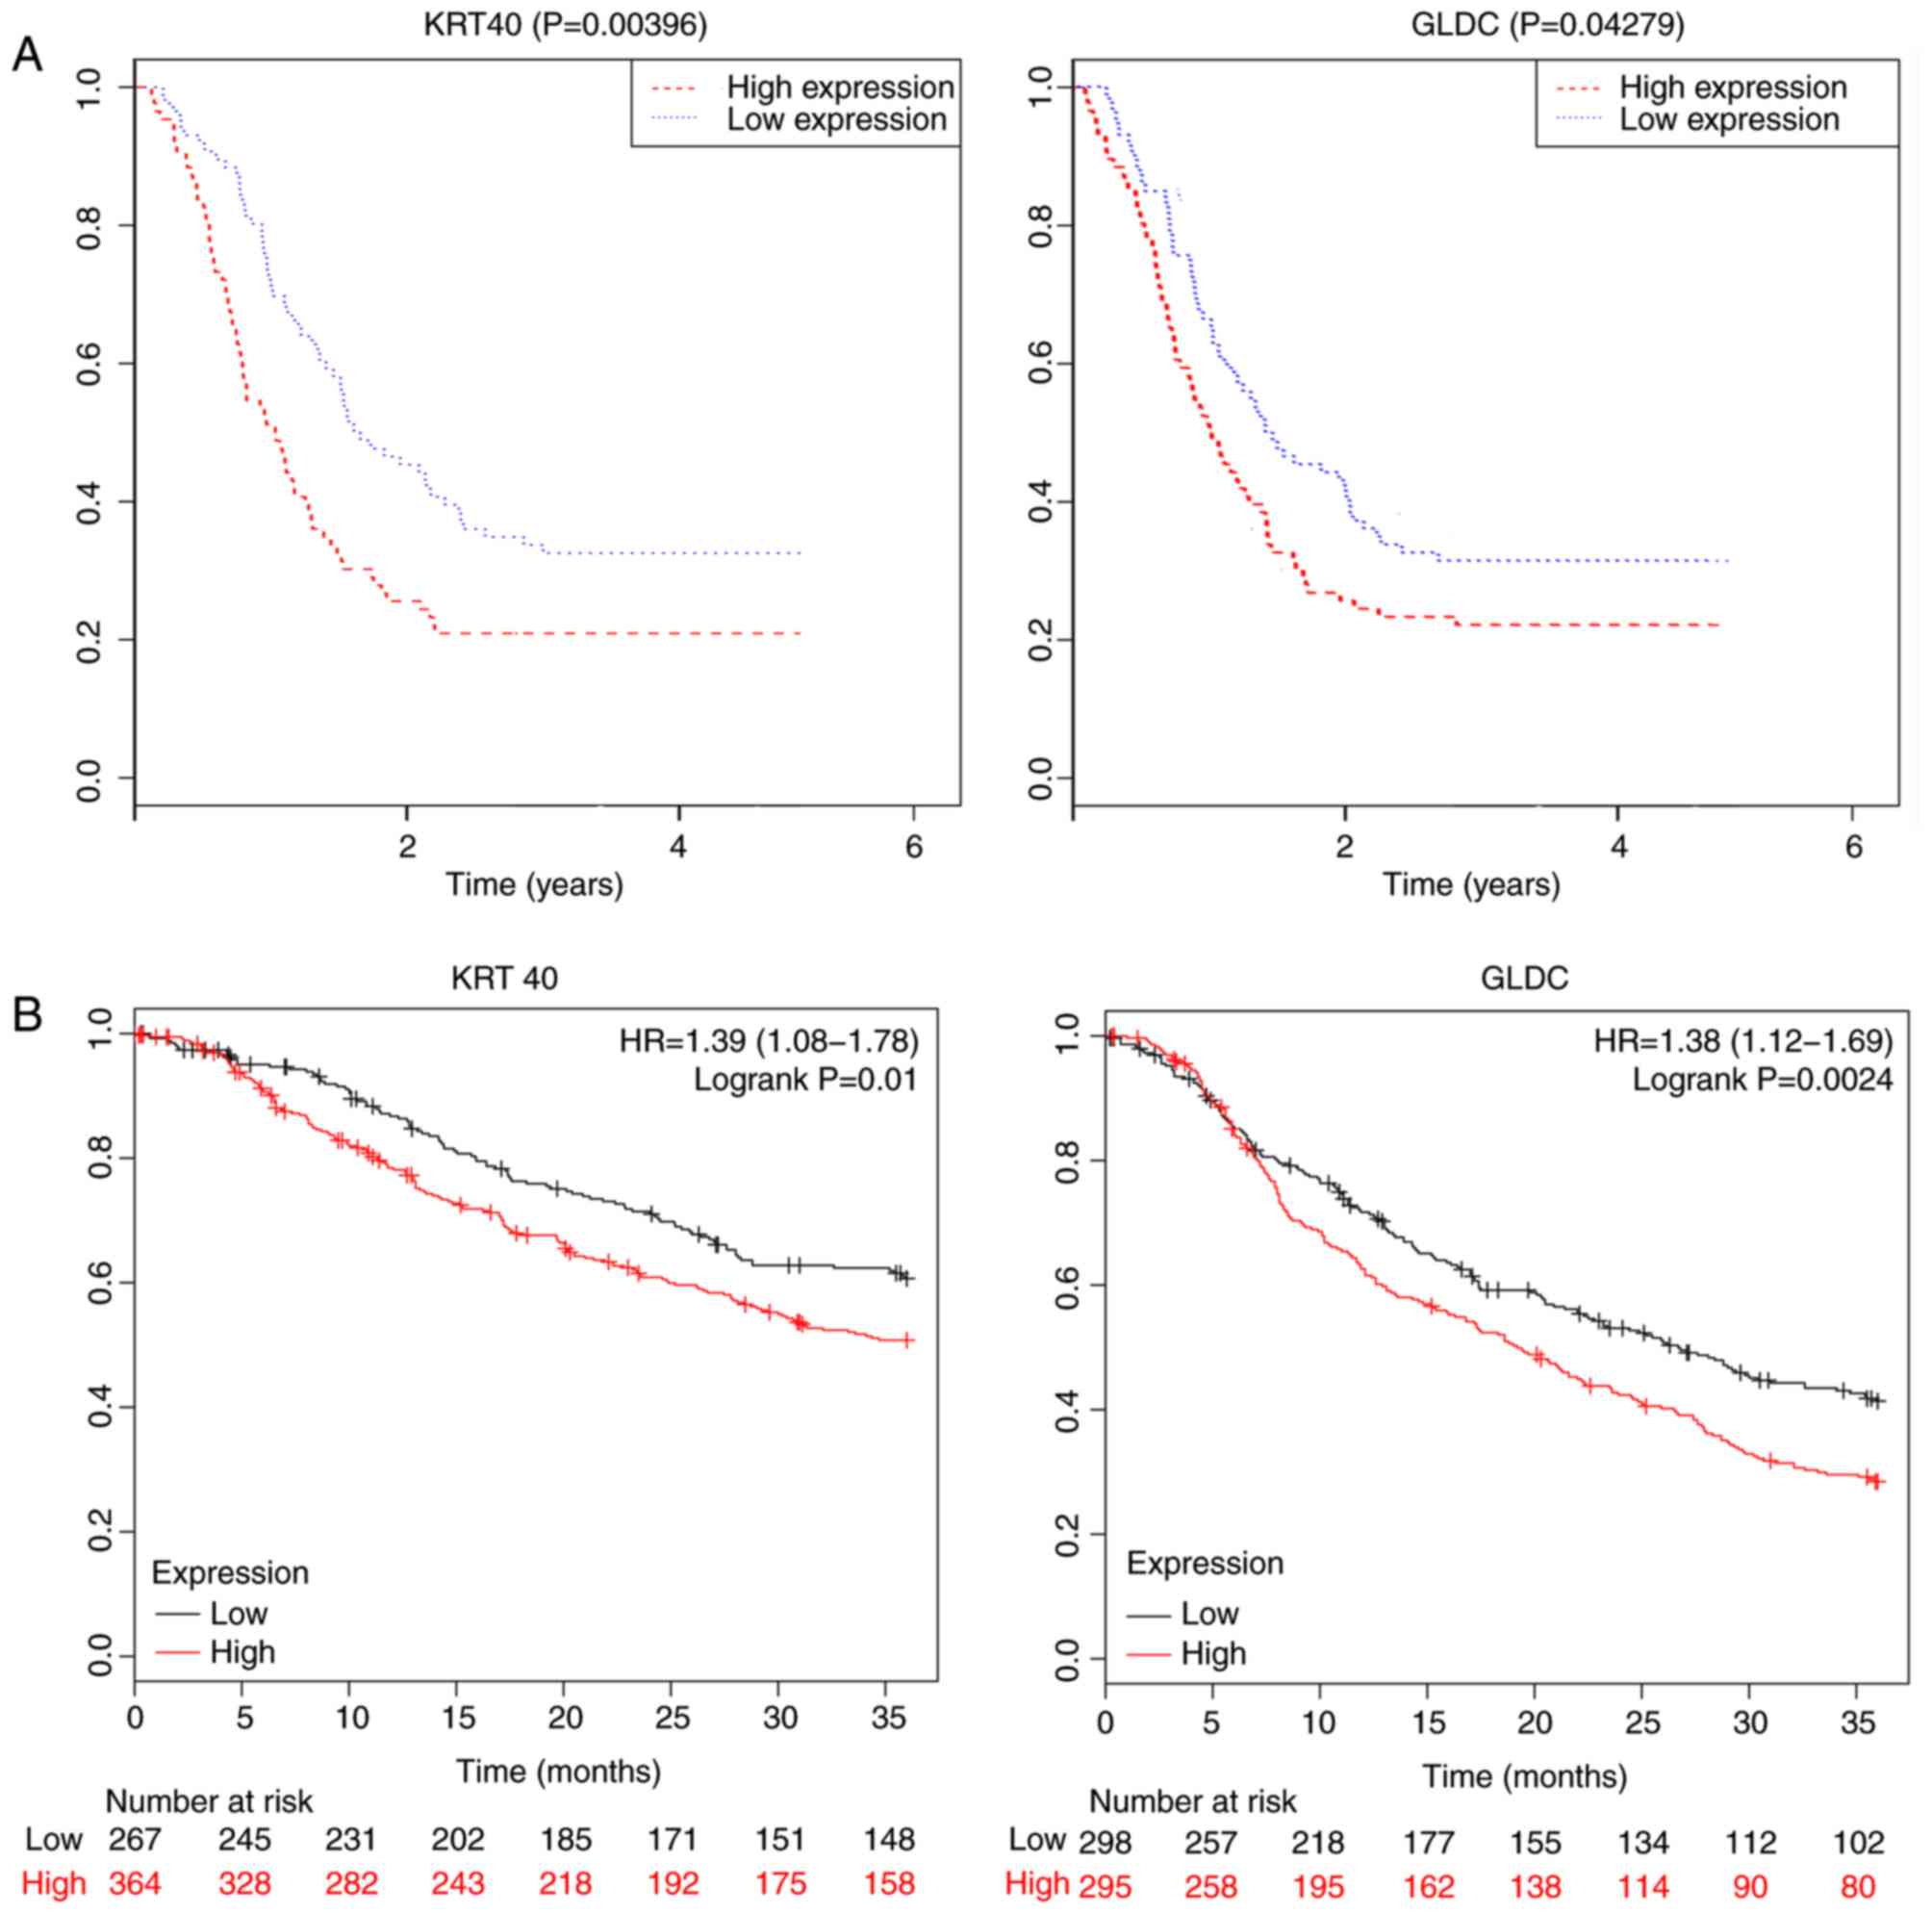
identified using the one-way ANOVA (Table SIV). The OS analysis of 172 patients
divided into two groups according to the median expression of each
hub gene (high vs. low) revealed that keratin 40 (KRT40) and
glycine decarboxylase (GLDC) were associated with prognosis
(P<0.05; Fig. 8A), suggesting
that KRT40 and GLDC may act as prognostic biomarkers for GC.
Additionally, the effects of KRT40 and GLDC on the OS were
validated in datasets obtained from the GEO database (GSE14210,
GSE15459, GSE22377, GSE29272, GSE51105 and GSE62254). The
significance of the aforementioned genes was further investigated
by performing survival analysis (P<0.05; Fig. 8B).
Discussion
The degree of differentiation of GC is associated
with complex gene interactions and often indicates prognosis
(24–27). Studying the molecular mechanisms
underlying differentiation is important for understanding the
pathogenesis and development of GC, and may be helpful for the
diagnosis and treatment of GC. However, to the best of our
knowledge, there is currently no clinically applicable biomarker
for distinguishing between the histological types of GC. The
present study used RNA sequencing data and clinical information
obtained from 408 GC samples in the TCGA database, 172 of which
were included in the final WGCNA to identify robust co-expression
modules associated with cancer characteristics.
In cancer studies, candidate molecular biomarkers
may be used to distinguish between normal and cancerous tissues
(28–32). The present study identified DEGs
between GC and paracancerous tissues in 408 samples in the TCGA
database. The samples were divided into two groups based on the
degree of GC differentiation, and a total of 1,400 DEGs associated
with the differentiation of GC were obtained. GO enrichment
analysis revealed that the 1,400 DEGs were associated with
‘digestion’, ‘extracellular space’, ‘structural molecule activity’
and ‘neuroactive ligand-receptor interaction’. As the preliminary
GO analysis did not clearly explain the role of the DEGs, WGCNA was
subsequently used to further analyze the aforementioned DEGs. WGCNA
has a number of advantages, as the analysis focuses on the
association between clinical features and co-expression, resulting
in higher reliability and biological significance (33–35).
Therefore, genes in the same module are considered to be
functionally associated with each other, and the analysis
identifies biologically relevant modules and hub genes that may
eventually serve as biomarkers for detection or treatment (10).
The black co-expression module in the current study
was correlated with various clinical traits, including OS, death
event, N stage and TNM stage. The aforementioned clinical traits
were associated with the survival and prognosis of patients. The
black module was therefore considered to be a clinically
significant gene cluster that required further investigation in the
current study.
Functional annotation of the black module revealed
that the genes were involved in the ‘Wnt signaling pathway’ and
‘structural molecule activity’, which affect the pathogenesis and
development of tumors (36–40). The associations between the TNM stage
and the genes in the ‘Wnt signaling pathway’, including NKD
inhibitor of WNT signaling pathway 1 and 2 and notum
palmitoleoyl-protein carboxylesterase, and the genes involved in
‘structural molecule activity’, including keratin (KRT) 39 and
KRT40, were investigated. Furthermore, the black the genes in the
black module were analyzed using Cytoscape software and the top ten
hub genes, including GLDC, KRT40, GS homeobox 1 (GSX1), keratin
associated protein 4–12, distal-less homeobox 4 (DLX4), NFIA
antisense RNA 2, Sp7 transcription factor, KRT39 and olfactory
receptor family 5 subfamily G member 5 pseudogene, were
identified.
GLDC is involved in glycine metabolism and serves a
role in several types of cancer (41–45).
KRT39 and KRT40 contribute to the structural integrity of a complex
or assembly within or outside a cell (46). GSX1 is among the earliest
transcription factors expressed in neuronal progenitors (47) and may be used as a prognostic
predictor. DLX4 is a transcription factor encoded by a homeobox
gene associated with ovarian cancer (48). The expression value of each hub gene
across different TNM stages was significantly different, and KRT40
and GLDC were associated with patient prognosis for 3-year overall
survival analysis, suggesting that these hub genes were positively
correlated with tumor stage and prognosis of GC.
In summary, the present study established a gene
co-expression network to identify network genes associated with the
progression of GC, relative to the histological grade. GLDC, KRT40,
GSX1 and DLX4 were identified as potential diagnostic and
prognostic biomarkers of GC as they showed the highest levels of
significance for prognosis. Additional research is required to
investigate the roles of the aforementioned genes in in the
pathogenesis and progression of GC. The results obtained in the
current study may contribute to the improvement of risk
stratification, therapeutic decision-making and prognosis
prediction for patients with GC.
Supplementary Material
Supporting Data
Acknowledgements
Not applicable.
Funding
The current study was funded by the National Natural
Science Foundation of China (grant nos. 81472308 and 31470891).
Availability of data and materials
The datasets used and analyzed during the current
study are available from TCGA (gdc.cancer.gov/) and Gene Expression Omnibus,
(ncbi.nlm.nih.gov/geo/).
Authors' contributions
JC, XX, YC and RW conceived and designed the study.
JC and XX acquired and interpreted the data and contributed to the
revision of the manuscript. WC and WZ prepared the initial draft of
the manuscript and contributed to the acquisition and
interpretation of the data. JC, XX, YC and RW analyzed the data.
All authors approved the manuscript.
Ethics approval and consent to
participate
Not applicable.
Patient consent for publication
Not applicable.
Competing interests
The authors declare that they have no competing
interests.
References
|
1
|
Torre LA, Bray F, Siegel RL, Ferlay J,
Lortet-Tieulent J and Jemal A: Global cancer statistics, 2012. CA
Cancer J Clin. 65:87–108. 2015. View Article : Google Scholar : PubMed/NCBI
|
|
2
|
Folli S, Morgagni P, Roviello F, De
Manzoni G, Marrelli D, Saragoni L, Di Leo A, Gaudio M, Nanni O,
Carli A, et al: Risk factors for lymph node metastases and their
prognostic significance in early gastric cancer (EGC) for the
Italian research group for gastric cancer (IRGGC). Jpn J Clin
Oncoly. 31:495–499. 2001. View Article : Google Scholar
|
|
3
|
Popiela T, Kulig J, Kolodziejczyk P and
Sierzega M and Sierzega M; Polish Gastric Cancer Study Group, :
Long-term results of surgery for early gastric cancer. Brit J Surg.
89:1035–1042. 2002. View Article : Google Scholar : PubMed/NCBI
|
|
4
|
Adachi Y, Yasuda K, Inomata M, Sato K,
Shiraishi N and Kitano S: Pathology and prognosis of gastric
carcinoma: Well versus poorly differentiated type. Cancer.
89:1418–1424. 2000. View Article : Google Scholar : PubMed/NCBI
|
|
5
|
Noda S, Soejima K and Inokuchi K:
Clinicopathological analysis of the intestinal type and diffuse
type of gastric carcinoma. Jpn J Surg. 10:277–283. 1980. View Article : Google Scholar : PubMed/NCBI
|
|
6
|
Ribeiro MM, Sarmento JA, Sobrinho Simões
MA and Bastos J: Prognostic significance of Lauren and Ming
classifications and other pathologic parameters in gastric
carcinoma. Cancer. 47:780–784. 1981. View Article : Google Scholar : PubMed/NCBI
|
|
7
|
Kim BS, Oh ST, Yook JH and Kim BS: Signet
ring cell type and other histologic types: Differing clinical
course and prognosis in T1 gastric cancer. Surgery. 155:1030–1035.
2014. View Article : Google Scholar : PubMed/NCBI
|
|
8
|
Qiu MZ, Cai MY, Zhang DS, Wang ZQ, Wang
DS, Li YH and Xu RH: Clinicopathological characteristics and
prognostic analysis of Lauren classification in gastric
adenocarcinoma in China. J Transl Med. 11:582013. View Article : Google Scholar : PubMed/NCBI
|
|
9
|
Flucke U, Mönig SP, Baldus SE, Zirbes TK,
Bollschweiler E, Thiele J, Dienes HP and Hölscher AH: Differences
between biopsy- or specimen-related Laurén and world health
organization classification in gastric cancer. World J Surg.
26:137–140. 2002. View Article : Google Scholar : PubMed/NCBI
|
|
10
|
Langfelder P and Horvath S: WGCNA: An R
package for weighted correlation network analysis. BMC
Bioinformatics. 9:5592008. View Article : Google Scholar : PubMed/NCBI
|
|
11
|
Udyavar AR, Hoeksema MD, Clark JE, Zou Y,
Tang Z, Li Z, Li M, Chen H, Statnikov A, Shyr Y, et al:
Co-expression network analysis identifies spleen tyrosine kinase
(SYK) as a candidate oncogenic driver in a subset of small-cell
lung cancer. BMC Syst Biol. 7 (Suppl 5):S12013. View Article : Google Scholar : PubMed/NCBI
|
|
12
|
Horvath S, Zhang B, Carlson M, Lu KV, Zhu
S, Felciano RM, Laurance MF, Zhao W, Qi S, Chen Z, et al: Analysis
of oncogenic signaling networks in glioblastoma identifies ASPM as
a molecular target. Proc Natl Acad Sci USA. 103:17402–17407. 2006.
View Article : Google Scholar : PubMed/NCBI
|
|
13
|
Shi Z, Derow CK and Zhang B: Co-expression
module analysis reveals biological processes, genomic gain, and
regulatory mechanisms associated with breast cancer progression.
BMC Syst Biol. 4:742010. View Article : Google Scholar : PubMed/NCBI
|
|
14
|
Liu X, Hu AX, Zhao JL and Chen FL:
Identification of key gene modules in human osteosarcoma by
co-expression analysis weighted gene co-expression network analysis
(WGCNA). J Cell Biochem. 118:3953–3959. 2017. View Article : Google Scholar : PubMed/NCBI
|
|
15
|
Perumal D, Pillai S, Nguyen J, Schaal C,
Coppola D and Chellappan SP: Nicotinic acetylcholine receptors
induce c-Kit ligand/stem cell factor and promote stemness in an
ARRB1/ β-arrestin-1 dependent manner in NSCLC. Oncotarget.
5:10486–10502. 2014. View Article : Google Scholar : PubMed/NCBI
|
|
16
|
Shi K, Bing ZT, Cao GQ, Guo L, Cao YN,
Jiang HO and Zhang MX: Identify the signature genes for diagnose of
uveal melanoma by weight gene co-expression network analysis. Int J
Ophthalmol. 8:269–274. 2015.PubMed/NCBI
|
|
17
|
Amin MB, Greene FL, Edge SB, Compton CC,
Gershenwald JE, Brookland RK, Meyer L, Gress DM, Byrd DR and
Winchester DP: The eighth edition AJCC cancer staging manual:
Continuing to build a bridge from a population-based to a more
‘personalized’ approach to cancer staging. CA Cancer J Clin.
67:93–99. 2017. View Article : Google Scholar : PubMed/NCBI
|
|
18
|
Team RC, . R: A language and environment
for statistical computingR Foundation for Statistical Computing;
Vienna: 2012, http://www.R-project.org/
|
|
19
|
RStudio Team, . RStudio: Integrated
Development for R. RStudio, Inc.; Boston, MA: 2015, http://www.rstudio.com/
|
|
20
|
Huang da W, Sherman BT and Lempicki RA:
Systematic and integrative analysis of large gene lists using DAVID
bioinformatics resources. Nat Protoc. 4:44–57. 2009. View Article : Google Scholar : PubMed/NCBI
|
|
21
|
Wisniewski N, Cadeiras M, Bondar G, Cheng
RK, Shahzad K, Onat D, Latif F, Korin Y, Reed E, Fakhro R and Deng
MC: Weighted gene coexpression network analysis (WGCNA) modeling of
multiorgan dysfunction syndrome after mechanical circulatory
support therapy. J Heart Lung Transpl. 32 (Suppl):S2232013.
View Article : Google Scholar
|
|
22
|
Goel MK, Khanna P and Kishore J:
Understanding survival analysis: Kaplan-Meier estimate. Int J
Ayurveda Res. 1:274–278. 2010. View Article : Google Scholar : PubMed/NCBI
|
|
23
|
Lánczky A, Nagy Á, Bottai G, Munkácsy G,
Szabó A, Santarpia L and Győrffy B: miRpower: A web-tool to
validate survival-associated miRNAs utilizing expression data from
2178 breast cancer patients. Breast Cancer Res Treat. 160:439–446.
2016. View Article : Google Scholar : PubMed/NCBI
|
|
24
|
Fiocca R, Luinetti O, Villani L, Mastracci
L, Quilici P, Grillo F and Ranzani GN: Molecular mechanisms
involved in the pathogenesis of gastric carcinoma: Interactions
between genetic alterations, cellular phenotype and cancer
histotype. Hepatogastroenterology. 48:1523–1530. 2001.PubMed/NCBI
|
|
25
|
Liu W and Rodgers GP: Olfactomedin 4
expression and functions in innate immunity, inflammation, and
cancer. Cancer Metastasis Rev. 35:201–212. 2016. View Article : Google Scholar : PubMed/NCBI
|
|
26
|
Piao Y, Li Y, Xu Q, Liu JW, Xing CZ, Xie
XD and Yuan Y: Association of MTOR and AKT gene polymorphisms with
susceptibility and survival of gastric cancer. PLoS One.
10:e01364472015. View Article : Google Scholar : PubMed/NCBI
|
|
27
|
Streit M, Schmidt R, Hilgenfeld RU, Thiel
E and Kreuser ED: Adhesion receptors in malignant transformation
and dissemination of gastrointestinal tumors. Recent Results Cancer
Res. 142:19–50. 1996. View Article : Google Scholar : PubMed/NCBI
|
|
28
|
Carlomagno N, Incollingo P, Tammaro V,
Peluso G, Rupealta N, Chiacchio G, Sandoval Sotelo ML, Minieri G,
Pisani A, Riccio E, et al: Diagnostic, predictive, prognostic, and
therapeutic molecular biomarkers in third millennium: A
breakthrough in gastric cancer. Biomed Res Int. 2017:78698022017.
View Article : Google Scholar : PubMed/NCBI
|
|
29
|
Choi YJ and Kim N: Gastric cancer and
family history. Korean J Intern Med. 31:1042–1053. 2016. View Article : Google Scholar : PubMed/NCBI
|
|
30
|
Panarese I, De Vita F, Ronchi A, Romano M,
Alfano R, Di Martino N, Zito Marino F, Ferraraccio F and Franco R:
Predictive biomarkers along gastric cancer pathogenetic pathways.
Expert Rev Anticancer Ther. 17:417–425. 2017. View Article : Google Scholar : PubMed/NCBI
|
|
31
|
Shin VY and Chu KM: MiRNA as potential
biomarkers and therapeutic targets for gastric cancer. World J
Gastroenterol. 20:10432–10439. 2014. View Article : Google Scholar : PubMed/NCBI
|
|
32
|
Tahara T and Arisawa T: DNA methylation as
a molecular biomarker in gastric cancer. Epigenomics. 7:475–486.
2015. View
Article : Google Scholar : PubMed/NCBI
|
|
33
|
Chou WC, Cheng AL, Brotto M and Chuang CY:
Visual gene-network analysis reveals the cancer gene co-expression
in human endometrial cancer. BMC Genomics. 15:3002014. View Article : Google Scholar : PubMed/NCBI
|
|
34
|
Luo Y, Coskun V, Liang A, Yu J, Cheng L,
Ge W, Shi Z, Zhang K, Li C, Cui Y, et al: Single-cell transcriptome
analyses reveal signals to activate dormant neural stem cells.
Cell. 161:1175–1186. 2015. View Article : Google Scholar : PubMed/NCBI
|
|
35
|
Kunowska N, Rotival M, Yu L, Choudhary J
and Dillon N: Identification of protein complexes that bind to
histone H3 combinatorial modifications using super-SILAC and
weighted correlation network analysis. Nucleic Acids Res.
43:1418–1832. 2015. View Article : Google Scholar : PubMed/NCBI
|
|
36
|
Huang H, Chen Z and Ni X: Tissue
transglutaminase-1 promotes stemness and chemoresistance in gastric
cancer cells by regulating Wnt/β-catenin signaling. Exp Biol Med
(Maywood). 242:194–202. 2017. View Article : Google Scholar : PubMed/NCBI
|
|
37
|
Katoh M: Canonical and non-canonical WNT
signaling in cancer stem cells and their niches: Cellular
heterogeneity, omics reprogramming, targeted therapy and tumor
plasticity (Review). Int J Oncol. 51:1357–1369. 2017. View Article : Google Scholar : PubMed/NCBI
|
|
38
|
Song Y, Li ZX, Liu X, Wang R, Li LW and
Zhang Q: The Wnt/β-catenin and PI3K/Akt signaling pathways promote
EMT in gastric cancer by epigenetic regulation via H3 lysine 27
acetylation. Tumour Biol. 39:10104283177126172017. View Article : Google Scholar : PubMed/NCBI
|
|
39
|
Wang H, Duan XL, Qi XL, Meng L, Xu YS, Wu
T and Dai PG: Concurrent hypermethylation of SFRP2 and DKK2
activates the Wnt/β-catenin pathway and is associated with poor
prognosis in patients with gastric cancer. Mol Cells. 40:45–53.
2017. View Article : Google Scholar : PubMed/NCBI
|
|
40
|
Woo DK, Kim HS, Lee HS, Kang YH, Yang HK
and Kim WH: Altered expression and mutation of beta-catenin gene in
gastric carcinomas and cell lines. Int J Cancer. 95:108–113. 2001.
View Article : Google Scholar : PubMed/NCBI
|
|
41
|
Kim D, Fiske BP, Birsoy K, Freinkman E,
Kami K, Possemato RL, Chudnovsky Y, Pacold ME, Chen WW, Cantor JR,
et al: SHMT2 drives glioma cell survival in ischaemia but imposes a
dependence on glycine clearance. Nature. 520:363–367. 2015.
View Article : Google Scholar : PubMed/NCBI
|
|
42
|
Min HL, Kim J, Kim WH, Jang BG and Kim MA:
Epigenetic silencing of the putative tumor suppressor gene GLDC
(Glycine Dehydrogenase) in gastric carcinoma. Anticancer Res.
36:179–187. 2016.PubMed/NCBI
|
|
43
|
Zhuang H, Li Q, Zhang X, Ma X, Wang Z, Liu
Y, Yi X, Chen R, Han F, Zhang N and Li Y: Downregulation of glycine
decarboxylase enhanced cofilin-mediated migration in hepatocellular
carcinoma cells. Free Radic Biol Med. 120:1–12. 2018. View Article : Google Scholar : PubMed/NCBI
|
|
44
|
Berezowska S, Galvan JA, Langer R,
Bubendorf L, Savic S, Gugger M, Schmid RA and Marti TM: Glycine
decarboxylase and HIF-1α expression are negative prognostic factors
in primary resected early-stage non-small cell lung cancer.
Virchows Arch. 470:323–330. 2017. View Article : Google Scholar : PubMed/NCBI
|
|
45
|
Zhang WC, Shyh-Chang N, Yang H, Rai A,
Umashankar S, Ma S, Soh BS, Sun LL, Tai BC, Nga ME, et al: Glycine
decarboxylase activity drives non-small cell lung cancer
tumor-initiating cells and tumorigenesis. Cell. 148:259–272. 2012.
View Article : Google Scholar : PubMed/NCBI
|
|
46
|
Yu Z, Wildermoth JE, Wallace OA, Gordon
SW, Maqbool NJ, Maclean PH, Nixon AJ and Pearson AJ: Annotation of
sheep keratin intermediate filament genes and their patterns of
expression. Exp Dermatol. 20:582–588. 2011. View Article : Google Scholar : PubMed/NCBI
|
|
47
|
Pei Z, Wang B, Chen G, Nagao M, Nakafuku M
and Campbell K: Homeobox genes Gsx1 and Gsx2 differentially
regulate telencephalic progenitor maturation. Proc Natl Acad Sci
USA. 108:1675–1680. 2011. View Article : Google Scholar : PubMed/NCBI
|
|
48
|
Haria D, Trinh BQ, Ko SY, Barengo N, Liu J
and Naora H: The homeoprotein DLX4 stimulates NF-κB activation and
CD44-mediated tumor-mesothelial cell interactions in ovarian
cancer. Am J Pathol. 185:2298–2308. 2015. View Article : Google Scholar : PubMed/NCBI
|