Introduction
Head and neck squamous cell carcinoma (HNSCC),
including nasopharyngeal cancer, hypopharyngeal cancer, laryngeal
cancer and tonsillar cancer, consists of different pathological and
molecular subtypes, with differing metastatic potentials and
prognoses. HNSCC is the sixth most common cancer worldwide, with
>600,000 new cases diagnosed each year (1). The treatment of HNSCC is based on a
combination of chemotherapy, radiotherapy and surgery or
chemoradiation alone. These conventional treatments have several
limitations. Surgery may cause secondary injury and reduce the
patients' quality of life. Radiotherapy is one of the most
effective treatment options against cancer. The development of
anatomical personalization has allowed radiation oncologists to
improve the outcomes of numerous patients with HNSCC. However, the
efficacy of radiation therapy is often impeded by tumor
radioresistance, resulting in treatment failure and tumor relapse.
Currently, there are few biomarkers available in the clinical
setting for predicting tumor radiotherapy outcome in patients with
HNSCC (2). There is still an urgent
need to identify effective biomarkers of radioresistance to guide
individualized treatment.
The development of microarray technologies provides
an ideal tool for biomarker screening. Numerous gene sequences have
been stored in the Gene Expression Omnibus (GEO) database (3), which may provide crucial data for
bioinformatic mining and acquisition of data from multiple samples.
Using integrative analysis, the publicly available GEO database may
be used to identify key genes and corresponding pathways as well as
the interactive network, therefore providing deeper insight into
the underlying molecular mechanisms (4,5).
However, at present there have been few studies that have utilized
integrative analysis of GEO datasets to identify
radioresistance-associated genes in patients with HNSCC. In the
present study, through comprehensive analysis of the GEO datasets,
a set of differentially expressed genes (DEGs) were identified,
which are potentially involved in radioresistance and pathological
progression of HNSCC.
The identified genes have rarely been reported as
prognostic biomarkers for HNSCC. Additionally, as a public dataset
was used to identify the prognostic biomarkers associated with
radiation resistance in patients with HNSCC, these biomarkers have
not been conclusively shown to be associated with HNSCC
radioresistance. Genome-wide association studies of patients with
HNSCC with differing sensitivities to radiation combined with
combinatorial bioinformatics may supply a framework for further
identifying the expression profiles which may predict the response
to radiotherapy. Furthermore, network-based analysis programs may
be employed to validate key-regulator transcriptional profiles for
the prediction of radiotherapy response. In the present study, the
GSE9716 dataset was divided into two groups according to the
exposure to irradiation: i) The non-irradiation group (8
radioresistant samples and 8 radiosensitive samples); and ii) the
post-irradiation group (9 radioresistant samples and 9
radiosensitive samples). A total of 86 DEGs were identified in the
non-irradiation group and 405 DEGs in the post-irradiation group.
Functional pathway analysis was performed, including Gene Ontology
(GO) term enrichment analysis and Kyoto Encyclopedia of Genes and
Genomes (KEGG) pathway analysis using the Database for Annotation
Visualization and Integrated Discovery (DAVID) (6–8).
Weighted Correlation Network Analysis (WGCNA) was performed to
identify the hub genes in each group (9). A total of 13 genes were found to show
significantly different expression in the radioresistant samples
compared with the radiosensitive samples prior to and following
irradiation. According to the fold-change of gene expression,
Kaplan-Meier analysis and protein-protein interaction analysis in
the post-irradiation group compared with the non-irradiation group,
it was demonstrated, for the first time to the best of our
knowledge, that a high level of POPDC3 expression may contribute to
radioresistance in patients with HNSCC and that POPDC3 may be a
potential biomarker for predicting radiosensitivity and prognosis
in patients with HNSCC, The prognostic value of POPDC3 in The
Cancer Genome Atlas (TCGA) cohort was determined using X-tile
analysis. A total of 161 patients with HNSCC were included and the
clinicopathological features were analyzed with respect to
occurrence of HNSCC. The clinical diagnostic significance of POPDC3
in patients with HNSCC was comprehensively evaluated using X-tile
and nomogram analysis.
Materials and methods
Microarray data
The microarray expression profile datasets GSE9716
(10), GSE61772 (11) and GSE20549 were downloaded from the
GEO database (https://www.ncbi.nlm.nih.gov/geo/). The datasets were
based on the GPL96 [HG-U133A] Affymetrix Human Genome U133A Array,
GPL6884 Illumina HumanWG-6 version 3.0 expression beadchip and
GPL6244 [HuGene-1_0-st] Affymetrix Human Gene 1.0 ST Array
platforms, respectively. In the GSE9716 dataset, there were 38
different treated HNSCC samples derived from the parental
radiosensitive tumor SCC-61 and radioresistant tumor nu61 cell
lines and xenografts (18 samples were irradiated at 3 Gy and 16
samples were left untreated, four samples treated with interferon
were removed). In GSE61772, six samples were included with three
radiosensitive esophageal cancer cell lines and three
radioresistant counterparts. For GSE20549, there were 21
radioresistant H1299 lung cancer cell lines and 21 radiosensitive
H460 lung cancer cell lines.
Data preprocessing
The original CEL files were preprocessed with the
robust multiarray average function in the Affymetrix package in R
language (R version 3.3.5) (12).
The quality of these datasets was assessed with the affyPLM
package. The RNA degradation images, FitPLM weight, residual
relative log expression and normalized unscaled standard errors of
the CEL data were evaluated. The Core package in Bioconductor
(13) and the limma R package
(14) were used for background
correction and quantile normalization.
After data preprocessing, the GSE9716 dataset was
divided into two groups i) the non-irradiation group which had 8
radioresistant samples and 8 radiosensitive samples; and ii) the
post-irradiation group which consisted of 9 radioresistant samples
and 9 radiosensitive samples treated with 3 Gy irradiation. These
two groups were used for all subsequent analysis.
Identification of DEGs
DEGs between the two groups were selected and
identified based on a Student's t-test analysis of linear models
for the limma package in R. Fold-change (FC) of gene expression was
calculated with a cut-off value of |log2 FC|≥1.0 and a P-value
<0.01 for DEG selection. Funrich (version 3.1.3; funrich.org/) was used to analyze the overlapping
profiles of DEGs among the different datasets.
Functional network enrichment analyses
of candidate genes
The Database for Annotation, Visualization and
Integrated Discovery (DAVID; http://david.ncifcrf.gov), an online biological
information database, provides a comprehensive set of annotated
functional information on genes and proteins. To analyze the
function of DEGs, GO and KEGG pathway enrichment analysis were
performed using the DAVID online database. The Search Tool for the
Retrieval of Interacting Genes database (string-db.org/) was used to construct a
protein-protein interaction (PPI) network. Cytoscape (cytoscape.org) was used to evaluate the interactive
correlation between different proteins. Oncomine (oncomine.org/), firebrowse (firebrowse.org/) and protein atlas database
(proteinatlas.org/) were used to validate the
expression of POPDC3 in HNSCC.
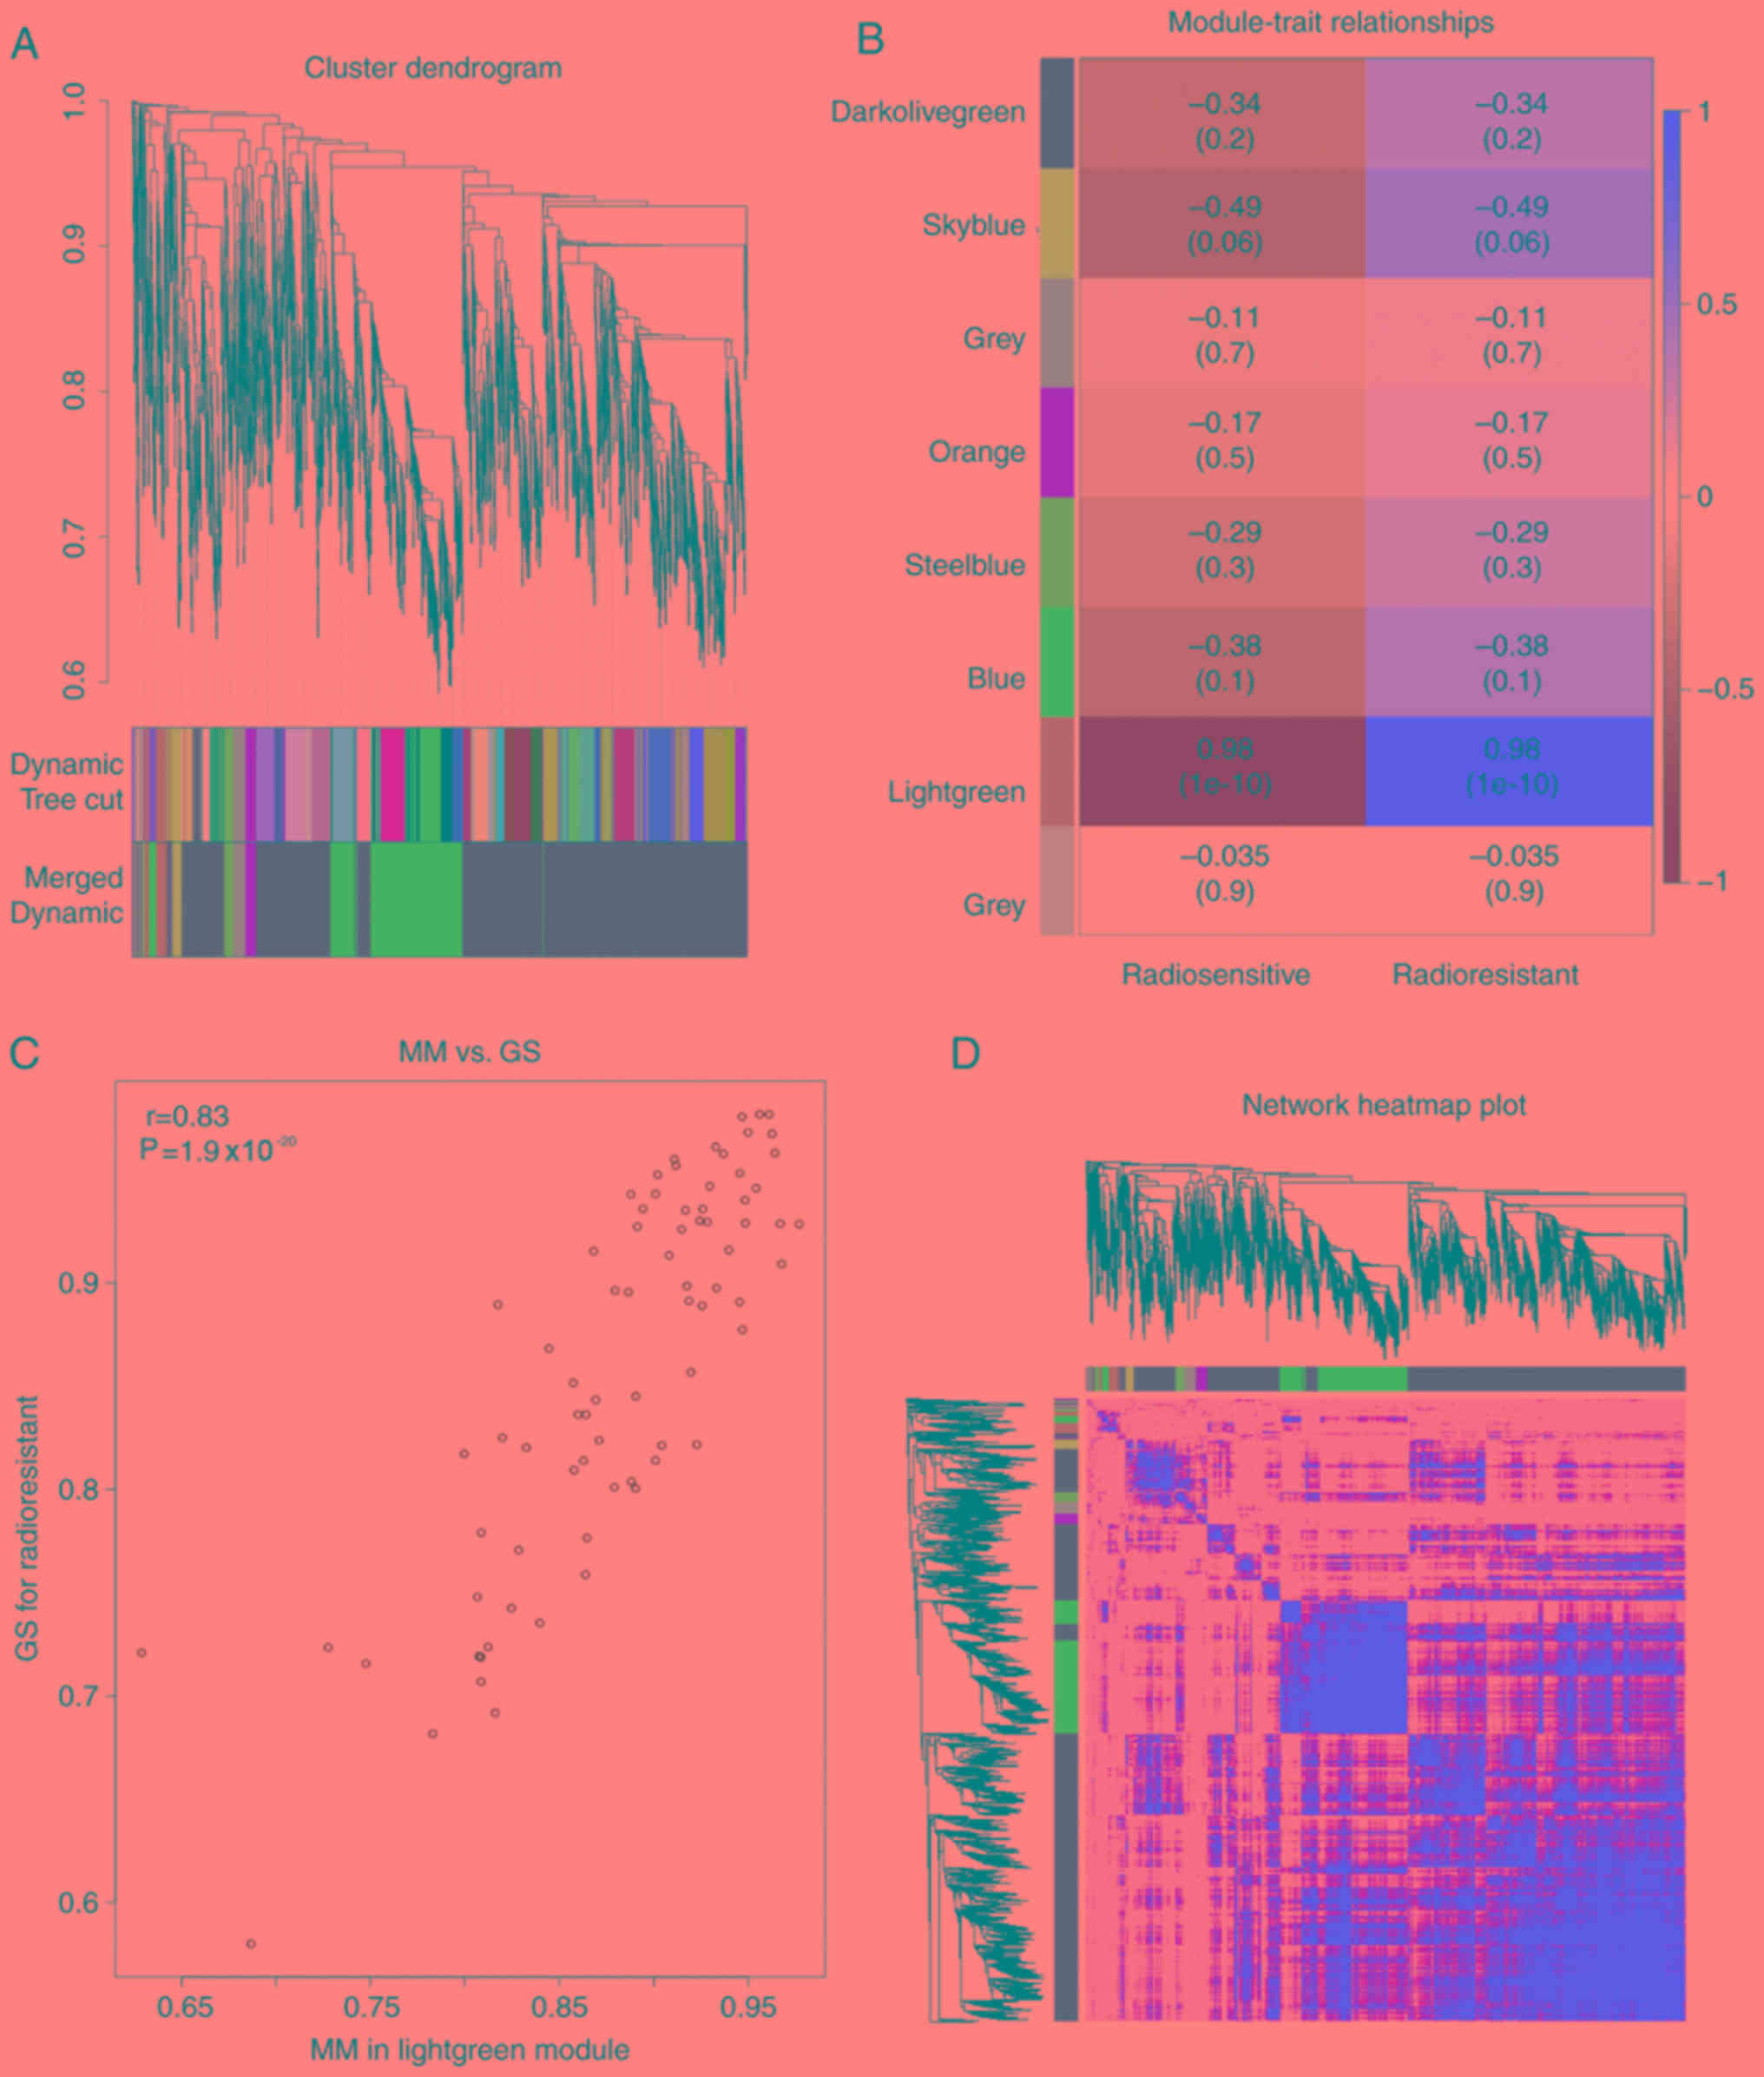
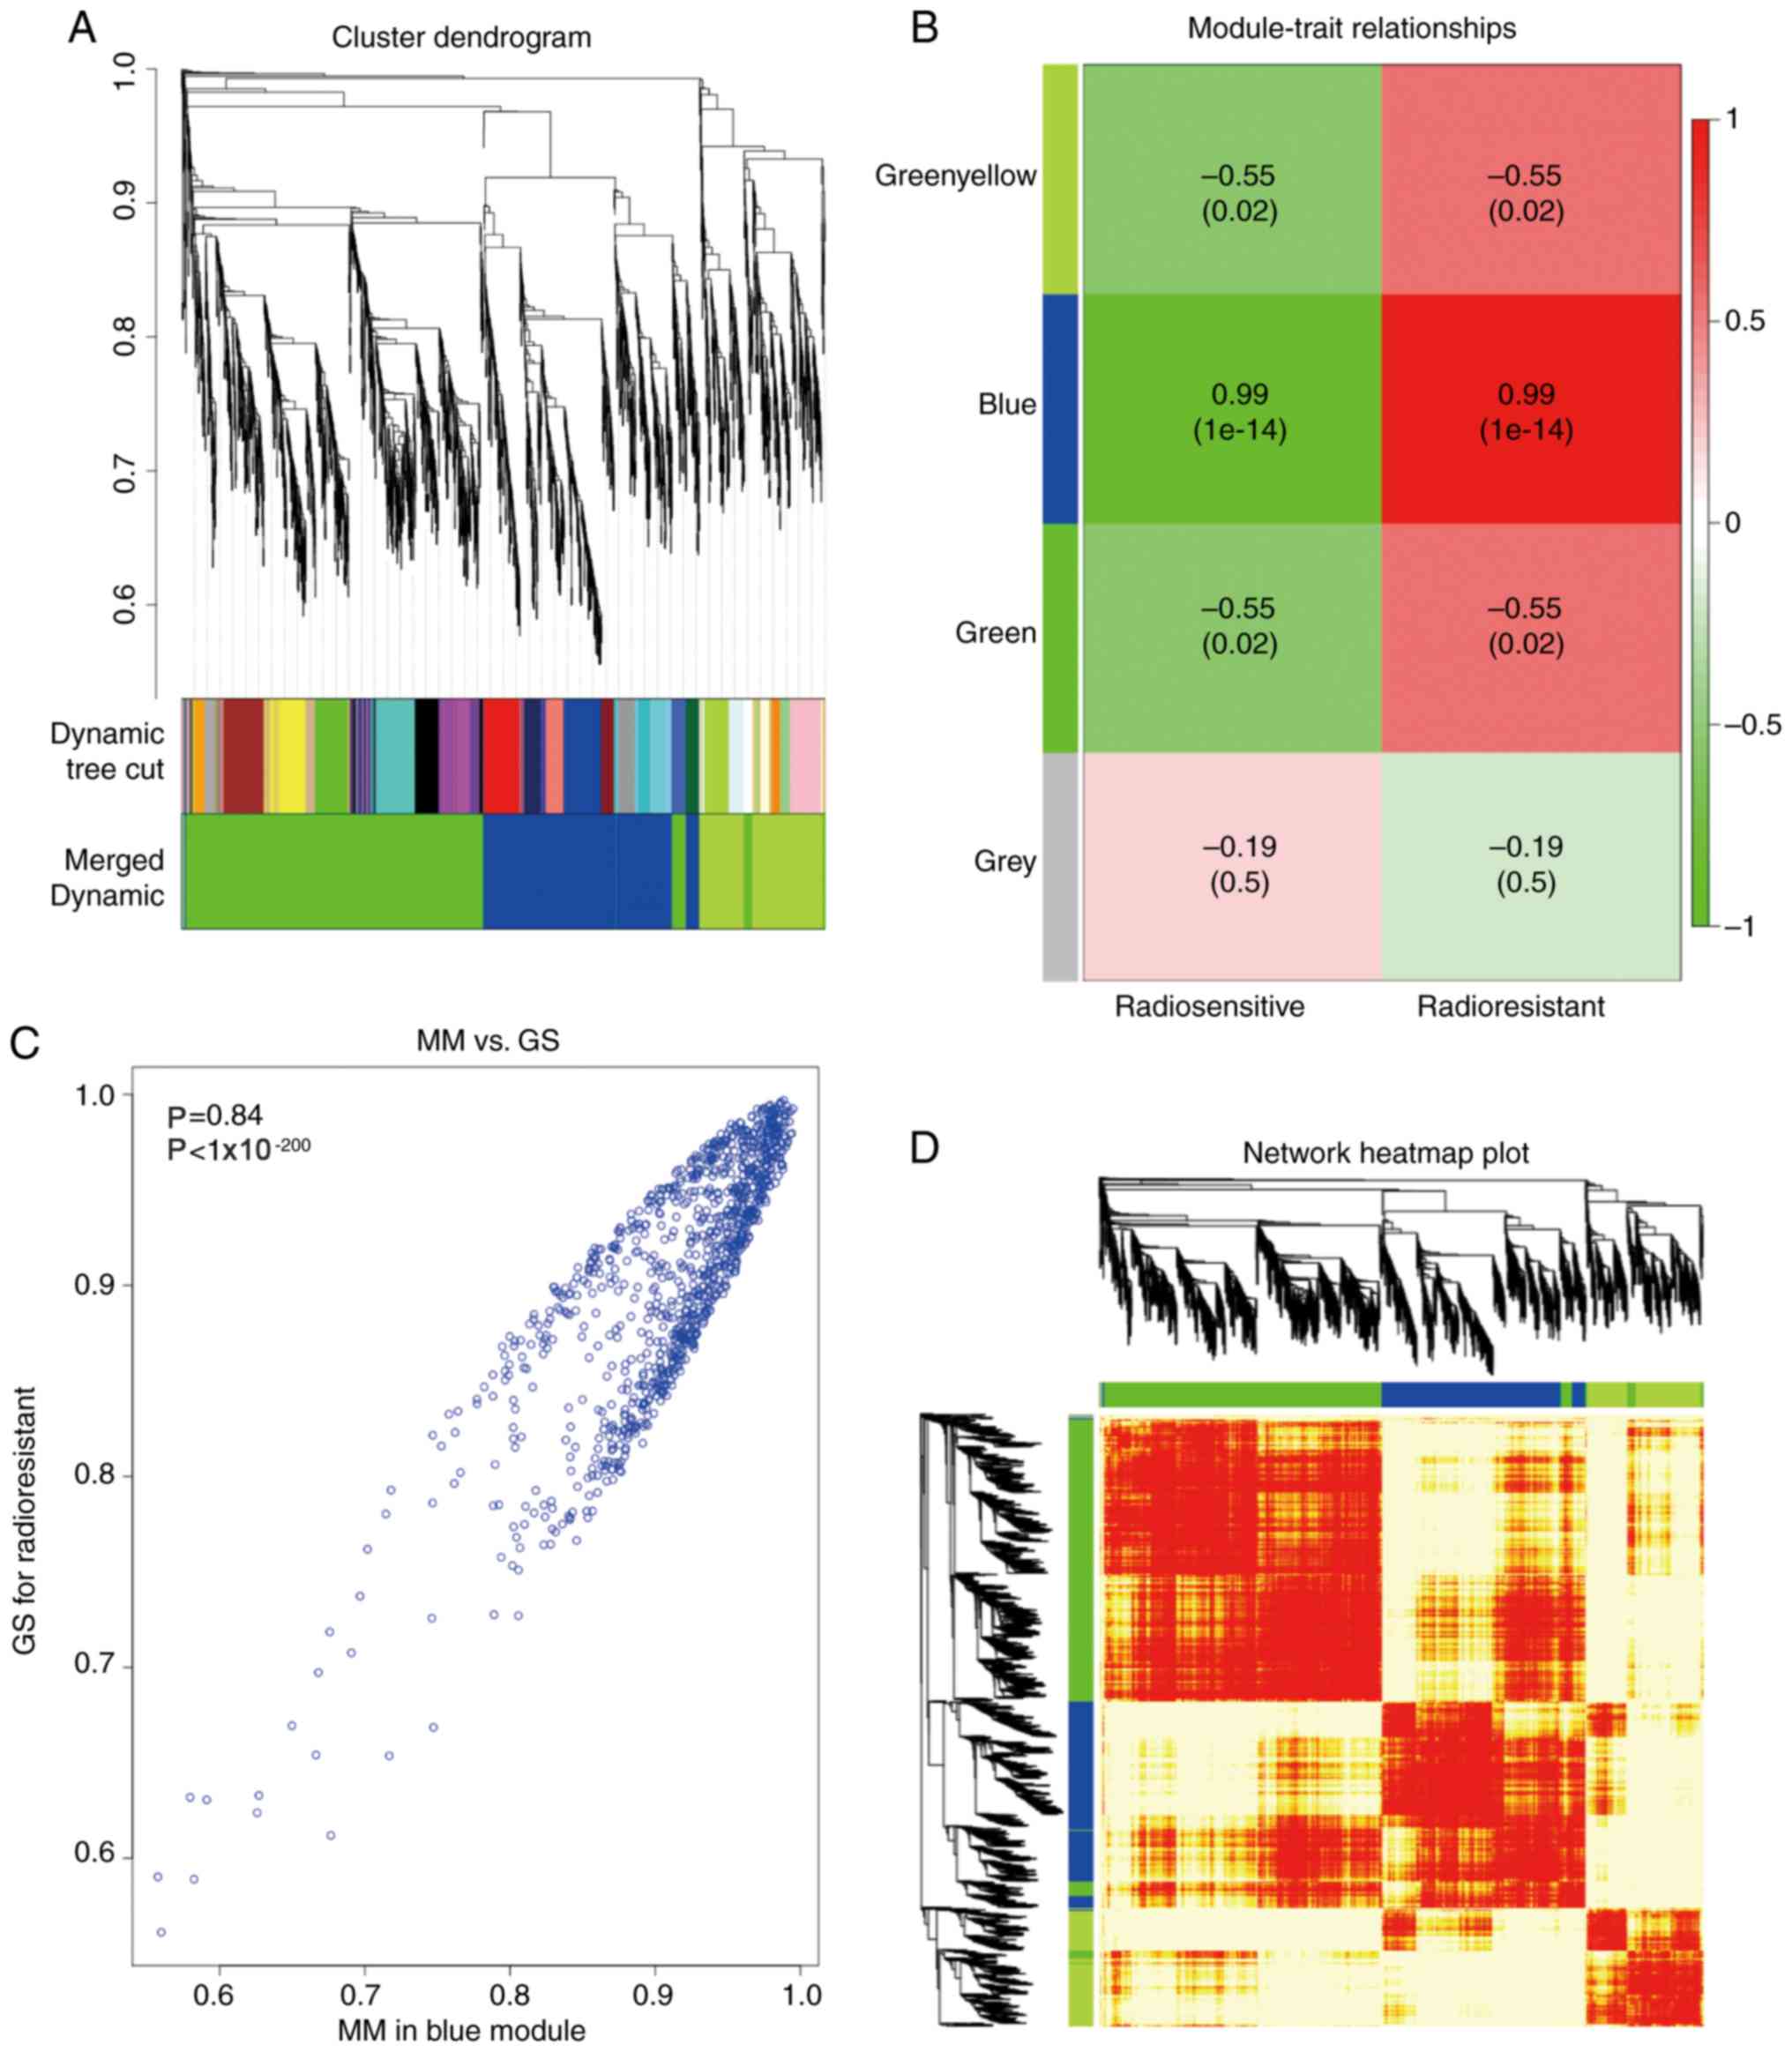
Co-expression network and
identification of hub genes
A WGCNA package was used to evaluate the correlation
of DEGs of the two groups and to search for the most significant
relevant gene modules associated with radioresistance (15). The soft thresholding power of the
non-irradiation group was set as 20 and the post-irradiation group
was set as 22 to certify a scale-free network. The genes that had
the soft-thresholding power below 20 in non-irradiation group or 22
in post-irradiation groups were defined as weak correlations and
thus were merged. A total of eight modules were recognized in the
non-irradiation group and a total of four modules in the
post-irradiation group. Module membership (MM) and gene
significance (GS) were used to analyze the correlation between each
module and radioresistance. Several modules showed an association
with radioresistance in the two groups and only the correlation
between the light green module in the non-irradiation group
(P<0.01, R2=0.98) and the blue module in the
post-irradiation with radioresistance was high (P<0.01,
R2=0.99). The two modules were highly correlated with
radioresistance and were thus used for subsequent analysis
(Figs. 2B and 3B). Hub genes play a significant role in
cell biological processes (16,17).
Genes with a high MM were set as candidate hub genes for
radioresistance in the module, with weighted correlation
coefficients >0.8 (Figs. 2C and
3C).
Statistical analysis
Statistical analyses were performed using SPSS
version 17 (SPSS, Inc.). The key genes were analyzed using Kaplan
Meier-Plotter (http://kmplot.com/analysis/), an online database for
survival data analyses. HNSCC samples were split into two groups as
follows based on POPDC3 expression (high vs. low/medium). To
determine whether the predictive power of POPDC3 expression level
could be independent of other clinical variables. The univariate
and multivariate cox regression analyses, as well as Kaplan-Meier
curves were conducted, hazard ratios and corresponding 95%
confidence interval (CI) of variables were also calculated. Then a
prognostic nomogram model was constructed to further evaluate the
prognostic ability of the marker. The appropriate cut-off values
for POPDC3 expression level based on OS information were determined
with X-tile software (Yale University; version 3.6.1). All data are
presented as the mean ± standard error of the mean. P<0.05 was
considered to indicate a statistically significant difference.
Results
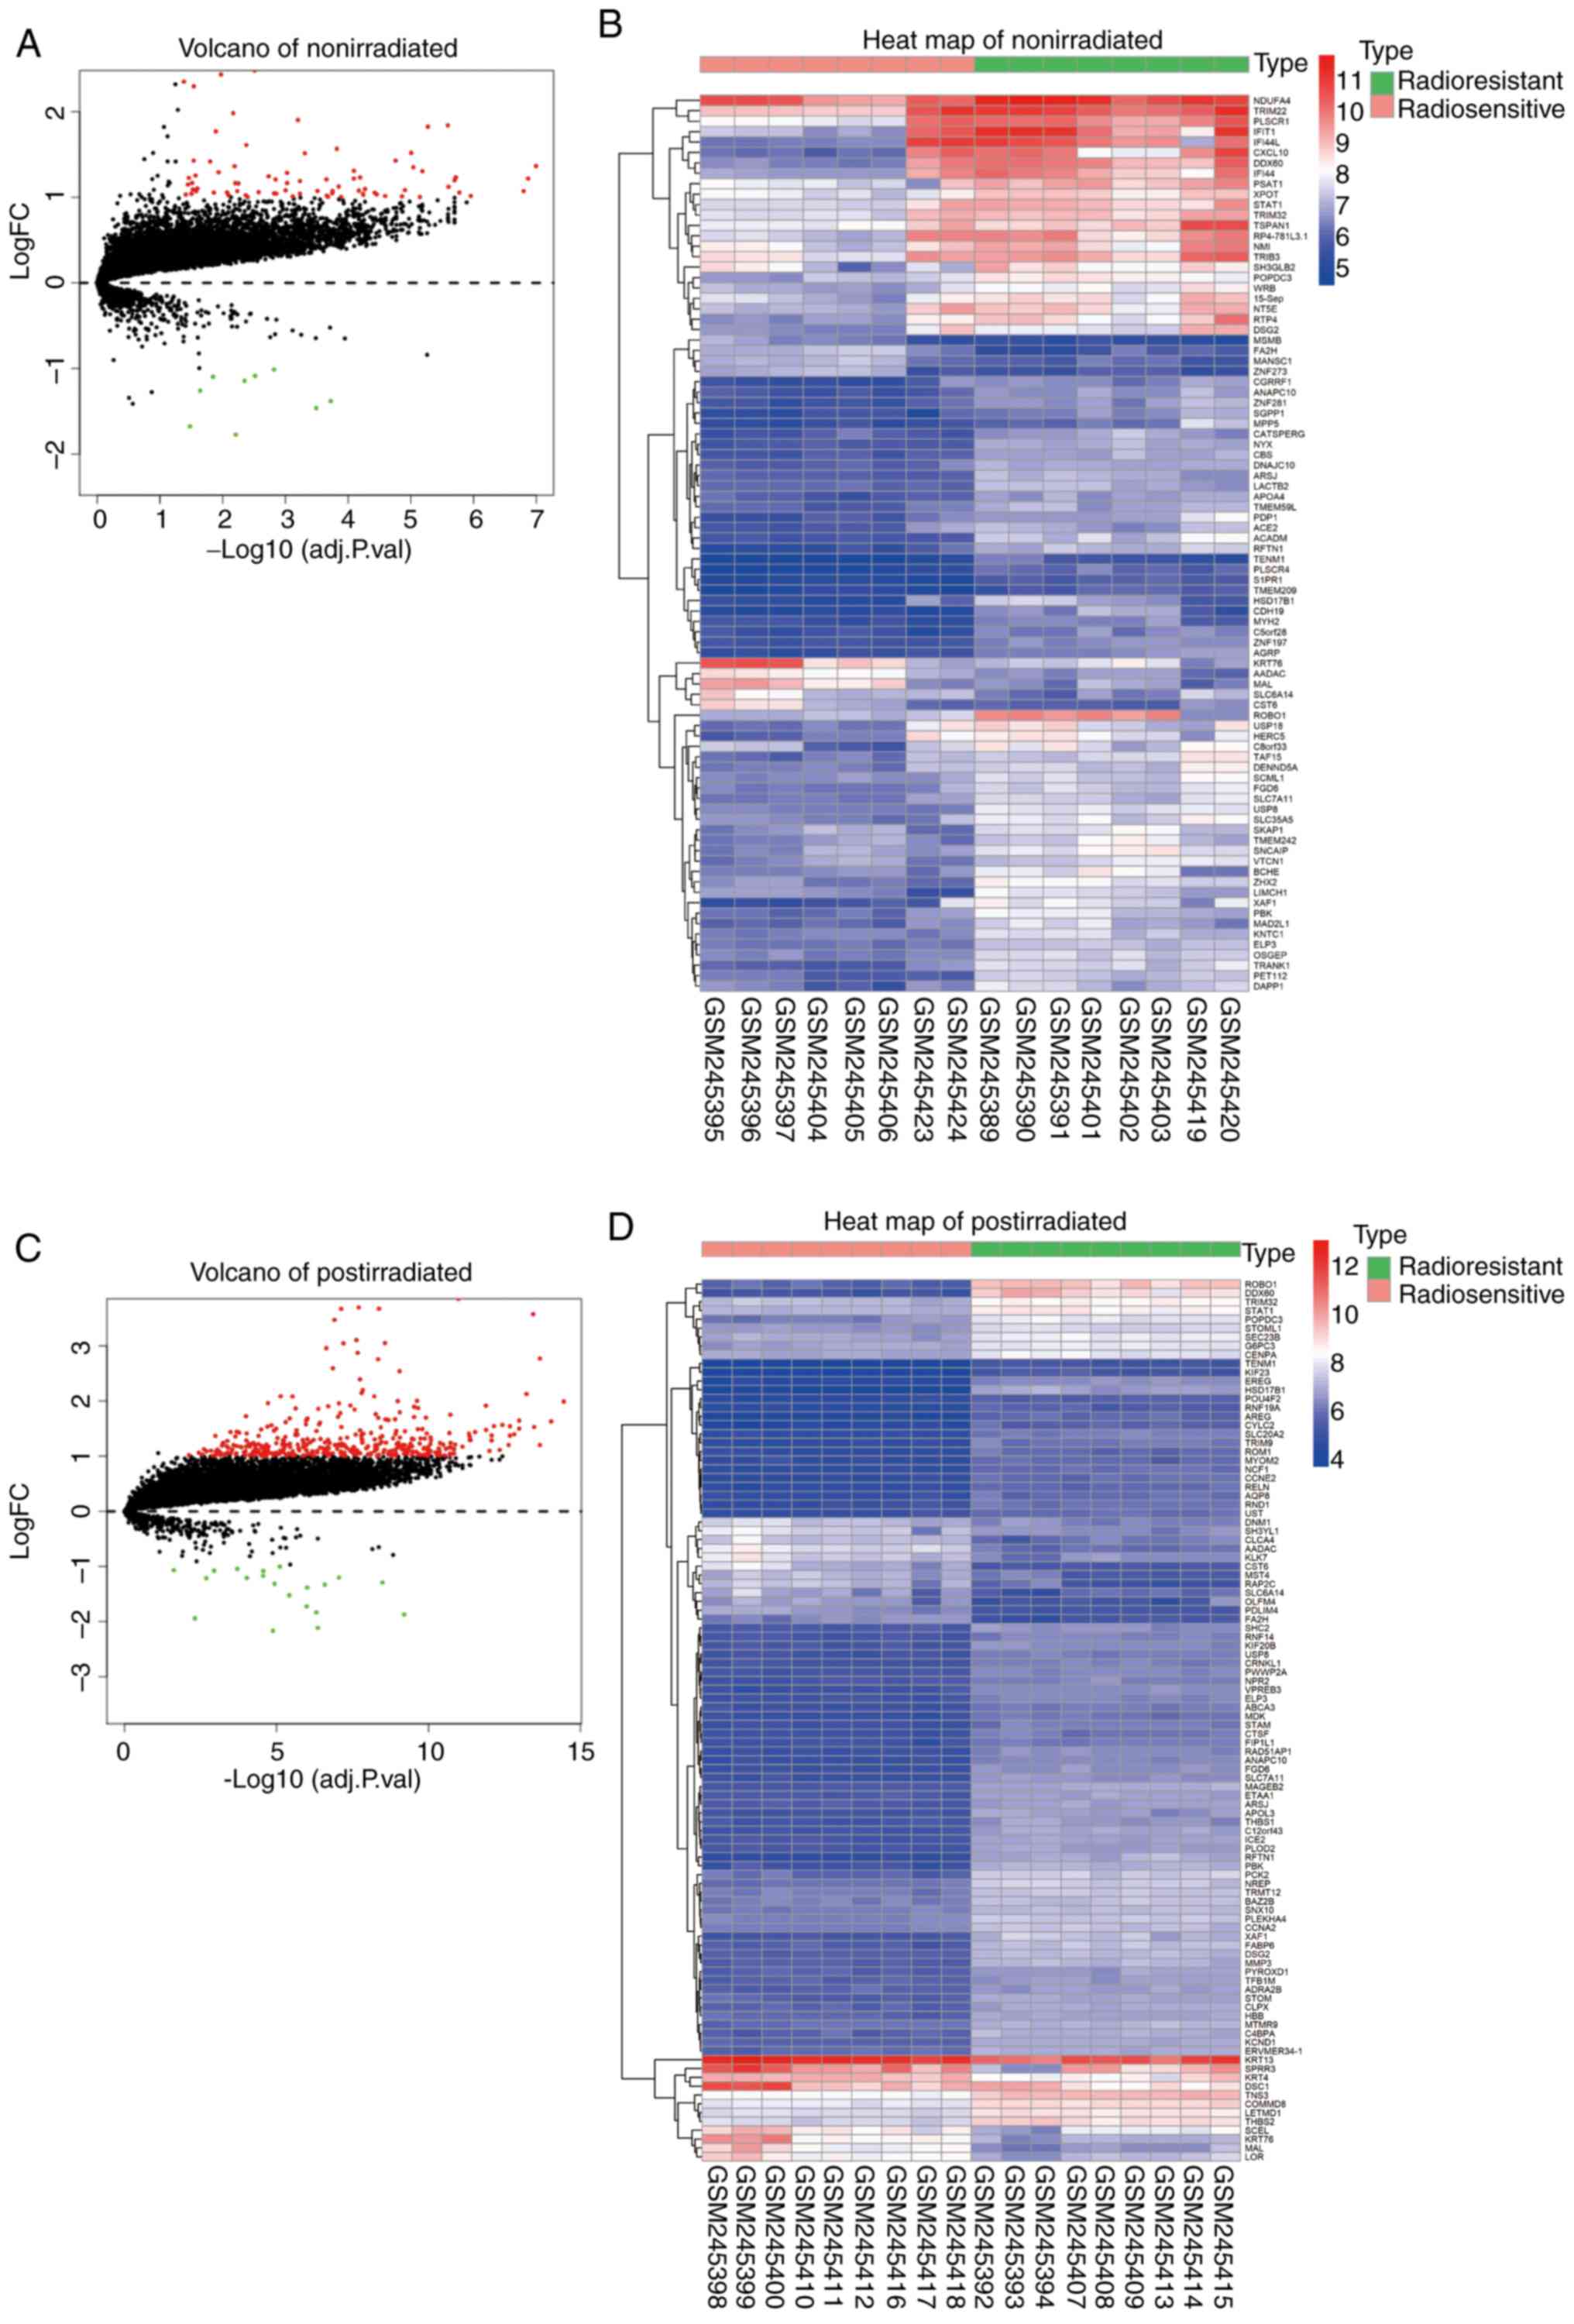
Identification of DEGs in head and
neck cancer
After data preprocessing, the GSE9716 dataset was
divided into two groups according to their exposure to irradiation:
Non-irradiation group and post-irradiation group. The DEGs of each
group were analyzed based on the limma R package. P<0.05 and
|log2 FC|>1 were set as the cut-off values. Based on the cut-off
value, a total of 86 DEGs were validated in the non-irradiation
group, consisting of 77 upregulated genes and 9 downregulated
genes. A total of 405 DEGs were validated in the post-irradiation
group, consisting of 385 upregulated genes and 20 downregulated
genes (Fig. 1A and C). The
significantly DEGs are presented in Fig.
1B and D.
KEGG and GO enrichment analyses of
DEGs
GO enrichment profiles and KEGG pathways were
generated from the differentially expressed genes in the two
groups, and the results are summarized in Tables I and II. The interferon-ν-mediated signaling
pathway (GO:0060333), the response to stilbenoid (GO:0035634),
leukocyte cell-cell adhesion (GO:0007159) and others were enriched
in the non-irradiation group (Table
I). Viral carcinogenesis, activation of mitogen associated
protein kinase (MAPK) activity, positive regulation of κB
kinase/NF-κB, complement and coagulation cascades and others were
significantly enriched in the post-irradiation group. These results
suggest that the biologically active signaling pathways were
notably different prior to and following irradiation. The
significantly enriched functions may improve understanding of the
characteristics and functions of DEGs involved in HNSCC.
 | Table I.GO enrichment analysis of
differentially expressed genes of nonirradiated group. |
Table I.
GO enrichment analysis of
differentially expressed genes of nonirradiated group.
| Term | Description | Count in gene
set | P-value |
|---|
| GO:0060333 |
Interferon-γ-mediated signaling
pathway | 2 | 0.0129 |
| GO:0035634 | Response to
stilbenoid | 2 | 0.0213 |
| GO:0010898 | Positive regulation
of triglyceride catabolic process | 2 | 0.0255 |
| GO:0032287 | Peripheral nervous
system myelin maintenance | 2 | 0.0297 |
| GO:0051607 | Defense response to
virus | 3 | 0.0413 |
| GO:0007159 | Leukocyte cell-cell
adhesion | 2 | 0.0422 |
| Table II.GO and Kyoto Encyclopedia of Genes
and Genomes pathway enrichment analysis of differentially expressed
genes of post-irradiated group. |
Table II.
GO and Kyoto Encyclopedia of Genes
and Genomes pathway enrichment analysis of differentially expressed
genes of post-irradiated group.
| Term | Description | Count in gene
set | P-value |
|---|
| GO:0060337 | Type I interferon
signaling pathway | 27 |
1.17×10⁻²⁶ |
| GO:0051607 | Defense response to
virus | 25 |
2.65×10⁻¹³ |
| GO:0060333 |
Interferon-γ-mediated signaling
pathway | 17 |
2.69×10⁻¹² |
| GO:0045087 | Innate immune
response | 23 |
2.61×10−04 |
| GO:0016032 | Viral process | 17 | 0.0011 |
| GO:0043123 | Positive regulation
of I-κB kinase/NF-κB signaling | 11 | 0.0032 |
| GO:0051603 | Proteolysis
involved in cellular protein catabolic process | 6 | 0.0041 |
| GO:0032728 | Positive regulation
of interferon-β production | 4 | 0.0214 |
| GO:0000187 | Activation of MAPK
activity | 7 | 0.0321 |
| GO:0001916 | Positive regulation
of T cell mediated cytotoxicity | 3 | 0.0327 |
| hsa05168 | Herpes simplex
infection | 17 |
1.70×10−05 |
| hsa04145 | Phagosome | 14 |
1.18×10−04 |
| hsa05169 | Epstein-Barr virus
infection | 10 | 0.0041 |
| hsa05203 | Viral
carcinogenesis | 13 | 0.0064 |
| hsa04913 | Ovarian
steroidogenesis | 6 | 0.0081 |
| hsa04610 | Complement and
coagulation cascades | 7 | 0.0084 |
| hsa05332 | Graft-versus-host
disease | 5 | 0.0097 |
| hsa04612 | Antigen processing
and presentation | 7 | 0.0132 |
| hsa05330 | Allograft
rejection | 5 | 0.0144 |
| hsa04144 | Endocytosis | 13 | 0.0213 |
Co-expression network construction and
hub module identification
Using the WGCNA package in R, the genes in each
group with highly similar expression patterns were combined into
the modules using average linkage hierarchical clustering. A power
20 for the non-irradiation group and 22 for the post-irradiation
group were set as the soft-thresholding to certify a scale-free
network. In the non-irradiation group, a total of eight modules
were recognized (Fig. 2A), whereas
in the post-irradiation group, four modules were identified
(Fig. 3A). The association between
each module and radioresistance traits were demonstrated in each
group (Figs. 2B and 3B). The association between the light green
module and radioresistance traits was high (P=1.9×10⁻²⁰,
R2=0.83) in the non-irradiation group (Fig. 2B), whereas in the post-irradiation
group, the blue module was highly associated with radioresistance
traits (P=1×10−200, R2=0.84; Fig. 3B). The corresponding heatmaps of all
genes are shown in Figs. 2C and
3C. Furthermore, a scatter diagram
of the correlation between GS for radioresistance traits and MM in
the light green or blue module are shown in each group in Figs. 2D and 3D, respectively, which exhibited an
extremely strong association with HNSCC. There were reported hub
genes, which served notable functions in various cell processes
(7,8). Weighted correlation coefficients
>0.8 were set for the candidate hub genes for radioresistance in
the module. A total of 76 genes in the light green module and 917
genes in the blue module with a high connectivity were selected for
further analysis.
Selection of POPDC3 and its utility as
a biomarker of radioresistance in patients with HNSCC
The overlap among DEGs from the two groups and the
hub genes of the light green and blue modules, contained 13 shared
DEGs: RFTN1, PBK, TENM1, ARSJ, ELP3, USP8, XAF1, POPDC3, LACTB2,
ZHX2, PET112, TRANK1 and ACADM (Fig.
4A). The 13 genes were screened as candidate genes for their
ability to predict radioresistance in patients with HNSCC, which
may serve to maintain the radioresistance profile of cancer cells
and promote the radioresistant abilities of cancer cells following
irradiation. The FC of expression of the 13 candidate genes in the
post-irradiation group relative to the non-irradiation group is
shown in Fig. 4B. PBK and POPDC3
were the top two high expression genes in the post-irradiation
group compared with the non-irradiation group (Fig. 4B). The effects of these two genes on
the survival of patients with HNSCC was evaluated by Kaplan-Meier
analysis. Only POPDC3 was significantly associated with the
prognosis of patients with HNSCC (P<0.001). The overall survival
(OS) was significantly longer in patients with lower levels of
POPDC3 expression compared with patients with higher levels of
POPDC3 expression (P<0.001; Fig.
4C). In addition, several datasets were used to identify the
mRNA expression levels of POPDC3. The results further demonstrated
that POPDC3 expression was significantly increased in HNSCC tissues
compared with normal tissues (P<0.05; Fig. 4D-G). Based on raw data mining from
the GEO database (GSE61772 and GSE20549), POPDC3 expression was
significantly increased in the radioresistant samples compared with
the radiosensitive samples in esophageal and lung cancer
(P<0.01; Fig. 4H and I), further
illustrating the value of POPDC3 expression as a biomarker for
radioresistance and the role it may serve in various types of
cancer. Finally, a PPI network based on POPDC3 was constructed.
Several proteins participating in the progression of cancer, such
as KIF20A and SLU7 interacted with POPDC3 according to the PPI
network.
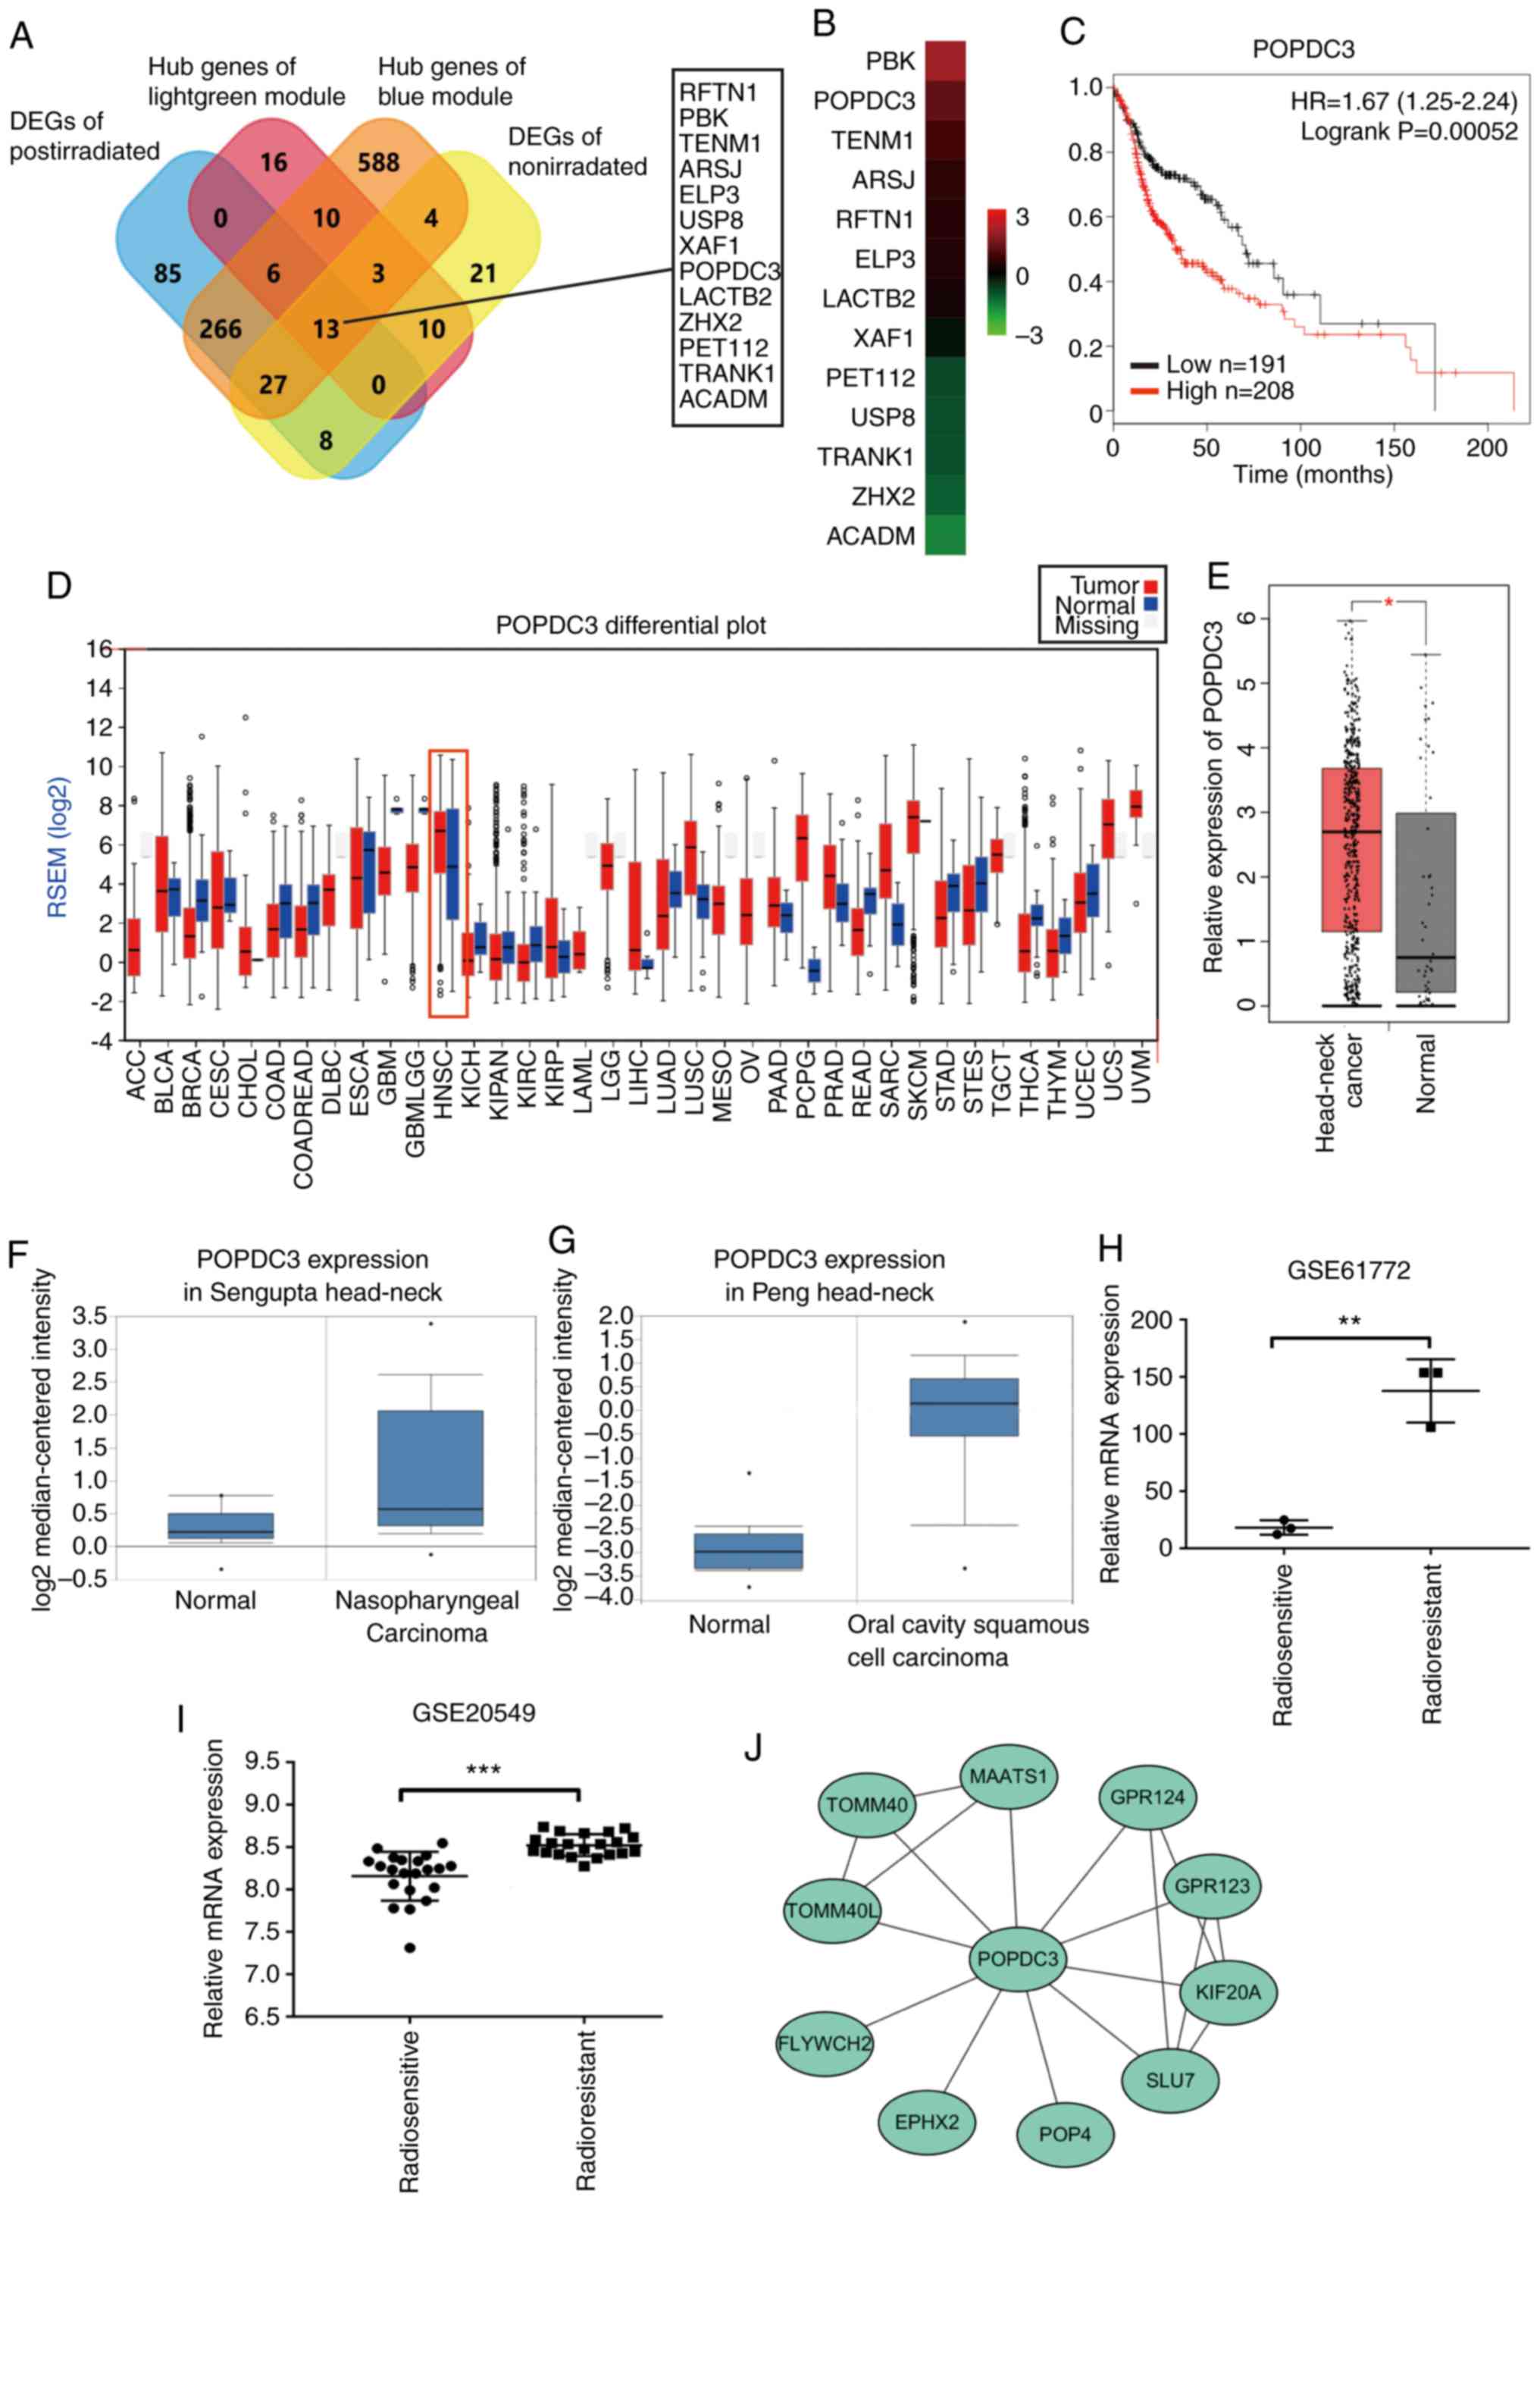 | Figure 4.POPDC3 expression profile in
different public datasets and utility as a biomarker and prognostic
factor for radioresistance in patients with HNSCC. (A) Venn diagram
of the differentially expressed genes of the post-irradiation,
non-irradiation and hub genes in the blue module, and hub genes in
the light green module identified 13 candidate genes. (B) Gene
expression profiling was performed on the post-irradiation and
non-irradiation groups. Red and green represent the fold-change of
expression of the 13 candidate genes in the post-irradiation group
relative to the non-irradiation group, red represented upregulated
genes and green represented downregulated genes. (C) Kaplan-Meier
analysis indicated that the patients with HNSCC with a high
expression level of POPDC3 have a poor overall survival compared
patients with a low expression level of POPDC3 (P=0.00052). A high
level of expression of POPDC3 in HNSCC compared with normal tissues
in the (D) firebrowse database, (E) protein atlas database and
Oncomine database in (F) nasopharyngeal carcinoma and (G) oral
cavity squamous cell carcinoma. Validation of POPDC3 mRNA
expression levels according to the Gene Expression Omnibus
databases (H) GSE61772 and (I) GSE20549. A total of two of the
datasets showed a higher level of expression of POPDC3 in
radioresistant samples compared with the counterpart radiosensitive
samples. (J) Protein-protein interaction network of POPDC3. Several
genes participating in cancer progression, such as KIF20A and SLU7,
linearly interacted with POPDC3. HNSCC, head and neck squamous cell
carcinoma; POPDC3, popeye domain-containing protein 3. *P<0.05,
**P<0.01, ***P<0.001. |
Prognostic variables
Data on 161 patients with HNSCC was obtained from
TCGA (Table III). The survival
times of the patients with HNSCC in TCGA was used to perform X-tile
analysis using X-tile. The analyses showed that high expression of
POPDC3 was associated with poor clinical outcome compared with
patients with low and medium levels of POPDC3 expression. The
X-tile analysis with the optimal cut-off value of POPDC3 were
categorized as low (0.8 to 5.7), intermediate (5.7 to 8.2) and high
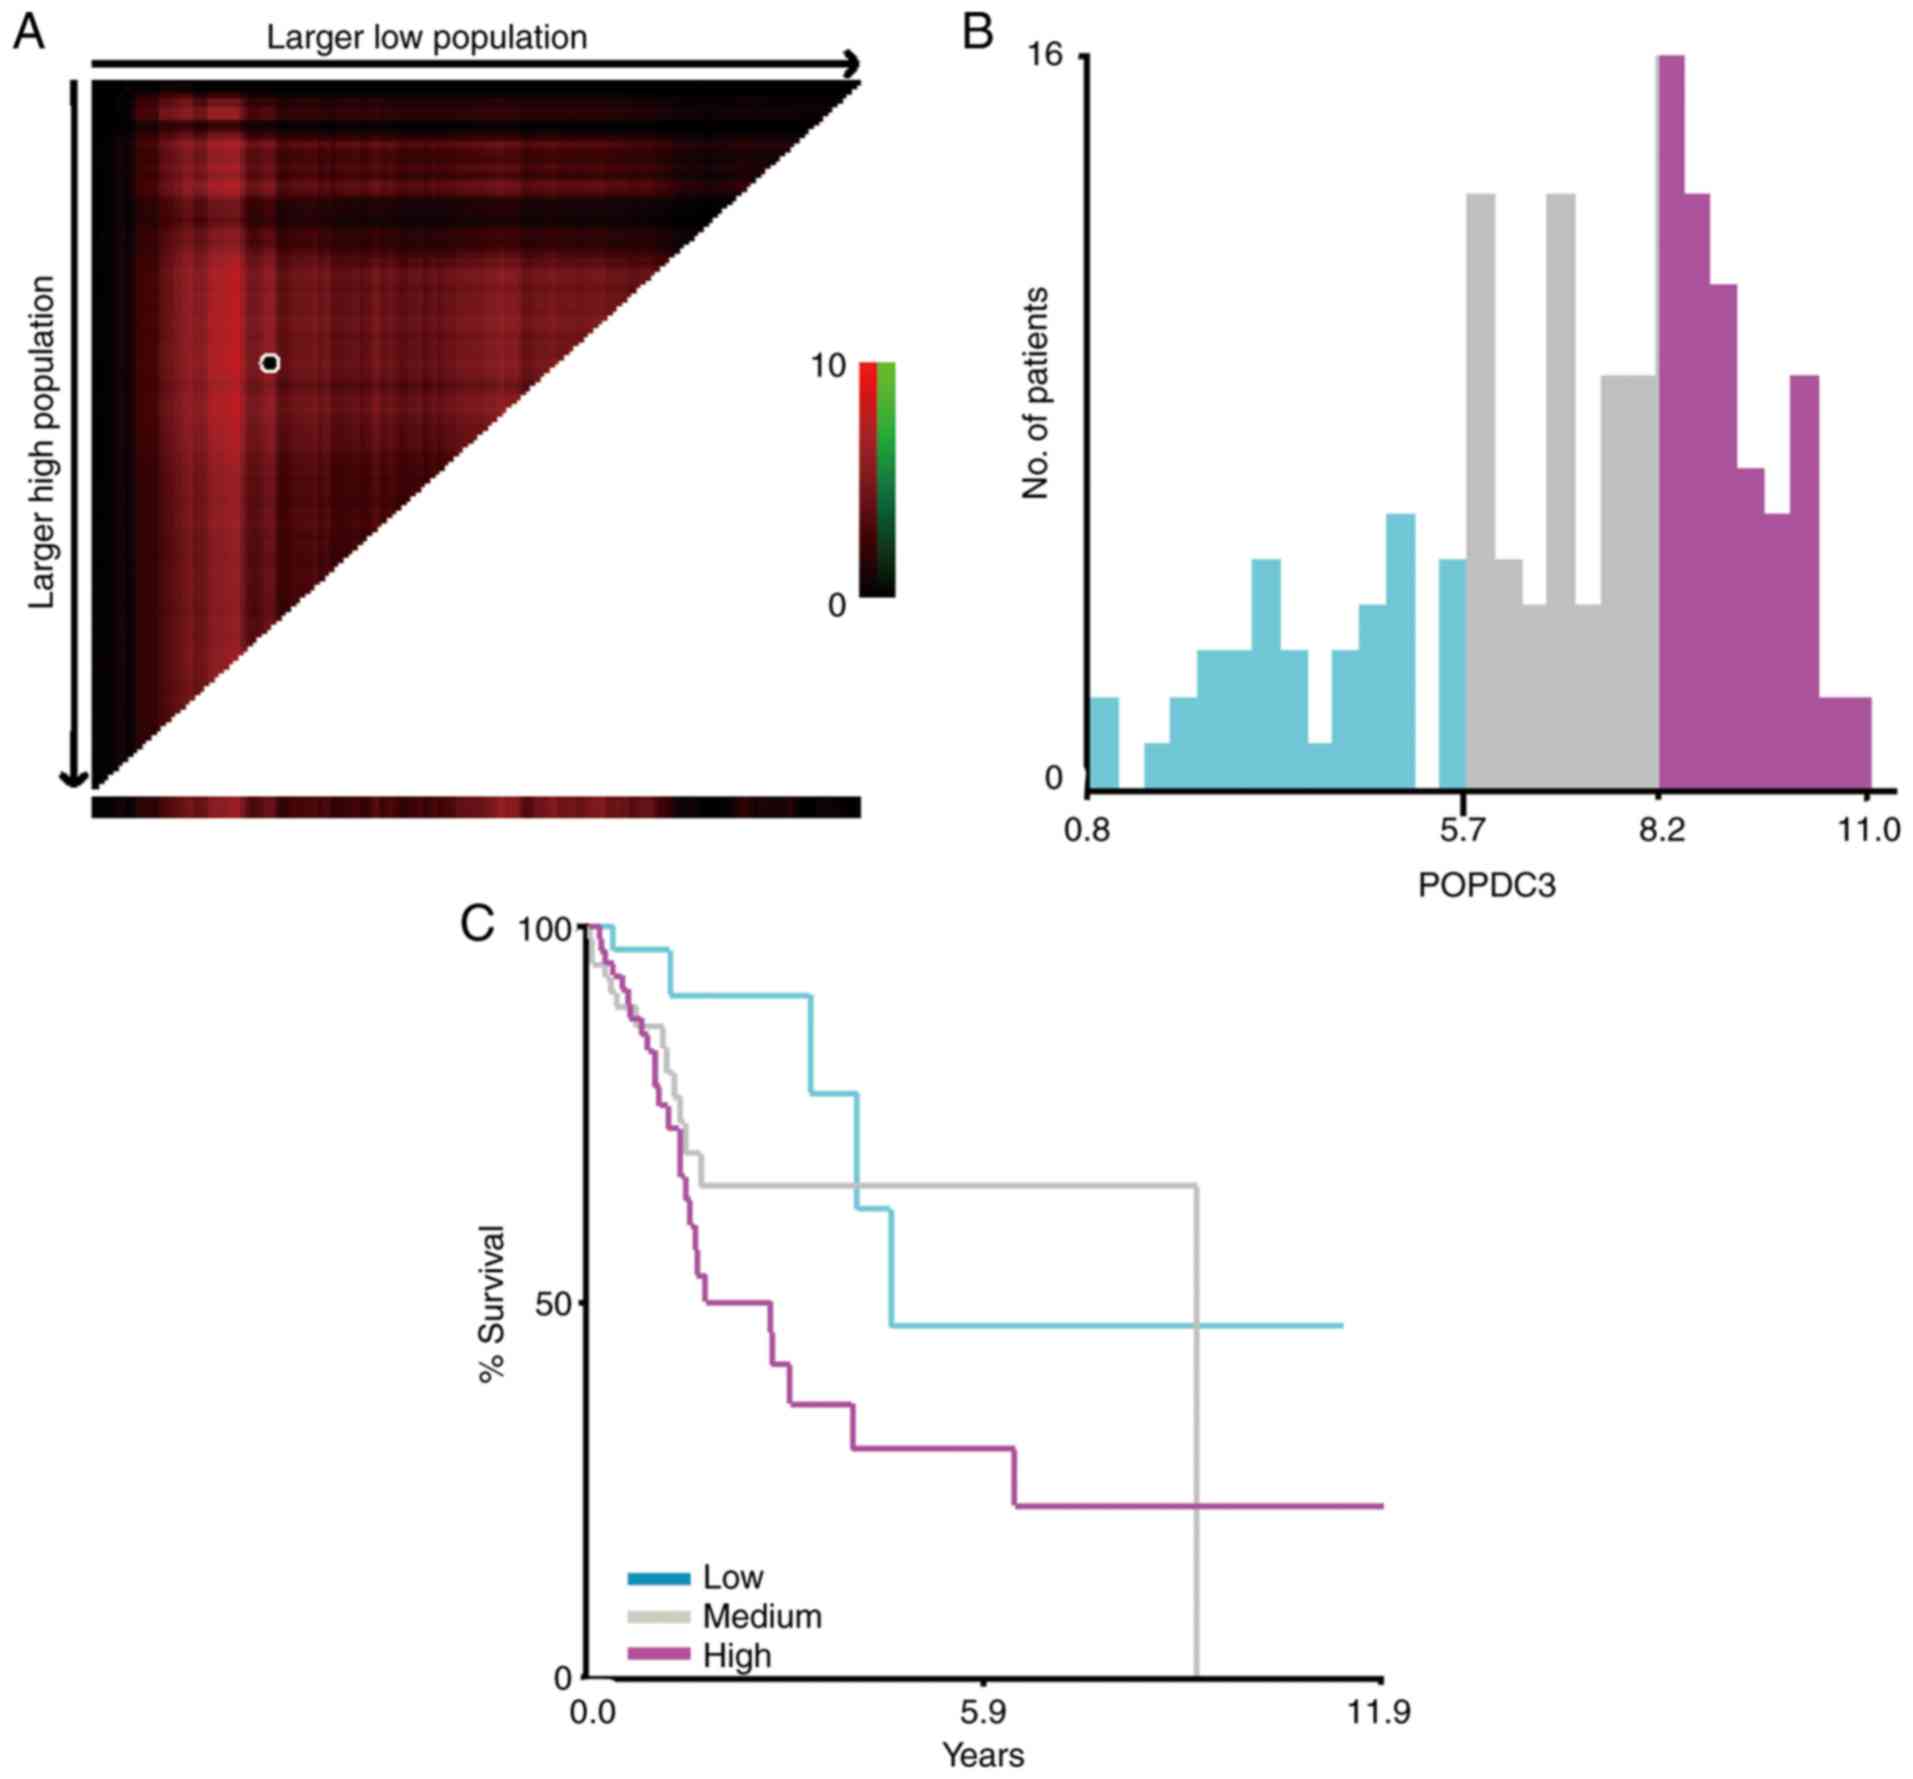
(8.2 to 11.0) based on OS information (Fig. 5).
| Table III.Association of POPDC3 expression with
clinicopathological characteristics in head and neck squamous cell
carcinoma patients. |
Table III.
Association of POPDC3 expression with
clinicopathological characteristics in head and neck squamous cell
carcinoma patients.
|
| Patients | POPDC3
expression |
|
|---|
|
|
|
|
|
|---|
|
Characteristics | n | % | High | Low | P-value |
|---|
| All patients | 161 | 100 | 80 | 81 |
|
| Sex |
|
|
|
|
<0.001a |
|
Male | 124 | 77.0 | 58 | 66 |
|
|
Female | 37 | 23.0 | 31 | 6 |
|
| Age (years) |
|
|
|
|
<0.001a |
|
<60 | 69 | 42.9 | 33 | 36 |
|
|
≥60 | 92 | 57.1 | 71 | 21 |
|
| T_stage |
|
|
|
| 0.600 |
| T1 | 7 | 4.3 | 3 | 4 |
|
| T2 | 35 | 21.7 | 3 | 4 |
|
| T3 | 35 | 21.7 | 15 | 20 |
|
| T4 | 84 | 52.3 | 46 | 38 |
|
| N_stage |
|
|
|
| 0.244 |
| N0 | 74 | 46.0 | 32 | 42 |
|
| N1 | 32 | 21.7 | 16 | 16 |
|
|
N2+N3 | 55 | 32.3 | 32 | 23 |
|
| Grade |
|
|
|
| 0.070 |
| 1 | 17 | 10.6 | 4 | 13 |
|
| 2 | 102 | 63.4 | 53 | 49 |
|
| 3 | 42 | 26.1 | 23 | 19 |
|
| Clinical_stage |
|
|
|
| 0.347 |
|
I+II | 24 | 14.9 | 10 | 14 |
|
|
III | 29 | 18.0 | 12 | 14 |
|
| IV | 108 | 67.1 | 58 | 50 |
|
| LN_positive |
|
|
|
| 0.062 |
|
Negative | 64 | 39.8 | 26 | 38 |
|
|
Positive | 97 | 60.2 | 54 | 43 |
|
| LN_invasion |
|
|
|
| 0.794 |
|
Negative | 99 | 61.5 | 50 | 49 |
|
|
Positive | 62 | 38.5 | 30 | 32 |
|
To evaluate the prognostic value of POPDC3 in
patients with HNSCC, the 161 patient samples were divided into two
groups: Low POPDC3 expression group (n=81) and high POPDC3
expression group (n=80) based on the median value. A χ2
test showed that elevated POPDC3 expression in primary tumors was
significantly associated with sex (male; P<0.001) and age ≥60
(P<0.001; Table III).
Univariate analysis showed that higher POPDC3 expression levels and
lymph node metastases predicted poorer survival [hazard ratio
(HR)=1.886, CI 1.019–3.491; P=0.043] and a HR=2.309 (CI
1.163–4.584; P=0.017), respectively. Multivariate Cox proportional
hazard analyses were used to control for potential confounding
variables. The multivariate Cox analysis showed that POPDC3
expression levels (HR=0.516, CI, 0.270–0.985; P=0.045) and lymph
node metastasis (HR=2.456, CI, 1.088=5.546; P=0.031) were
independent prognostic factors in patients with HNSCC (Table IV).
| Table IV.Multivariate cox regression analysis
for overall survival in head and neck squamous cell carcinoma
patients. |
Table IV.
Multivariate cox regression analysis
for overall survival in head and neck squamous cell carcinoma
patients.
|
| Univariate
analysis | Multivariate
analysis |
|---|
|
|
|
|
|---|
| Variables | HR (95% CI) | P | HR (95% CI) | P |
|---|
| POPDC3 (High vs.
Low) | 1.886
(1.019–3.491) | 0.043a | 0.516
(0.270–0.985) | 0.045a |
| Sex (Female vs.
Male) | 0.989
(0.488–2.007) | 0.976 | 1.178
(0.606–1.679) | 0.535 |
| Age (≥60
vs.60) | 1.082
(0.589–1.990) | 0.799 | 1.319
(0.691–2.519) | 0.401 |
| T stage |
|
| 0.738
(0.474–1.149) | 0.179 |
| T1 | RV |
|
|
|
| T2 | 0.647
(0.166–2.516) | 0.530 |
|
|
| T3 | 0.883
(0.250–3.117) | 0.847 |
|
|
| T4 | 0.510
(0.151–1.722) | 0.278 |
|
|
| N_stage |
|
| 1.064
(0.658–1.720) | 0.801 |
| N0 | RV |
|
|
|
| N1 | 1.670
(0.802–3.480) | 0.557 |
|
|
|
N2-N3 | 1.532
(0.753–3.120) | 0.539 |
|
|
| Grade |
|
| 0.738
(0.428–1.273) | 0.275 |
| G1 | RV |
|
|
|
| G2 | 1.781
(0.539–5.882) | 0.344 |
|
|
| G3 | 1.290
(0.361–4.618) | 0.695 |
|
|
| Clinical_stage |
|
| 0.994
(0.495–1.995) | 0.275 |
|
I+II | RV |
|
|
|
|
III | 1.886
(0.602–5.905) | 0.276 |
|
|
| IV | 1.222
(0.426–3.511) | 0.709 |
|
|
| LN_positive |
|
| 2.456
(1.088–5.546) | 0.031a |
|
Negative | RV |
|
|
|
|
Positive | 2.309
(1.163–4.584) | 0.017a |
|
|
| LN_invasion |
|
| 1.178
(0.606–2.290) | 0.628 |
|
Negative | RV |
|
|
|
|
Positive | 1.363
(0.748–2.484) | 0.311 |
|
|
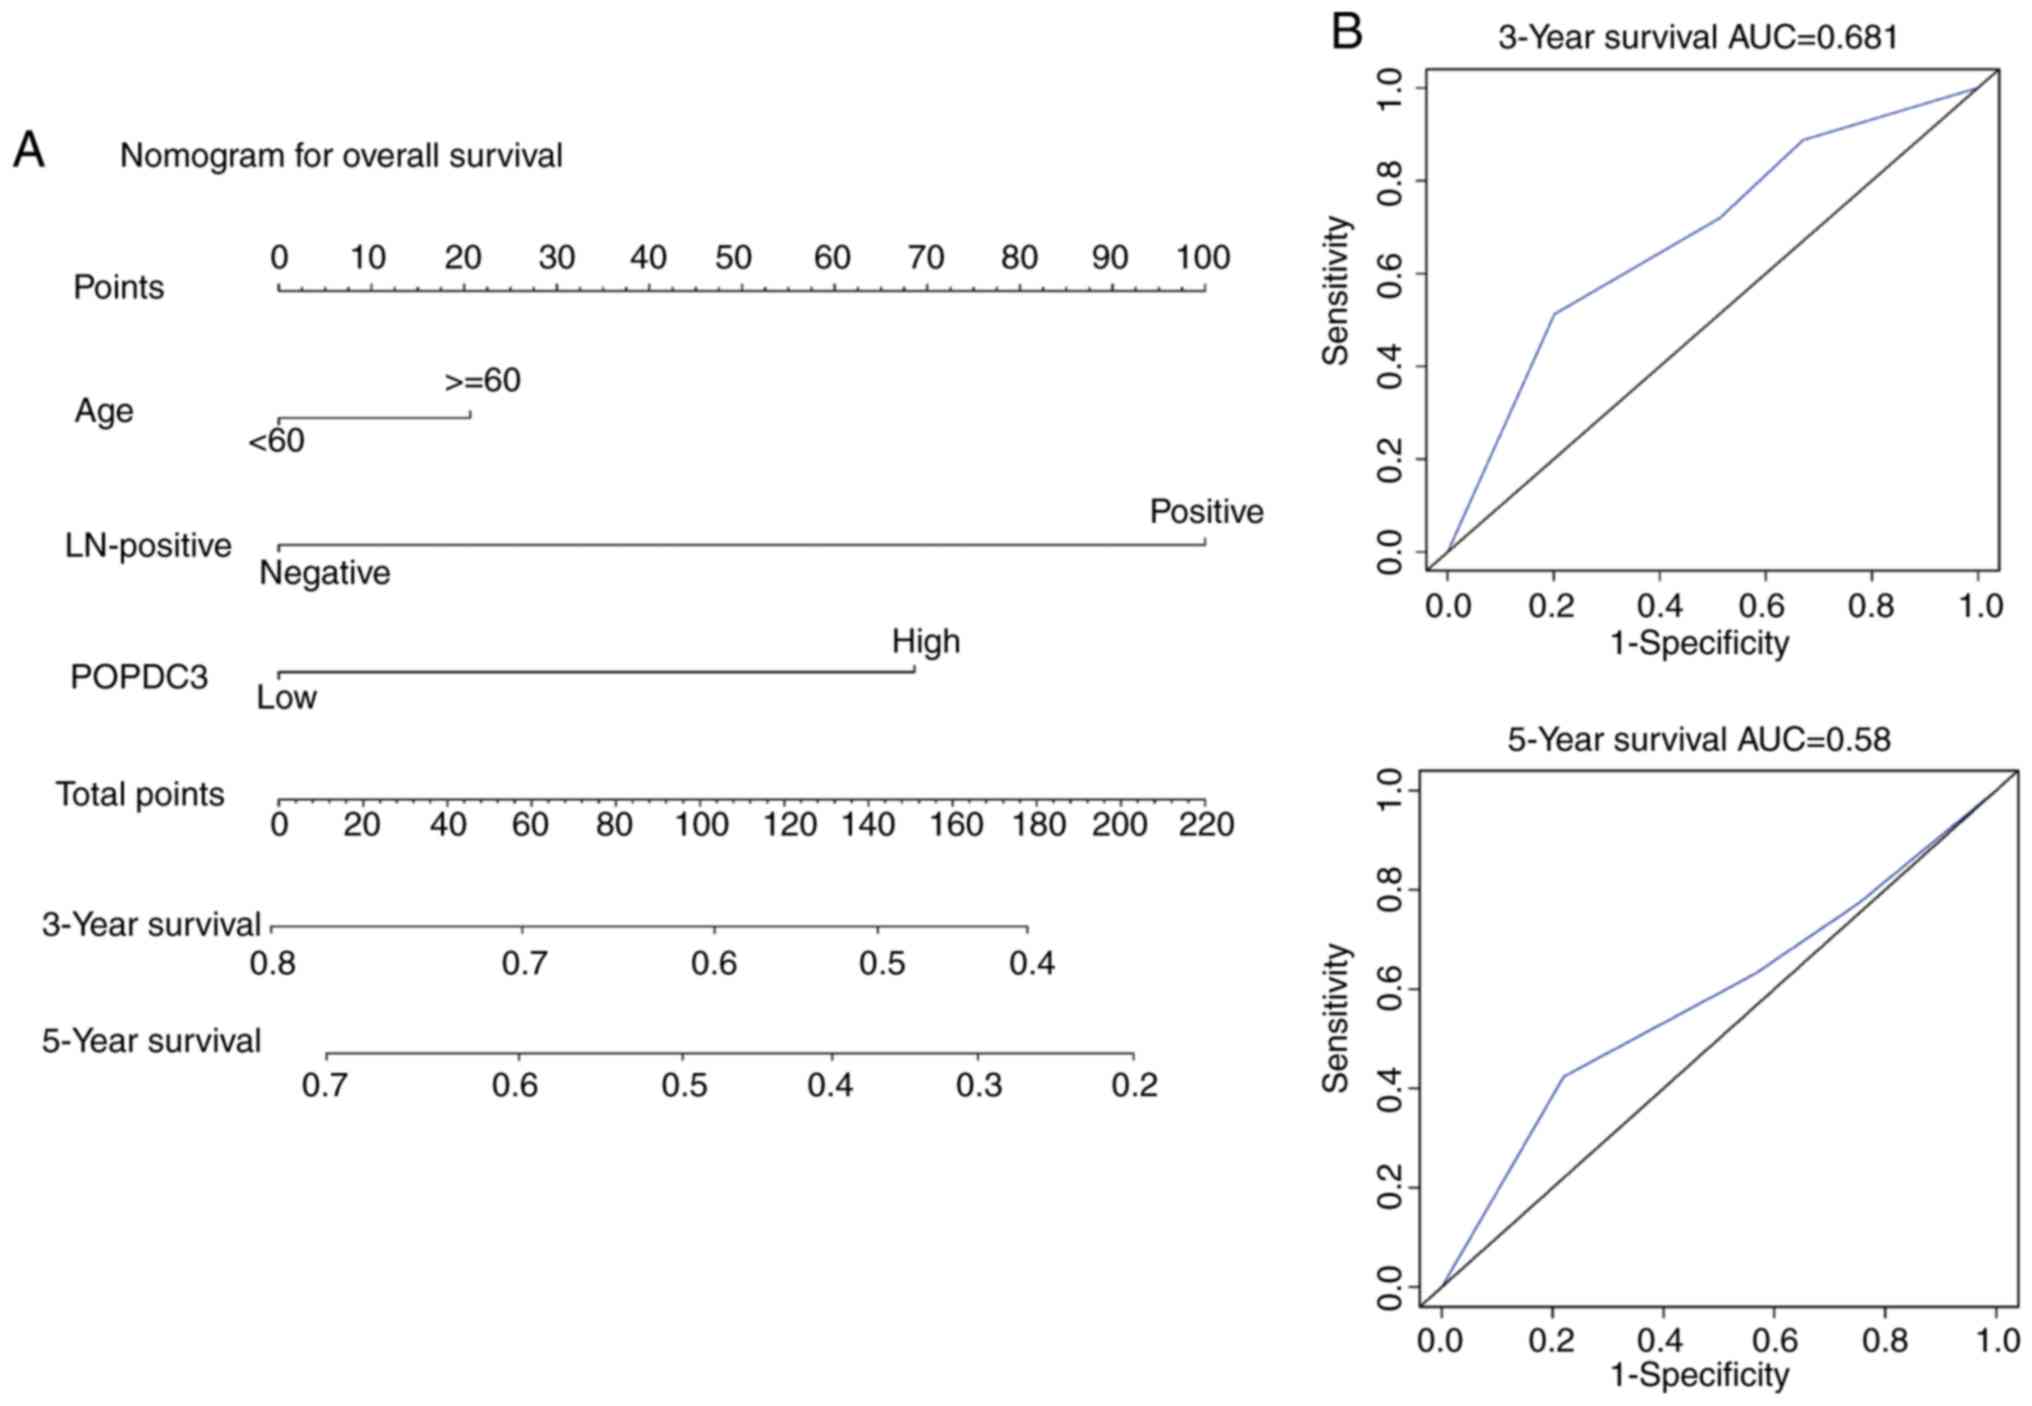
Construction and validation of the OS
nomograms
The significant influencing factors, POPDC3
expression levels, lymph node metastasis and age at diagnosis were
incorporated to create the prognostic nomograms for estimating the
3- and 5-year OS of patients with HNSCC (Fig. 6A). By adding up these scores to the
total on the bottom scale, the 3- and 5-year OS of patients with
HNSCC could be predicted. Prognostic nomogram validation was
conducted using receiver operating characteristic (ROC) curves
(Fig. 6B). The ROC curve showed that
the area under the curve for nomogram predictions of the 3- and
5-year survival rates were 0.681 and 0.58, respectively. These
results confirm that the prognostic nomograms were reasonably
accurate. The ROC curves demonstrated excellent agreement between
actual survival and nomogram prediction. Based on the prognostic
factors of an individual patient with HNSCC, it was possible to
obtain a score associated with each prognostic factor on the
nomogram point scale and calculate the total score. From this it
was possible to evaluate the 3- and 5-year survival rates by
projecting the total points to the total score scale of the
nomogram.
Discussion
HNSCC remains a fatal malignancy with a ~60% 5-year
OS rate for all stages combined (1).
Radiation therapy remains one of the most effective treatment
options for HNSCC. However, locoregional failure is the most common
cause of death, suggesting the presence of a radioresistant
subpopulation of cells. Therefore, local disease recurrence
requires further investigation (18,19). The
previously irradiated exposure area does not benefit from
re-irradiation due to radiation resistance of the cancer cells
(20). Therefore, further
investigations of the mechanisms leading to the unresponsiveness to
radiation therapy and the ability to better predict locoregional
relapses are urgently required. Additional knowledge regarding
radioresistant-associated molecular perturbations in HNSCC may
assist in the development of novel strategies to overcome HNSCC
radioresistance.
At present, few studies have analyzed GEO databases
to identify potential differences in transcriptional regulation and
the network of proteins involved in radioresistance of HNSCC. In
the present study, the gene expression data from the GEO database
(GSE9716) was downloaded and divided into non-irradiated and
post-irradiation groups. A comprehensive analysis based on the
combination of DEGs and WGCNA was performed to identify valuable
potential prognostic factors and biomarkers. The DEGs that
exhibited higher expression levels the in radioresistant samples
compared the radiosensitive samples were mapped. A total of 86
DEGs, including 77 upregulated genes and 9 downregulated genes were
identified in the non-irradiation group, while a total of 405 DEGs,
including 385 upregulated genes and 20 downregulated genes were
identified in the post-irradiation group. GO term enrichment and
KEGG pathway analysis were used to further investigate the
functional enrichment of these two groups of genes. In WGCNA, the
light green module in the non-irradiation group and the blue module
in the post-irradiation group were the highest correlative modules
to radioresistance traits. The genes in these two modules were
further selected for hub genes with a cut-off correlation of
>0.8. A total of 76 and 917 hub genes were selected in the two
groups, respectively. The overlap between DEGs and hub genes from
the two groups yielded a map of 13 shared DEGs. The 13 genes were
screened as candidate key genes; genes which may function to
maintain the radioresistant characteristics of cancer cells and
promote the radioresistant abilities of cancer cells
post-irradiation. According to the FC of the expression of the 13
key genes in the post-irradiation group relative to the
non-irradiation group, PBK and POPDC3 were the top two high
expression genes in the post-irradiation group compared with the
non-irradiation group. Therefore, PBK and POPDC3 were selected for
survival analysis. Increased expression of POPDC3 was associated
with a poorer survival rate in patients with HNSCC.
POPDC3 is a member of the popeye domain-containing
family which consists of three members (21–23). As
a second messenger molecule, cAMP participates in numerous cellular
functions, physiologically and pathophysiologically (24,25). The
POPDC family of proteins are a class of cAMP-binding proteins and
have been reported to be involved in cancer progression and
associated with prognosis in patients with cancer. Gene expression
profiling has shown POPDC1 in breast carcinoma (26,27),
colon cancer (26) and gastric
cancer (28). POPDC2 upregulation
enhances arsenic trioxide-mediated breast cancer cell apoptosis
(29), and low expression of POPDC3
is correlated with colorectal cancer drug chemoradiotherapy
(21). Hypermethylation of the
POPDC3 promoter region is associated with poor survival in patients
with gastric cancer (30,31). Luo et al (31) hypothesized that POPDC3 may serve a
role in cell adhesion, cell motility, DNA methylation and
tumorigenesis signaling pathways (31). In the present study, KEGG pathway
enrichment showed that from the DEGs in the post-irradiated group,
POPDC3 participated in the majority of the biologically active
signaling pathways, including viral carcinogenesis, activation of
MAPK activity, positive regulation of κB kinase/NF-κB signaling
pathway and others. However, the exact role of POPDC3 in HNSCC
pathogenesis, its role in radioresistance and the underlying
molecular mechanisms remain unknown.
To the best of our knowledge, the present study is
the first to study examine both the overexpression profiles of
POPDC3 in patients HNSCC and in radioresistant HNSCC compared with
their respective counterparts, by analyzing both the GEO and
Oncomine databases. POPDC3 was upregulated in radioresistant
esophageal and lung cancer, further highlighting the potential role
of POPDC3 in the development of radioresistance. Kaplan-Meier
analysis also indicated that high expression of POPDC3 was
associated with poor OS in patients with HNSCC. Collectively, the
results of the present study demonstrated that high expression of
POPDC3 is associated with radioresistance and poor prognosis in
patients with HNSCC. Therefore, POPDC3 may serve as a novel
predictive biomarker for HNSCC prognosis and radioresistance in the
diagnosis and treatment of patients with HNSCC. However, due to the
limitation of the sample size of GSE9716 dataset, a larger scale
investigation of the role of POPDC3 involved in the HNSCC
development is recommended.
Using TCGA cohort and X-tile analysis, it was
demonstrated that high expression of POPDC3 predicted a poor
clinical outcome (P<0.05). Using X-tile analysis, the optimal
cut-off value of POPDC3 were categorized as low (0.8 to 5.7),
intermediate (5.7 to 8.2) and high (8.2 to 11.0) based on OS
information.
Based on TCGA data, sufficient cases were obtained
to develop and validate nomograms to predict 3- and 5-year OS in
patients with HNSCC. To accurately select prognostic factors,
univariate log-rank and multivariate Cox analysis were used to
identify independent prognostic factors. The results showed that
POPDC3 expression levels and lymph node metastasis were independent
prognostic factors for the survival of patients with HNSCC.
Although there is still inadequate evidence to
support POPDC3 as an independent prognostic marker for HNSCC, the
nomogram model based on POPDC3 expression levels provided a perfect
prognostic value and the ROC curve for the nomogram showed a good
fit at 3- and 5-year follow-ups. The area under the curve of the
ROC curves for nomogram predictions of the 3- and 5-year survival
rates were 0.681 and 0.58, suggesting a good predictive ability for
patients with HNSCC, suggesting that the model was accurate and may
possess potential to be applied clinically. Furthermore, a number
of assays in vitro and in vivo are required to
investigate the effect of modulating POPDC3 expression levels on
HNSCC cell lines and the molecular mechanisms underlying
POPDC3-mediated regulation of radioresistance in HNSCC need further
study.
In conclusion, the aim of the present study was to
identify predictive biomarkers predictive for radioresistance in
patients with HNSCC by mining gene expression data. The
transcriptional profiling followed by bioinformatics analysis
processing of radioresistant and radiosensitive samples identified
POPDC3 in radioresistance in patients with HNSCC, and also
identified POPDC3 expression as a novel biomarker for poor response
to radiotherapy. This may highlight POPDC3 as a potential
therapeutic target for radioresistant HNSCC treatment. In addition,
nomograms were developed and validated to predict the 3- and 5-year
OS of patients with HNSCC based on a population-based cohort
database. Using only basic information and POPDC3 expression
levels, the nomograms demonstrated a high degree of predictive
accuracy. The results of the present study demonstrate that
bioinformatics analyses may be useful for identifying predictive
biomarkers and that these methods can be utilized to establish
transcriptional profiles of radioresistance in other types of
cancer.
Acknowledgements
Not applicable.
Funding
The present was supported by the National Key
Research and Development Program of China (grant no.
2017YFA0205200), the National Natural Science Foundation of China
(grant nos. 81571785 and 81771957), and the Natural Science
Foundation of Guangdong Province, China (grant nos. 2016A030311055,
2016A030313770 and 2018A030313074).
Availability of data and materials
The datasets used during the present study are
available from the corresponding author upon reasonable
request.
Authors' contributions
LL and LT conceived and designed the study and
critically revised the manuscript. XH and HX designed and analyzed
the data and was a major contributor in writing the manuscript. WZ,
MZ, YL and HL gave advice on the study and contributed to the
statistics and analysis. All authors have read and approved the
manuscript.
Ethics approval and consent to
participate
Not applicable.
Patient consent for publication
Not applicable.
Competing interests
The authors declare that they have no competing
interests.
Glossary
Abbreviations
Abbreviations:
|
HNSCC
|
head and neck squamous cell
carcinoma
|
|
GEO
|
Gene Expression Omnibus
|
|
FC
|
fold-change
|
|
DEGs
|
differentially expressed genes
|
|
DAVID
|
Database for Annotation Visualization
and Integrated Discovery
|
|
GO
|
Gene Ontology
|
|
KEGG
|
The Cancer Genome Atlas
|
|
PPI
|
protein-protein interaction
|
|
WGCNA
|
Weighted Correlation Network
Analysis
|
|
MM
|
module membership
|
|
GS
|
gene significance
|
|
POPDC3
|
popeye domain-containing protein 3
|
|
OS
|
overall survival
|
References
|
1
|
Siegel RL, Miller KD and Jemal A: Cancer
statistics, 2018. CA Cancer J Clin. 68:7–30. 2018. View Article : Google Scholar : PubMed/NCBI
|
|
2
|
Agostini LP, Stur E, Garcia FM, Ventorim
DP, Dos Reis RS, Dettogni RS, Dos Santos EVW, Peterle GT, Maia LL,
Mendes SO, et al: ATM, BCL2, and TGFβ gene polymorphisms as
radiotherapy outcome biomarkers in head and neck squamous cell
carcinoma patients. Genet Test Mol Biomarkers. 21:727–735. 2017.
View Article : Google Scholar : PubMed/NCBI
|
|
3
|
Edgar R, Domrachev M and Lash AE: Gene
expression omnibus: NCBI gene expression and hybridization array
data repository. Nucleic Acids Res. 30:207–210. 2002. View Article : Google Scholar : PubMed/NCBI
|
|
4
|
Cheng J, Lu X, Wang J, Zhang H, Duan P and
Li C: Interactome analysis of gene expression profiles of cervical
cancer reveals dysregulated mitotic gene clusters. Am J Transl Res.
9:3048–3059. 2017.PubMed/NCBI
|
|
5
|
Zhu L, Shu Z and Sun X: Bioinformatic
analysis of four miRNAs relevant to metastasis-regulated processes
in endometrial carcinoma. Cancer Manag Res. 10:2337–2346. 2018.
View Article : Google Scholar : PubMed/NCBI
|
|
6
|
Dennis G Jr, Sherman BT, Hosack DA, Yang
J, Gao W, Lane HC and Lempicki RA: DAVID: Database for annotation,
visualization, and integrated discovery. Genome Biol. 4:P32003.
View Article : Google Scholar : PubMed/NCBI
|
|
7
|
Yu G, Wang LG, Han Y and He QY:
clusterProfiler: an R package for comparing biological themes among
gene clusters. OMICS. 16:284–287. 2012. View Article : Google Scholar : PubMed/NCBI
|
|
8
|
Colaprico A, Silva TC, Olsen C, Garofano
L, Cava C, Garolini D, Sabedot TS, Malta TM, Pagnotta SM,
Castiglioni I, et al: TCGAbiolinks: An R/Bioconductor package for
integrative analysis of TCGA data. Nucleic Acids Res. 44:e712016.
View Article : Google Scholar : PubMed/NCBI
|
|
9
|
Langfelder P and Horvath S: WGCNA: An R
package for weighted correlation network analysis. BMC
Bioinformatics. 9:5592008. View Article : Google Scholar : PubMed/NCBI
|
|
10
|
Khodarev NN, Minn AJ, Efimova EV, Darga
TE, Labay E, Beckett M, Mauceri HJ, Roizman B and Weichselbaum RR:
Signal transducer and activator of transcription 1 regulates both
cytotoxic and prosurvival functions in tumor cells. Cancer Res.
67:9214–9220. 2007. View Article : Google Scholar : PubMed/NCBI
|
|
11
|
Xiong W, Zhao J, Yu H, Li X, Sun S, Li Y,
Xia Q, Zhang C, He Q, Gao X, et al: Elevated expression of AKR1C3
increases resistance of cancer cells to ionizing radiation via
modulation of oxidative stress. PLoS One. 9:e1119112014. View Article : Google Scholar : PubMed/NCBI
|
|
12
|
Gautier L, Cope L, Bolstad BM and Irizarry
RA: Affy-analysis of Affymetrix GeneChip data at the probe level.
Bioinformatics. 20:307–315. 2004. View Article : Google Scholar : PubMed/NCBI
|
|
13
|
Bolstad BM, Irizarry RA, Astrand M and
Speed TP: A comparison of normalization methods for high density
oligonucleotide array data based on variance and bias.
Bioinformatics. 19:185–193. 2003. View Article : Google Scholar : PubMed/NCBI
|
|
14
|
Ritchie ME, Phipson B, Wu D, Hu Y, Law CW,
Shi W and Smyth GK: limma powers differential expression analyses
for RNA-sequencing and microarray studies. Nucleic Acids Res.
43:e472015. View Article : Google Scholar : PubMed/NCBI
|
|
15
|
Horvath S and Dong J: Geometric
interpretation of gene coexpression network analysis. PLoS Comput
Biol. 4:e10001172008. View Article : Google Scholar : PubMed/NCBI
|
|
16
|
Albert R: Scale-free networks in cell
biology. J Cell Sci. 118:4947–4957. 2005. View Article : Google Scholar : PubMed/NCBI
|
|
17
|
Seo CH, Kim JR, Kim MS and Cho KH: Hub
genes with positive feedbacks function as master switches in
developmental gene regulatory networks. Bioinformatics.
25:1898–1904. 2009. View Article : Google Scholar : PubMed/NCBI
|
|
18
|
Schmitz S, Ang KK, Vermorken J, Haddad R,
Suarez C, Wolf GT, Hamoir M and Machiels JP: Targeted therapies for
squamous cell carcinoma of the head and neck: Current knowledge and
future directions. Cancer Treat Rev. 40:390–404. 2014. View Article : Google Scholar : PubMed/NCBI
|
|
19
|
Zibelman M and Mehra R: Overview of
current treatment options and investigational targeted therapies
for locally advanced squamous cell carcinoma of the head and neck.
Am J Clin Oncol. 39:396–406. 2016. View Article : Google Scholar : PubMed/NCBI
|
|
20
|
Corvò R: Evidence-based radiation oncology
in head and neck squamous cell carcinoma. Radiother Oncol.
85:156–170. 2007. View Article : Google Scholar : PubMed/NCBI
|
|
21
|
Brand T and Schindler R: New kids on the
block: The Popeye domain containing (POPDC) protein family acting
as a novel class of cAMP effector proteins in striated muscle. Cell
Signal. 40:156–165. 2017. View Article : Google Scholar : PubMed/NCBI
|
|
22
|
Amunjela JN and Tucker SJ: POPDC proteins
as potential novel therapeutic targets in cancer. Drug Discov
Today. 21:1920–1927. 2016. View Article : Google Scholar : PubMed/NCBI
|
|
23
|
Andrée B, Hillemann T, Kessler-Icekson G,
Schmitt-John T, Jockusch H, Arnold HH and Brand T: Isolation and
characterization of the novel popeye gene family expressed in
skeletal muscle and heart. Dev Biol. 223:371–382. 2000. View Article : Google Scholar : PubMed/NCBI
|
|
24
|
Plattner F, Hayashi K, Hernández A,
Benavides DR, Tassin TC, Tan C, Day J, Fina MW, Yuen EY, Yan Z, et
al: The role of ventral striatal cAMP signaling in stress-induced
behaviors. Nat Neurosci. 18:1094–1100. 2015. View Article : Google Scholar : PubMed/NCBI
|
|
25
|
Kumar N, Prasad P, Jash E, Jayasundar S,
Singh I, Alam N, Murmu N, Somashekhar SP, Goldman A and Sehrawat S:
cAMP regulated EPAC1 supports microvascular density, angiogenic and
metastatic properties in a model of triple negative breast cancer.
Carcinogenesis. 39:1245–1253. 2018. View Article : Google Scholar : PubMed/NCBI
|
|
26
|
Williams CS, Zhang B, Smith JJ, Jayagopal
A, Barrett CW, Pino C, Russ P, Presley SH, Peng D, Rosenblatt DO,
et al: BVES regulates EMT in human corneal and colon cancer cells
and is silenced via promoter methylation in human colorectal
carcinoma. J Clin Invest. 121:4056–4069. 2011. View Article : Google Scholar : PubMed/NCBI
|
|
27
|
Amunjela JN and Tucker SJ: POPDC1 is
suppressed in human breast cancer tissues and is negatively
regulated by EGFR in breast cancer cell lines. Cancer Lett.
406:81–92. 2017. View Article : Google Scholar : PubMed/NCBI
|
|
28
|
Kim M, Jang HR, Haam K, Kang TW, Kim JH,
Kim SY, Noh SM, Song KS, Cho JS, Jeong HY, et al: Frequent
silencing of popeye domain-containing genes, BVES and POPDC3, is
associated with promoter hypermethylation in gastric cancer.
Carcinogenesis. 31:1685–1693. 2010. View Article : Google Scholar : PubMed/NCBI
|
|
29
|
Wang X, Gao P, Long M, Lin F, Wei JX, Ren
JH, Yan L, He T, Han Y and Zhang HZ: Essential role of cell cycle
regulatory genes p21 and p27 expression in inhibition of breast
cancer cells by arsenic trioxide. Med Oncol. 28:1225–1254. 2011.
View Article : Google Scholar : PubMed/NCBI
|
|
30
|
Spitzner M, Emons G, Kramer F, Gaedcke J,
Rave-Fränk M, Scharf JG, Burfeind P, Becker H, Beissbarth T,
Ghadimi BM, et al: A gene expression signature for
chemoradiosensitivity of colorectal cancer cells. Int J Radiat
Oncol Biol Phys. 78:1184–1192. 2010. View Article : Google Scholar : PubMed/NCBI
|
|
31
|
Luo D, Lu ML, Zhao GF, Huang H, Zheng MY,
Chang J, Lv L and Luo JB: Reduced Popdc3 expression correlates with
high risk and poor survival in patients with gastric cancer. World
J Gastroenterol. 18:2423–2429. 2012. View Article : Google Scholar : PubMed/NCBI
|