Introduction
Melanoma is a malignant skin tumor derived from
melanocytes, which has a high degree of malignancy and leads to
high mortality. During the past 40 years, its incidence, as well as
the proportion of mid- to late-stage tumors and infeasibility of
surgery have increased worldwide (1).
Previous studies have demonstrated that abnormal
expression and mutations of genes and proteins, including cell
division cycle associated 8 (encoded by CDCA8), telomerase
reverse transcriptase (TERT), B-Raf proto-oncogene
(BRAF) and various tumor suppressor genes are involved in
the initiation and progression of melanoma. For example, it has
been reported that the CDCA8 gene is capable of promoting
the malignant progression of cutaneous melanoma and is associated
with poor prognosis (2). TERT
promoter mutations have also been identified in up to 50% of
cutaneous melanoma cases in the global population; however, their
incidence in Asian populations remains unclear (3). BRAF mutations, particularly
those located at codon 600, have been observed in 50% of malignant
melanoma cases worldwide (4).
Furthermore, overexpression of BRAF and hypermethylation of
Ras binding proteins have been revealed to be associated
with poor prognosis in patients with malignant melanoma (5,6).
Melanoma mortality remains high due to the absence of efficient
diagnostic techniques at the initial stages of the disease.
Therefore, understanding the mechanisms involved in the initiation,
proliferation and recurrence of this type of cancer at the
molecular level is essential for the development of more effective
diagnostic and treatment strategies.
Over the past few decades, microarray analyses as
well as bioinformatics studies have been increasingly favored for
the screening of genetic changes at the genomic level. These
identification methods may be employed for the determination of
differentially expressed genes (DEGs), as well as functions that
may be involved in melanoma initiation and progression (7). However, the reliability of independent
microarray analyses may not be high owing to the rate of false
positives. Therefore, in the present study, three different mRNA
microarray datasets were obtained from the Gene Expression Omnibus
(GEO) database. These datasets were analyzed for the determination
of DEGs between malignant melanoma and normal nevi tissues.
Thereafter, Gene Ontology (GO) and Kyoto Gene and Genomic
Encyclopedia (KEGG) analyses, as well as protein-protein
interaction (PPI) network analysis were conducted to identify
molecular processes associated with melanoma development and
progression. Altogether, 182 DEGs and 10 hub genes were indicated
as potential biomarkers of melanoma.
Materials and methods
Data from the microarray analyses
GEO (http://www.ncbi.nlm.nih.gov/geo) (8) is a publicly available function-related
genomics repository containing high-throughput gene expression
data, ChIP-seq data, as well as microarrays. Three gene datasets,
GSE3189 (9), GSE4570 (10) and GSE4587 (11), were downloaded from the GEO database.
GSE3189 and GSE4570 were based on the ArrayGPL96 platform
(Affymetrix Human Genome U133A Array), whereas GSE4587 was based on
the GPL570 platform (Affymetrix Human Genome U133 Plus 2.0). The
probes were later converted to their analogous gene symbols using
platform information. The GSE3189 dataset comprised 45 melanoma
tissue samples and 18 normal nevi tissue samples, GSE4570 contained
6 melanoma samples and 2 nevi samples, and GSE4587 contained 7
melanoma samples and 8 nevi samples.
Identification of DEGs
GEO2R (http://www.ncbi.nlm.nih.gov/geo/geo2r) was used for
the screening of DEGs between melanoma and normal nevi tissue
samples. GEO2R is a web tool used in interaction studies for the
comparison of various datasets in a GEO series to identify DEGs. As
mentioned above, the most common limitation of microarray analyses
is the presence of false positives, which may be limited by
adjusting the P-values and calculating the Benjamini-Hochberg false
discovery rate (12). These
adjustments led to the identification of statistically significant
genes. Probe sets that had either no corresponding gene symbols or
genes with numerous probe sets were eliminated or averaged,
respectively. DEGs of logarithmic fold change value >1 were
selected in the present study. P<0.05 was considered to indicate
a statistically significant difference.
KEGG and GO enrichment analysis of the
DEGs
The Database for Annotation, Visualization and
Integrated Discovery (DAVID; version 6.8; http://david.ncifcrf.gov) (13) is an online bioinformatics database
that integrates biological data with analytic tools, and offers
substantial gene- and protein-related information, thus
contributing to the extraction of biological data. KEGG database is
a online tool used to study advanced functions and biological
processes of genes via high-throughput sequencing (14). GO, a significant web-based tool used
for annotating genes and analyzing the biological processes that
these genes are involved in, was also employed for DEG enrichment
(15). The biological functions of
the DEGs were analyzed using DAVID. P<0.05 was considered to
indicate a statistically significant difference.
Construction of a PPI network and
module analysis
The Search Tool for the Retrieval of Interacting
Genes (STRING; version 10.5; http://string-db.org) database was used to analyze the
PPI network of genes (16). Analysis
of functionally relevant interactions among the proteins encoded by
DEGs may provide valuable insights into the mechanisms of genesis
or progression of various diseases. In the present study, the
STRING database was used for the construction of the DEG PPI
network. A statistically relevant interaction was defined using
STRING (combined score >0.4). Cytoscape (version 3.7.0), an open
access bioinformatics software, is a platform used to study
networks of molecular interactions (17). Furthermore, Molecular Complex
Detection (MCODE; version 1.5.1), a Cytoscape plugin, clusters a
given network based on topology for the determination of compact
connected portions (18). Cytoscape
was used for the identification of the PPI network, while MCODE was
used to identify the most significant interaction. The MCODE
selection criteria were as follows: i) MCODE score >5; ii) MCODE
degree cut-off level=2; iii) node score cut-off level=0.2; iv) max
depth=100 and v) k-score=2.
Hub genes selection and analysis
After the construction of the PPI network, genes
(MCODE degrees ≥10 using Cytoscape) were identified as hub genes.
The gene network and genes that were co-expressed within this
network were determined using cBioPortal (http://www.cbioportal.org) (19,20).
Investigation of the biological processes associated with the hub
genes was conducted using the Biological Networks Gene Oncology
(version 3.0.3) Cytoscape plugin (21). The overall survival and disease-free
survival analyses of the hub genes were conducted using the
Kaplan-Meier function in cBioPortal. The gene expression levels of
the hub genes between melanoma and normal nevi tissues were
evaluated using Oncomine, an online database (http://www.oncomine.com) (22,23).
Differences in expression between melanoma and normal nevi tissues
were analyzed by t-test. P<0.05 was considered to indicate a
statistically significant difference.
Results
DEG identification in melanoma
With logarithmic fold change value >1 and
P<0.05, the DEGs (2,484 in GSE3189, 1,300 in GSE4570 and 6,759
in GSE4587) were identified. The intersection of the 3 datasets
comprised of 182 genes, 52 of which were downregulated and 130 were
upregulated between melanoma and normal nevi tissues, as
demonstrated in the Venn diagram (Fig.
1A).
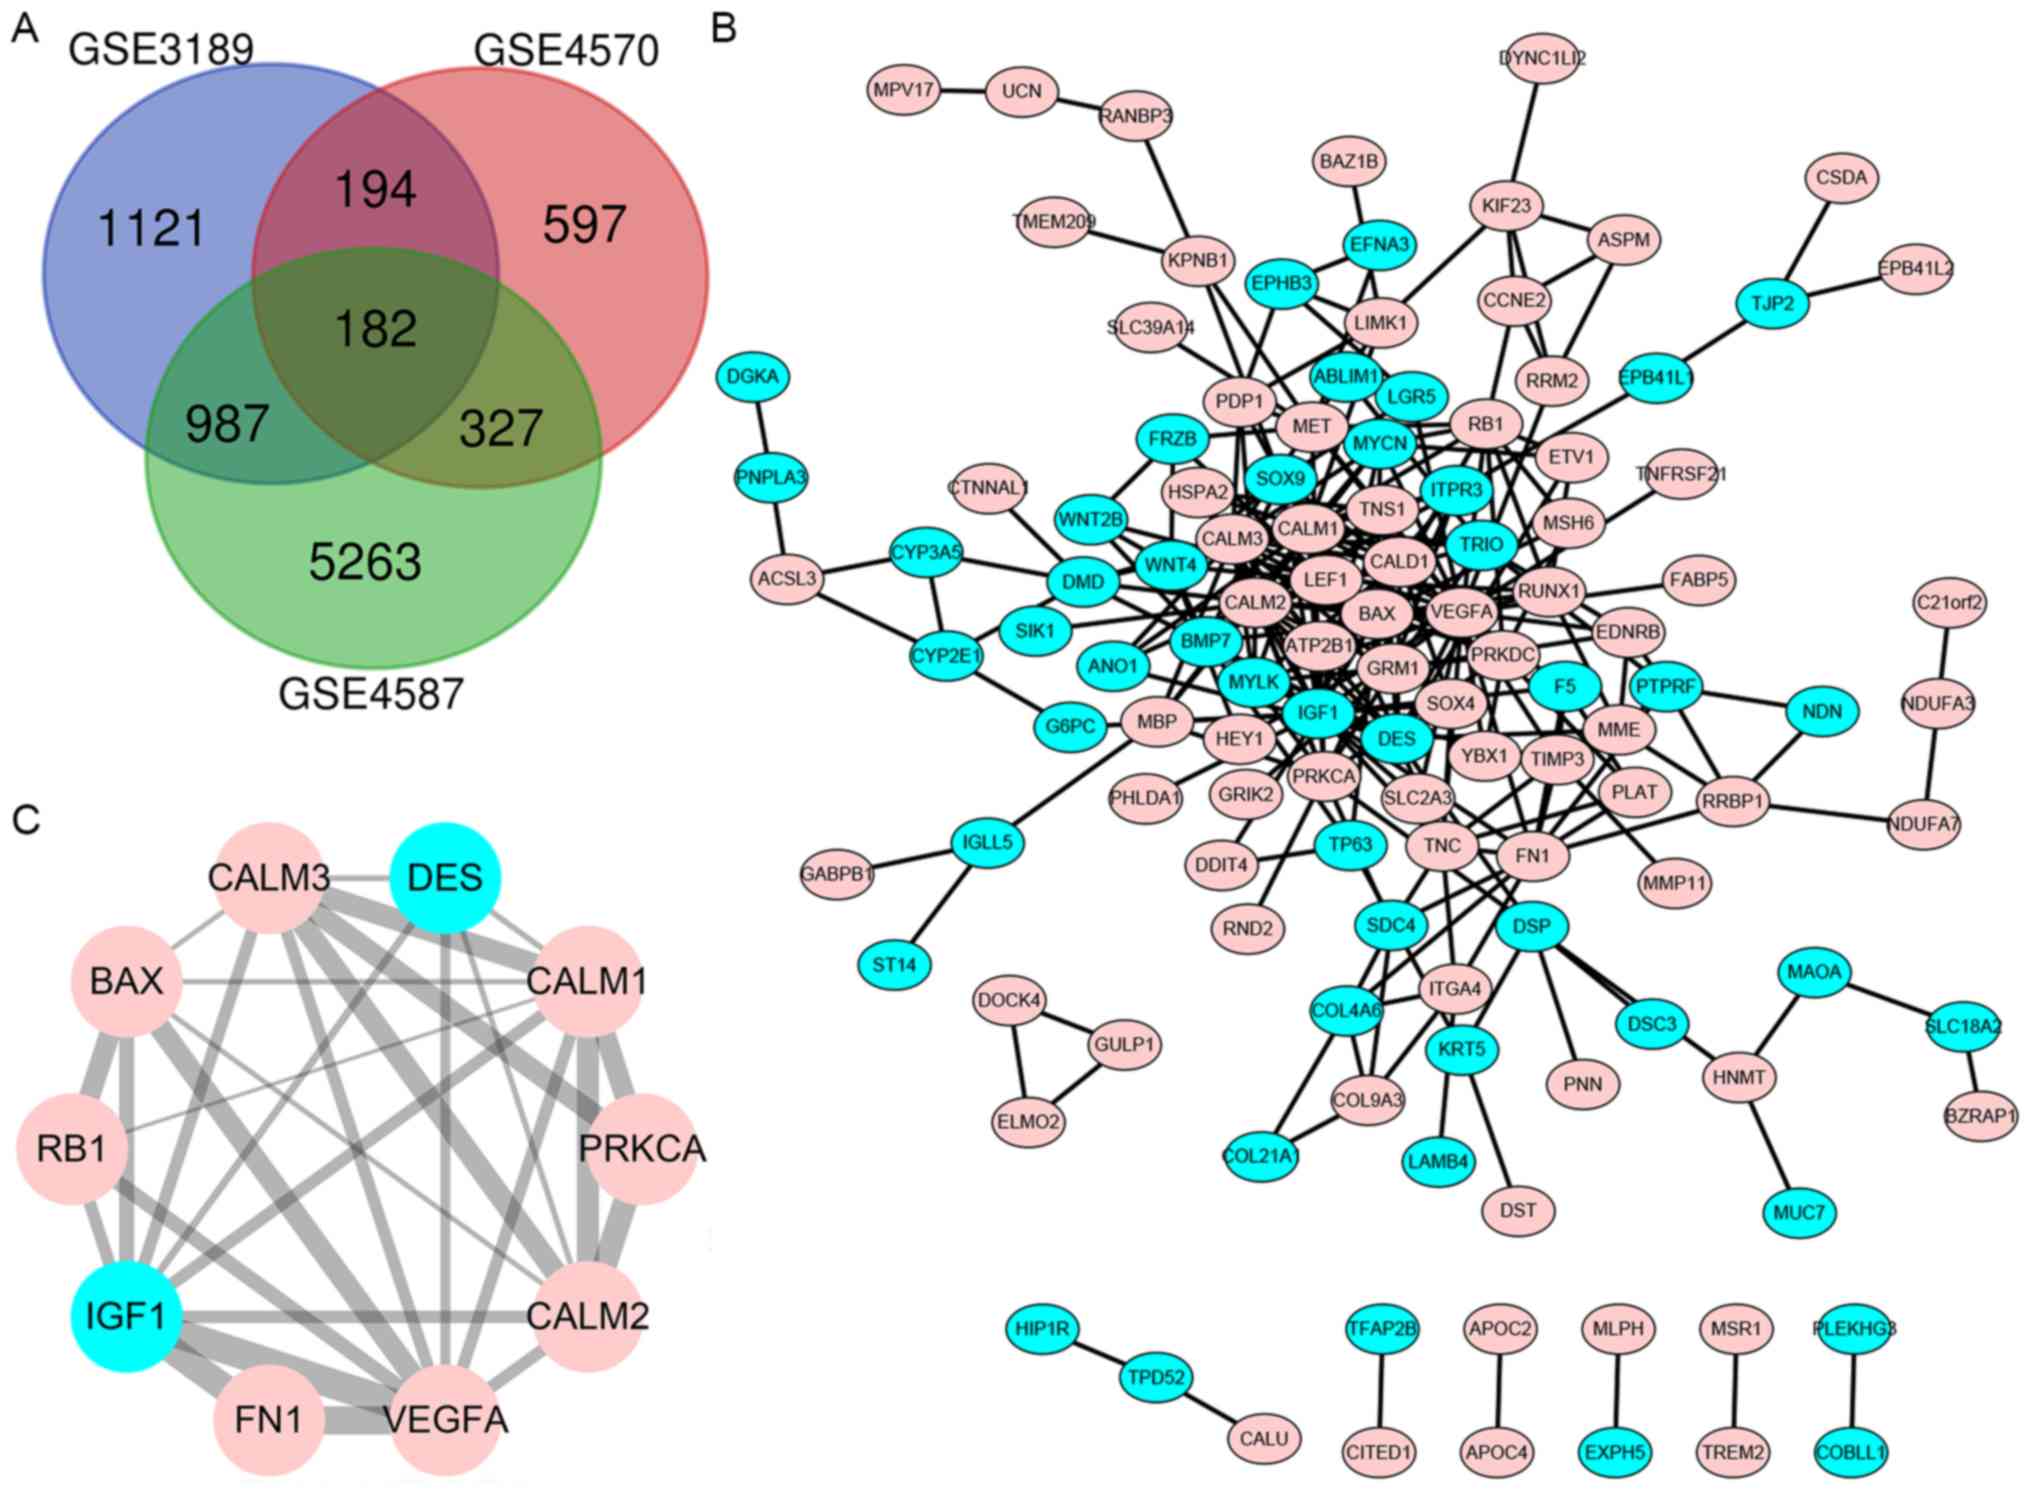 | Figure 1.Venn diagram of the three gene
microarray datasets, PPI network obtained using bioinformatics
algorithms and statistically significant DEG module. (A) DEGs with
a fold change >2 and P<0.05 were selected among the gene
expression profiling GSE4587, GSE3189 and GSE4570 datasets. A
common set of 182 genes was identified at the intersection of the 3
datasets. (B) Cytoscape was used for the construction of the PPI
network of the DEGs. (C) Module of maximum relevance, consisting of
10 nodes and 29 edges, extracted from PPI network. Genes with
upregulated expression are shown in pink, whereas genes with
downregulated expression are shown in blue. PPI, protein-protein
interaction; DEG, differentially expressed gene; DES, desmin;
VEGFA, vascular endothelial growth factor A, CALM1, calmodulin 1;
CALM2, calmodulin 2; CALM3, calmodulin 3; FN1, fibronectin 1;
PRKCA, protein kinase C α; IGF1, insulin-like growth factor 1; RB1,
retinoblastoma transcriptional corepressor 1. |
Enrichment analyses of the DEGs using
KEGG and GO
Biological classification of the DEGs, achieved via
functional and pathway enrichment analyses, was performed using
DAVID. The results of the GO analysis revealed that the DEGs in
biological processes were enriched in transcription from RNA
polymerase II promoter, cell adhesion, GTPase activity, apoptotic
processes and transcription. At the molecular level, changes in
functions were mainly enriched in actin and protein kinase binding.
Regarding the ‘cellular component’, DEGs were mainly enriched in
the cell membrane, cytoskeleton and extracellular region (Table I). KEGG pathway analysis demonstrated
that the downregulated DEGs were mostly enhanced in the estrogen
signaling cascade, melanogenesis and the calcium signaling pathway,
whereas the upregulated DEGs were mostly enriched in microRNAs in
focal adhesion and pathways in cancer, as well as the PI3k-Akt
signaling pathway.
 | Table I.Enrichment study of DEGs between
malignant melanoma tissue and normal nevus tissue. |
Table I.
Enrichment study of DEGs between
malignant melanoma tissue and normal nevus tissue.
| A. Downregulated
DEGs |
|---|
|
|---|
| Term and
description | Count in gene
set | P-value |
|---|
| GO:0030801~Positive
regulation of cyclic nucleotide metabolic process | 3 |
3.39×10⁻⁵ |
| GO:0005980~Glycogen
catabolic process | 4 |
4.72×10⁻⁵ |
| GO:0051343~Positive
regulation of cyclic-nucleotide phosphodiesterase activity | 3 |
1.12×10⁻⁴ |
| GO:0001975~Response
to amphetamine | 4 |
1.56×10⁻⁴ |
|
GO:1901841~Regulation of high
voltage-gated calcium channel activity | 3 |
2.35×10⁻⁴ |
|
GO:1901844~Regulation of cell
communication by electrical coupling involved in cardiac
conduction | 3 |
3.13×10⁻⁴ |
|
GO:0007190~Activation of adenylate cyclase
activity | 4 |
3.35×10⁻⁴ |
| GO:0060316~Positive
regulation of ryanodine-sensitive calcium-release channel
activity | 3 |
4.01×10⁻⁴ |
| GO:0006936~Muscle
contraction | 5 |
4.75×10⁻⁴ |
| GO:0043647~Inositol
phosphate metabolic process | 4 |
5.41×10⁻⁴ |
|
GO:0021762~Substantia nigra
development | 4 |
6.12×10⁻⁴ |
| GO:0019233~Sensory
perception of pain | 4 |
7.28×10⁻⁴ |
| GO:0060315~Negative
regulation of ryanodine-sensitive calcium-release channel
activity | 3 |
7.31×10⁻⁴ |
| GO:0032516~Positive
regulation of phosphoprotein phosphatase activity | 3 |
8.62×10⁻⁴ |
|
GO:0005513~Detection of
Ca2+ | 3 |
1.00×10⁻³ |
| GO:0010801~Negative
regulation of peptidyl-threonine phosphorylation | 3 |
1.00×10⁻³ |
| GO:0051412~Response
to corticosterone | 3 |
1.67×10⁻³ |
|
GO:0010880~Regulation of release of
sequestered Ca2+ into cytosol by sarcoplasmic
reticulum | 3 |
1.67×10⁻³ |
|
GO:0010881~Regulation of cardiac muscle
contraction by regulation of the release of sequestered
Ca2+ | 3 |
1.87×10⁻³ |
|
GO:0060314~Regulation of
ryanodine-sensitive calcium-release channel activity | 3 |
1.87×10⁻³ |
|
GO:0055117~Regulation of cardiac muscle
contraction | 3 |
2.28×10⁻³ |
| GO:0035307~Positive
regulation of protein dephosphorylation | 3 |
2.28×10⁻³ |
| GO:0031954~Positive
regulation of protein autophosphorylation | 3 |
2.28×10⁻³ |
| GO:0051000~Positive
regulation of nitric-oxide synthase activity | 3 |
2.50×10⁻³ |
|
GO:0032465~Regulation of cytokinesis | 3 |
2.50×10⁻³ |
| GO:0043547~Positive
regulation of GTPase activity | 8 |
3.00×10⁻³ |
| GO:0001822~Kidney
development | 4 |
3.11×10⁻³ |
| GO:0043065~Positive
regulation of apoptotic process | 6 |
3.45×10⁻³ |
|
GO:0050999~Regulation of nitric-oxide
synthase activity | 3 |
3.49×10⁻³ |
| GO:0010800~Positive
regulation of peptidyl-threonine phosphorylation | 3 |
3.76×10⁻³ |
| GO:0043388~Positive
regulation of DNA binding | 3 |
4.04×10⁻³ |
|
GO:0022400~Regulation of
rhodopsin-mediated signaling pathway | 3 |
4.33×10⁻³ |
|
GO:0002027~Regulation of heart rate | 3 |
5.59×10⁻³ |
| GO:0071902~Positive
regulation of protein serine/threonine kinase activity | 3 |
6.27×10⁻³ |
| GO:0007223~Wnt
signaling pathway, calcium-modulating pathway | 3 |
7.74×10⁻³ |
| GO:0045893~Positive
regulation of transcription, DNA-templated | 7 |
7.81×10⁻³ |
| GO:0034704~Calcium
channel complex | 3 |
2.75×10⁻³ |
|
GO:0030017~Sarcomere | 3 |
6.61×10⁻³ |
| GO:0005876~Spindle
microtubule | 3 |
8.36×10⁻³ |
|
GO:0043274~Phospholipase binding | 4 |
2.72×10⁻⁵ |
|
GO:0031997~N-terminal myristoylation
domain binding | 3 |
3.24×10⁻⁵ |
| GO:0072542~Protein
phosphatase activator activity | 3 |
1.61×10⁻⁴ |
|
GO:0030235~Nitric-oxide synthase regulator
activity | 3 |
2.99×10⁻⁴ |
|
GO:0008440~Inositol-1,4,5-trisphosphate
3-kinase activity | 3 |
4.78×10⁻⁴ |
|
GO:0031996~Thioesterase binding | 3 |
9.59×10⁻⁴ |
| GO:0031432~Titin
binding | 3 |
9.59×10⁻⁴ |
| GO:0043539~Protein
serine/threonine kinase activator activity | 3 |
1.60×10⁻³ |
|
GO:0015276~Ligand-gated ion channel
activity | 3 |
6.33×10⁻³ |
| GO:0001105~RNA
polymerase II transcription coactivator activity | 3 |
6.68×10⁻³ |
| GO:0019901~Protein
kinase binding | 6 |
8.04×10⁻³ |
|
hsa05010:Alzheimer's disease | 6 |
9.66×10⁻⁴ |
| hsa04915:Estrogen
signaling pathway | 5 |
1.07×10⁻³ |
| hsa04922:Glucagon
signaling pathway | 5 |
1.07×10⁻³ |
|
hsa04916:Melanogenesis | 5 |
1.11×10⁻³ |
| hsa04020:Calcium
signaling pathway | 6 |
1.28×10⁻³ |
|
hsa04728:Dopaminergic synapse | 5 |
2.75×10⁻³ |
|
hsa05214:Glioma | 4 |
3.29×10⁻³ |
|
hsa05031:Amphetamine addiction | 4 |
3.43×10⁻³ |
| hsa04720:Long-term
potentiation | 4 |
3.43×10⁻³ |
|
hsa04744:Phototransduction | 3 |
6.84×10⁻³ |
|
| B, Upregulated
DEGs |
|
| Term and
description | Count in gene
set | P-value |
|
| GO:0007155~Cell
adhesion | 13 | 1.02
×10−4 |
|
GO:0007010~Cytoskeleton organization | 7 |
1.01×10⁻³ |
| GO:0001501~Skeletal
system development | 6 |
2.92×10⁻³ |
| GO:0045944~Positive
regulation of transcription from RNA polymerase II promoter | 16 |
3.94×10⁻³ |
| GO:0008584~Male
gonad development | 5 |
4.48×10⁻³ |
| GO:0002576~Platelet
degranulation | 5 |
6.18×10⁻³ |
|
GO:0042475~Odontogenesis of
dentin-containing teeth | 4 |
6.96×10⁻³ |
| GO:0090190~Positive
regulation of branching involved in ureteric bud morphogenesis | 3 |
7.87×10⁻³ |
| GO:0050679~Positive
regulation of epithelial cell proliferation | 4 |
8.85×10⁻³ |
|
GO:0016020~Membrane | 29 |
8.21×10⁻⁴ |
| GO:0005886~Plasma
membrane | 45 |
8.97×10⁻⁴ |
|
GO:0005856~Cytoskeleton | 10 |
1.05×10⁻³ |
|
GO:0031012~Extracellular matrix | 8 |
4.34×10⁻³ |
| GO:0005925~Focal
adhesion | 9 |
5.57×10⁻³ |
| GO:0031093~Platelet
α granule lumen | 4 |
6.37×10⁻³ |
|
GO:0005576~Extracellular region | 21 |
6.61×10⁻³ |
|
GO:0005913~Cell-cell adhesion
junction | 8 |
6.92×10⁻³ |
|
GO:0043034~Costamere | 3 |
7.39×10⁻³ |
| GO:0005887~Integral
component of plasma membrane | 19 |
7.89×10⁻³ |
| GO:0003779~Actin
binding | 11 |
2.55×10⁻⁵ |
|
GO:0005200~Structural constituent of
cytoskeleton | 5 |
7.42×10⁻³ |
| GO:0050839~Cell
adhesion molecule binding | 4 |
9.33×10⁻³ |
| hsa04510:Focal
adhesion | 9 |
9.83×10⁻⁴ |
|
hsa04512:ECM-receptor interaction | 6 |
1.72×10⁻³ |
| hsa04151:PI3K-Akt
signaling pathway | 11 |
2.13×10⁻³ |
|
hsa05205:Proteoglycans in cancer | 8 |
3.71×10⁻³ |
| hsa05200:Pathways
in cancer | 11 |
5.44×10⁻³ |
| hsa05206:MicroRNAs
in cancer | 9 |
7.47×10⁻³ |
Construction of the PPI network and
module analysis
The DEG PPI network was constructed to find novel
protein interactions. A total of 122 nodes and 266 protein
interaction pairs were identified (Fig.
1B). The most significant interaction of 10 nodes and 29
protein interaction pairs was identified using Cytoscape (Fig. 1C).
Selection and analysis of hub
genes
Ten genes (MCODE degrees ≥10 using Cytoscape) were
revealed as hub genes. The names, acronyms and roles of these hub
genes are presented in Table II.
The cBioPortal online platform was used to analyze the hub gene
network, as well as their co-expression genes (Fig. 2). The cBioPortal network contains 60
nodes, including 10 hub genes and the 50 most frequently altered
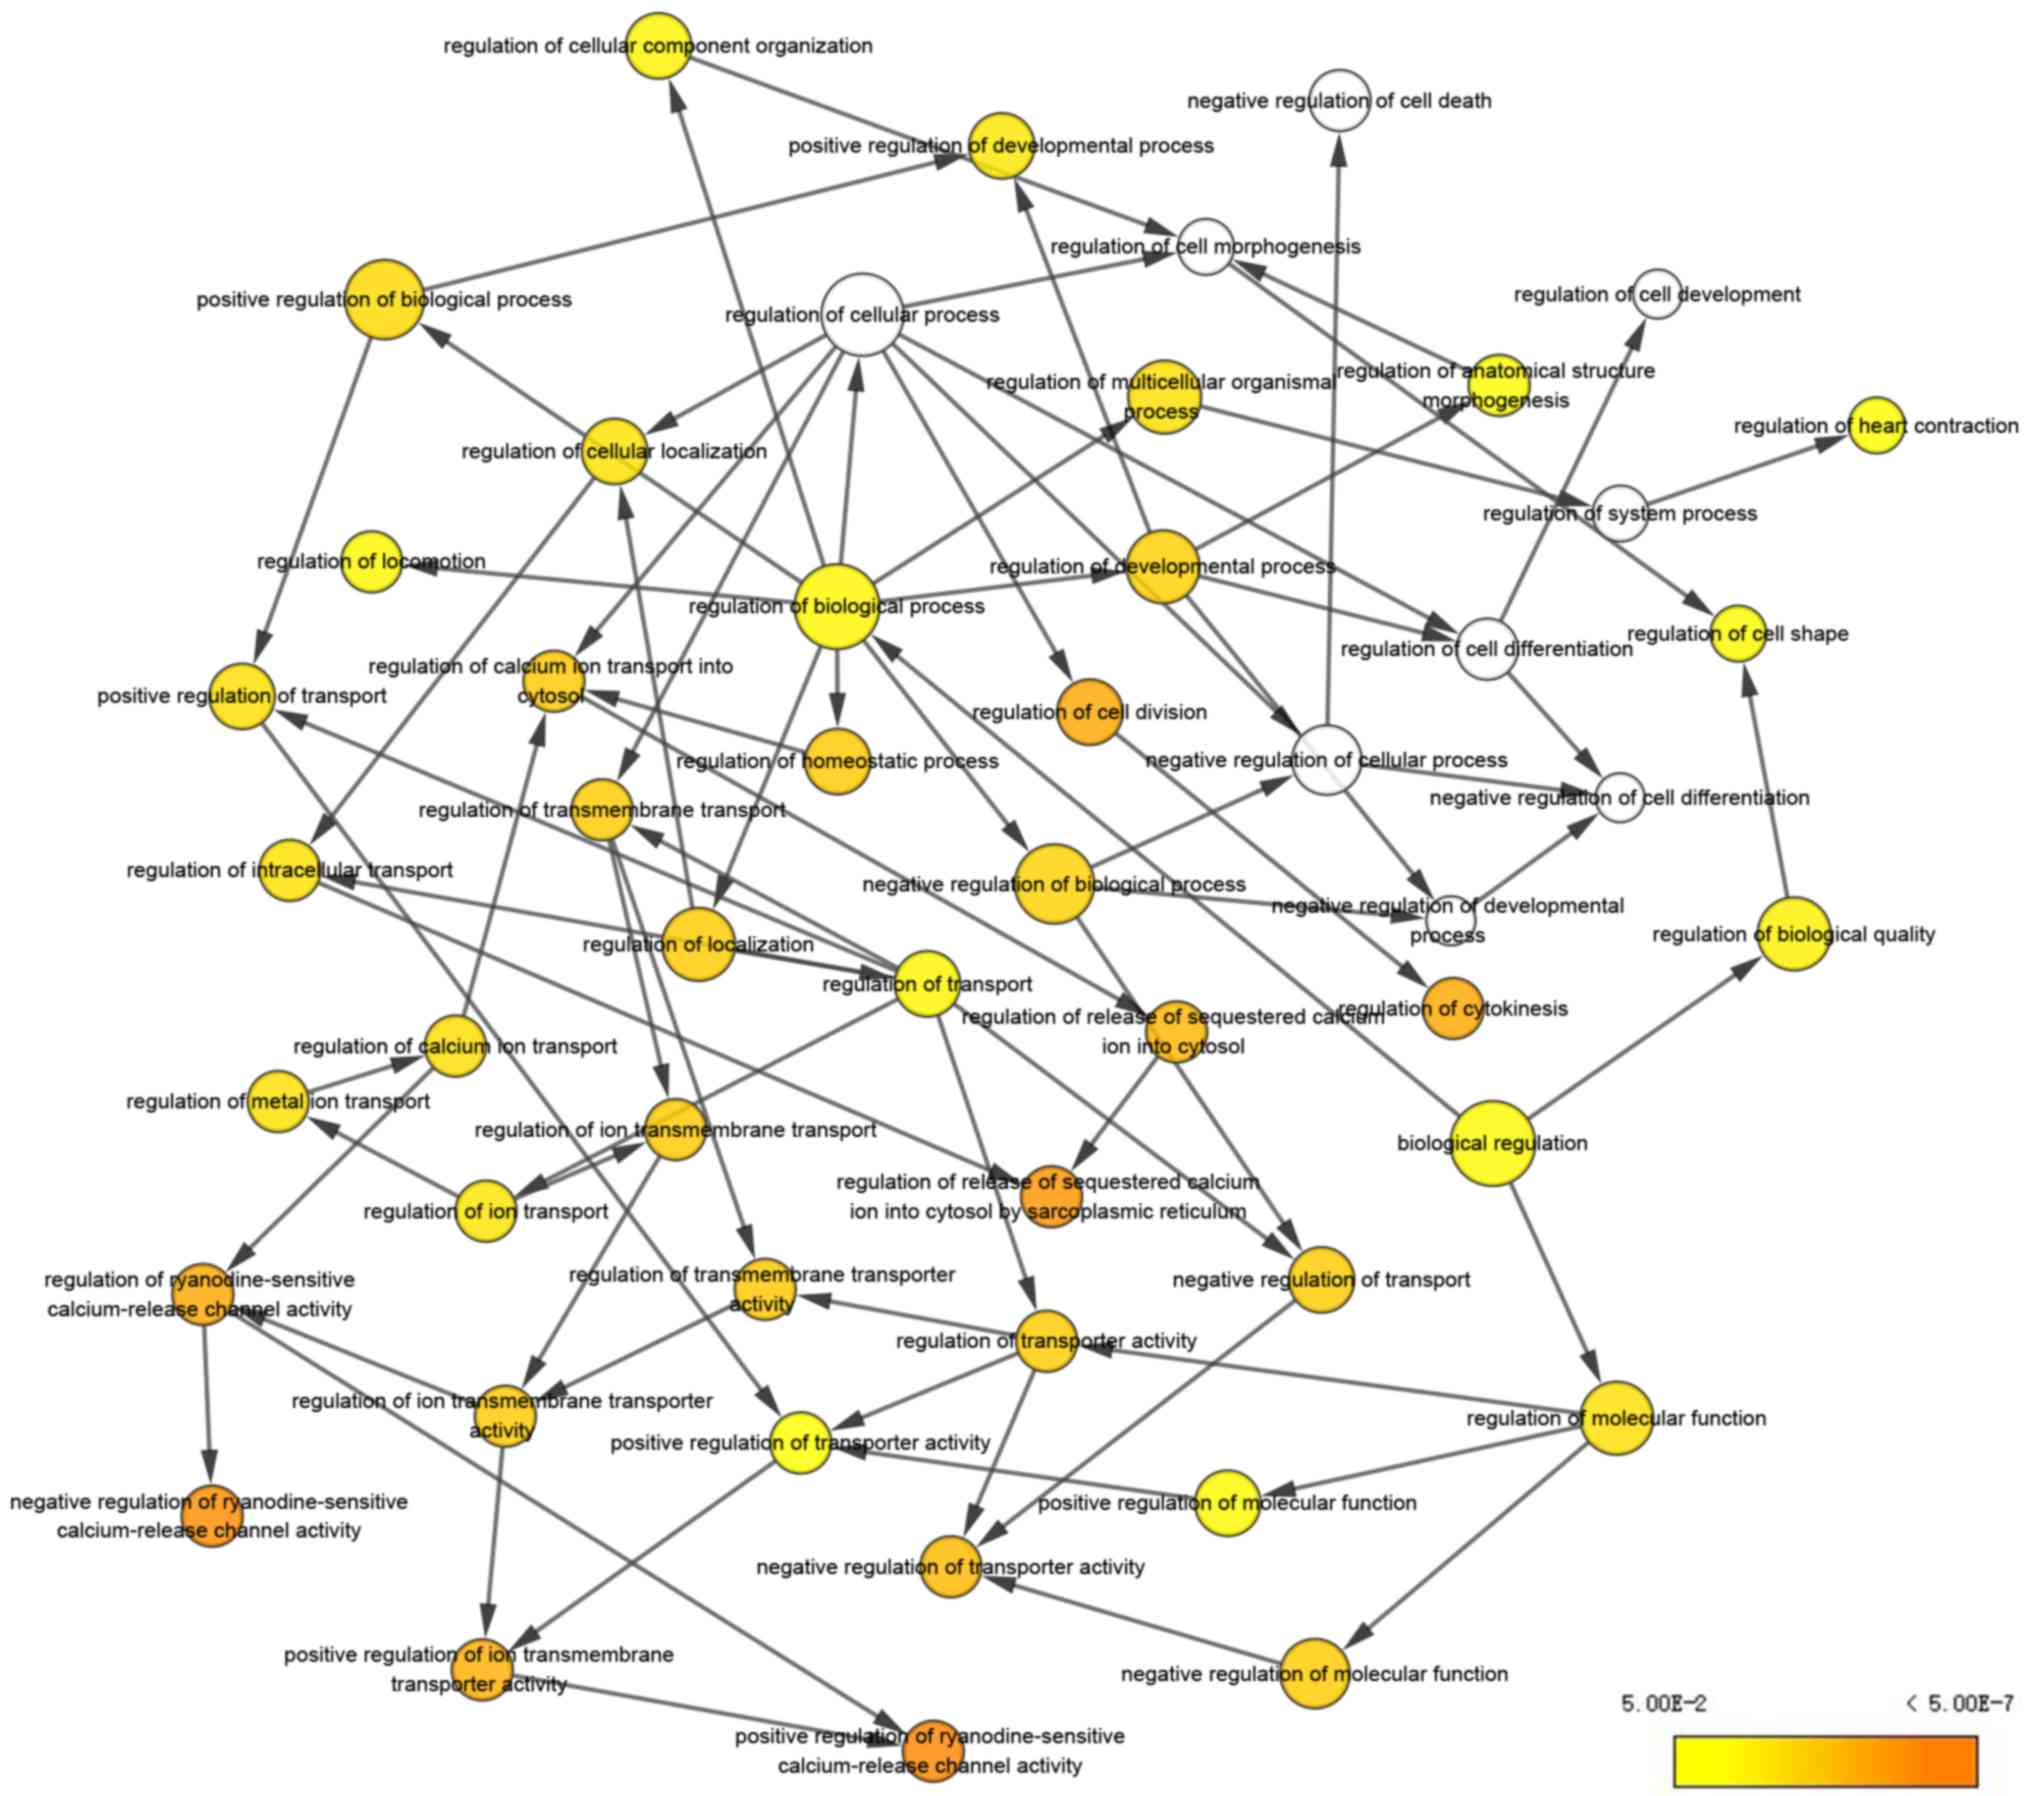
neighbor genes. The results of the hub gene biological process
analysis are demonstrated in Fig. 3.
The biological processes ‘cell division’, ‘cytokinesis, release of
sequestered ion into cytosol’, ‘release of sequestered calcium ion
into cytosol by sarcoplasmic reticulum’, ‘ryanodine-sensitive
calcium-release channel activity’ and ‘ion transmembrane
transporter activity’ were significantly enriched. Subsequently,
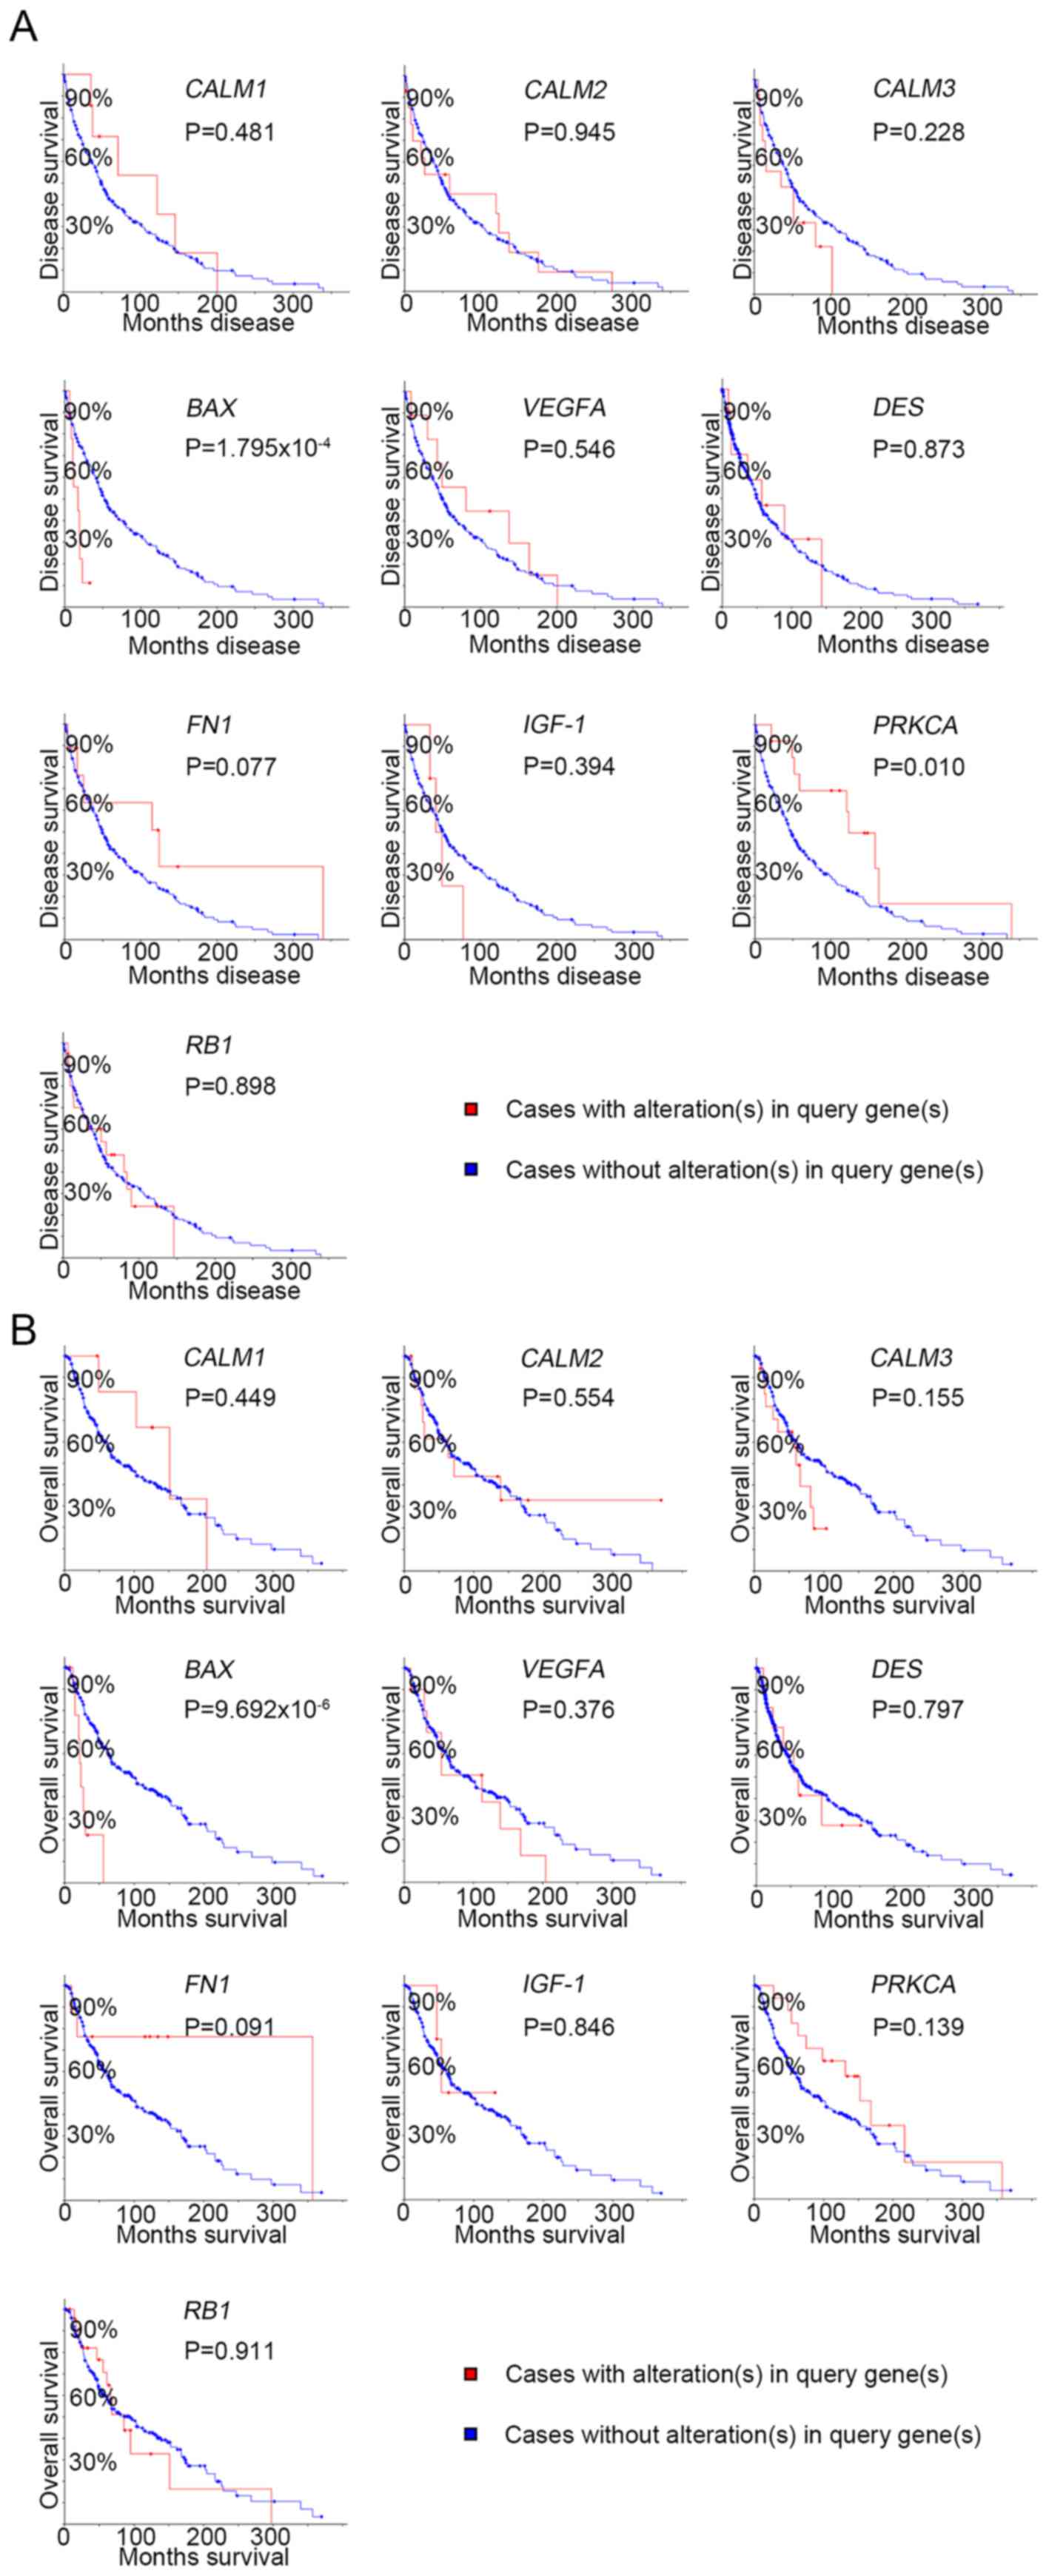
survival analysis of the hub genes was performed using Kaplan-Meier
analysis, as presented in Fig. 4.
Melanoma patients with BAX alterations were identified to
have poor disease-free as well as overall survival (Fig. 4), indicating that BAX may
serve a significant role in the initiation or progression of
melanoma. Oncomine analysis of melanoma and normal nevi tissues
revealed that BAX was significantly overexpressed in
melanoma tissues in the different datasets (Fig. 5). In the Oncomine database, the mRNA
expression levels of BAX (P<0.0001), CALM1 [which
encodes calmodulin (CaM1)] (P<0.0001), CALM3 (CaM3;
P<0.0001), FN1 (fibronectin 1; P<0.0001), PRKCA
(protein kinase C α; P=0.0320), RB1 (RB transcriptional
corepressor 1; (P<0.0001) and VEGFA (vascular endothelial
growth factor A; P<0.0001) genes were demonstrated to be higher
in melanoma tissues than in the normal nevi tissues. By contrast,
the mRNA expression level of IGF1 (insulin-like growth
factor 1) was found to be lower in melanoma tissues. There was no
statistically difference in the expression of DES (P=0.0628)
and CALM2 (P=0.0552) between melanoma and normal nevi
tissues.
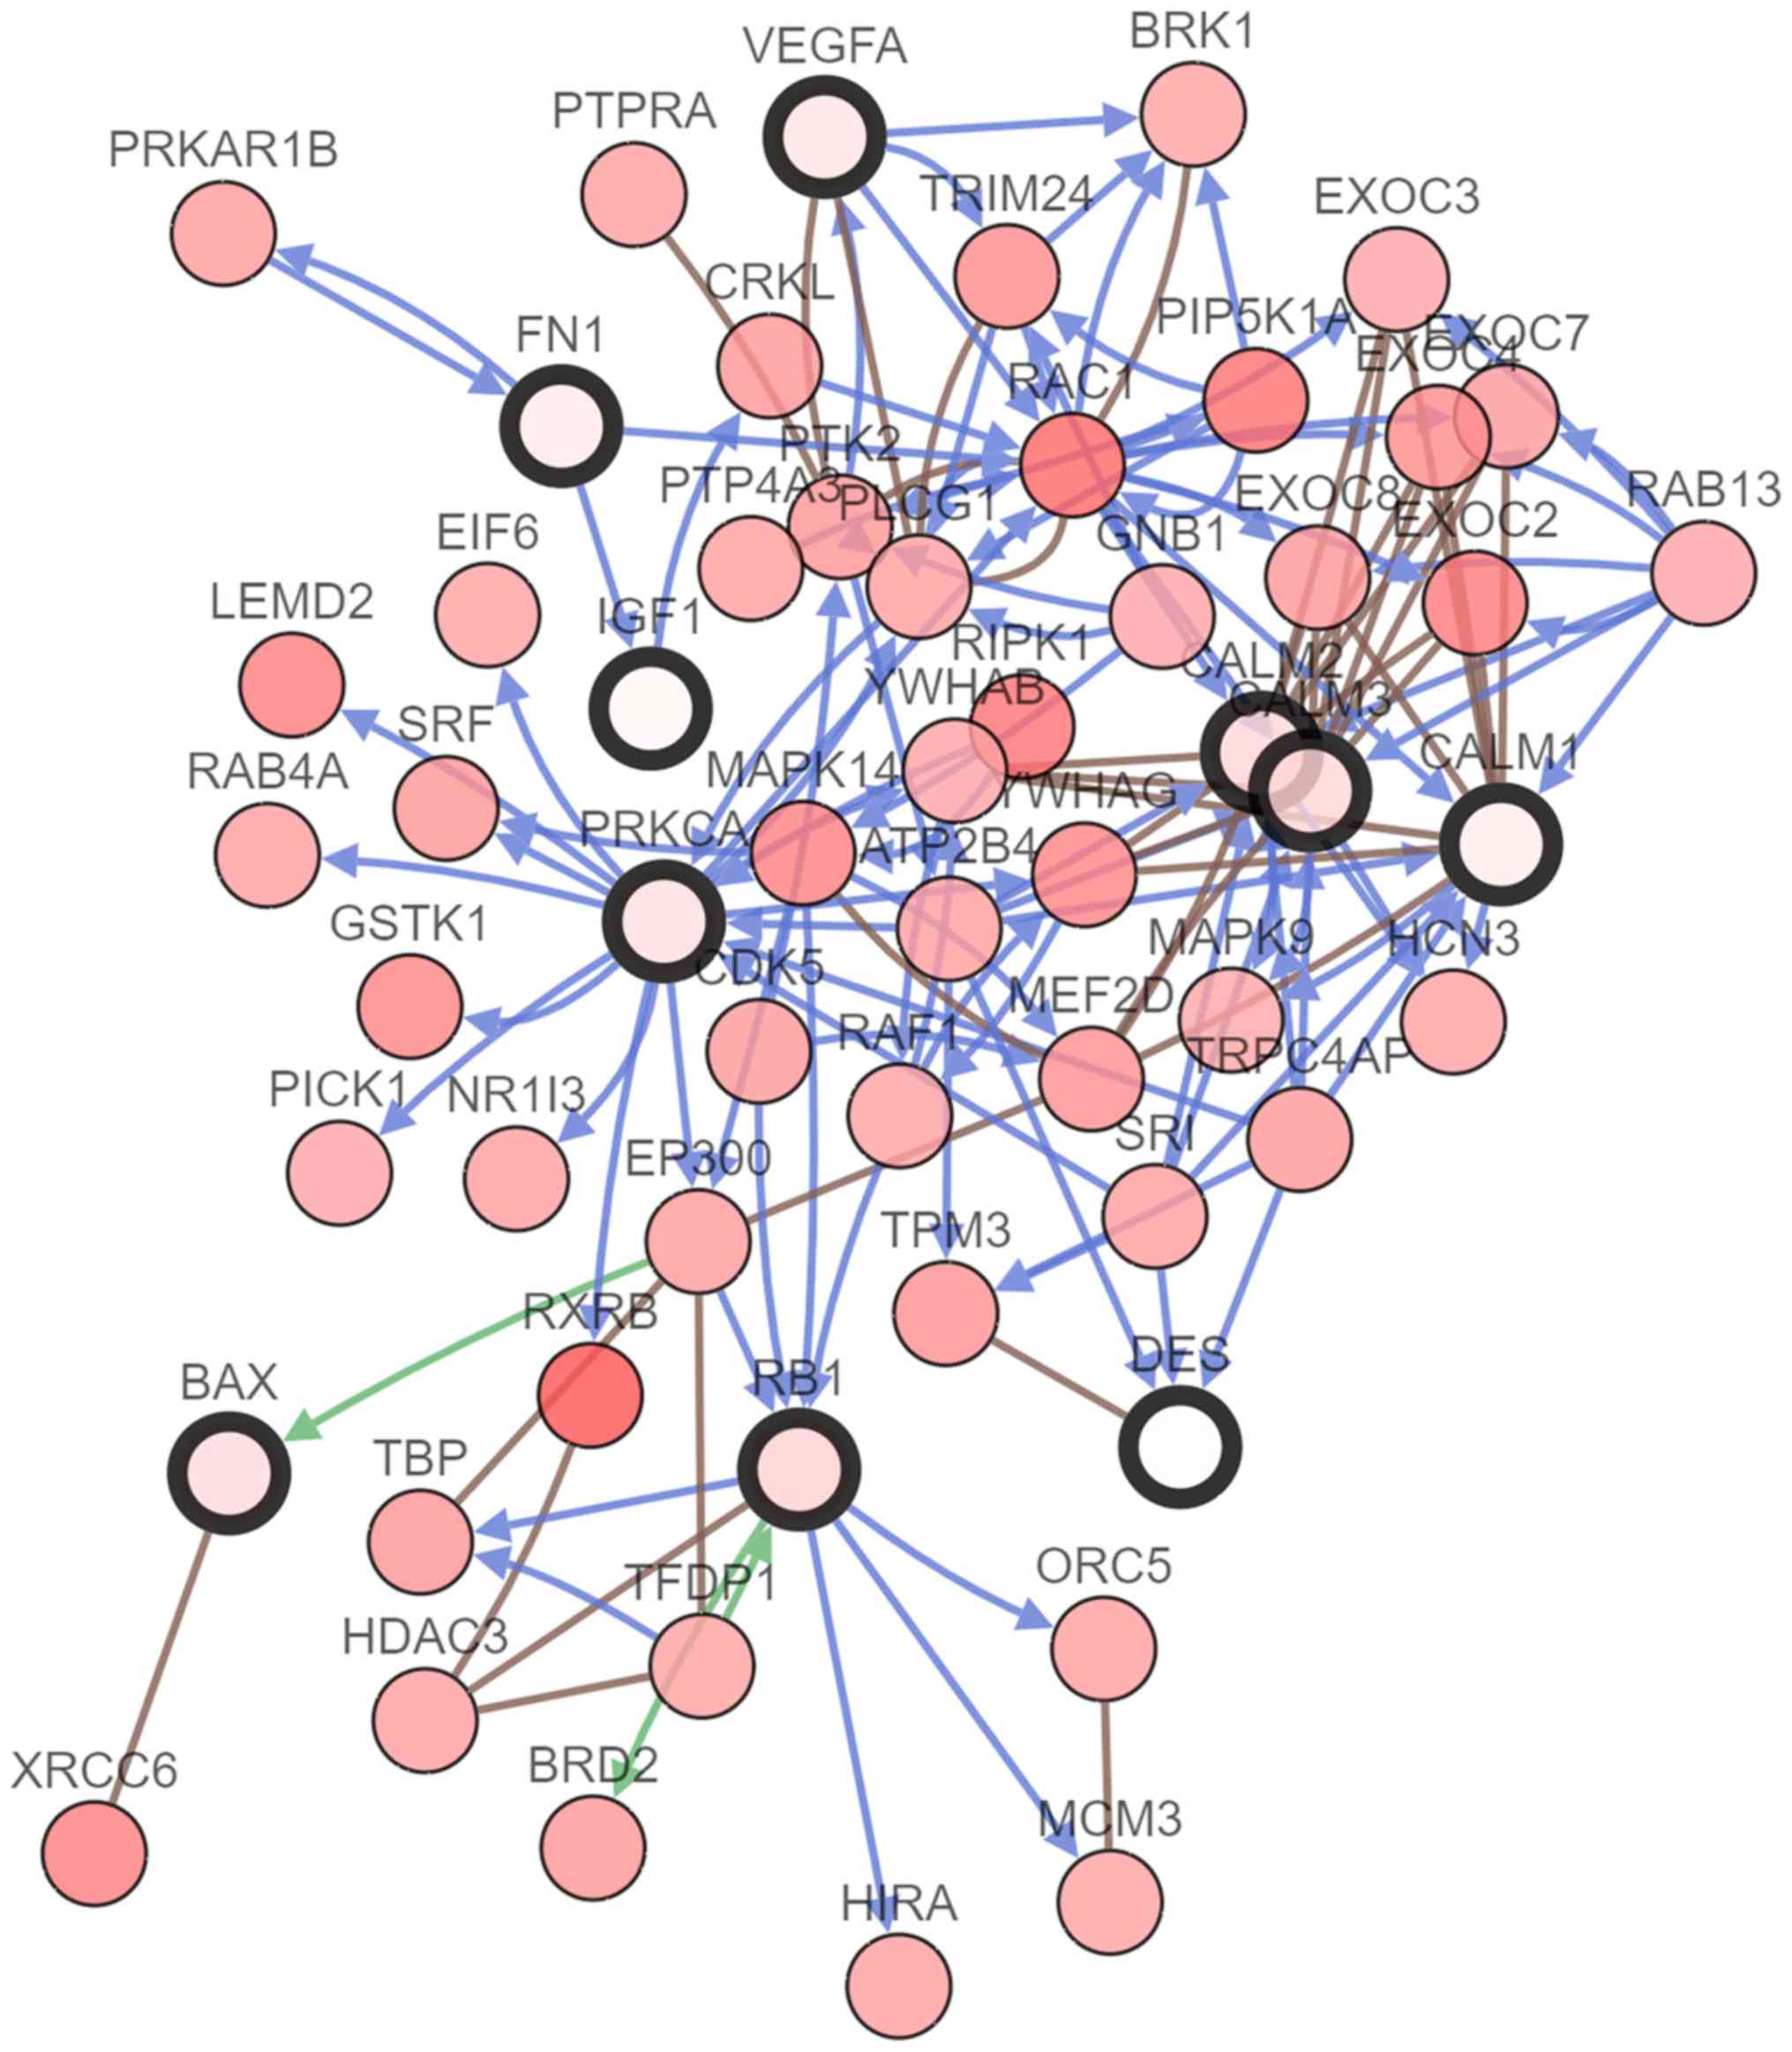 | Figure 2.Hub gene interaction network.
cBioPortal was used to examine the hub genes and their
co-expression genes. Blue arrows represent controlling state change
of genes, green arrows represent controlling expression of genes
and brown lines represent complex with other genes. Nodes with a
bold black outline represent the hub genes, while nodes with a thin
black outline represent co-expression genes. DES, desmin;
VEGFA, vascular endothelial growth factor A; CALM1,
calmodulin 1; CALM2, calmodulin 2; CALM3, calmodulin
3; FN1, fibronectin 1; PRKCA, protein kinase C α;
IGF1, insulin-like growth factor 1; RB1,
retinoblastoma transcriptional corepressor 1. |
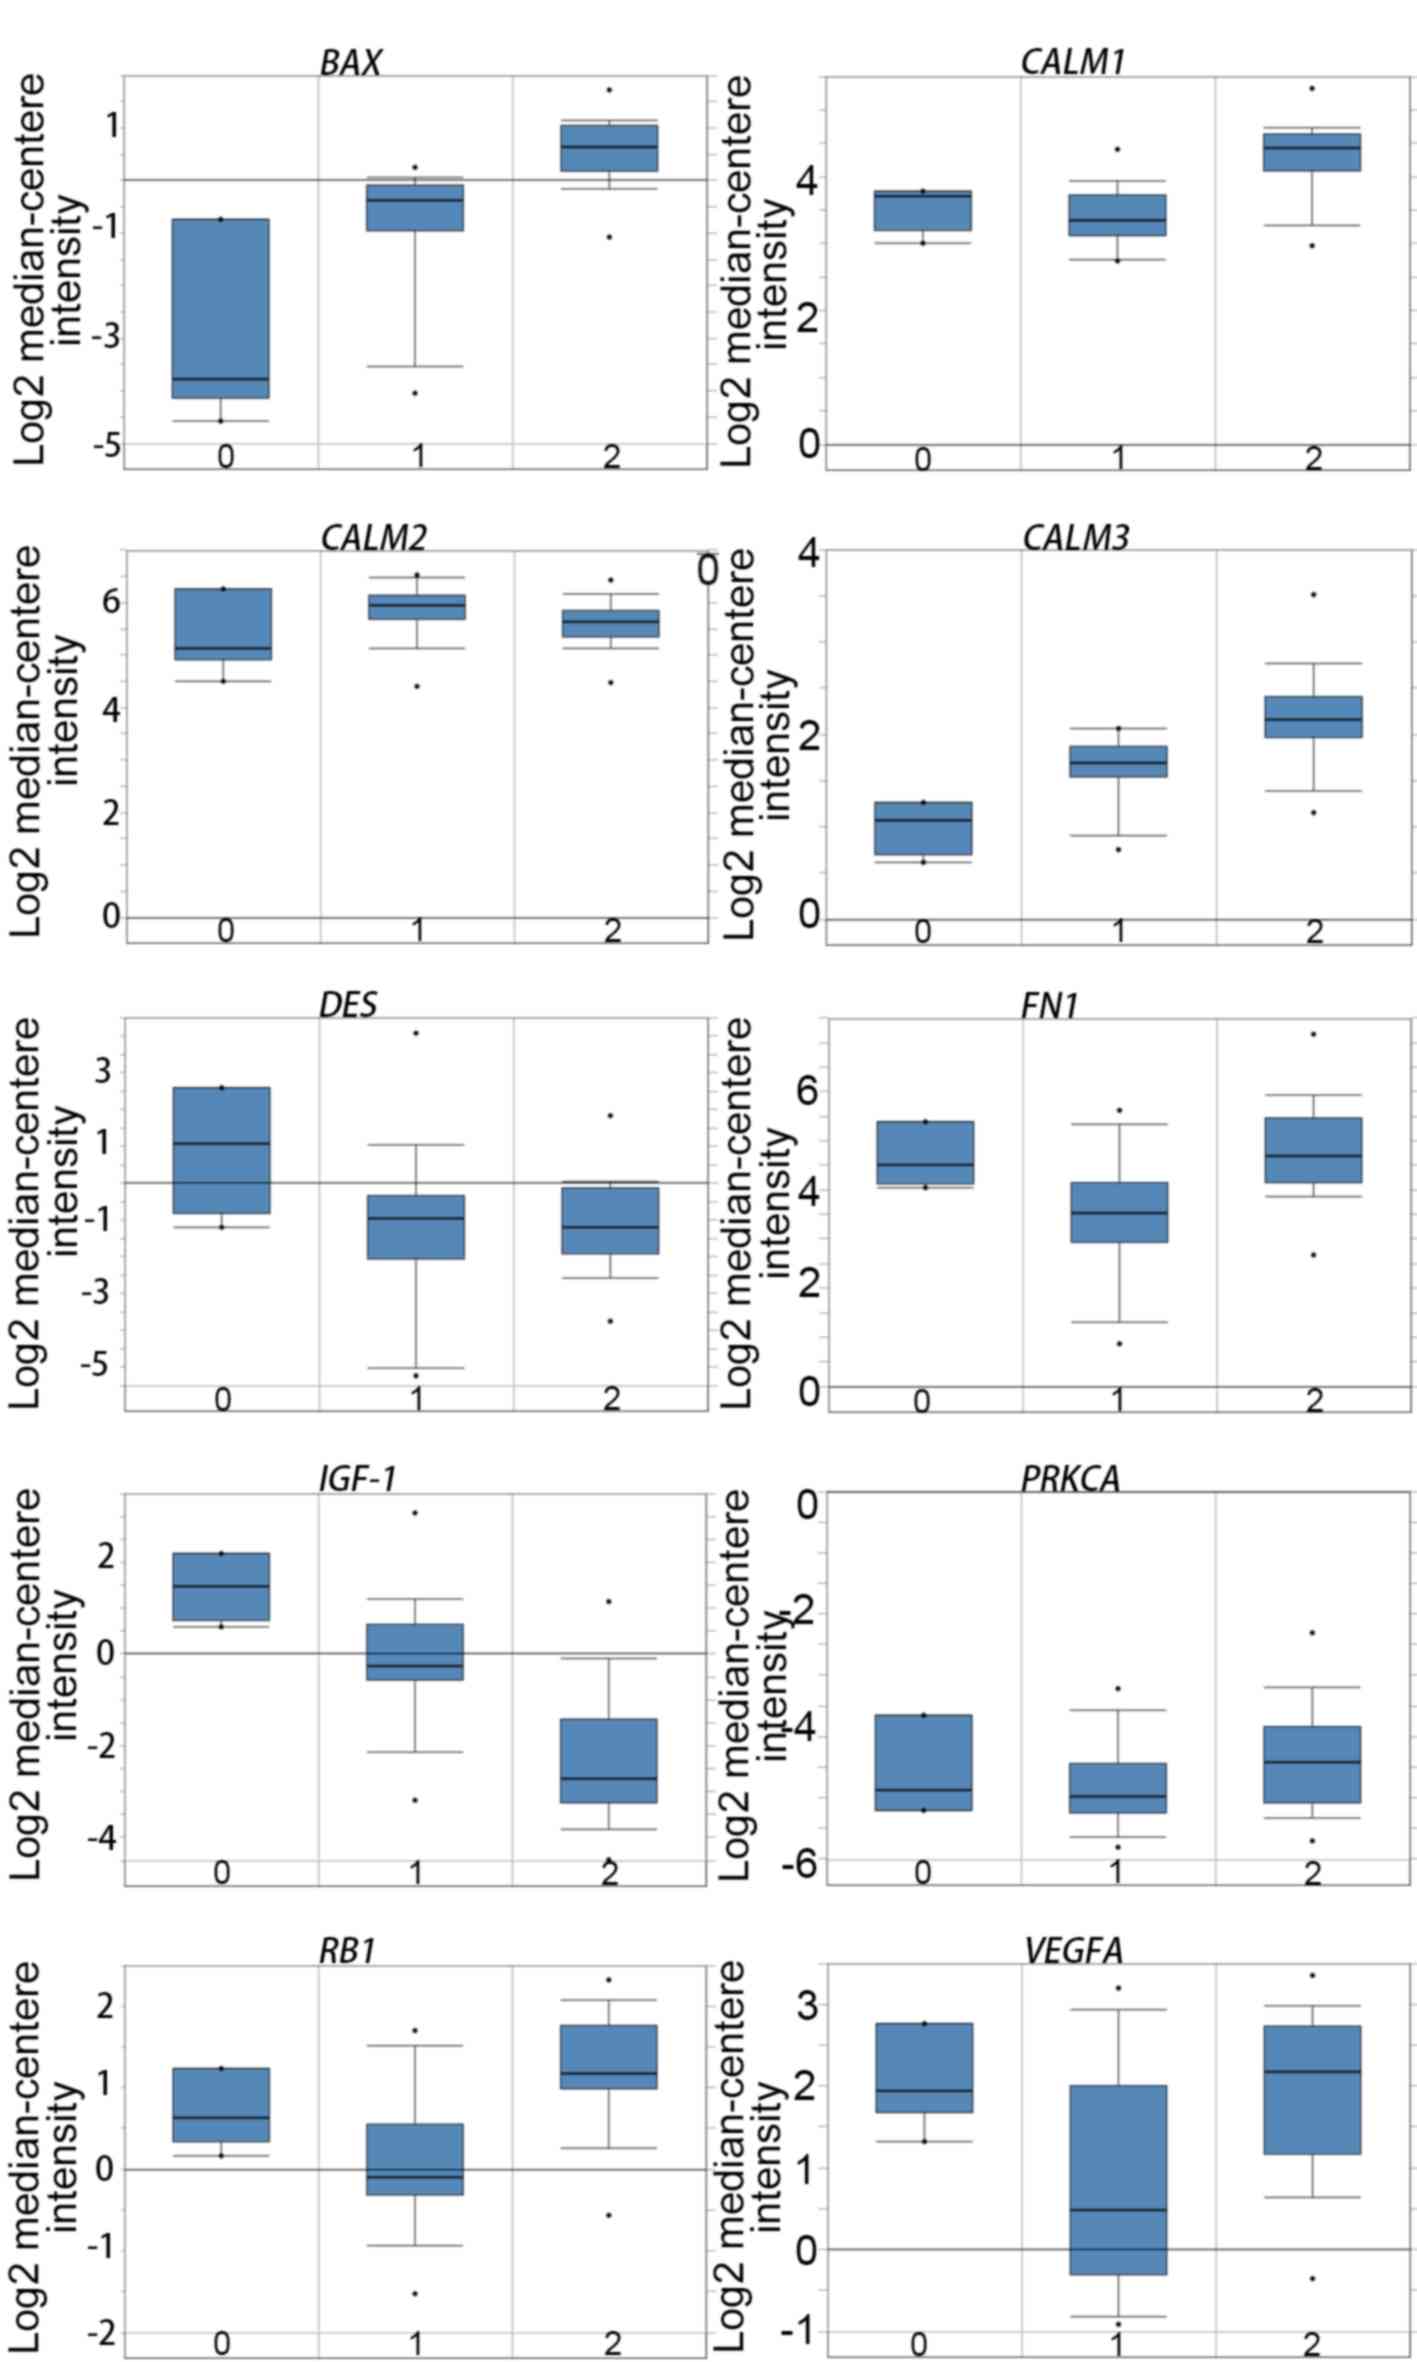 | Figure 5.Expression of the hub genes in the
GSE3189 dataset obtained using Oncomine online analysis. 0, No
value (normal skin); 1, Skin nevus; 2, Cutaneous melanoma.
DES, desmin; VEGFA, vascular endothelial growth
factor A; CALM1, calmodulin 1; CALM2, calmodulin 2;
CALM3, calmodulin 3; FN1, fibronectin 1;
PRKCA, protein kinase C α; IGF1, insulin-like growth
factor 1; RB1, retinoblastoma transcriptional corepressor
1. |
| Table II.Functional roles of the 10 hub genes
with a degree ≥10. |
Table II.
Functional roles of the 10 hub genes
with a degree ≥10.
| No. | Gene symbol | Full name | Function |
|---|
| 1 | VEGFA | Vascular
endothelial growth factor A | Induction of
proliferation and migration of vascular endothelial cells;
essential for both physiological as well as pathological
angiogenesis. |
| 2 | BAX | BCL2-associated X,
apoptosis regulator | It acts as either
an anti- or proapoptotic regulator and is involved in several
cellular activities. |
| 3 | CALM1 | Calmodulin 1 | Expression of a
member of the EF-hand calcium-binding protein family |
| 4 | CALM2 | Calmodulin 2 | Role in
proliferation, cell cycle progression, and signaling cascades. |
| 5 | CALM3 | Calmodulin 3 | Calcium binding;
enzymatic co-factor; role in cell cycle regulation as well as
cytokinesis. |
| 6 | FN1 | Fibronectin 1 | Fibronectin
expression; involvement in cell adhesion and migration
processes. |
| 7 | PRKCA | Protein kinase C
α | Essential roles in
numerous cellular processes, including cell volume control,
checkpoints of the cell cycle, cell adhesion, as well as cell
transformation. |
| 8 | IGF1 | Insulin-like growth
factor 1 | Expression of
protein with similar structure as well as function to insulin;
member of a family of proteins involved in regulating growth and
development. |
| 9 | RB1 | RB transcriptional
corepressor 1 | Expression of
negative regulatory protein of the cell cycle; the first tumor
suppressor gene to be identified. |
| 10 | DES | Desmin | Expression of a
muscle-specific class III intermediate filament. Homopolymers of
this protein form a stable intracytoplasmic filamentous network
which connects myofibrils to each other as well as to the plasma
membrane. |
Discussion
Melanoma is a highly metastatic type of cancer,
which exhibits strong resistance to both chemotherapy and
radiotherapy (24–26). It has been observed to develop
rapidly during the early phase. Melanoma cells acquire mutations
during this phase. Subsequently, mutant cells invade the dermal
layer and trigger angiogenesis. This ‘angiogenic switch’ is
involved in invasiveness and is characterized by the regulation of
genes, including VEGFA, VEGF receptor genes and related
angiogenic signaling pathways (27).
However, the molecular pathways underlying melanoma remain largely
unknown. The development of biomarkers with improved accuracy is
essential for the effective diagnosis and treatment of melanoma.
Genetic changes in melanoma may be observed using microarray
technology, which may also be beneficial for the identification of
novel biomarkers in other diseases.
The present study used 3 mRNA microarray datasets to
identify DEGs between malignant melanoma tissues and normal nevi
tissues. A total of 182 DEGs were identified, which included 52
downregulated and 130 upregulated genes. DEG interactions were
studied using GO and KEGG enrichment analyses. The upregulated
genes were found to be associated with the cell membrane,
cytoskeleton, extracellular region, actin binding, mitotic cell
cycle and PI3K-Akt signaling cascades, while the downregulated
genes were found to be involved in progressive regulation of
transcription, protein kinase binding, melanogenesis, and the
estrogen and calcium signaling pathways. Literature retrieval
results indicated that the associations between malignant melanoma
and these molecular mechanisms (oocyte meiosis, protein kinase
binding and estrogen signaling pathway) have not been reported
widely. A total of 10 DEGs with degrees ≥10 in the PPI network were
selected as hub genes. The PPI network revealed that BAX
directly interacts with MYCN, IGF1, RUNX1 (runt-related
transcription factor 1), MSH6, PRKDC (protein kinase,
DNA-activated, catalytic subunit), CALM1, CALM2, CALM3, TP63,
VEGFA and RB1, indicating a key role for BAX in
melanoma. Furthermore, the PPI network in DEGs is a novel gene
interaction observed in malignant melanoma. It is well known that
VEGFA and BAX are involved in tumor malignancy
(28,29), a finding confirmed in the present
study. VEGFA is related to angiogenesis, a process which is
required for tumor growth and metastasis (30). Vasculogenic mimicry (VM) is an
endothelial vessel supply system in cancers that VM reflects the
aggressive ability of tumor cells (31). Recently, the c-Myc gene was
reported to promote tumorigenesis of melanoma by promoting
vasculogenic mimicry via the Bax signaling pathway (24). VEGFA overexpression has also
been observed in lung, pancreatic and other cancers (32–34). In
addition to its role in cell cycle progression, VEGFA is a
potent angiogenic factor, which is required for oncogenesis
(35,36). CALM1, CALM2 and CALM3
belong to the CaM gene family (37,38).
They all encode a similar CaM protein, with differences at the
nucleotide level. CaM serves an essential role in disease
pathogenesis via the Ca2+ signaling pathway (39,40).
Furthermore, it is involved in apoptosis by balancing the
expression levels of the proapoptotic protein, BAX, with those of
the antiapoptotic protein, Bcl-2 (41).
Among the identified hub genes, BAX
overexpression was found to be associated with the lowest survival
rate. The protein encoded by this gene is a part of the Bcl-2
protein family that consists of antiapoptotic and proapoptotic
members. BAX gene expression is associated with shorter
patient survival, chemoresistance and recurrence in melanoma
(42,43). Thus, it is regarded as a target for
anticancer agents. The expression of the hub genes in relation to
both overall and disease-free survival was evaluated. BAX
alteration was found to significantly affect both overall survival
and disease-free survival. BAX could induce the decrease in overall
survival and disease-free survival. Moreover, clinical studies have
reported that a shorter survival period is significantly associated
with BAX gene overexpression (44,45).
However, the expression levels of the other hub genes in overall
survival were not statistically significant compared to BAX.
This result may have occurred due to the fact that survival
analysis in cBioPortal is performed based on a relationship between
gene mutation and prognosis. However, gene overexpression may arise
via either mutation or amplification. Accordingly, hub gene
overexpression in melanoma may occur due to gene amplification
rather than mutation, thus creating the need for further research
in order to confirm the association between melanoma and the hub
genes. Oncomine analysis demonstrated that mRNA expression levels
of BAX, CALM1, CALM3, FN1, PRKCA, RB1 and VEGFA were
higher in melanoma tissue than in normal nevi tissues, whereas the
mRNA expression level of IGF1 was lower in melanoma tissues.
Previous studies have reported that CALM2 levels in gastric,
breast and other cancer tissues are higher than those in normal
tissues, and that this gene may subsequently be used as a
prognostic target (46–48). Oncomine analysis in melanoma
indicated that CALM2 expression in melanoma was not higher.
Further investigation is therefore required to confirm CALM2
expression in cancers. The DES gene encodes desmin, one of
the first muscle-specific proteins to be expressed during the early
phases of skeletal and cardiac muscle differentiation (49). Certain studies have suggested that
desmin expression is elevated in colorectal cancer, and that it may
be used as a novel prognostic predictor (50,51).
DES expression is increased in osteogenic melanoma, however
the expression of DES is low in other types of melanoma
(52). Thus, the reason why there
was no significant difference in the Oncomine database analysis
results may be that the Oncomine database did not include the
classification of melanoma. Similarly, FN1, PRKCA, RB1 and
IGF1 had been reported to influence tumorigenesis and
initiation in other types of cancer (53,54),
which was consistent with our study in melanoma. It was speculated
that the Ca2+ signaling pathway is associated with
malignant melanoma. The disruption of the homeostasis of this
pathway during tumorigenesis leads to abnormal expression of
BAX (55). Disruption of
Ca2+ signaling pathway homeostasis also promotes tumor
angiogenesis via the overexpression of VEGFA.
There were certain limitations in the present study.
Firstly, the GES3189 dataset comprised 45 melanoma samples and 18
normal nevi samples, whereas the sample quantity of the other two
databases was insufficient. However, since three databases were
used to choose the overlap in Venn diagram as DEGs, this may
improve the credibility of the analysis results. Secondly, certain
biomarkers associated with melanoma were identified; however,
further experimental studies, including immunohistochemistry,
animal testing and clinical trials, are required to validate these
findings. Despite these limitations, there is few report that
upregulation of the CALM gene family (CALM1, CALM2
and CALM3) in malignant melanoma was associated with poor
prognosis. In addition, the present study was the first to report
associations between the identified DEGs and hub gene interactions
in malignant melanoma.
In conclusion, the present study identified DEGs
that may be associated with the initiation or progression of
melanoma. The 182 DEGs and 10 hub genes that were identified may be
considered as potential biomarkers of melanoma. Nonetheless,
additional research is required to further understand the
biological functions of these genes in melanoma.
Acknowledgements
The authors would like to thank Dr Xiangkun Wang
from the Department of Hepatobiliary of The First Affiliated
Hospital of Guangxi Medical University and Professor Jingming Zhao
from Guangxi Key Laboratory of Regenerative Medicine for their kind
suggestions for data analysis.
Funding
The present study was supported by National Natural
Science Foundation of China (grant no. 81701938).
Availability of data and materials
The datasets generated and/or analyzed during the
current study are available in the Gene Expression Omnibus
repository, [GSE3189 (https://www.ncbi.nlm.nih.gov/geo/query/acc.cgi?acc=GSE3189),
GSE4570 (https://www.ncbi.nlm.nih.gov/geo/query/acc.cgi?acc=GSE4570)
and GSE4587 (https://www.ncbi.nlm.nih.gov/geo/query/acc.cgi?acc=GSE4587)].
Authors' contributions
GL conceived the study and wrote the manuscript. BL
helped to design the study. GY conducted this study and interpreted
the data. YY was responsible for data analysis. All authors
approved the final manuscript to be published and agreed to be
accountable for all aspects of the work in ensuring that questions
related to the accuracy or integrity of any part of the work are
appropriately investigated and resolved.
Ethics approval and consent to
participate
Not applicable.
Patient consent for publication
Not applicable.
Competing interests
The authors declare that they have no competing
interests.
References
|
1
|
Qin J, Li S, Zhang C, Gao DW, Li Q, Zhang
H, Jin XD and Liu Y: Apoptosis and injuries of heavy ion beam and
x-ray radiation on malignant melanoma cell. Exp Biol Med (Maywood).
242:953–960. 2017. View Article : Google Scholar : PubMed/NCBI
|
|
2
|
Ci C, Tang B, Lyu D, Liu W, Qiang D, Ji X,
Qiu X, Chen L and Ding W: Overexpression of CDCA8 promotes the
malignant progression of cutaneous melanoma and leads to poor
prognosis. Int J Mol Med. 43:404–412. 2019.PubMed/NCBI
|
|
3
|
Bai X, Kong Y, Chi Z, Sheng X, Cui C, Wang
X, Mao L, Tang B, Li S, Lian B, et al: MAPK pathway and TERT
promoter gene mutation pattern and its prognostic value in melanoma
patients: A retrospective study of 2,793 cases. Clin Cancer Res.
23:6120–6127. 2017. View Article : Google Scholar : PubMed/NCBI
|
|
4
|
Shalem O, Sanjana NE, Hartenian E, Shi X,
Scott DA, Mikkelson T, Heckl D, Ebert BL, Root DE, Doench JG and
Zhang F: Genome-scale CRISPR-Cas9 knockout screening in human
cells. Science. 343:84–87. 2014. View Article : Google Scholar : PubMed/NCBI
|
|
5
|
Nissan MH, Pratilas CA, Jones AM, Ramirez
R, Won H, Liu C, Tiwari S, Kong L, Hanrahan AJ, Yao Z, et al: Loss
of NF1 in cutaneous melanoma is associated with RAS activation and
MEK dependence. Cancer Res. 74:2340–2350. 2014. View Article : Google Scholar : PubMed/NCBI
|
|
6
|
Burd CE, Liu W, Huynh MV, Waqas MA,
Gillahan JE, Clark KS, Fu K, Martin BL, Jeck WR, Souroullas GP, et
al: Mutation-specific RAS oncogenicity explains NRAS codon 61
selection in melanoma. Cancer Discov. 4:1418–1429. 2014. View Article : Google Scholar : PubMed/NCBI
|
|
7
|
Agrawal P, Fontanals-Cirera B, Sokolova E,
Jacob S, Vaiana CA, Argibay D, Davalos V, McDermott M, Nayak S,
Darvishian F, et al: A systems biology approach identifies FUT8 as
a driver of melanoma metastasis. Cancer Cell. 31:804–819.e7. 2017.
View Article : Google Scholar : PubMed/NCBI
|
|
8
|
Edgar R, Domrachev M and Lash AE: Gene
expression omnibus: NCBI gene expression and hybridization array
data repository. Nucleic Acids Res. 30:207–210. 2002. View Article : Google Scholar : PubMed/NCBI
|
|
9
|
Talantov D, Mazumder A, Yu JX, Briggs T,
Jiang Y, Backus J, Atkins D and Wang Y: Novel genes associated with
malignant melanoma but not benign melanocytic lesions. Clin Cancer
Res. 11:7234–7242. 2005. View Article : Google Scholar : PubMed/NCBI
|
|
10
|
Hoek K, Rimm DL, Williams KR, Zhao H,
Ariyan S, Lin A, Kluger HM, Berger AJ, Cheng E, Trombetta ES, et
al: Expression profiling reveals novel pathways in the
transformation of melanocytes to melanomas. Cancer Res.
64:5270–5282. 2004. View Article : Google Scholar : PubMed/NCBI
|
|
11
|
Smith AP, Hoek K and Becker D:
Whole-genome expression profiling of the melanoma progression
pathway reveals marked molecular differences between nevi/melanoma
in situ and advanced-stage melanomas. Cancer Biol Ther.
4:1018–1029. 2005. View Article : Google Scholar : PubMed/NCBI
|
|
12
|
Benjamini Y and Hochberg Y: Controlling
the false discovery rate: A practical and powerful approach to
multiple testing. J R Stat Soc Ser B (Methodological). 57:289–300.
1995.
|
|
13
|
Huang DW, Sherman BT, Tan Q, Collins JR,
Alvord WG, Roayaei J, Stephens R, Baseler MW, Lane HC and Lempicki
RA: The DAVID gene functional classification tool: A novel
biological module-centric algorithm to functionally analyze large
gene lists. Genome Biol. 8:R1832007. View Article : Google Scholar : PubMed/NCBI
|
|
14
|
Kanehisa M, Furumichi M, Tanabe M, Sato Y
and Morishima K: KEGG: New perspectives on genomes, pathways,
diseases and drugs. Nucleic Acids Res. 45:D353–D361. 2017.
View Article : Google Scholar : PubMed/NCBI
|
|
15
|
Ashburner M, Ball CA, Blake JA, Botstein
D, Butler H, Cherry JM, Davis AP, Dolinski K, Dwight SS, Eppig JT,
et al: Gene ontology: Tool for the unification of biology. The gene
ontology consortium. Nat Genet. 25:25–29. 2000. View Article : Google Scholar : PubMed/NCBI
|
|
16
|
Szklarczyk D, Morris JH, Cook H, Kuhn M,
Wyder S, Simonovic M, Santos A, Doncheva NT, Roth A, Bork P, et al:
The STRING database in 2017: Quality-controlled protein-protein
association networks, made broadly accessible. Nucleic Acids Res.
45:D362–D368. 2017. View Article : Google Scholar : PubMed/NCBI
|
|
17
|
Shannon P, Markiel A, Ozier O, Baliga NS,
Wang JT, Ramage D, Amin N, Schwikowski B and Ideker T: Cytoscape: A
software environment for integrated models of biomolecular
interaction networks. Genome Res. 13:2498–2504. 2003. View Article : Google Scholar : PubMed/NCBI
|
|
18
|
Bandettini WP, Kellman P, Mancini C,
Booker OJ, Vasu S, Leung SW, Wilson JR, Shanbhag SM, Chen MY and
Arai AE: MultiContrast delayed enhancement (MCODE) improves
detection of subendocardial myocardial infarction by late
gadolinium enhancement cardiovascular magnetic resonance: A
clinical validation study. J Cardiovasc Magn Reson. 14:832012.
View Article : Google Scholar : PubMed/NCBI
|
|
19
|
Cerami E, Gao J, Dogrusoz U, Gross BE,
Sumer SO, Aksoy BA, Jacobsen A, Byrne CJ, Heuer ML, Larsson E, et
al: The cBio cancer genomics portal: An open platform for exploring
multidimensional cancer genomics data. Cancer Discov. 2:401–404.
2012. View Article : Google Scholar : PubMed/NCBI
|
|
20
|
Gao J, Aksoy BA, Dogrusoz U, Dresdner G,
Gross B, Sumer SO, Sun Y, Jacobsen A, Sinha R, Larsson E, et al:
Integrative analysis of complex cancer genomics and clinical
profiles using the cBioPortal. Sci Signal. 6:pl12013. View Article : Google Scholar : PubMed/NCBI
|
|
21
|
Maere S, Heymans K and Kuiper M: BiNGO: A
Cytoscape plugin to assess overrepresentation of gene ontology
categories in biological networks. Bioinformatics. 21:3448–3449.
2005. View Article : Google Scholar : PubMed/NCBI
|
|
22
|
Rhodes DR, Kalyana-Sundaram S, Mahavisno
V, Varambally R, Yu J, Briggs BB, Barrette TR, Anstet MJ,
Kincead-Beal C, Kulkarni P, et al: Oncomine 3.0: Genes, pathways,
and networks in a collection of 18,000 cancer gene expression
profiles. Neoplasia. 9:166–180. 2007. View Article : Google Scholar : PubMed/NCBI
|
|
23
|
Rhodes DR, Yu J, Shanker K, Deshpande N,
Varambally R, Ghosh D, Barrette T, Pandey A and Chinnaiyan AM:
ONCOMINE: A cancer microarray database and integrated data-mining
platform. Neoplasia. 6:1–6. 2004. View Article : Google Scholar : PubMed/NCBI
|
|
24
|
Lin X, Sun R, Zhao X, Zhu D, Zhao X, Gu Q,
Dong X, Zhang D, Zhang Y, Li Y and Sun B: C-myc overexpression
drives melanoma metastasis by promoting vasculogenic mimicry via
c-myc/snail/Bax signaling. J Mol Med (Berl). 95:53–67. 2017.
View Article : Google Scholar : PubMed/NCBI
|
|
25
|
Brecht IB, Garbe C, Gefeller O, Pfahlberg
A, Bauer J, Eigentler TK, Offenmueller S, Schneider DT and Leiter
U: 443 paediatric cases of malignant melanoma registered with the
German central malignant melanoma registry between 1983 and 2011.
Eur J Cancer. 51:861–868. 2015. View Article : Google Scholar : PubMed/NCBI
|
|
26
|
Shimizu A, Kaira K, Yasuda M, Asao T and
Ishikawa O: Decreased expression of class III β-tubulin is
associated with unfavourable prognosis in patients with malignant
melanoma. Melanoma Res. 26:29–34. 2016. View Article : Google Scholar : PubMed/NCBI
|
|
27
|
Song S, Jacobson KN, McDermott KM, Reddy
SP, Cress AE, Tang H, Dudek SM, Black SM, Garcia JG, Makino A and
Yuan JX: ATP promotes cell survival via regulation of cytosolic
[Ca2+] and Bcl-2/Bax ratio in lung cancer cells. Am J Physiol Cell
Physiol. 310:C99–S114. 2016. View Article : Google Scholar : PubMed/NCBI
|
|
28
|
Shi L, Zhang G, Zheng Z, Lu B and Ji L:
Andrographolide reduced VEGFA expression in hepatoma cancer cells
by inactivating HIF-1α: The involvement of JNK and MTA1/HDCA. Chem
Biol Interact. 273:228–236. 2017. View Article : Google Scholar : PubMed/NCBI
|
|
29
|
Merino D, Lok SW, Visvader JE and Lindeman
GJ: Targeting BCL-2 to enhance vulnerability to therapy in estrogen
receptor-positive breast cancer. Oncogene. 35:1877–1887. 2016.
View Article : Google Scholar : PubMed/NCBI
|
|
30
|
Zhong Z, Huang M, Lv M, He Y, Duan C,
Zhang L and Chen J: Circular RNA MYLK as a competing endogenous RNA
promotes bladder cancer progression through modulating VEGFA/VEGFR2
signaling pathway. Cancer Lett. 403:305–317. 2017. View Article : Google Scholar : PubMed/NCBI
|
|
31
|
Delgado-Bellido D, Serrano-Saenz S,
Fernandez-Cortés M and Oliver FJ: Vasculogenic mimicry signaling
revisited: Focus on non-vascular VE-cadherin. Mol Cancer.
16:652017. View Article : Google Scholar : PubMed/NCBI
|
|
32
|
Lin CY, Cho CF, Bai ST, Liu JP, Kuo TT,
Wang LJ, Lin YS, Lin CC, Lai LC, Lu TP, et al: ADAM9 promotes lung
cancer progression through vascular remodeling by VEGFA, ANGPT2,
and PLAT. Sci Rep. 7:151082017. View Article : Google Scholar : PubMed/NCBI
|
|
33
|
Kim M, Jang K, Miller P, Picon-Ruiz M,
Yeasky TM, El-Ashry D and Slingerland JM: VEGFA links self-renewal
and metastasis by inducing Sox2 to repress miR-452, driving Slug.
Oncogene. 36:5199–5211. 2017. View Article : Google Scholar : PubMed/NCBI
|
|
34
|
Fahmy K, Gonzalez A, Arafa M, Peixoto P,
Bellahcène A, Turtoi A, Delvenne P, Thiry M, Castronovo V and
Peulen O: Myoferlin plays a key role in VEGFA secretion and impacts
tumor-associated angiogenesis in human pancreas cancer. Int J
Cancer. 138:652–663. 2016. View Article : Google Scholar : PubMed/NCBI
|
|
35
|
Cheng CY, Ho TY, Hsiang CY, Tang NY, Hsieh
CL, Kao ST and Lee YC: Angelica sinensis Exerts Angiogenic and
Anti-apoptotic effects against cerebral ischemia-reperfusion injury
by activating p38MAPK/HIF-1[Formula: See text]/VEGF-A signaling in
rats. Am J Chin Med. 45:1683–1708. 2017. View Article : Google Scholar : PubMed/NCBI
|
|
36
|
Zhang L, Lv Z, Xu J, Chen C, Ge Q, Li P,
Wei D, Wu Z and Sun X: MicroRNA-134 inhibits osteosarcoma
angiogenesis and proliferation by targeting the VEGFA/VEGFR1
pathway. FEBS J. 285:1359–1371. 2018. View Article : Google Scholar : PubMed/NCBI
|
|
37
|
Boczek NJ, Gomez-Hurtado N, Ye D, Calvert
ML, Tester DJ, Kryshtal D, Hwang HS, Johnson CN, Chazin WJ,
Loporcaro CG, et al: Spectrum and prevalence of CALM1-, CALM2- and
CALM3-encoded calmodulin variants in long QT syndrome and
functional characterization of a novel long QT syndrome-associated
calmodulin missense variant, E141G. Circ Cardiovasc Genet.
9:136–146. 2016. View Article : Google Scholar : PubMed/NCBI
|
|
38
|
Limpitikul WB, Dick IE, Tester DJ, Boczek
NJ, Limphong P, Yang W, Choi MH, Babich J, DiSilvestre D, Kanter
RJ, et al: A precision medicine approach to the rescue of function
on malignant Calmodulinopathic long-QT syndrome. Circ Res.
120:39–48. 2017. View Article : Google Scholar : PubMed/NCBI
|
|
39
|
Cai R, Zhang C, Zhao Y, Zhu K, Wang Y,
Jiang H, Xiang Y and Cheng B: Genome-wide analysis of the IQD gene
family in maize. Mol Genet Genomics. 291:543–558. 2016. View Article : Google Scholar : PubMed/NCBI
|
|
40
|
Bürstenbinder K, Möller B, Plötner R,
Stamm G, Hause G, Mitra D and Abel S: The IQD family of
Calmodulin-binding proteins links calcium signaling to
microtubules, membrane subdomains and the nucleus. Plant Physiol.
173:1692–1708. 2017. View Article : Google Scholar : PubMed/NCBI
|
|
41
|
Shoshan-Barmatz V, Krelin Y and
Shteinfer-Kuzmine A: VDAC1 functions in Ca2+ homeostasis
and cell life and death in health and disease. Cell Calcium.
69:81–100. 2018. View Article : Google Scholar : PubMed/NCBI
|
|
42
|
Liu Z, Ding Y, Ye N, Wild C, Chen H and
Zhou J: Direct activation of bax protein for cancer therapy. Med
Res Rev. 36:313–341. 2016. View Article : Google Scholar : PubMed/NCBI
|
|
43
|
Gil J, Ramsey D, Szmida E, Leszczynski P,
Pawlowski P, Bebenek M and Sasiadek MM: The BAX gene as a candidate
for negative autophagy-related genes regulator on mRNA levels in
colorectal cancer. Med Oncol. 34:162017. View Article : Google Scholar : PubMed/NCBI
|
|
44
|
Del Principe MI, Dal Bo M, Bittolo T,
Buccisano F, Rossi FM, Zucchetto A, Rossi D, Bomben R, Maurillo L,
Cefalo M, et al: Clinical significance of bax/bcl-2 ratio in
chronic lymphocytic leukemia. Haematologica. 101:77–85. 2016.
View Article : Google Scholar : PubMed/NCBI
|
|
45
|
Kowalczyk AE, Krazinski BE, Godlewski J,
Kiewisz J, Kwiatkowski P, Sliwinska-Jewsiewicka A, Kiezun J, Sulik
M and Kmiec Z: Expression of the EP300, TP53 and BAX genes in
colorectal cancer: Correlations with clinicopathological parameters
and survival. Oncol Rep. 38:201–210. 2017. View Article : Google Scholar : PubMed/NCBI
|
|
46
|
Rust R, Visser L, van der Leij J, Harms G,
Blokzijl T, Deloulme JC, van der Vlies P, Kamps W, Kok K, Lim M, et
al: High expression of calcium-binding proteins, S100A10, S100A11
and CALM2 in anaplastic large cell lymphoma. Br J Haematol.
131:596–608. 2005. View Article : Google Scholar : PubMed/NCBI
|
|
47
|
Haddad SA, Lunetta KL, Ruiz-Narvaez EA,
Bensen JT, Hong CC, Sucheston-Campbell LE, Yao S, Bandera EV,
Rosenberg L, Haiman CA, et al: Hormone-related pathways and risk of
breast cancer subtypes in African American women. Breast Cancer Res
Treat. 154:145–154. 2015. View Article : Google Scholar : PubMed/NCBI
|
|
48
|
Cai H, Xu J, Han Y, Lu Z, Han T, Ding Y
and Ma L: Integrated miRNA-risk gene-pathway pair network analysis
provides prognostic biomarkers for gastric cancer. Onco Targets
Ther. 9:2975–2986. 2016.PubMed/NCBI
|
|
49
|
Li CF, Yan ZK, Chen LB, Jin JP and Li DD:
Desmin detection by facile prepared carbon quantum dots for early
screening of colorectal cancer. Medicine (Baltimore). 96:e55212017.
View Article : Google Scholar : PubMed/NCBI
|
|
50
|
Wang Y, Li Y, Chen Z, Wang T, Gu J, Wu X,
Yin Y, Wang M and Pan Z: The evaluation of colorectal cancer risk
in serum by anti-DESMIN-conjugated CdTe/CdS quantum dots. Clin Lab.
63:579–586. 2017. View Article : Google Scholar : PubMed/NCBI
|
|
51
|
Ekinci O, Ogut B, Celik B and Dursun A:
Compared with elastin Stains, h-Caldesmon and desmin offer superior
detection of vessel invasion in gastric, pancreatic and colorectal
adenocarcinomas. Int J Surg Pathol. 26:318–326. 2018. View Article : Google Scholar : PubMed/NCBI
|
|
52
|
Trevisan F, Tregnago AC, Lopes Pinto CA,
Urvanegia ACM, Morbeck DL, Bertolli E, Riva Neto FR, Duprat Neto JP
and de Macedo MP: Osteogenic melanoma with desmin expression. Am J
Dermatopathol. 39:528–533. 2017. View Article : Google Scholar : PubMed/NCBI
|
|
53
|
Ku SY, Rosario S, Wang Y, Mu P, Seshadri
M, Goodrich ZW, Goodrich MM, Labbé DP, Gomez EC, Wang J, et al: Rb1
and Trp53 cooperate to suppress prostate cancer lineage plasticity,
metastasis and antiandrogen resistance. Science. 355:78–83. 2017.
View Article : Google Scholar : PubMed/NCBI
|
|
54
|
Wang X, Zhu Q, Lin Y, Wu L, Wu X, Wang K,
He Q, Xu C, Wan X and Wang X: Crosstalk between TEMs and
endothelial cells modulates angiogenesis and metastasis via
IGF1-IGF1R signalling in epithelial ovarian cancer. Br J Cancer.
117:1371–1382. 2017. View Article : Google Scholar : PubMed/NCBI
|
|
55
|
Ohshima Y, Takata N, Suzuki-Karasaki M,
Yoshida Y, Tokuhashi Y and Suzuki-Karasaki Y: Disrupting
mitochondrial Ca2+ homeostasis causes tumor-selective TRAIL
sensitization through mitochondrial network abnormalities. Int J
Oncol. 51:1146–1158. 2017. View Article : Google Scholar : PubMed/NCBI
|