Introduction
Head and neck squamous cell carcinoma (HNSCC)
originates from the epithelial lining of the oral cavity and is the
sixth most common cancer worldwide (1). Modern treatment utilizes a
multimodality strategy that primarily involves surgery and
radiotherapy and the 5-year overall survival is ~60%. Combinational
treatment with chemoradiotherapy, including cisplatin-based
chemotherapy, is a standard treatment for locally advanced disease
(2). Although molecular targeted
drugs such as cetuximab have been developed, they are mostly
administered to patients with advanced disease (2). Despite the aforementioned treatment
options, resistance and tumor recurrence remain a major concern.
The assessment of treatment response is often based on a
combination of clinical examinations and functional-anatomical
imaging with positron emission tomography (PET), computed
tomography (CT) and/or magnetic resonance imaging.
The epidermal growth factor receptor (EGFR) is a
transmembrane cell surface receptor that is found mainly in cells
of epithelial origin (3,4). The amplification and overexpression of
the EGFR gene are frequent events in HNSCC making it a suitable
candidate for targeted therapy (3).
The monoclonal antibody cetuximab (Erbitux®) reversibly
binds the ligand site (with greater affinity than natural ligands)
thereby blocking and preventing the activation of EGFR. This
antibody has been approved for the treatment of advanced HNSCC
(4).
Altered cell metabolism is a hallmark of cancer and
has been shown to negatively influence treatment outcomes in
various types of solid tumors including HNSCC (5,6). Several
oncoproteins (such as Akt, Myc and hypoxia-inducible factor 1α) and
oncogenic signaling pathways (such as the P13K/Akt/mTOR pathway)
directly regulate important elements of the metabolic network
(7). Furthermore, specific metabolic
signatures have been associated with acquired EGFR tyrosine kinase
inhibitor (TKI) resistance and an aggressive growth pattern in
HNSCC in vitro and in vivo models (7). Therefore, metabolic imaging serves an
important role in translating results from pre-clinical studies to
humans. Functional imaging with 18F-fluoro-2-deoxy-D-glucose (FDG)
and PET measures metabolic activity in tumors and is an important
tool for the staging, treatment planning and follow-up of patients
with HNSCC treated with radiation or definitive chemoradiation
(8).
FDG is transported into cells via glucose
transporters and, of the multiple glucose transporters, glucose
transporter 1 (GLUT1) is the most common mediator for glucose
uptake (9). This rapid uptake of
glucose by GLUT1 promotes cell survival and proliferation and is
predominately sustained by hexokinase 2, which is also a regulator
of the glucose metabolism (9). GLUT1
is a membrane protein that enables the cellular uptake of glucose
through the plasma membrane and has been found to be overexpressed
in a number of tumor types, including HNSCC (10–12).
Furthermore, in HNSCC EGFR TKI-resistant xenografts, lactate
build-up is associated with increased expression of GLUT1 (9).
The identification of cellular prognostic and
predictive markers may provide personalized therapeutic cancer
treatments (8). Quantitative
measurements of changes in cell metabolism could be used to
identify markers for treatment response in established cell lines
of HNSCC. Therefore, quantitative changes in cell metabolism,
together with other cellular characteristics, such as proliferation
parameters and metabolic markers, are believed to be a valuable
model for the identification of prognosis and treatment response
markers (8).
The aim of present study was to develop an in
vitro method for measurement of intracellular 18F-FDG with
gamma spectrometry and with this, to investigate if 18F-FDG
cellular uptake and GLUT1 expression are associated with treatment
response in HNSCC cell lines. Furthermore, the potential to compare
18F-FDG uptake in in vitro and in vivo studies via
gamma spectrometry and PET/CT may further assist the transition
from pre-clinical experiments to early clinical tests and clinical
routine to monitor treatment response.
Materials and methods
Cells and culture conditions
A total of six HNSCC cell lines were used in the
current study, three (UT-SCC-2, UT-SCC-14 and UT-SCC-45) cell lines
from the University of Turku (gifted by professor Reidar Grenman)
and three cell lines (LK0412, LK0626 and LK0858), which were
previously established at the University of Linköping (13) (Table
I). Normal oral keratinocytes (NOK) were also used. All cell
lines were derived from the tissue of patients diagnosed with
HNSCC. The cell lines were selected due to their different
intrinsic sensitivity for radiation or cetuximab (Table I) (13,14).
 | Table I.Origin and tumor characteristics of
the investigated cell lines. |
Table I.
Origin and tumor characteristics of
the investigated cell lines.
| Cell line | Primary tumor
location | TNM | Sex | IR | ICmabS |
|---|
| LK0412 | Tongue | T1N0M0 | F | 0.63 |
|
| LK0626 | Gingiva | T2N0M0 | M | 0.48 |
|
| LK0858 | Tongue | T3N0M0 | F | 0.73 |
|
| UT-SCC-2 | Floor of the
mouth | T4N1M0 | M |
| 0.96 |
| UT-SCC-14 | Tongue | T3N1M0 | M |
| 0.14 |
| UT-SCC-45 | Floor of the
mouth | T3N1M0 | M |
| 0.73 |
The UT-SCC cell lines were cultured in DMEM
supplemented with 2 mM glutamine, 1% non-essential amino acids, 50
IU/ml penicillin, 50 µg/ml streptomycin and 10% FBS (all from
Gibco; Thermo Fisher Scientific, Inc.). The LK cell lines were
cultured in keratinocyte-serum free medium (SFM) supplemented with
antibiotics (50 IU/ml penicillin and 50 µg/ml streptomycin) and 10%
FBS (all Gibco; Thermo Fisher Scientific, Inc.). The cells received
fresh culture media twice a week and were subcultured until ~90%
confluence after detaching the cells with 0.25% trypsin + 0.02%
EDTA. Cultures in passages of 10 to 25 were used in all
experiments. Cells were screened periodically for mycoplasma
contamination using DAPI staining and/or the Universal Mycoplasma
Detection kit (American Type Culture Collection).
NOK cells were established and cultured as
previously described (15). Biopsies
were harvested during benign surgery in the oral cavity (Department
of Otorhinolaryngology, Östergötland) mostly via tonsillectomies
and contained non-keratinized squamous cell epithelium (approved by
the Linköping University Ethical Committee; diary no. M156-05).
Primary keratinocyte cultures were derived from trypsin-digested
tissue and cultured in keratinocyte-SFM supplemented with
antibiotics (50 IU/ml penicillin and 50 µg/ml streptomycin) in
culture flasks pre-coated with fibronectin and collagen for 4 h at
37°C. Medium was replaced every three days and cells were
subcultured to ~75% confluence using 0.25% trypsin + 0.02% EDTA.
Cultures were stored at −150°C. In the present study, NOK from two
patients in passages two and three were used for subsequent
analyses.
Assessment of metabolic changes by
18F-FDG measurements
The study protocol was determined after evaluating
cellsseeded at a density of 5,000 to 40,000 cells/cm2 in
Petri dishes with an area of 21 cm2, 24 h prior to the
administration of 0.5 to 40 megabecquerel (MBq) 18F FDG solution
(incubation times between 15 min and 3 h). The resulting protocol
stated below accounts for cell growth, as well as for the
saturation of measured intracellular uptake seen in incubation time
and administrated activity.
For the experiments, cells were seeded into Petri
dishes at densities of 15×103 to 30×103
cells/cm2, depending on the plating efficiency of each
cell line (70–80% confluent at the start of the experiments). After
cetuximab treatment (24 and 48 h) or radiation (24 or 72 h), cells
were starved in PBS for ~1 h, and 1 ml 18F-FDG solution (2.0±0.12
MBq/ml) was added. After 60 min, glucose accumulation was stopped
by removing the 18F-FDG solution and thereafter, rinsing the Petri
dishes three times with PBS. The intracellular uptake of 18F-FDG
was measured using a high purity germanium (HPGe) gamma
spectrometer (GS) coupled with a multi-channel analyzer (ORTEC
B.V). All cell samples were measured in the same geometry for a
real-time acquisition of 120 sec, and the registered death time was
<5% for all measurements. The intracellular uptake of each Petri
dish was calculated from the net count of the 511
kiloelectron-volts (keV) photo peak in the spectrum obtained using
GammaVision™ software (7.02.11; ORTEC B.V). The uptake was decay
corrected to the time of administration to minimize any time
differences between administration and measurement for each batch
of cell sample. The remaining intracellular activity in each Petri
dish was derived by dividing the total registered number of counts
in the photo peak of the acquired gamma spectrum with the
acquisition time and the spectrometer source energy peak efficiency
factor [1,088±0.07 counts/kilobecquerel (kBq)]. The efficiency
factor was obtained from five Petri dish calibration samples of 20
MBq 18F measured in the spectrometer during decay from 3,000 to 25
kBq in the same experimental geometry with an overall uncertainty
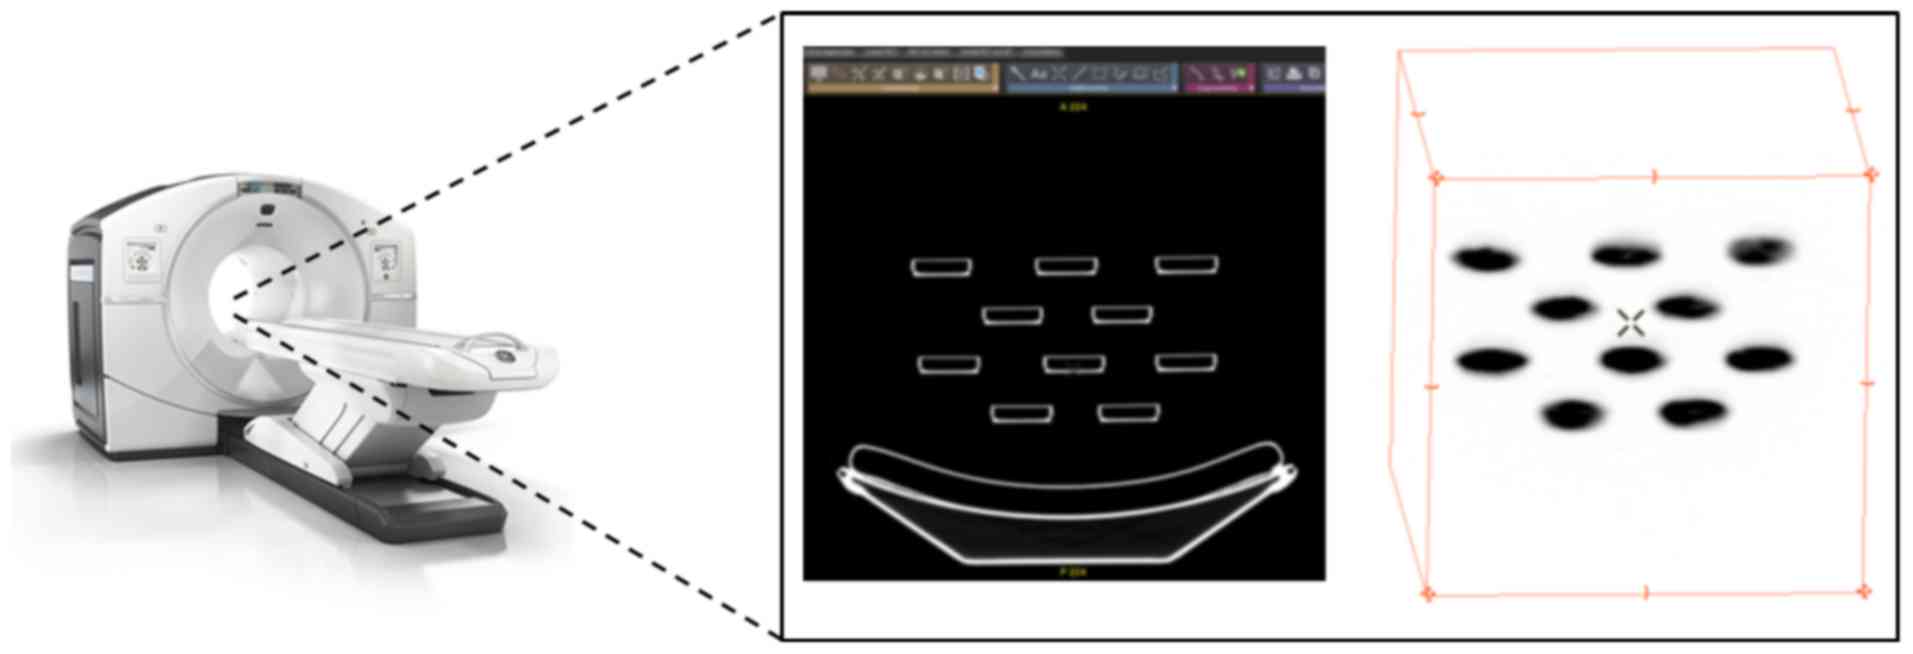
<3.0%. In addition to the GS measurement, LK626 and LK0412 cell
samples in the same conditions as for the GS measurements were
stacked and placed in a clinical PET/CT system (Discovery 710; GE
Healthcare), as shown in Fig. 1.
Images were obtained for one bed position and a bed time of 120
sec. Quantification of 18F-FDG uptake was calculated using regions
of interest (ROI) over each Petri dish after iterative
reconstruction with a standard ordered subsets expectation maximum
(OSEM) algorithm of 3 iterations and 18 subsets, Gaussian post
filter (full width at half maximum=5.5 mm) and point-spread
function (PSF), time-of-flight (TOF) corrections. The
quantification steps are illustrated in Fig. S1. The remaining intracellular
activity in each Petri dish was derived by dividing the total
registered number of counts per sec in the ROI with the acquisition
time and the PET-system efficiency factor (33.47±1,048 counts/kBq)
derived for this specific measurement. The PET/CT acquisition
enables measurements of photon emission per monolayer culture or
image voxel to be determined in a single bed for the entire set of
Petri dishes and have the possibility to be an accessible method to
evaluate treatment sensitivity, drug resistance and therapy
response for a large batch in a single acquisition.
The current study assessed the glucose uptake
changes in HNSCC cells after radiation and cetuximab treatment,
where selected cells were irradiated [4 gray (Gy)] with 4
megaelectron volts photons generated by a linear accelerator
(Clinac 4/100; Varian Medical Systems, Inc.), delivering a
dose-rate of 2.0 Gy/min or treated with cetuximab
(Erbitux®; 60 nM, Merck KGaA). After a further 24 or 48
h, 18F-FDG solution was added and its uptake was measured as
described above. The cells were scraped and collected in test
tubes, and the protein concentration of each sample was determined
using a DC Protein Assay (Bio-Rad Laboratories, Inc.).
Reverse transcription-quantitative PCR
(RT-qPCR)
The mRNA expression of GLUT1 was analyzed using
RT-qPCR on a 7500 Fast Real-Time PCR system (Applied Biosystems;
Thermo Fisher Scientific, Inc.). Total RNA was extracted from cells
treated with cetuximab (UT-SCC-2, UT-SCC-14 and UT-SCC-45) using
the RNeasy mini kit (Qiagen AB) and cDNA was synthesized (37°C for
60 min, 95°C for 5 min and cooling to 4°C) using the high capacity
RNA-to-cDNA kit (Applied Biosystems; Thermo Fisher Scientific,
Inc.). TaqMan gene expression assays from Applied
Biosystems® (Thermo Fisher Scientific, Inc) were used
for the PCR amplification of GLUT1 (assay ID, Hs00892681_m1; cat.
no. 4331182) and two reference genes, GAPDH (assay ID,
Hs02758991_g1; cat. no. 4331182) and β-actin (assay ID, Hs99999903_
m1; cat. no. 4331182). The expression levels of GAPDH and β-actin
were used as internal standards. Briefly, the amplification
reactions were carried out in 20 µl final volume containing 10 ng
cDNA, 1 µl TaqMan gene expression assay, 10 µl TaqMan gene
expression master mix and water. The PCR conditions were as
follows: 95°C for 10 min, followed by 40 cycles of 95°C for 15 sec
and 60°C for 60 sec. The comparative Cq method was applied to
determine the n-fold difference in expression levels relative to
calibrator sample (untreated cells) (16).
Statistical analysis
All data are expressed as the mean ± SD from three
or more independent experiments. Data were statistically evaluated
using one-way ANOVA followed by Bonferroni's post hoc test. IBM
SPSS statistics v22 (IBM Corporation) was used for all statistical
analyses. P<0.05 was considered to indicate a statistically
significant difference.
Results
Quantitative measurements of glucose
uptake with FDG
To establish a method for quantitative measurements
of glucose uptake in cultured HNSCC cells and NOKs, the
radiolabeled glucose analog, 18F-FDG, was administrated to cells
and its intracellular uptake was measured via gamma spectrometry.
The study protocol was developed in order to maximize the glucose
uptake differences between different cell lines, as well as between
radiated cells and non-radiated controls. To establish a protocol,
different parameters including starvation, administrated activity
(0.5–40 MBq 18F-FDG solution), incubation time and rinsing time
were investigated for cell line LK0412. The results (data not
shown) demonstrated that the uptake of 18F-FDG increased linearly
with cell number and administered activity. However, the number of
counts per MBq at a cell line specific density reached a saturation
level for administered activity above 2 MBq/Petri dish due to dead
time limitations of the spectrometer. The uptake was highest during
the first 60 min of incubation and the saturation level was reached
after 60 to 120 min depending on the number of the cells. The ~60
min incubation time also corresponds to the well-established
standard waiting time between injection of 18F-FDG and PET image
acquisition for clinical PET oncology examinations. The favored
protocol consisted of a starvation time with PBS of 1–2 h, a cell
line specific cell-seeding, an administrated activity of 2.0 MBq
18F-FDG in 1 ml of PBS and an incubation time of 60 min.
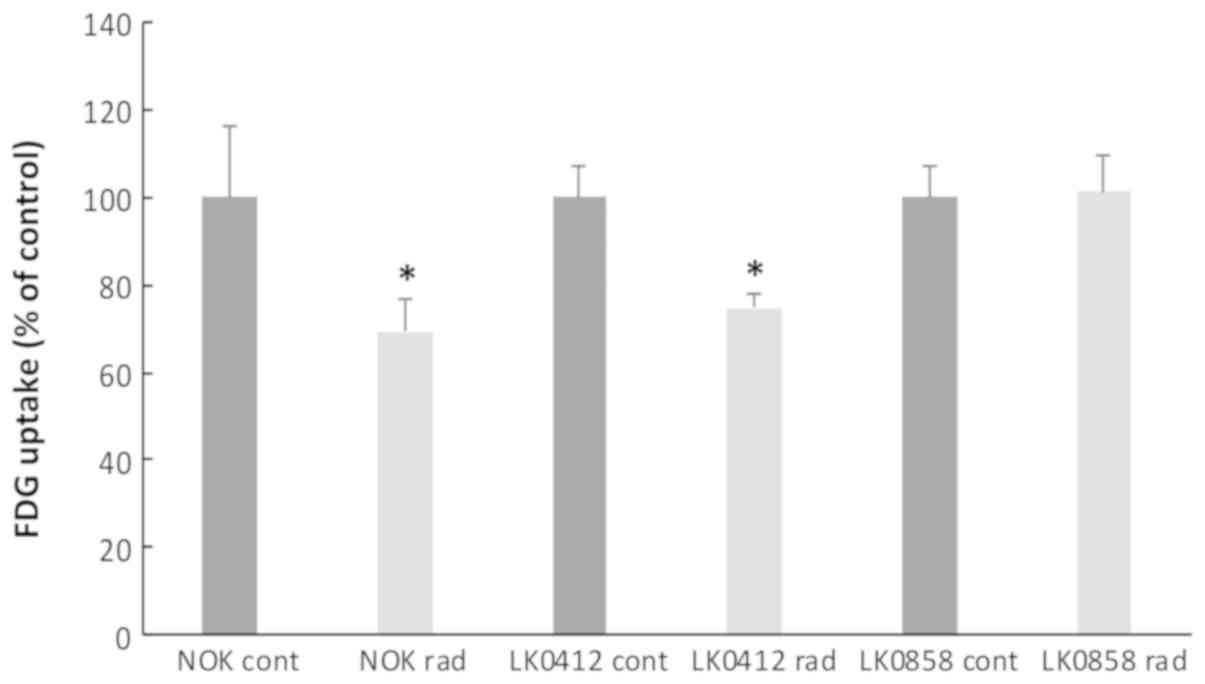
Differences in glucose uptake in HNSCC
after radiation
To investigate if the radiation sensitivity of tumor
cells and NOKs could be predicted by measuring changes in glucose
uptake, the radiolabeled glucose analog F18-FDG was quantitatively
analyzed via gamma spectrometry before and 72 h after radiation
treatment (4 Gy). HNSCC cell lines LK0412 and LK0858 with different
radiosensitivities (Table I;
surviving fraction at 2 Gy) (13)
and NOKs were investigated. A significant decrease in metabolic
activity was measured after radiation in the more radiosensitive
cell line, LK0412 and in NOK (Fig.
2). No differences in morphology were observed between control
cells and radiated cells (data not shown) and all data were
normalized to the amount of protein in each Petri dish.
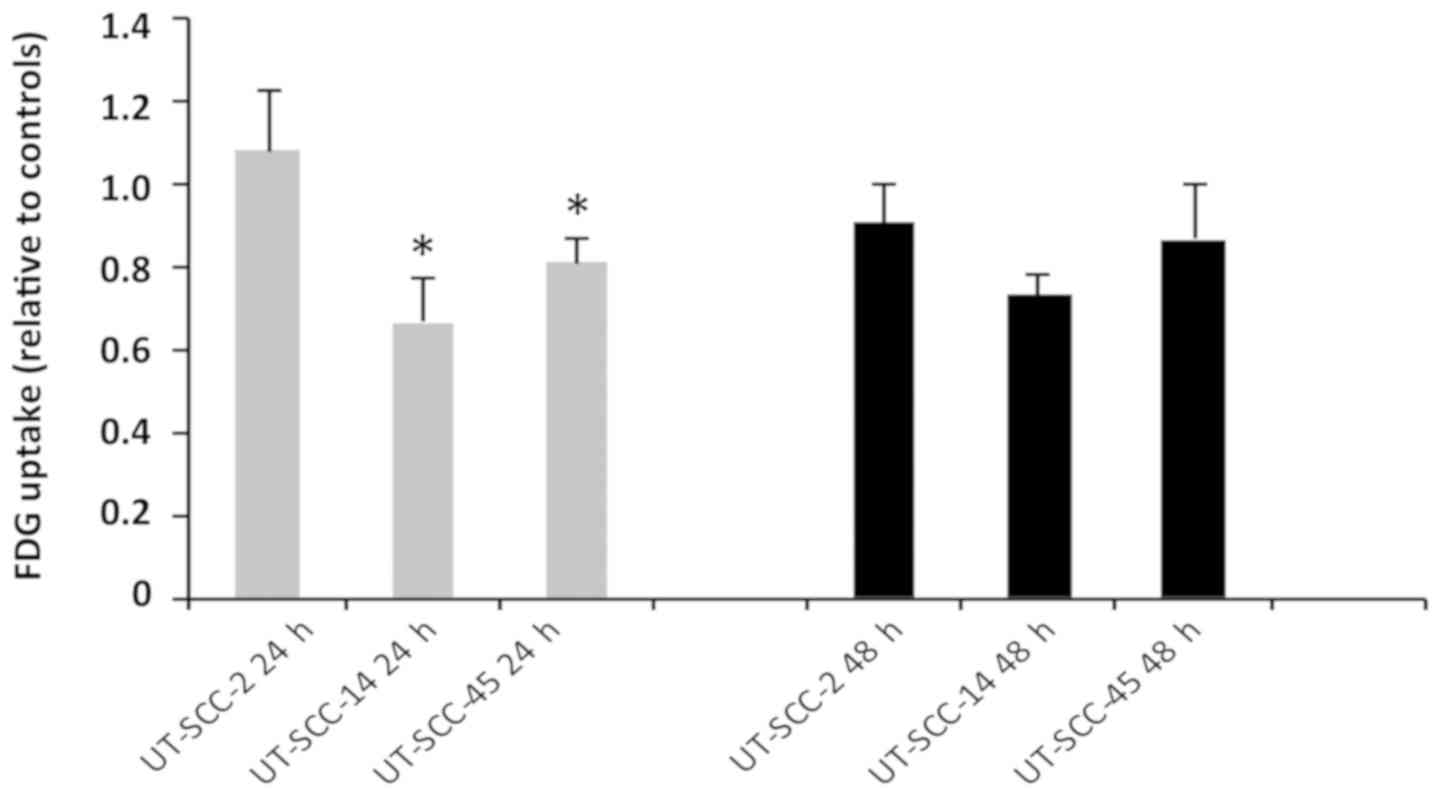
Differences in glucose uptake in HNSCC
after treatment with cetuximab
To investigate if cell sensitivity to cetuximab
could be predicted by measuring intracellular glucose uptake,
F18-FDG was quantitatively analyzed via gamma spectrometry. The
dose of cetuximab (60 nM) was chosen from previous experiments
(14,17). The glucose uptake of UT-SCC-14,
UT-SCC-45 and UT-SCC-2 HNSCC cell lines with different cetuximab
sensitivities (14,17) (Table
I) was assessed before and after 24 and 48 h of cetuximab
treatment. After 24 h, a significantly decreased uptake of F18-FDG
was determined in the most sensitive cell line UT-SCC-14, when
compared with the most resistant cell line, UT-SCC-2. Furthermore,
significant differences were also observed between UT-SCC-2 (24 h)
cells and the middle sensitive cell line, UT-SCC-45 (Fig. 3); no significant differences were
observed after 48 h.
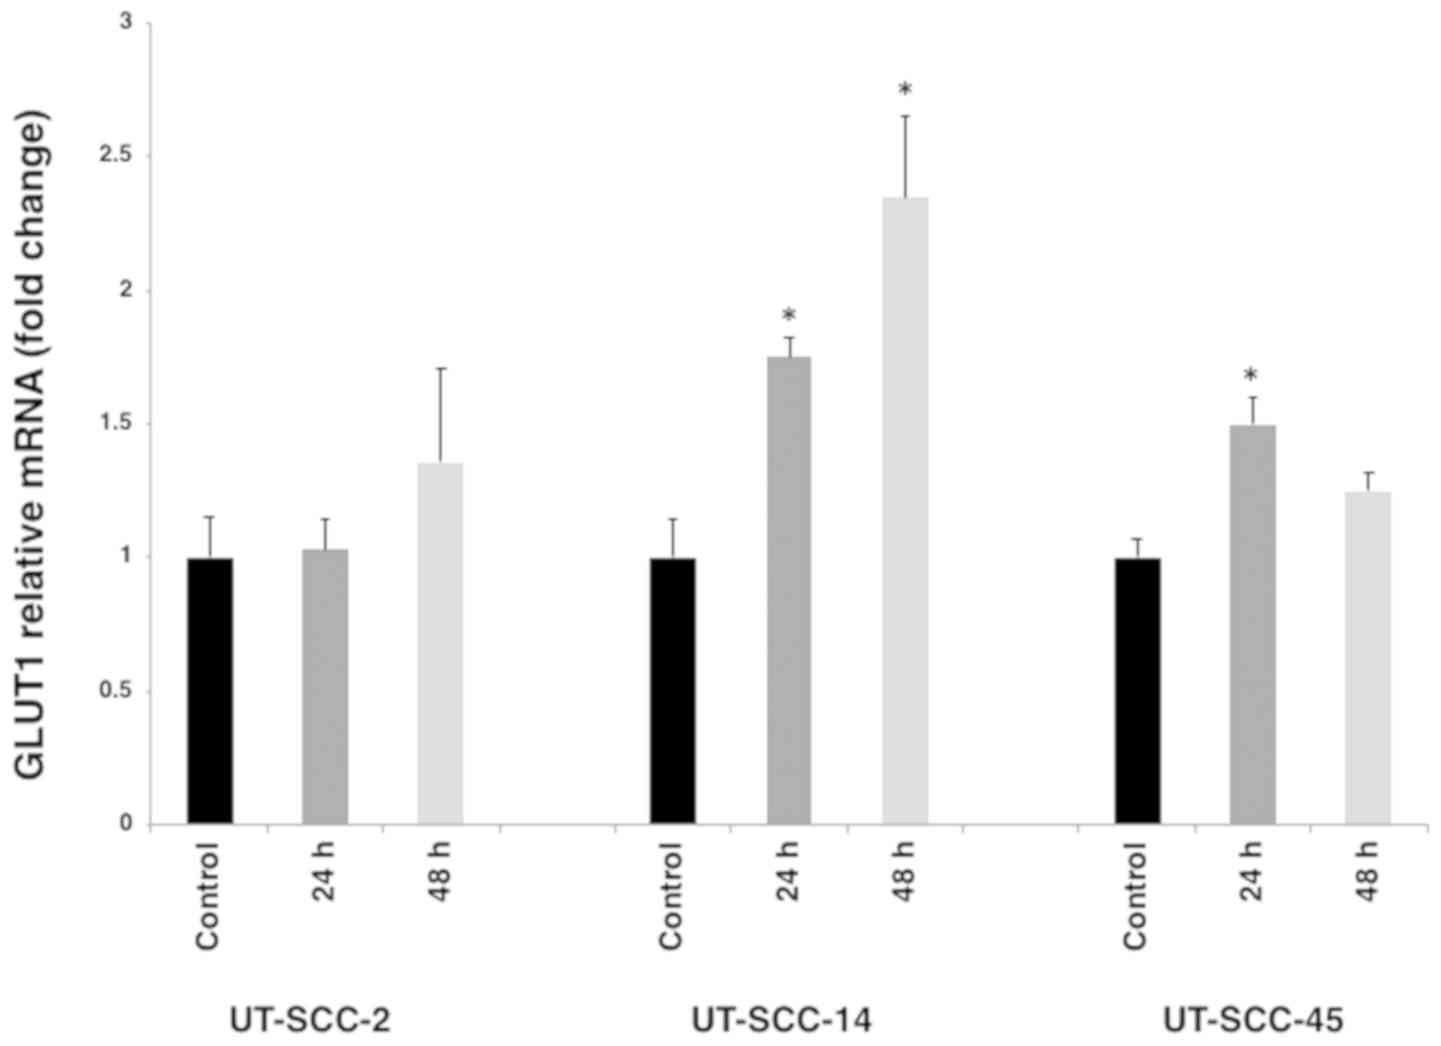
Changes in GLUT1 mRNA expression after
cetuximab treatment
To investigate the association between GLUT1
expression and F18-FDG uptake in cell lines possessing diverse
intrinsic sensitivities to cetuximab (UT-SCC- 2, UT-SCC-14 and
UT-SCC-45), the mRNA expression of GLUT1 was determined via RT-qPCR
prior to and following 60 nM cetuximab treatment. After 24 and 48 h
cetuximab treatment, the expression of GLUT1 was significantly
increased in UT-SCC-14 and to a lesser extent in UT-SCC-45 cells.
Moreover, after 24 and 48 h of cetuximab treatment, differences in
GLUT1 mRNA expression pattern were identified between the cell
lines (Fig. 4).
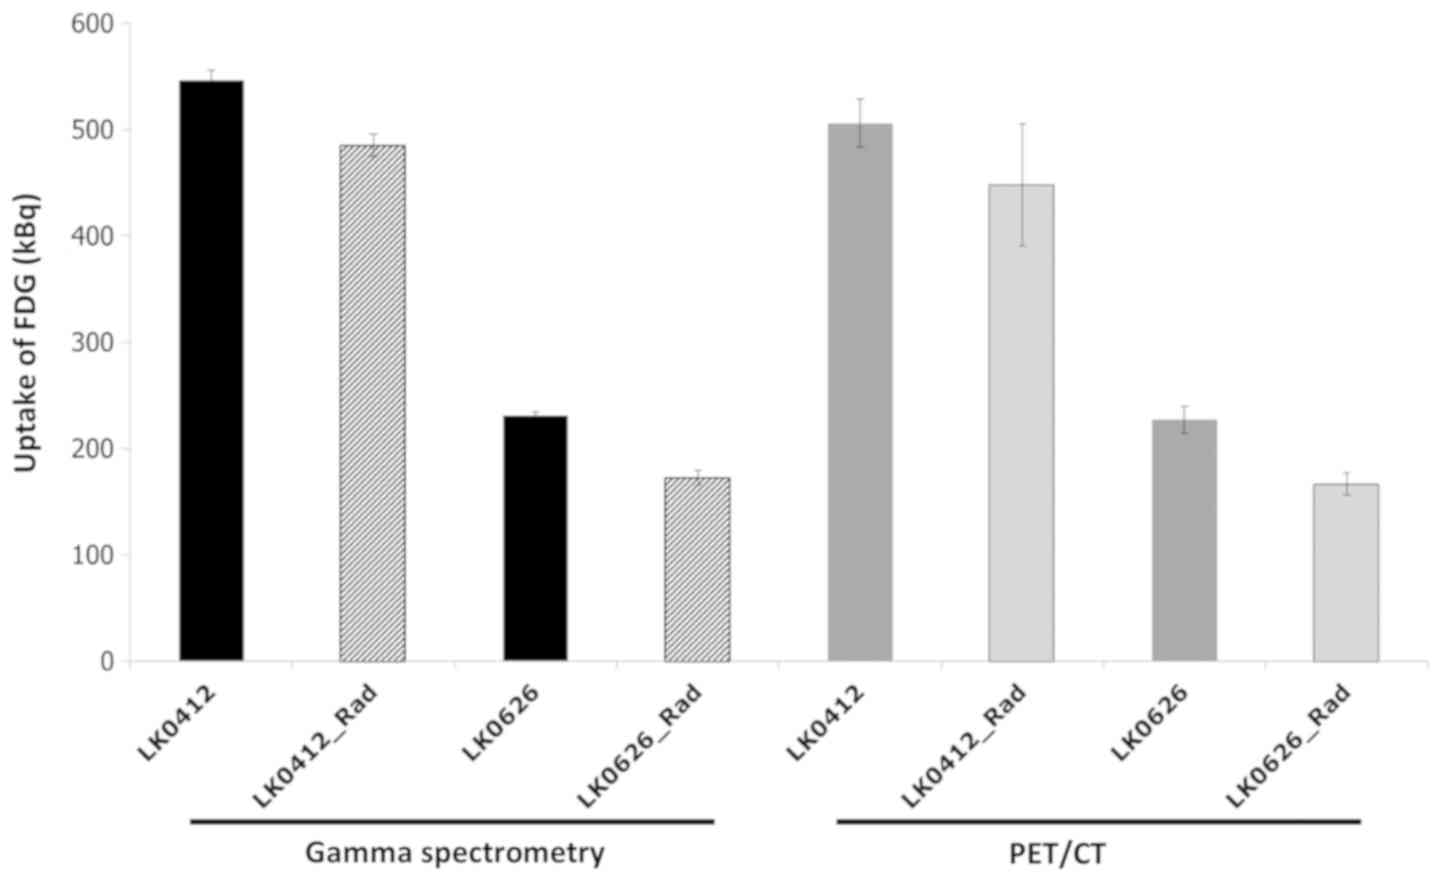
Comparison between gamma spectrometry
and PET measurement of FDG uptake
The quantification of glucose uptake for LK0412 and
LK0626 HNSCC cell lines with different radiation sensitivities
(13) was compared via gamma
spectrometry and PET/CT imaging to estimate early response (24 h)
after radiation (4 Gy). The source full energy peak efficiency
factor (counts/kBq) was derived for both the PET-system and the
HPGe gamma detector by measuring the counts in the photo peak 511
keV (PET ± 10%; HPGe ± 1%) from an in-house calibrated sample in a
fixed geometry during decay from 3 MBq to 25 kBq.
Each method was able to distinguish the relative
difference in 18F-FDG uptake between the two cell lines. The mean
difference uptake and standard deviation was 280±39.5 kBq
(PET-system) and 314±11.4 kBq (HPGe detector) for controls and
radiated samples obtained subsequently under same conditions
(Fig. 5). For the more
radiation-sensitive cell line LK0626, the two methods could clearly
identify the irradiated dishes from the controls (GS,
non-irradiated 231±3.4 kBq and irradiated 172±7.2 kBq; and PET/CT,
non-irradiated 227±13.0 kBq and irradiated 166±10.2 kBq) (Fig. 5). For the less sensitive cell line
LK0412, the spectrometry measurement was more sensitive with less
variation (non-irradiated 546±9.2 kBq and irradiated 485±10.3 kBq)
compared with the PET/CT measurement (non-irradiated 505±22.6 kBq
and irradiated 447±57.3 kBq) (Fig.
5).
Discussion
Cancer cells require a large quantity of glucose for
growth and proliferation, and changes in cell metabolism are
thought to impact treatment response but to various extents in
different types of tumor. The assessment of glucose metabolism may
represent a method to determine intracellular metabolic activity.
Increased uptake of FDG observed in mammary tumor cells has been
revealed to directly indicate a higher glucose metabolic rate
(18). Furthermore, high uptake of
FDG has been associated with poor prognosis (19). The main aim of the current study was
to develop a reliable method for measuring 18F-FDG cellular uptake.
Therefore, a method for the in vitro measurement of glucose
uptake was established using a gamma spectrometer. Whether the
intracellular uptake of 18F-FDG could be used as a reliable
predictive marker for radiotherapy and cetuximab responses was
determined.
Gamma spectrometry is a non-invasive technique that
is used to measure electromagnetic radiation in the gamma spectrum
of radioactive sources present in a sample; quantitative analyses
are performed by counting and measuring the energy of individual
photons emitted from radioactive elements present in the sample
(20). Currently, the use of high
resolution HPGe detectors in gamma spectrometry is the most common
strategy for the identification and quantification of gamma
emitting radionuclides in samples (20). By comparing the results from gamma
spectrometry with those of a clinical PET/CT scanner for two cell
lines (LK0412 and LK0626), the current study demonstrated that the
differences in uptake values between radiated cells and controls
were comparable between the two methods. The slightly higher
variance of the quantitative results obtained with PET/CT indicated
that the reconstruction correction factors for attenuation, scatter
and the specific measurement geometry with low background need to
be further evaluated and optimized for reconstruction parameter
settings, scatter and attenuation correction strategies. A
significant association for individual cell measurements between
the two methods would be a strong indicator for the accurate
comparison between gamma spectrometry and PET/CT measurements, the
results of which may improve the evaluation process for batch
measurements. A clinical PET/CT scanner may use up to 360 Petri
dishes to produce a single PET acquisition of 4 min. For a GS or a
scintillation detector, this would be time consuming and
cumbersome, as the accumulated acquisition time would be >720
min and the measurements would need to account for activity decay
and variation in count statistics due to the short half-life of
109.7 min for 18F. The use of a PET/CT scanner also aids
the translation of data from in vitro cell studies to the
clinical assessment of individual treatment responses in
vivo. The sensitivity and specificity of 18F-FDG-PET in a
clinical setting is well established and have been shown to be
>90% for a number of investigation and lesion sizes (21,22).
Investigations and optimization of the PET acquisition settings,
reconstruction parameters and correction methods for the Petri dish
matrix will be required to further improve results with increased
accuracy and less variation. In the present study, the standard
OSEM reconstruction algorithm with PSF and TOF corrections was used
but without any attenuation correction. Novel, more advanced
reconstruction methods with improved signal-to-noise ratios such as
Bayesian penalized likelihood reconstruction was also tested in the
present study, but induced a higher variability in the measurements
and streak artifacts in the image when attenuation correction was
applied. Further studies are required to optimize and standardize
acquisition and reconstruction parameter settings for batch
measurements of in vitro samples with a clinical PET/CT
system.
The results of a previous study indicated that a
high maximum standardized uptake value (SUVmax) of FDG from PET/CT
measurements predicts a poor prognosis in laryngeal cancer
(23). Furthermore, the study
revealed an association between high SUVmax and an increased
expression of GLUT1, hypoxia-inducible factor-1α (HIF-1α), PI3K and
phosphorylated-AKT. Yamada et al (24) also demonstrated that the uptake of
FDG was associated with GLUT1 and HIF-1α expression in early stage
oral squamous cell carcinomas. However, it has also been revealed
that 18F-FDG uptake in HNSCC xenografts might not reflect the level
of metabolic activity (hexokinase II and thymidine kinase-1 protein
levels) (25).
The current study utilized three cell lines with
different intrinsic radiation sensitivities and three cell lines
with different intrinsic cetuximab sensitivities (13,14,17). The
results revealed that after radiotherapy and cetuximab treatment, a
decrease in 18F-FDG uptake was observed, which was most prominent
in the most sensitive cell lines LK0626, LK0412 and UT-SCC-14. It
has been reported that the SUVmax is associated with the
effectiveness of neoadjuvant chemoradiotherapy in oral squamous
cell carcinoma (26). Furthermore,
an increased sensitivity to radiation has been associated with
GLUT1 downregulation in laryngeal carcinoma xenografts; however, no
significant association between GLUT1 or HIF-1α expression and
18F-FDG uptake was found (27). The
present study identified a significant increase in GLUT1 mRNA
expression following 24 h exposure to cetuximab in the sensitive
cell line UT-SCC-14, which was not associated with increased
18F-FDG uptake. In HNSCC tumors, GLUT1 has been revealed to be
directly associated with the degree of hypoxia (28). A previous study recently determined
that hypoxia and HIF-1α impact the sensitivity to cetuximab in
HNSCC (29). However, the connection
to GLUT1 and FDG uptake requires further elucidation.
To clarify the impact of FDG uptake on cell
responses to cetuximab treatment, in vivo investigations
must be performed. In vivo models combined with metabolic,
pre-clinical small animal imaging will provide an increased
possibility to translate results from in vitro models into
clinical practice. In contrast to cell or tissue culture-based
experiments, animal studies incorporate interacting physiological
factors present in a complex living system, thereby providing
quantitative, spatially and temporally-indexed information on
normal and diseased tissues to monitor disease progression or
treatment response over a period of time (30). Our in vitro results are a
first step to determine if GS and PET/CT analysis can be used for
evaluating treatment response. In the future, treatment response
evaluation may be important in determining personalized treatments
for patients with HNSCC.
In summary, the current study developed a novel and
reliable method for the measurement of intracellular 18F-FDG in
HNSCC cell lines. Furthermore, it was determined that PET/CT may be
used for the measurement of high sample numbers with a satisfactory
result compared with gamma spectrometry. The results also indicated
that 18F-FDG uptake can be assessed in an in vitro model via
gamma spectrometry and a clinical PET/CT system and has an
association with cetuximab and radiation treatment responses.
Supplementary Material
Supporting Data
Acknowledgements
The authors would like to thank Professor Reidar
Grenman (University of Turku, Turku, Finland) for providing the
UT-SCC cell lines.
Funding
This study was supported by The Swedish Cancer
Society (grant nos. 2010/545 and 2017/301), ALF Grants, Region
Östergötland and the Research Funds of Linköping University
Hospital.
Availability of data and materials
The datasets used and/or analyzed during the current
study are available from the corresponding author on reasonable
request.
Authors' contributions
KR and MR designed the experiment. NM, MR, EW and KR
performed the experiment. NM, EW and MR analyzed the data. NM, MR,
EW and KR wrote the manuscript. All authors read and approved the
final manuscript.
Ethics approval and consent to
participate
This study has been performed under general approval
from the Swedish Radiation Safety Authority allowing Linköping
University Hospital to handle and use radioactive substances
(approval no. Cm-016-10143 SSM 2016-4467). Collection of normal
oral tissue was approved by the Linköping University Ethical
Committee (approval no. M156-05). Signed informed consent was
obtained from all the patients.
Patient consent for publication
Not applicable.
Competing interests
The authors declare that they have no competing
interests.
References
|
1
|
Ferlay J, Soerjomataram I, Dikshit R, Eser
S, Mathers C, Rebelo M, Parkin DM, Forman D and Bray F: Cancer
incidence and mortality worldwide: Sources, methods and major
patterns in GLOBOCAN 2012. Int J Cancer. 136:E359–E386. 2015.
View Article : Google Scholar : PubMed/NCBI
|
|
2
|
Seiwert TY, Salama JK and Vokes EE: The
chemoradiation paradigm in head and neck cancer. Nat Clin Pract
Oncol. 4:156–171. 2007. View Article : Google Scholar : PubMed/NCBI
|
|
3
|
Dassonville O, Formento JL, Francoual M,
Ramaioli A, Santini J, Schneider M, Demard F and Milano G:
Expression of epidermal growth factor receptor and survival in
upper aerodigestive tract cancer. J Clin Oncol. 11:1873–1878. 1993.
View Article : Google Scholar : PubMed/NCBI
|
|
4
|
Bonner JA, Harari PM, Giralt J, Azarnia N,
Shin DM, Cohen RB, Jones CU, Sur R, Raben D, Jassem J, et al:
Radiotherapy plus cetuximab for squamous-cell carcinoma of the head
and neck. N Engl J Med. 354:567–578. 2006. View Article : Google Scholar : PubMed/NCBI
|
|
5
|
Wu W and Zhao S: Metabolic changes in
cancer: Beyond the Warburg effect. Acta Biochim Biophys Sin
(Shanghai). 45:18–26. 2013. View Article : Google Scholar : PubMed/NCBI
|
|
6
|
Yamamoto M, Inohara H and Nakagawa T:
Targeting metabolic pathways for head and neck cancers
therapeutics. Cancer Metastasis Rev. 36:503–514. 2017. View Article : Google Scholar : PubMed/NCBI
|
|
7
|
Beloueche-Babari M, Box C, Arunan V,
Parkes HG, Valenti M, De Haven Brandon A, Jackson LE, Eccles SA and
Leach MO: Acquired resistance to EGFR tyrosine kinase inhibitors
alters the metabolism of human head and neck squamous carcinoma
cells and xenograft tumours. Br J Cancer. 112:1206–1214. 2015.
View Article : Google Scholar : PubMed/NCBI
|
|
8
|
Kircher MF, Hricak H and Larson SM:
Molecular imaging for personalized cancer care. Mol Oncol.
6:182–195. 2012. View Article : Google Scholar : PubMed/NCBI
|
|
9
|
Baschnagel AM, Wobb JL, Dilworth JT,
Williams L, Eskandari M, Wu D, Pruetz BL and Wilson GD: The
association of (18)F-FDG PET and glucose metabolism biomarkers
GLUT1 and HK2 in p16 positive and negative head and neck squamous
cell carcinomas. Radiother Oncol. 117:118–124. 2015. View Article : Google Scholar : PubMed/NCBI
|
|
10
|
Carvalho KC, Cunha IW, Rocha RM, Ayala FR,
Cajaíba MM, Begnami MD, Vilela RS, Paiva GR, Andrade RG and Soares
FA: GLUT1 expression in malignant tumors and its use as an
immunodiagnostic marker. Clinics (Sao Paulo). 66:965–972. 2011.
View Article : Google Scholar : PubMed/NCBI
|
|
11
|
Kunkel M, Reichert TE, Benz P, Lehr HA,
Jeong JH, Wieand S, Bartenstein P, Wagner W and Whiteside TL:
Overexpression of Glut-1 and increased glucose metabolism in tumors
are associated with a poor prognosis in patients with oral squamous
cell carcinoma. Cancer. 97:1015–1024. 2003. View Article : Google Scholar : PubMed/NCBI
|
|
12
|
Wang YD, Li SJ and Liao JX: Inhibition of
glucose transporter 1 (GLUT1) chemosensitized head and neck cancer
cells to cisplatin. Technol Cancer Res Treat. 12:525–535. 2013.
View Article : Google Scholar : PubMed/NCBI
|
|
13
|
Jedlinski A, Ansell A, Johansson AC and
Roberg K: EGFR status and EGFR ligand expression influence the
treatment response of head and neck cancer cell lines. J Oral
Pathol Med. 42:26–36. 2013. View Article : Google Scholar : PubMed/NCBI
|
|
14
|
Jerhammar F, Johansson AC, Ceder R,
Welander J, Jansson A, Grafström RC, Söderkvist P and Roberg K:
YAP1 is a potential biomarker for cetuximab resistance in head and
neck cancer. Oral Oncol. 50:832–839. 2014. View Article : Google Scholar : PubMed/NCBI
|
|
15
|
Roberg K, Ceder R, Farnebo L,
Norberg-Spaak L and Grafstrom RC: Multiple genotypic aberrances
associate to terminal differentiation-deficiency of an oral
squamous cell carcinoma in serum-free culture. Differentiation.
76:868–880. 2008. View Article : Google Scholar : PubMed/NCBI
|
|
16
|
Leutenegger CM, Mislin CN, Sigrist B,
Ehrengruber MU, Hofmann-Lehmann R and Lutz H: Quantitative
real-time PCR for the measurement of feline cytokine mRNA. Vet
Immunol Immunopathol. 71:291–305. 1999. View Article : Google Scholar : PubMed/NCBI
|
|
17
|
Jedlinski A, Garvin S, Johansson AC,
Edqvist PH, Ponten F and Roberg K: Cetuximab sensitivity of head
and neck squamous cell carcinoma xenografts is associated with
treatment-induced reduction in EGFR, pEGFR, and pSrc. J Oral Pathol
Med. 46:717–724. 2017. View Article : Google Scholar : PubMed/NCBI
|
|
18
|
Hentschel M, Paulus T, Mix M, Moser E,
Nitzsche EU and Brink I: Analysis of blood flow and glucose
metabolism in mammary carcinomas and normal breast: A H2(15)O PET
and 18F-FDG PET study. Nucl Med Commun. 28:789–797. 2007.
View Article : Google Scholar : PubMed/NCBI
|
|
19
|
Machtay M, Natwa M, Andrel J, Hyslop T,
Anne PR, Lavarino J, Intenzo CM and Keane W: Pretreatment FDG-PET
standardized uptake value as a prognostic factor for outcome in
head and neck cancer. Head Neck. 31:195–201. 2009. View Article : Google Scholar : PubMed/NCBI
|
|
20
|
Orabi H, Al-Shareaif A and El Galefi M:
Gamma-ray measurements of naturally occurring radioactive sample
from Alkharje City. J Radioanal Nucl Chem. 269:99–102. 2006.
View Article : Google Scholar
|
|
21
|
Behzadi A, Ung Y, Lowe V and Deschamps C:
The role of positron emission tomography in the management of
non-small cell lung cancer. Can J Surg. 52:235–242. 2009.PubMed/NCBI
|
|
22
|
Gould MK, Maclean CC, Kuschner WG, Rydzak
CE and Owens DK: Accuracy of positron emission tomography for
diagnosis of pulmonary nodules and mass lesions: A meta-analysis.
JAMA. 285:914–924. 2001. View Article : Google Scholar : PubMed/NCBI
|
|
23
|
Zhao K, Yang SY, Zhou SH, Dong MJ, Bao YY
and Yao HT: Fluorodeoxyglucose uptake in laryngeal carcinoma is
associated with the expression of glucose transporter-1 and
hypoxia-inducible-factor-1α and the phosphoinositide
3-kinase/protein kinase B pathway. Oncol Lett. 7:984–990. 2014.
View Article : Google Scholar : PubMed/NCBI
|
|
24
|
Yamada T, Uchida M, Kwang-Lee K, Kitamura
N, Yoshimura T, Sasabe E and Yamamoto T: Correlation of
metabolism/hypoxia markers and fluorodeoxyglucose uptake in oral
squamous cell carcinomas. Oral Surg Oral Med Oral Pathol Oral
Radiol. 113:464–471. 2012. View Article : Google Scholar : PubMed/NCBI
|
|
25
|
Mason NS, Lopresti BJ, Ruszkiewicz J, Dong
X, Joyce S, Leef G, Sen M, Wahed AS, Mathis CA, Grandis JR and
Thomas SM: Utility of 3′-[(18)F]fluoro-3′-deoxythymidine as a PET
tracer to monitor response to gene therapy in a xenograft model of
head and neck carcinoma. Am J Nucl Med Mol Imaging. 3:16–31.
2013.PubMed/NCBI
|
|
26
|
Miyawaki A, Ikeda R, Hijioka H, Ishida T,
Ushiyama M, Nozoe E and Nakamura N: SUVmax of FDG-PET correlates
with the effects of neoadjuvant chemoradiotherapy for oral squamous
cell carcinoma. Oncol Rep. 23:1205–1212. 2010. View Article : Google Scholar : PubMed/NCBI
|
|
27
|
Shen LF, Zhao X, Zhou SH, Lu ZJ, Zhao K,
Fan J and Zhou ML: In vivo evaluation of the effects of
simultaneous inhibition of GLUT-1 and HIF-1alpha by antisense
oligodeoxynucleotides on the radiosensitivity of laryngeal
carcinoma using micro 18F-FDG PET/CT. Oncotarget. 8:34709–34726.
2017.PubMed/NCBI
|
|
28
|
Starska K, Forma E, Jozwiak P, Bryś M,
Lewy-Trenda I, Brzezińska-Błaszczyk E and Krześlak A: Gene and
protein expression of glucose transporter 1 and glucose transporter
3 in human laryngeal cancer-the relationship with regulatory
hypoxia-inducible factor-1α expression, tumor invasiveness, and
patient prognosis. Tumour Biol. 36:2309–2321. 2015. View Article : Google Scholar : PubMed/NCBI
|
|
29
|
Wiechec E, Hansson KT, Alexandersson L,
Jonsson JI and Roberg K: Hypoxia mediates differential response to
anti-EGFR therapy in HNSCC cells. Int J Mol Sci. 18:E9432017.
View Article : Google Scholar : PubMed/NCBI
|
|
30
|
Ben-Haim S and Ell P: 18F-FDG PET and
PET/CT in the evaluation of cancer treatment response. J Nucl Med.
50:88–99. 2009. View Article : Google Scholar : PubMed/NCBI
|