Introduction
Colorectal cancer (CRC) is the third most common
type of cancer, and the fourth leading cause of cancer
associated-mortality in the world, with 1.8 million new cases
diagnosed and 881,000 deaths in 2018 (1,2). Since
surgical techniques and chemotherapy regimen have been improved,
and molecular targets have been determined, attention has focused
on early detection of CRC, which led to an increase in survival
time of patients with CRC (3,4).
However, the 5-year overall survival (OS) rate of patients with CRC
is still unsatisfactory, particularly for patients with advanced
CRC (5). In China, CRC is the third
most frequent type of cancer and the fourth leading cause of
cancer-associated mortality (6). In
order to precisely predict the prognosis of patients with CRC, it
is crucial to identify novel molecular prognostic biomarkers.
Many lifestyle factors have been investigated, with
imbalanced diet, tobacco use, alcohol consumption, lack of physical
activity, obesity and sleep deprivation being considered as the
risk factors in the progression of CRC (7). Heredity, epigenetic, somatic cell and
endocrine aberration seem to play significant roles in CRC
(8). Increasing evidence has
suggested that multiple genes and cellular signaling pathways serve
important roles in the pathogenesis of CRC (9,10).
Diagnostic and prognostic signatures, for example BRAF, RAS and
MSI, can monitor the response to therapy in patients with CRC
(11). Therefore, it is critical to
identify novel biomarkers with high sensitivity and specificity in
order to allow the early detection of CRC and to choose the best
treatment option for patients with CRC. Microarray analysis has
been considered as a promising tool in cancer research and may have
important clinical applications, including in diagnosis, cancer
classification, prognosis prediction and detection of therapeutic
targets (12–14). In the last decade, microarray
technology has been used to study the gene expression profiles of
CRC, which has led to the identification of thousands of
differentially expressed genes (DEGs) (15). However, DEGs identified in one study
might not be detected in another study. In addition, interactions
among DEGs and their prognostic values remain unknown.
The present study aimed to determine potential novel
prognosis biomarkers for CRC. Three microarray datasets obtained
from the Gene Expression Omnibus (GEO) database were analyzed in
order to further identify the DEGs in CRC, by comparing their
expression levels between CRC and normal samples. Subsequently, a
protein-protein interaction (PPI) network was constructed, from
which modules were extracted, and functional and pathway analyses
were performed to further analyze the roles of the CRC-associated
DEGs. To verify the prognostic roles of DEGs in CRC, the CRC
dataset from The Cancer Genome Atlas (TCGA) was used to perform
survival analysis based on the sample splitting method and Cox
regression model. The key genes that were identified may be used to
characterize the survival of CRC, and may serve as potential
therapeutic targets and prognostic biomarkers.
Materials and methods
Microarray datasets
The GEO database (http://www.ncbi.nlm.nih.gov/geo) is a public
functional genomics data repository that contains multifaceted
data, including data derived from microarray and next-generation
sequencing. GEO database was searched using the following key
words: (‘colorectal neoplasms’[MeSH Terms] OR colorectal cancer
[All Fields])) AND ‘Homo sapiens’[porgn] AND (‘gse’[Filter] AND
‘Expression profiling by array’[Filter] AND ‘attribute name
tissue’[Filter] AND (‘60’[n_samples] : ‘3000’[n_samples])) AND
(‘gse’[Filter] AND ‘Expression profiling by array’[Filter] AND
‘attribute name tissue’[Filter] AND (‘60’[n_samples]:
‘3000’[n_samples])). Following systematic review based on the key
words, a total of 77 datasets were identified for further analysis.
The selection criteria for these datasets were as follows: i)
Included datasets must include paired CRC and normal control
tissues; ii) sample size of each group must be >30; and iii)
adequate clinical information must be available to perform the
analysis. According to the selection criteria, three gene
expression profiles were collected, including GSE20916 (16), GSE73360 (17) and GSE44861 (18). The microarray data of GSE20916,
GSE73360 and GSE44861 were downloaded from the GEO database.
GSE20916 was based on the Affymetrix GPL570 platform (Human Genome
U133 Plus 2.0 Array), GSE73360 was based on the Affymetrix GPL17586
platform (Human Transcriptome Array 2.0) and GSE44861 was based on
Affymetrix GPL3921 platform (Human Genome U133A Array). The
GSE20916 dataset included 101 CRC tissue samples and 44 normal
samples. Expression data from the GSE73360 dataset included 55 CRC
samples and 37 normal samples. Microarray data from the GSE44861
dataset included 56 CRC samples and 55 normal samples.
Data pre-processing and identification
of DEGs in CRC
The Series Matrix File(s) of GSE20916, GSE73360 and
GSE44861 were downloaded from the GEO database. Prior to analysis,
the probes in each dataset were transformed into standard gene
symbols. Normalization of the three datasets was implemented based
on robust multi-array average in the R software, version 2.6.0
(www.R-project.org/) (19), and normalization was separately
conducted in each gene expression dataset.
The BRB-ArrayTools package (v4.6.0 Beta 1;
http://brb.nci.nih.gov/BRB-ArrayTools/download.html)
is an integrated software for the visualization and statistical
analysis of microarray gene-expression data, gene-methylation data
and RNA-sequencing data (20). In
the present study, DEGs from each dataset were identified using
BRB-ArrayTools software. A P-value <0.01 and |log fold change|
>1 were set as the cut-off criteria. A heatmap and Volcano Plot
of the DEGs from each dataset were subsequently generated using
BRB-ArrayTools. The Venn diagram illustrating the intersection of
these DEGs among the three microarray profiles was visualized using
FunRich_V3.1.3 software (http://www.funrich.org).
PPI network construction and module
analysis
The Search Tool for the Retrieval of Interacting
Genes (STRING; http://string-db.org) database is an
online software that is used to analyze PPI information, and to
present the interactions with a combine-score (21). In the present study, DEGs with a
confidence score >0.4 were extracted, and the PPI network of
these DEGs was subsequently constructed and visualized using
Cytoscape software (version 3.5.1; http://www.cytoscape.org) (22). Edge width was determined according to
the combined score of the PPI relationship. Since the networks were
scale-free, the biological importance of genes associated with
degree centrality was described to improve the understanding of the
functionality of these complicated networks. The degree is
determined as the number of links between a node and its adjacent
nodes (23). In the current study,
hub genes were defined as the nodes with a degree >10, and were
extracted.
The analysis of modules was conducted on the PPI
network by using MCODE version 2.2 (https://dspace.mit.edu/handle/1721.1/75242) according
to the following parameters: Node score cut-off=0.2, k-core=2 and
max. Depth=100 (24).
Functional and pathway enrichment
analysis
Gene Ontology (GO) (25) analysis has become a common method
used for functional studies of large-scale transcriptomic data and
analysis of genomic data. Kyoto Encyclopedia of Genes and Genomes
(KEGG; http://www.genome.jp/kegg/pathway) is a reference
database for systematic analysis of gene functions (26). The Database for Annotation
Visualization and Integrated Discovery (DAVID; http://david.ncifcrf.gov) is a tool used to
systematically detect biological significance in large lists of
genes or proteins (27). In the
present study, the GO function and KEGG pathway enrichment analysis
of identified DEGs and the genes in the significant modules were
performed using DAVID. Terms with a P-value <0.001 were
considered statistically significant.
Pathway crosstalk analysis
Enrichment map is a network-based method for
gene-set enrichment visualization and interpretation (28). In order to extract the interactions
between significantly enriched signaling pathways, pathway
crosstalk analysis was performed using the EnrichmentMap tool
(http://www.baderlab.org/Software/EnrichmentMap).
Benjamini-Hochberg adjusted P-value <0.05 and the Jaccard
Coefficient (50%) + Overlap Coefficient (50%) >0.5 were
considered as the thresholds. The Jaccard Coefficient, and Overlap
Coefficient are two indexes to examine the similarity between
sample sets.
Survival analysis of hub genes
The Human Protein Atlas (http://www.proteinatlas.org) is an online database
that contains clinical data of 597 patients with CRC, which were
from the TCGA database (https://tcga-data.nci.nih.gov/tcga/). The present
study aimed to investigate the impact of the expression levels of
the identified hub genes on the OS of patients with CRC.
Kaplan-Meier survival analysis was carried out by using the Human
Protein Atlas database. The survival rates of patients with CRC
according to the expression level of each hub gene were compared.
Briefly, according to the Fragments Per Kilobase Million (FPKM)
value of each hub gene, patients with CRC were classified into a
high or low expression group based on the best expression cut-off
value, which is the FPKM value that yields maximal difference by
survival analysis between the two groups at the smallest log-rank
P-value. Kaplan-Meier survival curves were plotted, and the
log-rank test was applied to compare the survival rates between the
high and low expression groups. P<0.001 was set as the cut-off
criterion. Univariate and multivariate Cox models were subsequently
used to investigate the prognostic value of OS-associated hub
genes. P<0.01 was considered to indicate statistical
significance.
Correlation between hub genes
The correlation between the hub genes that were
associated with CRC was evaluated using Spearman's correlation
analysis. Spearman's correlation coefficients range between −1 and
1, with −1, 0 and 1 indicating negative, no and positive
correlation, respectively. In addition, the threshold for gene
correlation was set as Spearman's correlation coefficient
(|R|<0.3) and P<0.05.
Results
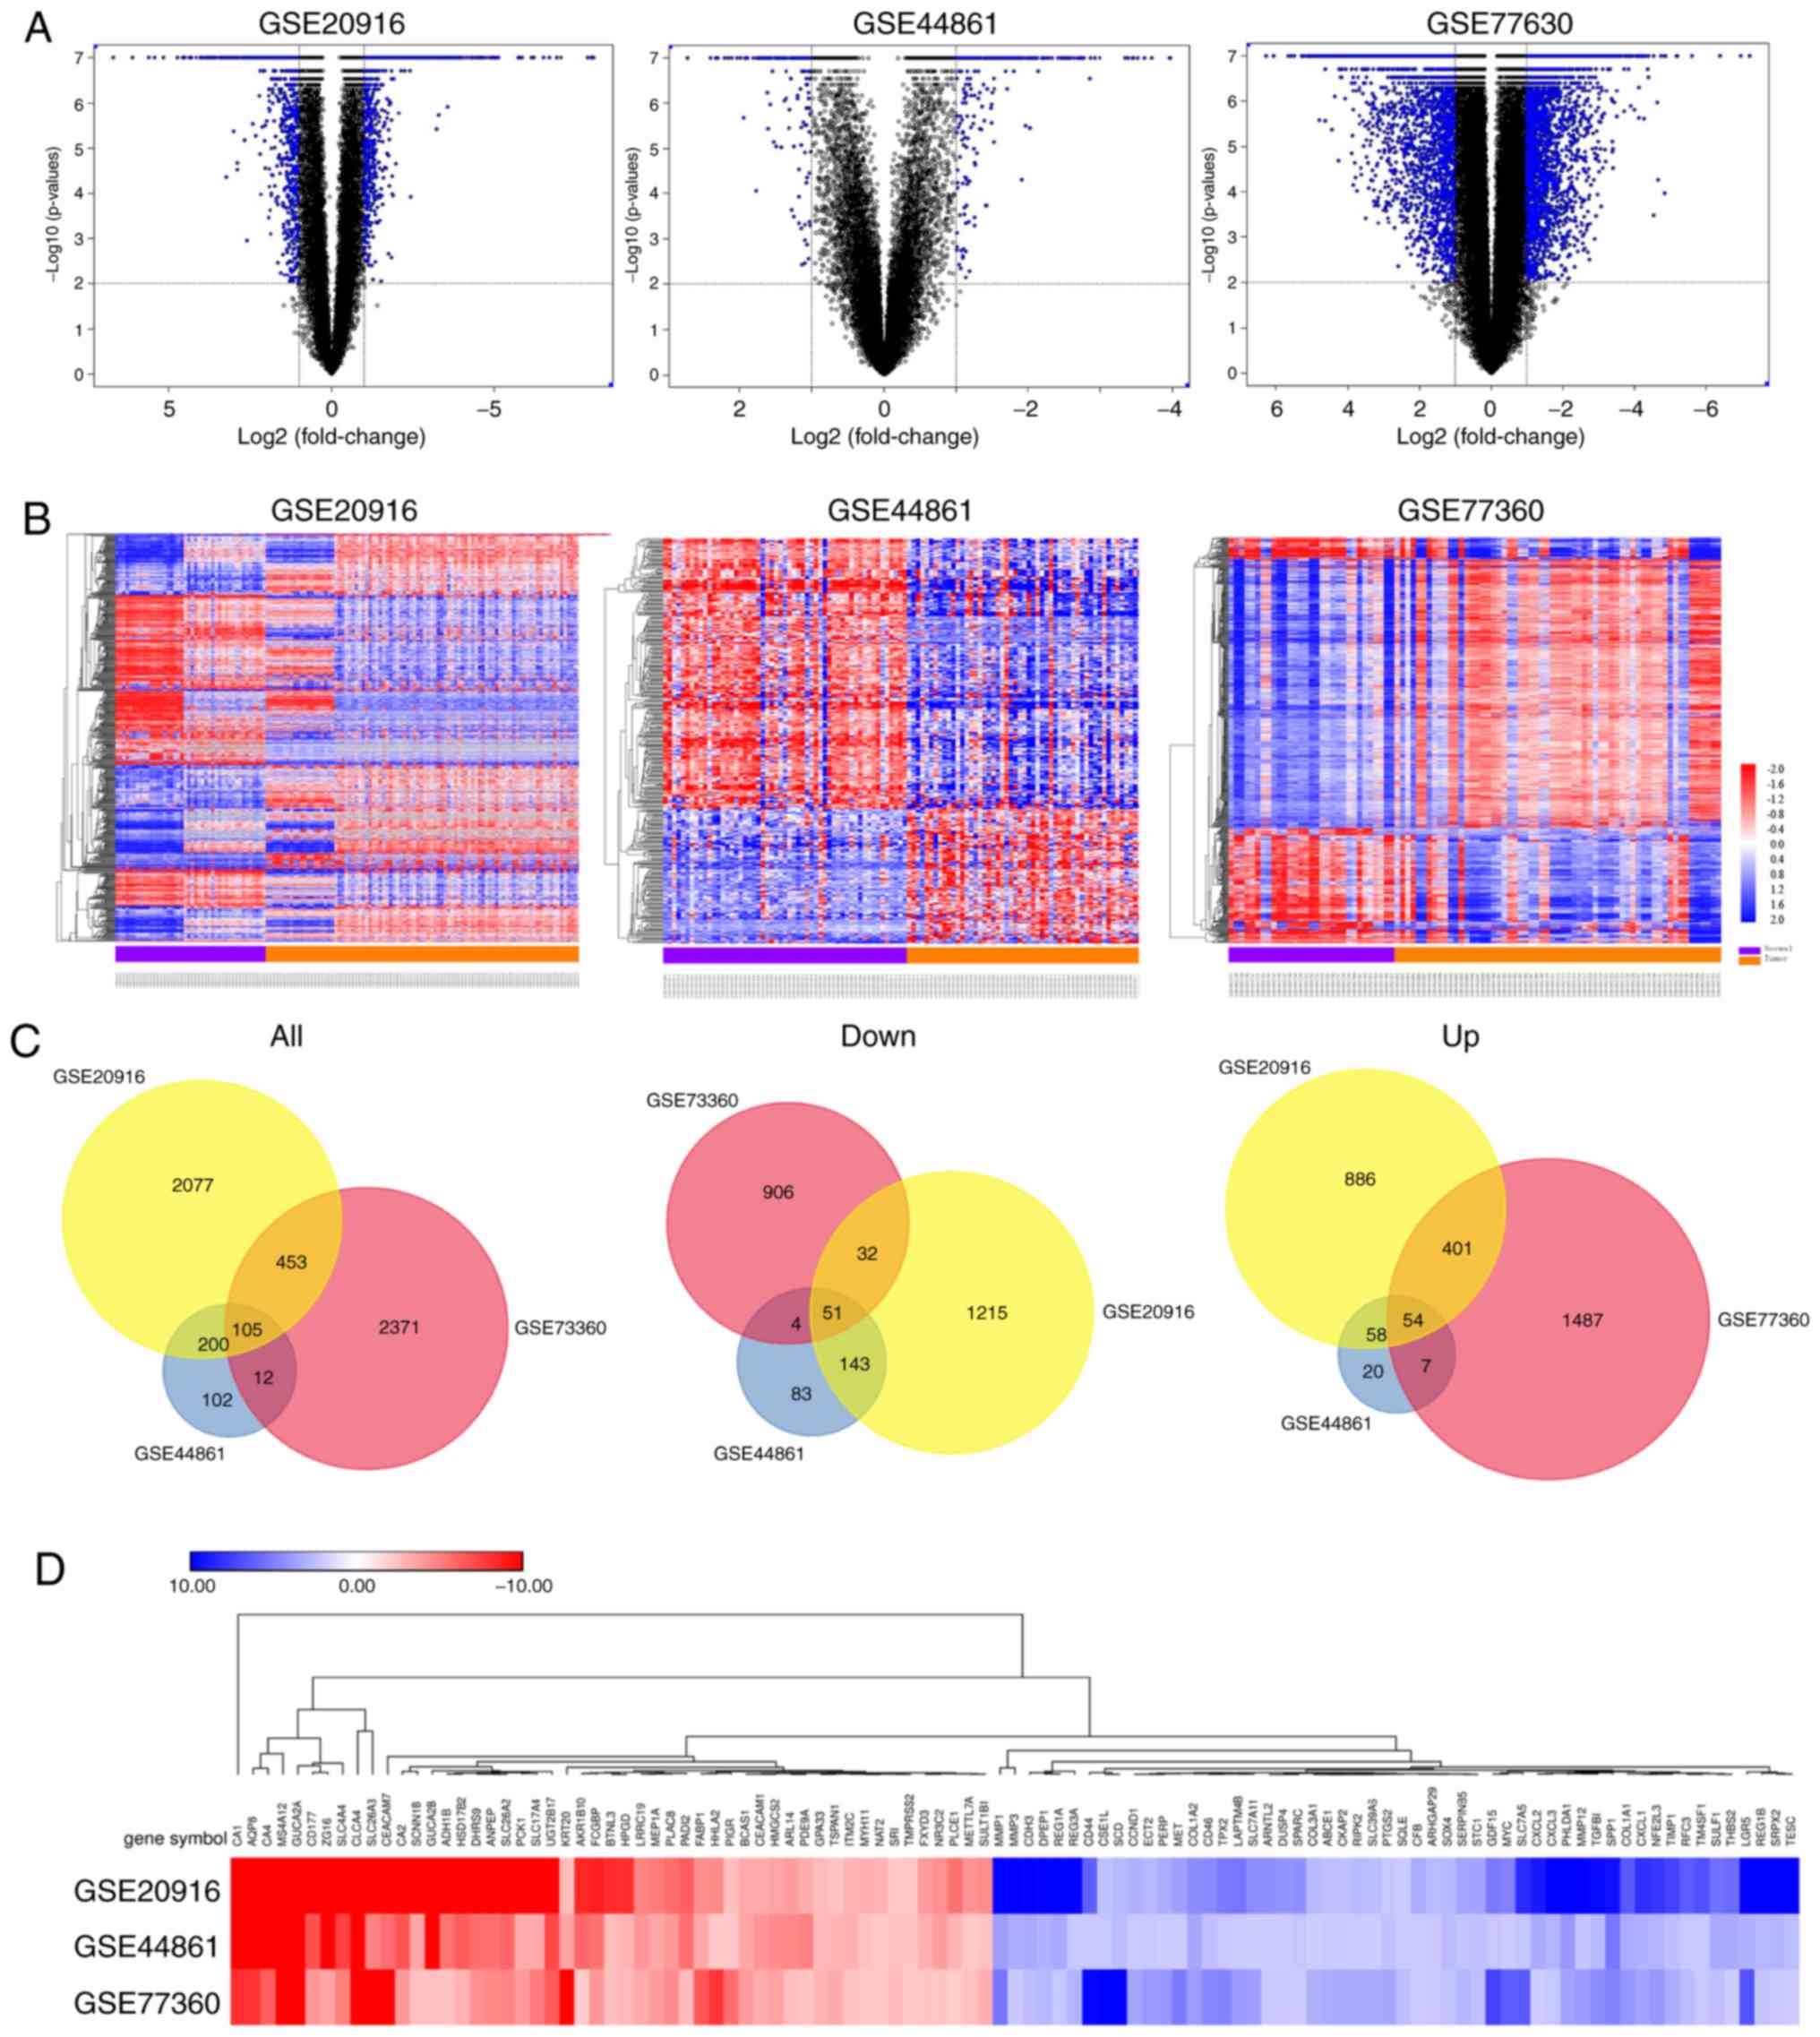
Identification of DEGs
A total of 2,836, 2,942 and 420 DEGs were identified
from the GSE20916, GSE73360 and GSE44861 datasets, respectively.
Volcano plots showing the distribution of these DEGs in the three
datasets were created (Fig. 1A). The
results from cluster heat maps (Fig.
1B) identified distinctive patterns in CRC and normal samples.
Subsequently, the intersection of these DEGs from the three
microarray profiles was identified using FunRich_V3 software. A
total of 105 mutual DEGs were identified in CRC tissues among the
three datasets compared with normal colorectal tissues (Fig. 1C), including 51 down-regulated and 54
up-regulated genes. Fig. 1D shows
the expression pattern of the common up-regulated and
down-regulated DEGs from the expression data of the GSE20916,
GSE44861 and GSE73360 datasets.
Functional and pathway enrichment
analysis
In order to comprehensively understand the
biological roles of these DEGs in CRC, DAVID was used to determine
the GO functions and pathways in which they were involved (Table I). The down-regulated DEGs were
significantly enriched in the biological processes ‘bicarbonate
transport’, and ‘regulation of intracellular pH’, and in the
cellular components ‘extracellular exosome’ and ‘integral component
of plasma membrane’. Furthermore, down-regulated DEGs were enriched
in the molecular functions ‘chloride channel activity’ and
‘carbonate dehydratase activity’. The up-regulated DEGs were
significantly enriched in the biological processes ‘cell
proliferation’, ‘collagen catabolic process’, ‘extracellular matrix
organization’, ‘extracellular matrix disassembly’, and ‘leukocyte
migration’ in certain cellular components, including ‘extracellular
space’, ‘extracellular region’, ‘proteinaceous extracellular
matrix’, ‘collagen trimer’ and ‘cell surface’, and in the molecular
functions ‘CXCR chemokine receptor binding’, ‘platelet-derived
growth factor binding’ and ‘endopeptidase activity’.
 | Table I.GO analysis of differentially
expressed genes in colorectal cancer tissues. |
Table I.
GO analysis of differentially
expressed genes in colorectal cancer tissues.
| A,
Downregulated |
|---|
|
|---|
| Category | Term | Count, n | Percentage | P-value |
|---|
|
GOTERM_BP_DIRECT | GO:0015701
‘bicarbonate transport’ | 6 | 9.17 |
1.10×10⁻⁷ |
|
| GO:0051453
‘regulation of intracellular pH’ | 4 | 6.11 |
1.21×10⁻⁴ |
|
GOTERM_CC_DIRECT | GO:0070062
‘extracellular exosome’ | 29 | 44.32 |
2.28×10⁻¹¹ |
|
| GO:0005887
‘integral component of plasma membrane’ | 15 | 22.95 |
1.38×10⁻⁵ |
|
GOTERM_MF_DIRECT | GO:0005254
‘chloride channel activity’ | 4 | 6.11 |
4.54×10⁻⁴ |
|
| GO:0004089
‘carbonate dehydratase activity’ | 3 | 4.59 |
6.76×10⁻⁴ |
|
| B,
Upregulated |
|
|
Category | Term | Count,
n |
Percentage | P-value |
|
|
GOTERM_BP_DIRECT | GO:0030574
‘collagen catabolic process’ | 6 | 7.70 |
1.55×10⁻⁶ |
|
| GO:0030198
‘extracellular matrix organization’ | 8 | 10.26 |
2.27×10⁻⁶ |
|
| GO:0022617
‘extracellular matrix disassembly’ | 6 | 7.70 |
3.66×10⁻⁶ |
|
| GO:0050900
‘leukocyte migration’ | 6 | 7.70 |
3.69×10⁻⁵ |
|
| GO:0008283 ‘cell
proliferation’ | 8 | 10.26 |
1.27×10⁻⁴ |
|
GOTERM_CC_DIRECT | GO:0005615
‘extracellular space’ | 19 | 24.38 |
2.07×10⁻⁸ |
|
| GO:0005576
‘extracellular region’ | 17 | 21.81 |
8.07×10⁻⁶ |
|
| GO:0005578
‘proteinaceous extracellular matrix’ | 7 | 9.00 |
1.23×10⁻⁴ |
|
| GO:0005581
‘collagen trimer’ | 5 | 6.42 |
1.47×10⁻⁴ |
|
| GO:0009986 ‘cell
surface’ | 8 | 10.26 |
9.33×10⁻⁴ |
|
GOTERM_MF_DIRECT | GO:0045236 ‘CXCR
chemokine receptor binding’ | 3 | 3.85 |
3.05×10⁻⁴ |
|
| GO:0048407
‘platelet-derived growth factor binding’ | 3 | 3.85 |
4.65×10⁻⁴ |
|
| GO:0004175
‘endopeptidase activity’ | 4 | 5.13 |
5.45×10⁻⁴ |
The 20 significant pathways which the up- and
down-regulated DEGs were involved in are presented in Table II. The results demonstrated that
down-regulated DEGs were significantly enriched in the pathways
‘proximal tubule bicarbonate reclamation’ and ‘nitrogen
metabolism’, whereas up-regulated DEGs were enriched in
‘ECM-receptor interaction’, ‘focal adhesion’, ‘PI3K-Akt signaling
pathway’ and ‘TNF signaling pathway’.
| Table II.Kyoto Encyclopedia of Genes and
Genomes pathway analysis of differentially expressed genes in
colorectal cancer tissues. |
Table II.
Kyoto Encyclopedia of Genes and
Genomes pathway analysis of differentially expressed genes in
colorectal cancer tissues.
| A,
Downregulated |
|---|
|
|---|
| Term | Count, n | Percentage | P-value | Genes |
|---|
| hsa04964: Proximal
tubule bicarbonate reclamation | 4 | 6.11 |
7.06×10⁻⁵ | CA4, CA2, SLC4A4,
PCK1 |
| hsa00910: Nitrogen
metabolism | 3 | 8.25 |
5.12×10⁻⁴ | CA2, CLCA4,
SLC4A4 |
|
| B,
Upregulated |
|
| Term | Count,
n |
Percentage | P-value | Genes |
|
| hsa04512:
ECM-receptor interaction | 6 | 7.70 |
1.83×10⁻⁵ | CD44, COL3A1,
COL1A2, COL1A1, THBS2, SPP1 |
| hsa04510: Focal
adhesion | 7 | 9.00 |
1.14×10⁻⁴ | CCND1, COL3A1, MET,
COL1A2, COL1A1, THBS2, SPP1 |
| hsa04151: PI3K-Akt
signaling pathway | 8 | 10.26 |
2.71×10⁻⁴ | CCND1, COL3A1, MET,
COL1A2, COL1A1, THBS2, MYC, SPP1 |
| hsa04668: TNF
signaling pathway | 5 | 6.42 |
7.00×10⁻⁴ | CXCL1, PTGS2,
CXCL3, CXCL2, MMP3 |
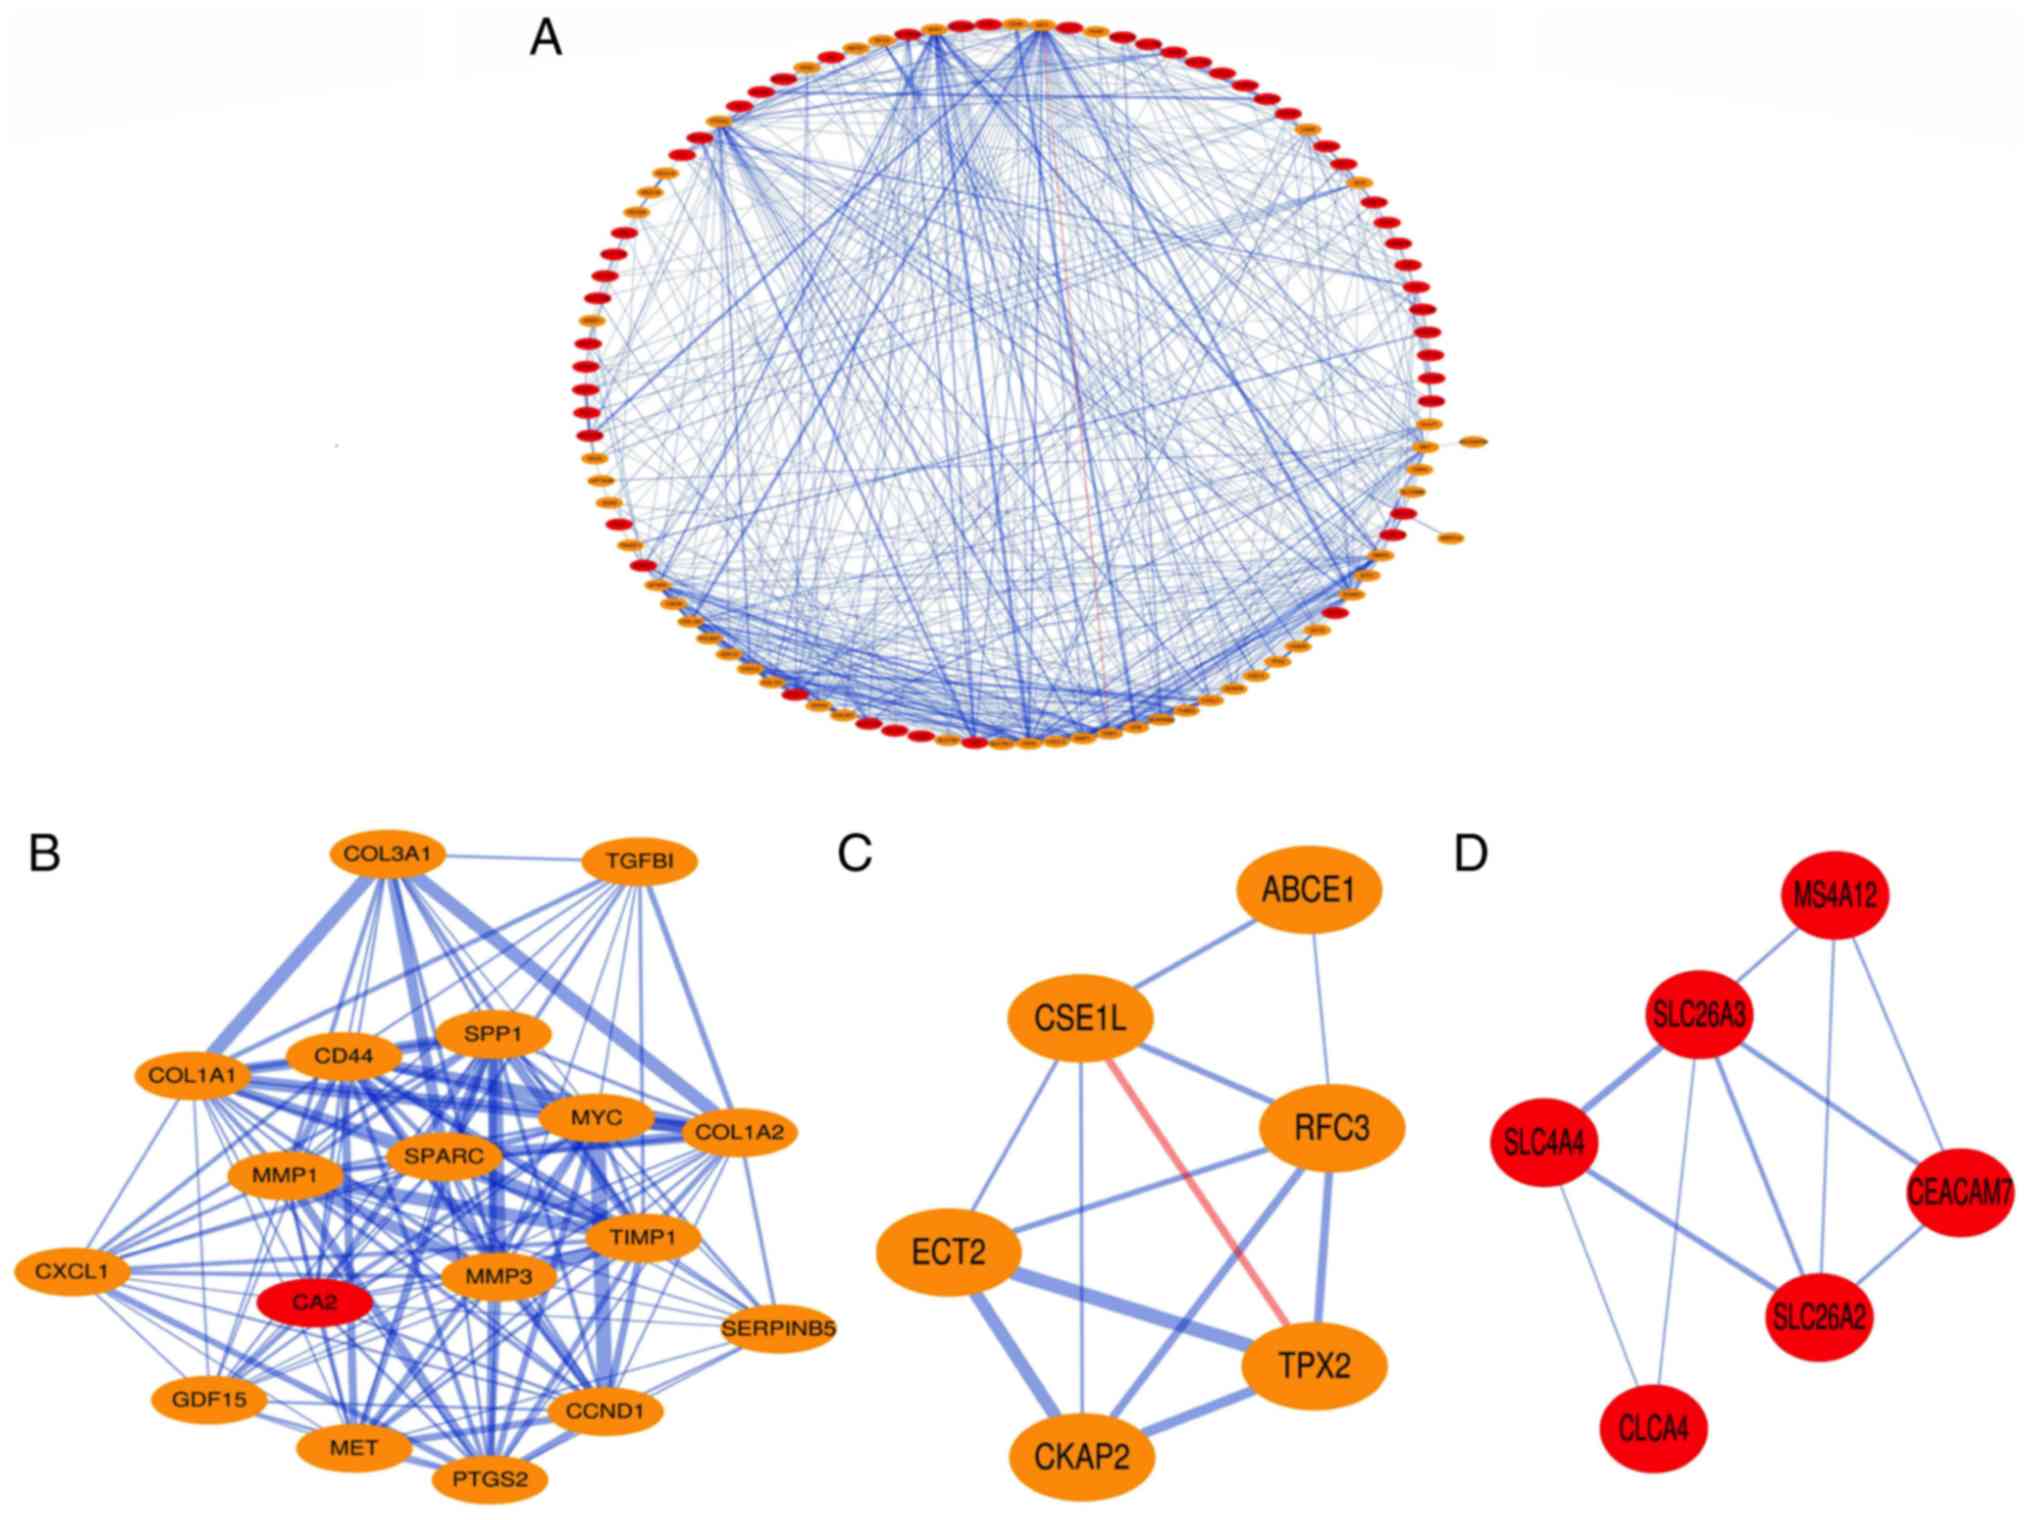
PPI network construction and module
analysis
The PPIs of the DEGs were obtained using STRING with
a confidence score>0.4, and the PPI network of these DEGs was
visualized using Cytoscape. The results demonstrated that the PPI
network covered 100 nodes and 551 edges, including 49
down-regulated genes and 51 up-regulated genes (Fig. 2A). Subsequently, hub nodes in the PPI
network with a connectivity degree >10 were selected. A total of
44 genes were identified as hub genes. Among these hub genes, 17
were down-regulated [transmembrane serine protease 2, sorcin,
solute carrier family 4 member 4 (SLC4A4), solute carrier family 26
member 3, nuclear receptor subfamily 3 group C member 2, myosin
heavy chain 11, keratin 20, 15-hydroxyprostaglandin dehydrogenase,
guanylate cyclase activator 2A, fatty acid binding protein 1, CEA
cell adhesion molecule 7, carbonic anhydrase 4, carbonic anhydrase
2, carbonic anhydrase 1, ADP ribosylation factor like GTPase 14,
alanyl aminopeptidase, membrane and aldo-keto reductase family 1
member B10 (AKR1B10)] and 27 were up-regulated [TIMP
metallopeptidase inhibitor 1 (TIMP1), thrombospondin 2,
transforming growth factor β induced, stanniocalcin 1, secreted
phosphoprotein 1, secreted protein acidic and cysteine rich, serpin
family B member 5, stearoyl-CoA desaturase, receptor interacting
serine/threonine kinase 2, regenerating family member 3α,
prostaglandin-endoperoxide synthase 2, MYC proto-oncogene, bHLH
transcription factor, matrix metallopeptidase 3, matrix
metallopeptidase 1, MET proto-oncogene, receptor tyrosine kinase,
leucine rich repeat containing G protein-coupled receptor 5, growth
differentiation factor 15, dual specificity phosphatase 4, C-X-C
motif chemokine ligand 2, C-X-C motif chemokine ligand 1, collagen
type III α1 chain, collagen type I α2 chain, collagen type I α1
chain, complement factor B, CD44 molecule (Indian blood group),
cyclin D1 and ATP binding cassette subfamily E member 1
(ABCE1)].
Three significant modules with a node score
cut-off=0.2, k-core=2, and max. Depth=100 were extracted from the
PPI network. A total of 18 nodes and 136 edges were included in
Module 1 (Fig. 2B). There were six
nodes and 12 edges in Module 2 (Fig.
2C), and Module 3 contained six nodes and 10 edges (Fig. 2D). The up-regulated hub gene TIMP1
was included in Module 1, the up-regulated ABCE1 gene was involved
in Module 2 and the down-regulated SLC4A4 was present in Module
3.
Module 1 was enriched in eight GO terms, including
‘extracellular matrix organization’, ‘extracellular space’ and
‘platelet-derived growth factor binding’. Module 2 was enriched in
two GO terms; ‘ATPase activity’ and ‘protein binding’. Module 3 was
enriched in the four terms ‘regulation of intracellular pH’,
‘bicarbonate transport’, ‘chloride transmembrane transport’ and
‘chloride channel activity’ (Table
III).
| Table III.GO analysis of the genes of each
module in colorectal cancer tissues. |
Table III.
GO analysis of the genes of each
module in colorectal cancer tissues.
| A, Module 1 |
|---|
|
|---|
| Category | Term | Count, n | Percentage | P-value |
|---|
|
GOTERM_BP_DIRECT | GO:0030198
‘extracellular matrix organization’ | 8 | 44.44 |
4.67×10⁻¹⁰ |
|
| GO:0030574
‘collagen catabolic process’ | 5 | 27.78 |
4.40×10⁻⁷ |
|
| GO:0022617
‘extracellular matrix disassembly’ | 5 | 22.78 |
8.82×10⁻⁷ |
|
| GO:0032355
‘response to estradiol’ | 4 | 22.22 |
9.91×10⁻⁵ |
|
GOTERM_CC_DIRECT | GO:0005615
‘extracellular space’ | 12 | 66.67 |
2.28×10⁻¹¹ |
|
| GO:0005576
‘extracellular region’ | 12 | 66.67 |
1.38×10⁻⁵ |
|
GOTERM_MF_DIRECT | GO:0048407
‘platelet-derived growth factor binding’ | 3 | 16.67 |
5.22×10⁻⁵ |
|
| GO:0050840
‘extracellular matrix binding’ | 3 | 16.67 |
3.06×10⁻⁴ |
|
| B, Module
2 |
|
|
Category | Term | Count,
n |
Percentage | P-value |
|
|
GOTERM_MF_DIRECT | GO:0016887 ‘ATPase
activity’ | 2 | 33.33 |
3.05×10⁻⁴ |
|
| GO:0005515 ‘protein
binding’ | 5 | 83.33 |
4.65×10⁻⁴ |
|
| C, Module
3 |
|
|
Category | Term | Count,
n |
Percentage | P-value |
|
|
GOTERM_BP_DIRECT | GO:0051453
‘regulation of intracellular pH’ | 3 | 50 |
1.34×10⁻⁵ |
|
| GO:0015701
‘bicarbonate transport’ | 3 | 50 |
2.01×10⁻⁵ |
|
| GO:1902476
‘chloride transmembrane transport’ | 3 | 50 |
9.07×10⁻⁵ |
|
GOTERM_MF_DIRECT | GO:0005254
‘chloride channel activity’ | 3 | 50 |
6.00×10⁻⁵ |
In addition, the results from KEGG pathway
enrichment analysis demonstrated that genes in Module 1 were
significantly involved in the four pathways ‘ECM-receptor
interaction’, ‘PI3K-Akt signaling pathway’, ‘focal adhesion’ and
‘miRNAs in cancer’. The genes in Module 3 were significantly
enriched in the ‘pancreatic secretion’ pathway (Table IV).
| Table IV.Kyoto Encyclopedia of Genes and
Genomes pathway analysis of the genes of each module in colorectal
cancer tissues. |
Table IV.
Kyoto Encyclopedia of Genes and
Genomes pathway analysis of the genes of each module in colorectal
cancer tissues.
| A, Module 1 |
|---|
|
|---|
| Term | Count, n | Percentage | P-value | Genes |
|---|
| hsa04512:
ECM-receptor interaction | 5 | 27.78 |
2.13×10⁻⁵ | CD44, COL3A1,
COL1A2, COL1A1, SPP1 |
| hsa04151: PI3K-Akt
signaling pathway | 7 | 38.89 |
3.17×10⁻⁵ | CCND1, COL3A1, MET,
COL1A2, COL1A1, MYC, SPP1 |
| hsa04510: Focal
adhesion | 6 | 33.33 |
3.61×10⁻⁵ | CCND1, COL3A1, MET,
COL1A2, COL1A1, SPP1 |
| hsa05206: MicroRNAs
in cancer | 3 | 33.33 |
1.70×10⁻⁴ | CCND1, CD44, PTGS2,
SERPINB5, MET, MYC |
|
| B, Module
3 |
|
| Term | Count,
n |
Percentage | P-value | Genes |
|
| hsa04972:
Pancreatic secretion | 3 | 50 |
1.79×10⁻⁴ | SLC26A3, CLCA4,
SLC4A4 |
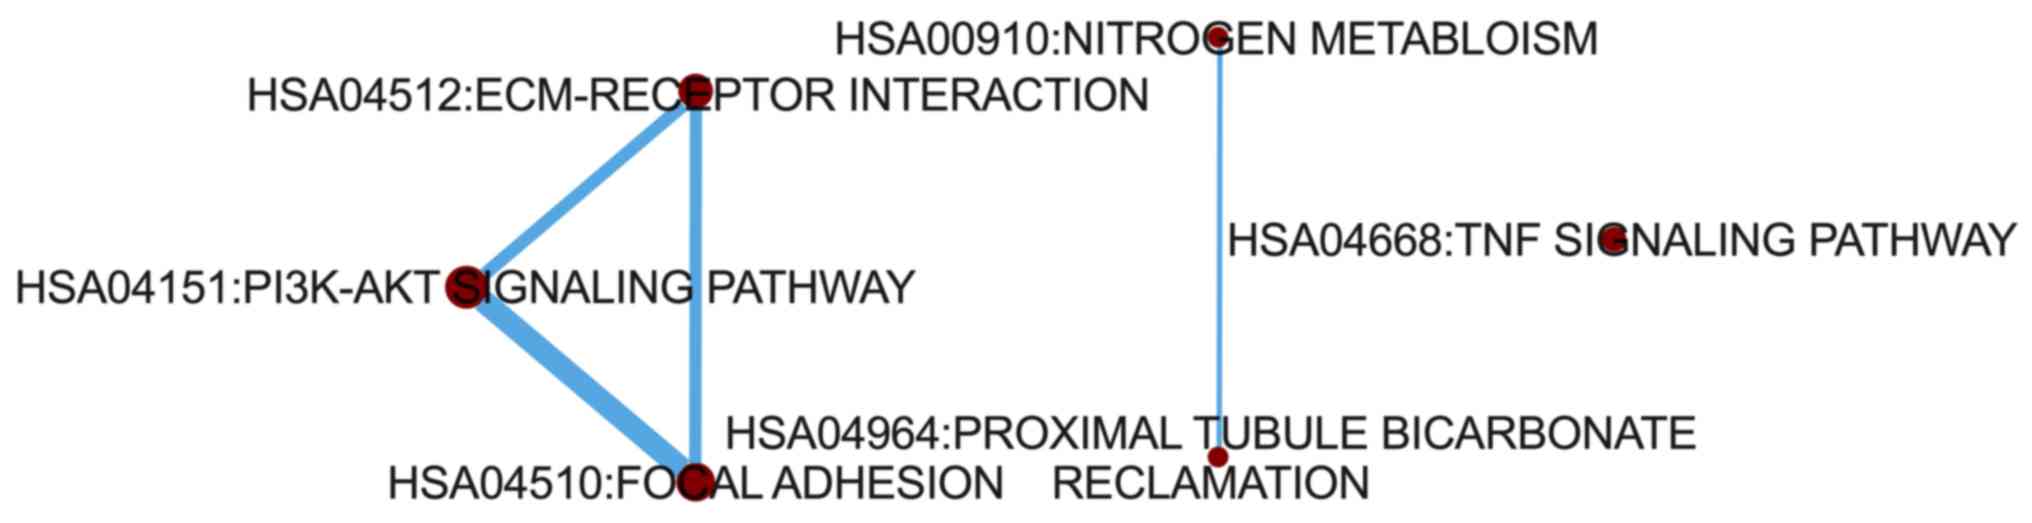
Pathway crosstalk analysis
To determine how the 20 significant pathways
interacted with each other, a pathway crosstalk analysis was
conducted. The results demonstrated that a cross talk existed among
‘PI3K-Akt signaling pathway’, ‘focal adhesion’ and ‘ECM-receptor
interaction’. In addition, a separate crosstalk existed between
‘proximal tubule bicarbonate reclamation’ and ‘nitrogen
metabolism’. No interaction was observed between ‘TNF signaling
pathway’ and the other pathways (Fig.
3).
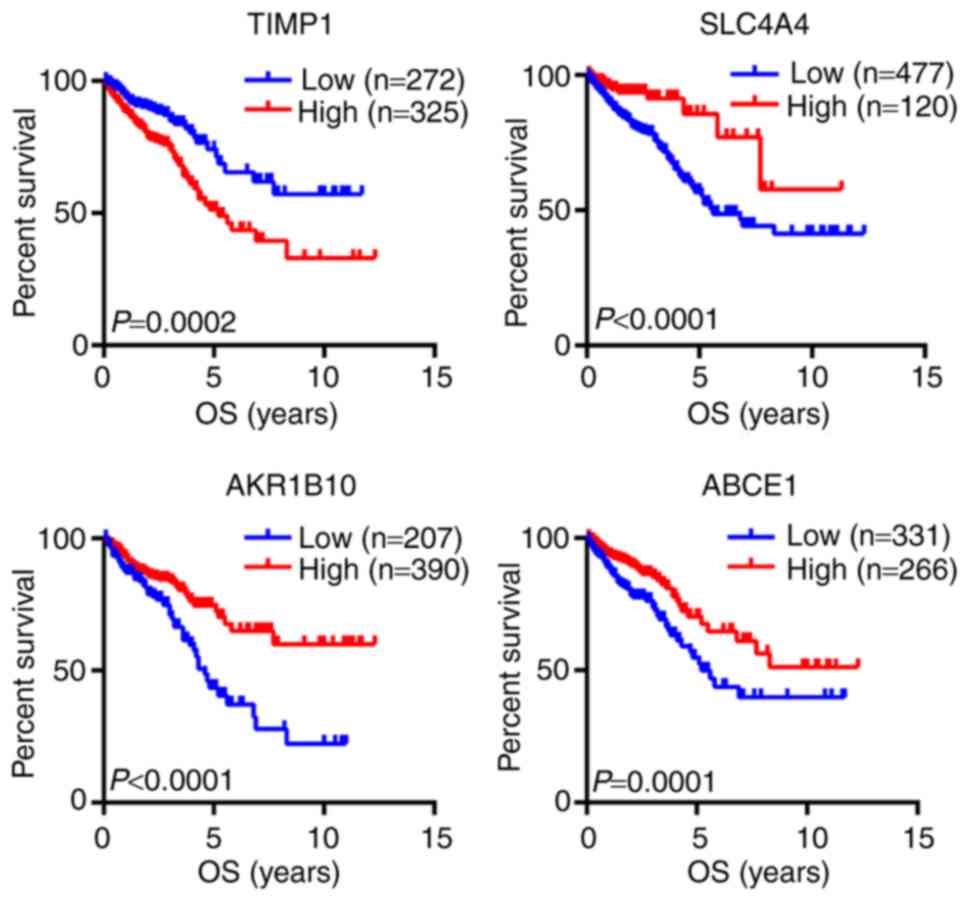
Survival analysis of hub genes
The prognostic value of the 44 hub genes from the
PPI network was investigated using The Human Protein Atlas
database. The results demonstrated that four hub genes were
associated with the OS of patients with CRC, including TIMP1,
SLC4A4, AKR1B10 and ABCE1 (Fig. 4).
The results of the survival analysis suggested that TIMP1 may be
considered as an oncogene, whereas SLC4A4, AKR1B10 and ABCE1 may be
tumor suppressor genes.
The results from univariate analysis revealed that
the Union for International Cancer Control (UICC) stage (29) and TIMP1, SLC4A4, AKR1B10 and ABCE1
expression levels were significantly associated with the OS of
patients with CRC (all P<0.01). However, there was no
significant association between age/sex and OS in the univariate
analysis (P>0.01). The results of multivariate analysis
demonstrated that age, UICC stage and SLC4A4 expression were
independent prognostic factors associated with the OS of patients
with CRC (Table V; all
P<0.01).
| Table V.Predictive values of clinical
characteristics of patients with colorectal cancer and the four hub
genes. |
Table V.
Predictive values of clinical
characteristics of patients with colorectal cancer and the four hub
genes.
|
|
|
| Univariate
analysis | Multivariate
analysis |
|---|
|
|
|
|
|
|
|---|
| Variable | Group | Number | 95% CI | P-value | 95% CI | P-value |
|---|
| Age (years) | <60 vs. ≥60 | 173 vs. 424 | 1.043–2.483 | 0.030 | 1.335–3.414 | 0.002 |
| Sex | Male vs.
female | 322 vs. 275 | – | 0.818 | – | 0.566 |
| UICC stage | I and II vs. III
and IV | 338 vs. 259 | 2.094–4.591 | <0.001 | 2.123–4.716 | <0.001 |
| TIMP1 | FPKM <172.3 vs.
≥172.3 | 272 vs. 325 | 1.376–2.929 | <0.001 | 1.019–2.302 | 0.040 |
| SLC4A4 | FPKM <2.5 vs.
≥2.5 | 477 vs. 120 | 0.195–0.673 | 0.001 | 0.189–0.709 | 0.003 |
| AKR1B10 | FPKM <2.5 vs.
≥2.5 | 207 vs. 390 | 0.365–0.739 | <0.001 | 0.454–0.962 | 0.030 |
| ABCE1 | FPKM <16.2 vs.
≥16.2 | 331 vs. 266 | 0.373–0.784 | 0.001 | 0.414–0.930 | 0.021 |
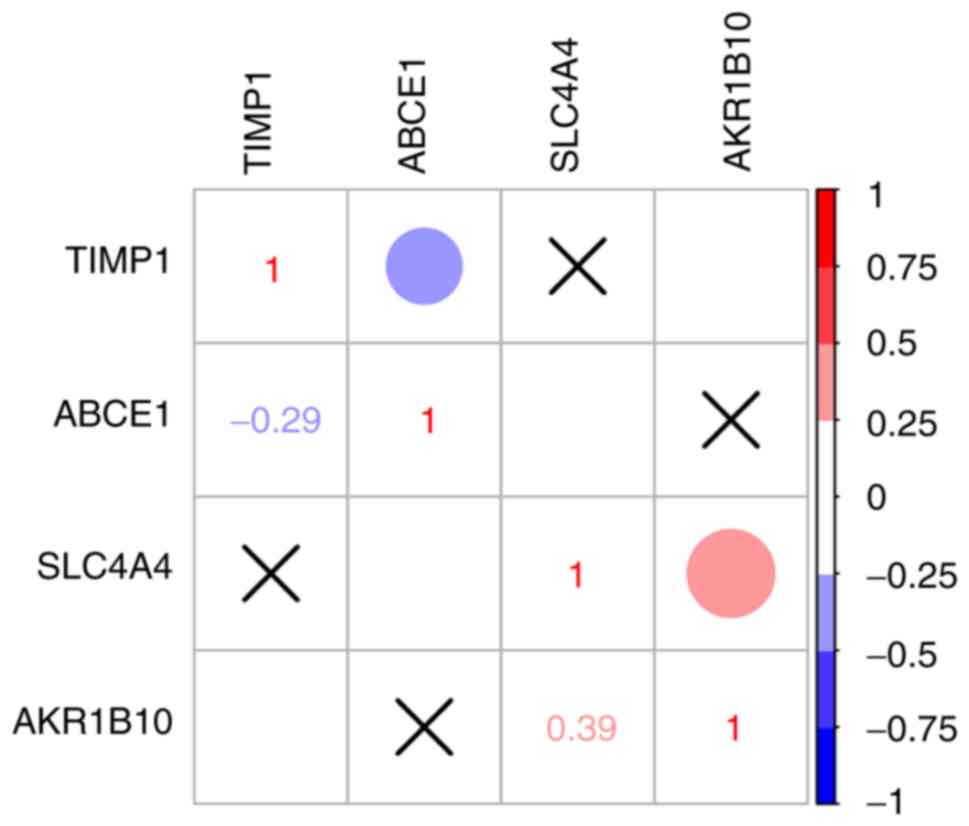
Correlation between hub genes
Correlation analysis between the expression levels
of the four hub genes (TIMP1, SLC4A4, ABCE1 and AKR1B10) was
performed using Spearman's correlation analysis. The results
demonstrated that there was no correlation between TIMP1, SLC4A4
and ABCE1 expression (Fig. 5);
however, the expression levels of AKR1B10 and SLC4A4 were
positively correlated (R=0.39; P<0.05; Fig. 5).
Discussion
Despite advances in surgical and medical therapies
for the treatment of CRC, the incidence and mortality rates remain
high (1,2). Successful screening techniques and
reducing the risk of CRC are essential to help decrease the
incidence of CRC. Understanding the etiology and mechanisms of CRC
progression is crucial to improve the survival rate of patients
with CRC and prevent the disease occurrence. Recently, microarray
technology, which has rapidly developed, has been widely used to
compare the expression levels of genes, and has been used to
predict disease progression, to make an accurate diagnosis and
evaluate prognosis (30–32). In the present study, a meta-analysis
method was used to analyze three microarray datasets (GSE20916,
GSE73360 and GSE44861) in order to identify DEGs in CRC tissue
samples. A total of 105 mutual DEGs were identified in the three
datasets, including 51 down-regulated genes and 54 up-regulated
genes. A total of 44 DEGs were subsequently selected from the PPI
network and were identified as hub genes. Furthermore, three
significant modules were identified in the PPI network. In
addition, survival analysis of the hub genes demonstrated that two
down-regulated genes (SLC4A4 and AKR1B10) and two up-regulated
genes (ABCE1 and TIMP1) were significantly associated with the OS
of patients with CRC. These four genes may be the most reliable
genes that could be applied in clinical settings for the following
reasons: i) These four genes were simultaneously confirmed using
three gene expression profile datasets; and ii) these genes have
been demonstrated to be associated with cancer.
SLC4A4, which is a member of the SLC4 family, is an
electrically induced transmembrane transporter, which is mostly
involved in sodium and bicarbonate transport to the epithelial cell
membrane (33). A previous study
reported that the SLC4 family is mainly involved in CO2
transport by red blood cells, the absorption or secretion of
H+ or HCO3 − by epithelial cells and
regulation of cell volume and intracellular pH in the majority of
cells (34). Furthermore, abnormal
SLC4A4 expression has been reported in thyroid carcinoma, and this
biomarker may be used for the diagnosis of thyroid cancer (35). However, to the best of our knowledge,
only a few studies have investigated SLC4A4 expression in CRC. For
example, Chen et al (36)
demonstrated that the expression of SLC4A4 was decreased in CRC
samples. Another study also reported that SLC4A4 was significantly
down-regulated in the CRC group (37). In the present study, a PPI network
was constructed to identify the hub genes for CRC, and SLC4A4 was
identified to be down-regulated. The clinical data of 597 patients
with CRC were then collected using TCGA database. The results from
survival analysis demonstrated that patients with CRC in the SLC4A4
high expression group had a longer OS compared with patients with
CRC in the SLC4A4 low expression group. These findings suggested
that SLC4A4 may be used to evaluate the prognosis of patients with
CRC.
ABCE1 is located on chromosome 4q31 and codes for
599 amino acids. Previous studies have reported that ABCE1
suppresses the interferon (IFN)-dependent 2-5A/RNase L system and
serves key roles in cell proliferation and apoptosis (38,39). IFN
is involved in cell immune defense by inducing transcription
processes of a large number of genes, and has been demonstrated to
be able to fight virus infection, inhibit tumor growth and control
cell proliferation and differentiation (39). Zheng et al (40) have demonstrated that ABCE1 is
up-regulated in lung cancer samples, and that decreased ABCE1
expression can impair cell proliferation and increase cell
apoptosis. Hlavata et al (41) also reported that ABCE1 is
up-regulated in CRC. Furthermore, it has been reported that ABCE1
knockdown can inhibit the proliferation and invasion of breast
cancer cells (42) and small cell
lung cancer cells (43). In
addition, a previous study has demonstrated that ABCE1 participates
in the immune response of colon cancer (44). Consistent with these results, the
present study demonstrated that ABCE1 was an upregulated hub DEG,
and that high ABCE1 expression was associated with a high OS in
patients with CRC. These findings indicated that ABCE1 may be
considered as a diagnostic and prognostic biomarker in CRC and may
be used for targeted therapy of CRC.
TIMP1 is a soluble protein released from endometrium
cells, fibroblasts and cancer cells, which has been demonstrated to
be associated with prognosis in various types of carcinoma
(45–47). Xiong et al (48) reported that TIMP1 is overexpressed is
in CRC. A recent study demonstrated that TIMP1 depletion can
inhibit the proliferation, migration and invasion of colonic
carcinoma cells, and inhibit the tumorigenesis and metastasis in
CRC (49). In addition, TIMP1
overexpression is associated with focal adhesion kinase (FAK)
activation. FAK is an upstream regulator of the PI3K-Akt signaling
pathway, which is crucial in the cell survival pathway (50–52).
Consistent with these studies, the present study reported that
TIMP1 was up-regulated in CRC tissues samples compared with normal
tissue samples, and that low TIMP1 expression was associated with a
higher OS of patients with CRC. Therefore, TIMP1 may be considered
as a potential biomarker that could be used to predict the clinical
outcome of patients with CRC.
Abnormal AKR1B10 expression has been reported in
numerous types of cancer, including breast cancer, endometrial
cancer, oral squamous cell carcinoma and lung cancer (35,53,54).
AKR1B10, which is one member of the AKR superfamily, is an
essential regulatory gene involved in the physiological function of
intestinal tissue, including cell apoptosis, proliferation and
migration (55). Previous studies
have demonstrated that AKR1B10 expression is lower in CRC tissues
compared with in normal colorectal tissues (44,56).
Furthermore, AKR1B10 is one of the direct transcriptional targets
of the p53 gene (34,57). Significantly, p53 is activated in
cases of DNA damage, oncogene activation, anoxia and excessive
proliferation (38). A previous
study reported that the p53 mutation rate in CRC is ~40% (56). In addition, survival analysis using
the TCGA database has demonstrated that patients with CRC and high
AKR1B10 expression have a significantly longer survival rate
(58). Consistent with these
findings, the present study demonstrated that AKR1B10 was
down-regulated in CRC tissues compared with normal tissues, and
that patients with CRC in the AKR1B10 high expression group had a
higher OS compared with patients in the AKR1B10 low expression
group. These results suggest the importance of AKR1B10 in
evaluating the prognosis of patients with CRC.
The results of the present study may have clinical
significance for CRC; however, the current study presented certain
limitations. Firstly, since the candidate prognosis-associated hub
DEGs were detected using data from the GEO and TCGA databases,
there was no validation for these genes based on the data generated
in the present study. Secondly, the expression levels of the
prognosis-associated hub DEGs were not validated using PCR, western
blotting or other experimental methods. Thirdly, since the
potential roles of AKR1B10, SLC4A4, ABCE1 and TIMP1 in CRC remain
unknown, future investigations will determine the effects of these
hub genes in CRC by using in vivo and in vitro
experiments.
In conclusion, through GEO and TCGA data analyses,
four hub DEGs (SLC4A4, ABCE1, AKR1B10 and TIMP1) were identified as
being significantly associated with the OS of patients with CRC.
These four genes may serve as novel independent prognostic
biomarkers that could be used to predict the clinical outcomes of
patients with CRC. However, further investigations using cancer
cell lines and xenograft models are required in order to determine
the underlying mechanisms of these four hub genes and their roles
in the prognosis of CRC.
Acknowledgements
Not applicable.
Funding
The present study was supported by the Natural
Science Foundation of Henan Province (grant no. 162300410040), the
National Natural Science Foundation of China (grant no. 81301963)
and the Outstanding Youth Science Foundation of Henan University
(grant no. yqpy20140036).
Availability of data and materials
The datasets used and/or analyzed during the present
study are available from the corresponding author on reasonable
request.
Authors' contributions
GPD and LPW performed the experiments, analyzed the
data and drafted the manuscript. YQW, XQR and SGZ designed the
study and critically revised the manuscript. All authors read and
approved the final version of the manuscript.
Ethics approval and consent to
participate
Not applicable.
Patient consent for publication
Not applicable.
Competing interests
The authors declare that they have no competing
interests.
References
|
1
|
Siegel R, Desantis C and Jemal A:
Colorectal cancer statistics, 2014. CA Cancer J Clin. 64:104–117.
2014. View Article : Google Scholar : PubMed/NCBI
|
|
2
|
Bray F, Ferlay J, Soerjomataram I, Siegel
RL, Torre LA and Jemal A: Global cancer statistics 2018: GLOBOCAN
estimates of incidence and mortality worldwide for 36 cancers in
185 countries. CA Cancer J Clin. 68:394–424. 2018. View Article : Google Scholar : PubMed/NCBI
|
|
3
|
Leslie A and Steele RJ: Management of
colorectal cancer. Postgrad Med J. 78:473–478. 2002. View Article : Google Scholar : PubMed/NCBI
|
|
4
|
Renkonen-Sinisalo L, Aarnio M, Mecklin JP
and Järvinen HJ: Surveillance improves survival of colorectal
cancer in patients with hereditary nonpolyposis colorectal cancer.
Cancer Detect Prev. 24:137–142. 2000.PubMed/NCBI
|
|
5
|
Siegel RL, Miller KD, Fedewa SA, Ahnen DJ,
Meester RGS, Barzi A and Jemal A: Colorectal cancer statistics,
2017. CA Cancer J Clin. 67:177–193. 2017. View Article : Google Scholar : PubMed/NCBI
|
|
6
|
Chen W, Zheng R, Zeng H, Zhang S and He J:
Annual report on status of cancer in China, 2011. Chin J Cancer
Res. 27:2–12. 2015. View Article : Google Scholar : PubMed/NCBI
|
|
7
|
Derry MM, Raina K, Agarwal C and Agarwal
R: Identifying molecular targets of lifestyle modifications in
colon cancer prevention. Front Oncol. 3:1192013. View Article : Google Scholar : PubMed/NCBI
|
|
8
|
Sakai E, Fukuyo M, Ohata K, Matsusaka K,
Doi N, Mano Y, Takane K, Abe H, Yagi K, Matsuhashi N, et al:
Genetic and epigenetic aberrations occurring in colorectal tumors
associated with serrated pathway. Int J Cancer. 138:1634–1644.
2016. View Article : Google Scholar : PubMed/NCBI
|
|
9
|
Mlcochova J, Faltejskova P, Nemecek R,
Svoboda M and Slaby O: MicroRNAs targeting EGFR signalling pathway
in colorectal cancer. J Cancer Res Clin Oncol. 139:1615–1624. 2013.
View Article : Google Scholar : PubMed/NCBI
|
|
10
|
Takahashi T, Shigematsu H, Shivapurkar N,
Reddy J, Zheng Y, Feng Z, Suzuk M, Nomura M, Augustus M, Yin J, et
al: Aberrant promoter methylation of multiple genes during
multistep pathogenesis of colorectal cancers. Int J Cancer.
118:924–931. 2006. View Article : Google Scholar : PubMed/NCBI
|
|
11
|
Schirripa M and Lenz HJ: Biomarker in
Colorectal Cancer. Cancer J. 22:156–164. 2016. View Article : Google Scholar : PubMed/NCBI
|
|
12
|
Bustin SA and Dorudi S: Gene expression
profiling for molecular staging and prognosis prediction in
colorectal cancer. Expert Rev Mol Diagn. 4:599–607. 2004.
View Article : Google Scholar : PubMed/NCBI
|
|
13
|
Kulasingam V and Diamandis EP: Strategies
for discovering novel cancer biomarkers through utilization of
emerging technologies. Nat Clin Pract Oncol. 5:588–599. 2008.
View Article : Google Scholar : PubMed/NCBI
|
|
14
|
Nannini M, Pantaleo MA, Maleddu A, Astolfi
A, Formica S and Biasco G: Gene expression profiling in colorectal
cancer using microarray technologies: Results and perspectives.
Cancer Treat Rev. 35:201–209. 2009. View Article : Google Scholar : PubMed/NCBI
|
|
15
|
Liang B, Li C and Zhao J: Identification
of key pathways and genes in colorectal cancer using bioinformatics
analysis. Med Oncol. 33:1112016. View Article : Google Scholar : PubMed/NCBI
|
|
16
|
Skrzypczak M, Goryca K, Rubel T, Paziewska
A, Mikula M, Jarosz D, Pachlewski J, Oledzki J and Ostrowski J:
Modeling oncogenic signaling in colon tumors by multidirectional
analyses of microarray data directed for maximization of analytical
reliability. PLoS One. 5:e130912010. View Article : Google Scholar : PubMed/NCBI
|
|
17
|
Condorelli DF, Spampinato G, Valenti G,
Musso N, Castorina S and Barresi V: Positive caricature
transcriptomic effects associated with broad genomic aberrations in
colorectal cancer. Sci Rep. 8:148262018. View Article : Google Scholar : PubMed/NCBI
|
|
18
|
Ryan BM, Zanetti KA, Robles AI, Schetter
AJ, Goodman J, Hayes RB, Huang WY, Gunter MJ, Yeager M, Burdette L,
et al: Germline variation in NCF4, an innate immunity gene, is
associated with an increased risk of colorectal cancer. Int J
Cancer. 134:1399–1407. 2014. View Article : Google Scholar : PubMed/NCBI
|
|
19
|
Rich JN, Hans C, Jones B, Iversen ES,
McLendon RE, Rasheed BK, Dobra A, Dressman HK, Bigner DD, Nevins JR
and West M: Gene expression profiling and genetic markers in
glioblastoma survival. Cancer Res. 65:4051–4058. 2005. View Article : Google Scholar : PubMed/NCBI
|
|
20
|
Simon R, Lam A, Li MC, Ngan M, Menenzes S
and Zhao Y: Analysis of gene expression data using BRB-array tools.
Cancer Inform. 3:11–17. 2007. View Article : Google Scholar : PubMed/NCBI
|
|
21
|
von Mering C, Huynen M, Jaeggi D, Schmidt
S, Bork P and Snel B: STRING: A database of predicted functional
associations between proteins. Nucleic Acids Res. 31:258–261. 2003.
View Article : Google Scholar : PubMed/NCBI
|
|
22
|
Smoot ME, Ono K, Ruscheinski J, Wang PL
and Ideker T: Cytoscape 2.8: New features for data integration and
network visualization. Bioinformatics. 27:431–432. 2011. View Article : Google Scholar : PubMed/NCBI
|
|
23
|
Otte E and Rousseau R: Social network
analysis: A powerful strategy, also for the information sciences. J
Inform Sci. 28:441–453. 2002. View Article : Google Scholar
|
|
24
|
Rhrissorrakrai K and Gunsalus KC: MINE:
Module identification in networks. BMC Bioinformatics. 12:1922011.
View Article : Google Scholar : PubMed/NCBI
|
|
25
|
Ashburner M, Ball CA, Blake JA, Botstein
D, Butler H, Cherry JM, Davis AP, Dolinski K, Dwight SS, Eppig JT,
et al: Gene ontology: Tool for the unification of biology. The Gene
Ontology Consortium. Nat Genet. 25:25–29. 2000. View Article : Google Scholar : PubMed/NCBI
|
|
26
|
Ogata H, Goto S, Sato K, Fujibuchi W, Bono
H and Kanehisa M: KEGG: Kyoto Encyclopedia of Genes and Genomes.
Nucleic Acids Res. 27:29–34. 1999. View Article : Google Scholar : PubMed/NCBI
|
|
27
|
Huang da W, Sherman BT and Lempicki RA:
Systematic and integrative analysis of large gene lists using DAVID
bioinformatics resources. Nat Protoc. 4:44–57. 2009. View Article : Google Scholar : PubMed/NCBI
|
|
28
|
Merico D, Isserlin R, Stueker O, Emili A
and Bader GD: Enrichment map: A network-based method for gene-set
enrichment visualization and interpretation. PLoS One.
5:e139842010. View Article : Google Scholar : PubMed/NCBI
|
|
29
|
Huang SH, Xu W, Waldron J, Siu L, Shen X,
Tong L, Ringash J, Bayley A, Kim J, Hope A, et al: Refining
American Joint Committee on Cancer/Union for International Cancer
Control TNM stage and prognostic groups for human
papillomavirus-related oropharyngeal carcinomas. J Clin Oncol.
33:836–845. 2015. View Article : Google Scholar : PubMed/NCBI
|
|
30
|
Ramaswamyreddy SH and Smitha T:
Microarray-based gene expression profiling for early detection of
oral squamous cell carcinoma. J Oral Maxillofac Pathol. 22:293–295.
2018.PubMed/NCBI
|
|
31
|
Salem H, Attiya G and El-Fishawy N:
Classification of human cancer diseases by gene expression
profiles. Appl Soft Comput. 50:124–134. 2017. View Article : Google Scholar
|
|
32
|
Li G, Li X, Yang M, Xu L, Deng S and Ran
L: Prediction of biomarkers of oral squamous cell carcinoma using
microarray technology. Sci Rep. 7:421052017. View Article : Google Scholar : PubMed/NCBI
|
|
33
|
Romero MF, Hediger MA, Boulpaep EL and
Boron WF: Expression cloning and characterization of a renal
electrogenic Na+/HCO3-cotransporter. Nature. 387:409–413. 1997.
View Article : Google Scholar : PubMed/NCBI
|
|
34
|
Romero MF, Fulton CM and Boron WF: The
SLC4 family of HCO 3-transporters. Pflugers Arch. 447:495–509.
2004. View Article : Google Scholar : PubMed/NCBI
|
|
35
|
Gomez-Rueda H, Palacios-Corona R,
Gutiérrez-Hermosillo H and Trevino V: A robust biomarker of
differential correlations improves the diagnosis of cytologically
indeterminate thyroid cancers. Int J Mol Med. 37:1355–1362. 2016.
View Article : Google Scholar : PubMed/NCBI
|
|
36
|
Chen S, Zhang L, Su Y and Zhang X:
Screening potential biomarkers for colorectal cancer based on
circular RNA chips. Oncol Rep. 39:2499–2512. 2018.PubMed/NCBI
|
|
37
|
Zhao ZW, Fan XX, Yang LL, Song JJ, Fang
SJ, Tu JF, Chen MJ, Zheng LY, Wu FZ, Zhang DK, et al: The
identification of a common different gene expression signature in
patients with colorectal cancer. Math Biosci Eng. 16:2942–2958.
2019.PubMed/NCBI
|
|
38
|
Bisbal C, Martinand C, Silhol M, Lebleu B
and Salehzada T: Cloning and Characterization of a RNase L
Inhibitor A new component of the interferon-regulated 2-5A pathway.
J Biol Chem. 270:13308–13317. 1995. View Article : Google Scholar : PubMed/NCBI
|
|
39
|
Pestka S, Langer JA, Zoon KC and Samuel
CE: Interferons and their actions. Annu Rev Biochem. 56:727–777.
1987. View Article : Google Scholar : PubMed/NCBI
|
|
40
|
Zheng D, Dai Y, Wang S and Xing X:
MicroRNA-299-3p promotes the sensibility of lung cancer to
doxorubicin through directly targeting ABCE1. Int J Clin Exp
Pathol. 8:10072–10081. 2015.PubMed/NCBI
|
|
41
|
Hlavata I, Mohelnikova-Duchonova B,
Vaclavikova R, Liska V, Pitule P, Novak P, Bruha J, Vycital O,
Holubec L, Treska V, et al: The role of ABC transporters in
progression and clinical outcome of colorectal cancer. Mutagenesis.
27:187–196. 2012. View Article : Google Scholar : PubMed/NCBI
|
|
42
|
Huang B, Zhou H, Lang X and Liu Z:
siRNA-induced ABCE1 silencing inhibits proliferation and invasion
of breast cancer cells. Mol Med Rep. 10:1685–1690. 2014. View Article : Google Scholar : PubMed/NCBI
|
|
43
|
Huang B, Gao Y, Tian D and Zheng M: A
small interfering ABCE1-targeting RNA inhibits the proliferation
and invasiveness of small cell lung cancer. Int J Mol Med.
25:687–693. 2010.PubMed/NCBI
|
|
44
|
Shichijo S, Ishihara Y, Azuma K, Komatsu
N, Higashimoto N, Ito M, Nakamura T, Ueno T, Harada M and Itoh K:
ABCE1, a member of ATP-binding cassette transporter gene, encodes
peptides capable of inducing HLA-A2-restricted and tumor-reactive
cytotoxic T lymphocytes in colon cancer patients. Oncol Rep.
13:907–913. 2005.PubMed/NCBI
|
|
45
|
Wang YY, Li L, Zhao ZS and Wang HJ:
Clinical utility of measuring expression levels of KAP1, TIMP1 and
STC2 in peripheral blood of patients with gastric cancer. World J
Surg Oncol. 11:812013. View Article : Google Scholar : PubMed/NCBI
|
|
46
|
Bjerre C, Vinther L, Belling KC, Würtz SØ,
Yadav R, Lademann U, Rigina O, Do KN, Ditzel HJ, Lykkesfeldt AE, et
al: TIMP1 overexpression mediates resistance of MCF-7 human breast
cancer cells to fulvestrant and down-regulates progesterone
receptor expression. Tumour Biol. 34:3839–3851. 2013. View Article : Google Scholar : PubMed/NCBI
|
|
47
|
Peng L, Yanjiao M, Ai-Guo W, Pengtao G,
Jianhua L, Ju Y, Hongsheng O and Xichen Z: A fine balance between
CCNL1 and TIMP1 contributes to the development of breast cancer
cells. Biochem Biophys Res Commun. 409:344–349. 2011. View Article : Google Scholar : PubMed/NCBI
|
|
48
|
Xiong Y, You W, Wang R, Peng L and Fu Z:
Prediction and validation of Hub Genes associated with colorectal
cancer by integrating PPI network and gene expression data. Biomed
Res Int. 2017:24214592017. View Article : Google Scholar : PubMed/NCBI
|
|
49
|
Song G, Xu S, Zhang H, Wang Y, Xiao C,
Jiang T, Wu L, Zhang T, Sun X, Zhong L, et al: TIMP1 is a
prognostic marker for the progression and metastasis of colon
cancer through FAK-PI3K/AKT and MAPK pathway. J Exp Clin Cancer
Res. 35:1482016. View Article : Google Scholar : PubMed/NCBI
|
|
50
|
Kostourou V, Lechertier T, Reynolds LE,
Lees DM, Baker M, Jones DT, Tavora B, Ramjaun AR, Birdsey GM,
Robinson SD, et al: FAK-heterozygous mice display enhanced tumour
angiogenesis. Nat Commun. 4:20202013. View Article : Google Scholar : PubMed/NCBI
|
|
51
|
Oudart JB, Doué M, Vautrin A, Brassart B,
Sellier C, Dupont-Deshorgue A, Monboisse JC, Maquart FX,
Brassart-Pasco S and Ramont L: The anti-tumor NC1 domain of
collagen XIX inhibits the FAK/PI3K/Akt/mTOR signaling pathway
through αvβ3 integrin interaction. Oncotarget. 7:1516–1528. 2016.
View Article : Google Scholar : PubMed/NCBI
|
|
52
|
Kapur R, Cooper R, Zhang L and Williams
DA: Cross-talk between alpha(4)beta(1)/alpha(5)beta(1) and c-Kit
results in opposing effect on growth and survival of hematopoietic
cells via the activation of focal adhesion kinase,
mitogen-activated protein kinase, and Akt signaling pathways.
Blood. 97:1975–1981. 2001. View Article : Google Scholar : PubMed/NCBI
|
|
53
|
Ko HH, Cheng SL, Lee JJ, Chen HM, Kuo MY
and Cheng SJ: Expression of AKR1B10 as an independent marker for
poor prognosis in human oral squamous cell carcinoma. Head Neck.
39:1327–1332. 2017. View Article : Google Scholar : PubMed/NCBI
|
|
54
|
Sinreih M, Štupar S, Čemažar L, Verdenik
I, Frković Grazio S, Smrkolj Š and Rižner TL: STAR and AKR1B10 are
down-regulated in high-grade endometrial cancer. J Steroid Biochem
Mol Bio. 171:43–53. 2017. View Article : Google Scholar
|
|
55
|
Huang B, Gong X, Zhou H, Xiong F and Wang
S: Depleting ABCE1 expression induces apoptosis and inhibits the
ability of proliferation and migration of human esophageal
carcinoma cells. Int J Clin Exp Pathol. 7:584–592. 2014.PubMed/NCBI
|
|
56
|
Li Q, Shen F and Wang C: TUC338 promotes
cell migration and invasion by targeting TIMP1 in cervical cancer.
Oncol Lett. 13:4526–4532. 2017. View Article : Google Scholar : PubMed/NCBI
|
|
57
|
Petitjean A, Mathe E, Kato S, Ishioka C,
Tavtigian SV, Hainaut P and Olivier M: Impact of mutant p53
functional properties on TP53 mutation patterns and tumor
phenotype: Lessons from recent developments in the IARC TP53
database. Hum Mutat. 28:622–629. 2007. View Article : Google Scholar : PubMed/NCBI
|
|
58
|
Taskoparan B, Seza EG, Demirkol S, Tuncer
S, Stefek M, Gure AO and Banerjee S: Opposing roles of the
aldo-keto reductases AKR1B1 and AKR1B10 in colorectal cancer. Cell
Oncol (Dordr). 40:563–578. 2017. View Article : Google Scholar : PubMed/NCBI
|