Introduction
Gastric cancer is the fifth most commonly diagnosed
cancer (5.7% of total cases) and the third leading cause of cancer
mortality (8.2% of total cancer mortality) worldwide (1). Gastric cancer is also the third leading
cause of cancer-related mortality in China (2). Although surgery combined with
radiotherapy, chemotherapy and targeted therapy prolongs survival,
the 5-year overall survival rate of patients with advanced gastric
cancer remains poor. The 5-year overall survival rates of patients
with pathological T stage 2, 3 and 4 disease were 68.3, 33.0 and
24.0% respectively (3,4). Therefore, new biomarkers of gastric
cancer to determine prognosis are necessary.
Fibronectin 1 (FN1) mediates the interaction
between cells and the extracellular matrix and serves an important
role in cell adhesion, migration, growth and differentiation
(5). FN1 is a ligand for
numerous members of the integrin receptor family (6). FN1 is involved in the occurrence
and development of various tumors. FN1 activates the
PI3K/Akt pathway by binding to its integrin receptor α5β1 in breast
cancer (7). In addition, FN1
has been demonstrated to promote cell proliferation and migration
in esophageal squamous cell carcinoma, oral squamous cell carcinoma
(OSCC), nasopharyngeal carcinoma, colorectal, ovarian, renal and
thyroid cancer (8–14). However, little is known about the
expression of FN1 in gastric cancer. FN1 is
upregulated in GC tissues compared with normal gastric tissues
(15). FN1 knockdown inhibits
cell migration and invasion in vitro, and FOXF1 adjacent
non-coding developmental regulatory RNA and microRNA-200c promote
the proliferation, migration and invasion of GC cells by negatively
targeting FN1 (15–17). Overall, FN1 is a potential
biomarker candidate for GC prognosis, but the relationship between
FN1 expression and clinical factors and prognosis has not
been reported, and thus it is necessary to verify and clarify the
role of FN1 in GC.
The aim of the present study was to investigate
FN1 gene expression in GC and its association with
clinicopathological factors and prognosis by examining 17 publicly
available GC cohorts. Furthermore, FN1 protein expression
was validated by immunohistochemistry in a separate cohort. The
results demonstrated that FN1 may serve as a new prognostic
marker for GC.
Materials and methods
Data collection
Microarray data were downloaded from the following
datasets in the Gene Expression Omnibus (GEO; http://www.ncbi.nlm.nih.gov/geo/), The Cancer
Genome Atlas (https://xenabrowser.net/datapages/?cohort=TCGA) and
Oncomine (https://www.oncomine.org/resource/login.html):
GSE13861, GSE13911, GSE14208, GSE15456, GSE15459, GSE19826,
GSE26253, GSE26899, GSE26901, GSE29272, GSE34942, GSE35809,
GSE54129, GSE66229, GSE79973, Chen Gastric and TCGA STAD. Several
of these datasets have been previously published (18–32). The
17 datasets comprised 2,376 cancer tissues and 294 adjacent normal
tissues. Datasets with no clinical data (GSE13861, GSE13911,
GSE19826, GSE54129, GSE79973 and Chen Gastric), GSE29272 and TCGA
STAD were used to analyze the differences between tumor and
adjacent tissues. The remaining datasets were used to analyze the
relationship between FN1 expression and clinicopathological
factors. Clinical information for the cohorts with respective
clinical data included in this study is presented in Table I.
 | Table I.Clinicopathological characteristics
of patients in different datasets. |
Table I.
Clinicopathological characteristics
of patients in different datasets.
| Characteristic | IHC cohort, n
(%) | GSE13861, n
(%) | GSE15456, n
(%) | GSE15459, n
(%) | GSE26253, n
(%) | GSE26899, n
(%) | GSE26901, n
(%) | GSE29272, n
(%) | GSE34942, n
(%) | GSE35809, n
(%) | GSE66229, n
(%) | TCGA, n (%) |
|---|
| Sex |
|
|
|
|
|
|
|
|
|
|
|
|
|
Total | 190 (100) | 65 (100) | 30 (100) | 192 (100) | 432 (100) | 92 (100) | 109 (100) | 134 (100) | 56 (100) | 70 (100) | 300(100) | 415(100) |
|
Male | 144 (75.8) | 46 (70.8) | 17 (56.7) | 125 (65.1) | 280 (64.8) | 73 (79.3) | 69 (63.3) | 103 (76.9) | 36 (64.3) | 48 (68.6) | 199 (66.3) | 268 (64.6) |
|
Female | 46 (24.2) | 19 (29.2) | 13 (43.3) | 67 (34.9) | 152 (35.2) | 19 (20.7) | 40 (36.7) | 31 (23.1) | 20 (35.7) | 22 (31.4) | 101 (33.7) | 147 (35.4) |
| Median age, years
(min, max) | 59 (25, 85) | 63 (32, 83) | 73 (53, 83) | 66 (23, 92) | 53 (23, 74) | 59 (36, 83) | 58 (28, 74) | 59 (23, 73) | 69 (43, 84) | 67 (32, 85) | 64 (24, 86) | 67 (30, 90) |
| T stage |
|
|
|
|
|
|
|
|
|
|
|
|
| 1 | 15 (7.9) | 2 (3.1) | – | 8 (4.2) | – | – | – | – | – | – | 2 (0.7) | 22 (5.3) |
| 2 | 32 (16.8) | 23 (35.4) | – | 45 (23.4) | – | – | – | – | – | – | 186 (62) | 88 (21.2) |
| 3 | 24 (12.6) | 34 (52.3) | – | 107 (55.7) | – | – | – | – | – | – | 91 (30.3) | 181 (43.6) |
| 4 | 119 (62.6) | 1 (1.5) | – | 1 (0.5) | – | – | – | – | – | – | 21 (7) | 115 (27.7) |
|
Unknown | 0 (0) | 5 (7.7) | – | 31 (16.1) | – | – | – | – | – | – | 0 (0) | 9 (2.2) |
| TNM stage |
|
|
|
|
|
|
|
|
|
|
|
|
| I | 29 (15.3) | 12 (18.5) | 6 (20) | 31 (16.1) | 68 (15.7) | 11 (12.0) | 38 (29.5) | 5 (3.7) | 11 (19.6) | 13 (18.6) | 31 (10.3) | 57 (13.7) |
| II | 60 (31.6) | 2 (3.1) | 4 (13.3) | 29 (15.1) | 167 (38.7) | 18 (19.6) | 40 (31) | 5 (3.7) | 11 (19.6) | 16 (22.9) | 97 (32.3) | 123 (29.6) |
|
III | 91 (47.9) | 35 (53.8) | 15 (50) | 72 (37.5) | 130 (30.1) | 27 (29.3) | 36 (27.9) | 115 (85.8) | 19 (33.9) | 33 (47.1) | 95 (31.7) | 169 (40.7) |
| IV | 10 (5.3) | 16 (24.6) | 5 (16.7) | 60 (31.3) | 67 (15.5) | 36 (39.1) | 15 (11.6) | 9 (6.7) | 13 (23.2) | 7 (10) | 77 (25.7) | 41 (9.9) |
|
Unknown | 0 (0) | 0 (0) | 0 (0) | 0 (0) | 0 (0) | 0 (0) | 0 (0) | 0 (0) | 2 (3.6) | 1 (1.4) | 0 (0) | 25 (6.0) |
| Tumor grade |
|
|
|
|
|
|
|
|
|
|
|
|
|
Low | 48 (24) | 20 (30.8) | 2 (6.7) | 6 (3.1) | – | – | – | 1 (0.7) | – | 2 (2.9) | – | 12 (2.9) |
|
Intermediate | 66 (33) | 15 (23.1) | 13 (43.3) | 53 (27.6) | – | – | – | 48 (35.8) | – | 22 (31.4) | – | 148 (35.7) |
|
High | 76 (38) | 6 (9.2) | 15 (50) | 86 (44.8) | – | – | – | 85 (63.4) | – | 26 (37.1) | – | 246 (59.3) |
|
Undifferentiated | 10 (5) | 24 (36.9) | 0 (0) | 47 (24.5) | – | – | – | 0 (0) | – | 20 (28.6) | – | 9 (2.2) |
| Follow-up endpoint
(death) |
|
|
|
|
|
|
|
|
|
|
|
|
|
Occurred | 101 (50.5) | – | – | 95 (49.5) | – | – | – | 31 (23.1) | 27 (48.2) | – | 159 (53) | 144 (34.7) |
| Not
occurred | 99 (49.5) | – | – | 97 (50.5) | – | – | – | 95 (70.9) | 29 (51.8) | – | 141 (47) | 214 (51.6) |
| No
data | 0 (0) | – | – | 0 (0) | – | – | – | 8 (6) | 0 (0) | – | 0 (0) | 57 (13.7) |
Validation dataset
Immunohistochemistry (IHC) was used for validation.
Gastric cancer tissues and adjacent normal gastric tissues were
obtained during surgery from 190 randomly selected patients between
June 2011 and June 2012 at the First Affiliated Hospital of
Zhengzhou University (Zhengzhou, China). The study was approved by
the ethics committee of the First Affiliated Hospital of Zhengzhou
University. Written informed consent was obtained from all
patients. The tissues were fixed with formalin and embedded in
paraffin for subsequent experiments. All patients were followed up
for ≥5 years, and 102 succumbed to any cause during the follow-up
period.
IHC
Formalin-fixed paraffin-embedded tissue samples from
the IHC cohort were sliced into 4-µm sections. A mouse monoclonal
antibody against FN1 (cat. no. 66042-1-Ig; ProteinTech
Group, Inc.) was used at a 1:600 dilution at pH 9.0. The
immunohistochemical staining of the specimens was performed as
previously described (16). The
results of FN1 expression were separately scored in
epithelial cancer cells and intertumoral stroma. The scoring method
described by Sung et al (33)
was used. For epithelial FN1 (E-FN1) expression,
staining intensity and the proportion of stained tumor cells were
considered. Staining intensity was classified as follows: 1, weak;
2, moderate; and 3, strong. Positive cells were quantified as a
percentage of the total number of tumor cells and assigned to one
of the following categories: 0, <5%; 1, 5–24%; 2, 25–49%; 3,
50–74%; and 4, ≥75%. The percentage of positive tumor cells and
staining intensity were multiplied to generate an immunoreactivity
score (IS) for each case. IS values ranged from 0 to 12; IS≥3 was
considered positive, whereas IS<3 was considered negative.
Stromal FN1 (S-FN1) expression was graded into three
categories: No or weak staining, no staining or a low number of
FN1-positive strands; moderate staining, fine
FN1-positive strands; and strong staining, coarse
FN1-positive strands (34).
Statistical analysis
When >1 FN1 probe was present in a group,
the probe with the highest variance was selected for statistical
analysis (35). All FN1 gene
expression data normalization and probe summarization were
performed by Robust Multichip Analysis and transformed by log2.
SPSS 22.0 (IBM Corp.) and RevMan 5.3 (Cochrane Community) were used
to perform all statistical analyses.
Independent sample t-tests were used in SPSS for
continuous data analysis and Pearson's χ2 tests were
used for categorical data analysis. The gene expression value was
equal to three, ≥1/3 were defined as high expression and the
<1/3 as low expression. Overall survival (OS) rate was analyzed
using Kaplan-Meier plots and the log-rank test or
Gehan-Breslow-Wilcoxon test. When the two survival functions were
parallel, the log-rank test was used, whereas the
Gehan-Breslow-Wilcoxon test was used if the data crossed over. A
Cox regression model was used to assess the hazard ratio (HR) and
perform multivariate analysis. All tests were two-sided, and
P<0.05 was considered to indicate a statistically significant
difference.
Meta-analyses were performed using RevMan 5.3.
First, the heterogeneity between the results of each study was
analyzed by the χ2 test. The threshold was set to
α=0.100, and the extent of heterogeneity was assessed by combining
I2. If P>0.10 and I2≤50%, the homogeneity
between the results was considered high, and the fixed effect model
was used; if P≤0.10 or I2>50%, the random effects
model was used.
Results
Patient cohorts
Data from 17 independent GC cohorts were downloaded
from the Gene Expression Omnibus (GEO), The Cancer Genome Atlas
(TCGA) and Oncomine, including 2,670 samples, which comprised 2,376
cancer tissues and 294 adjacent normal tissues. Eight of the 17
cohorts included tumor and normal samples. The IHC cohort comprised
190 GC samples and 20 adjacent tissue samples. The
clinicopathological characteristics of the patients are presented
in Table I.
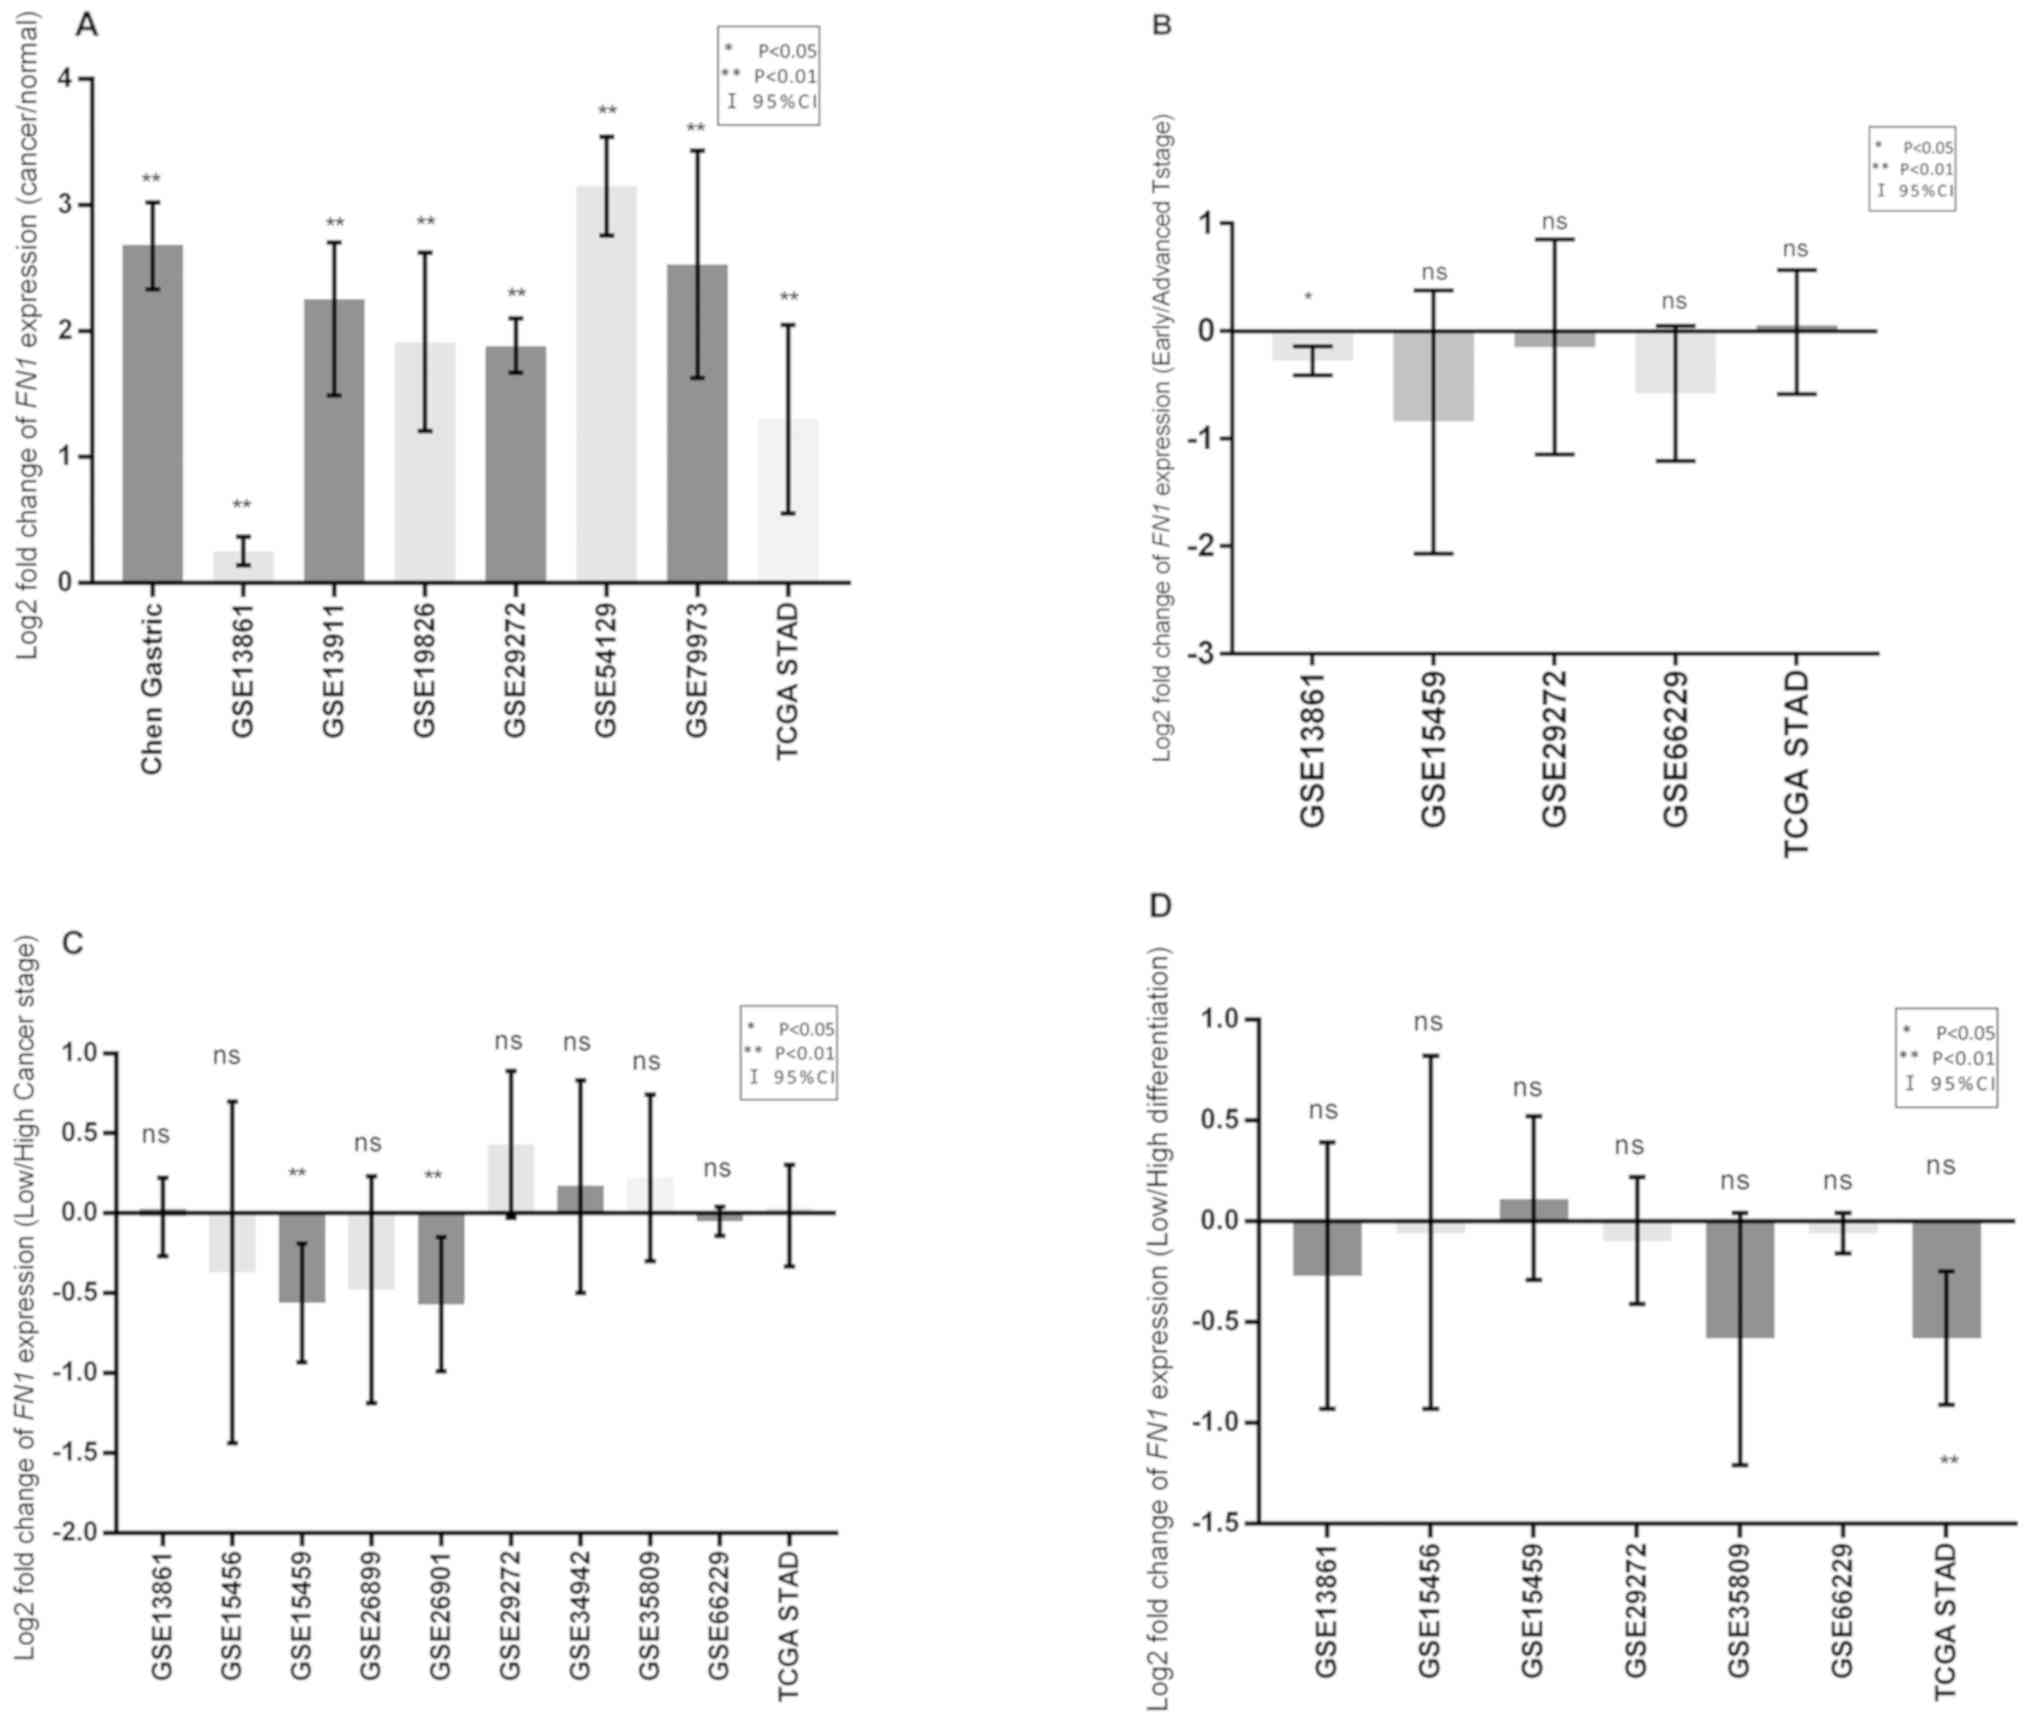
FN1 expression in gastric cancer
A total of eight independent cohorts that included
expression data from cancer and normal samples were analyzed; the
results revealed upregulated FN1 mRNA levels in tumor
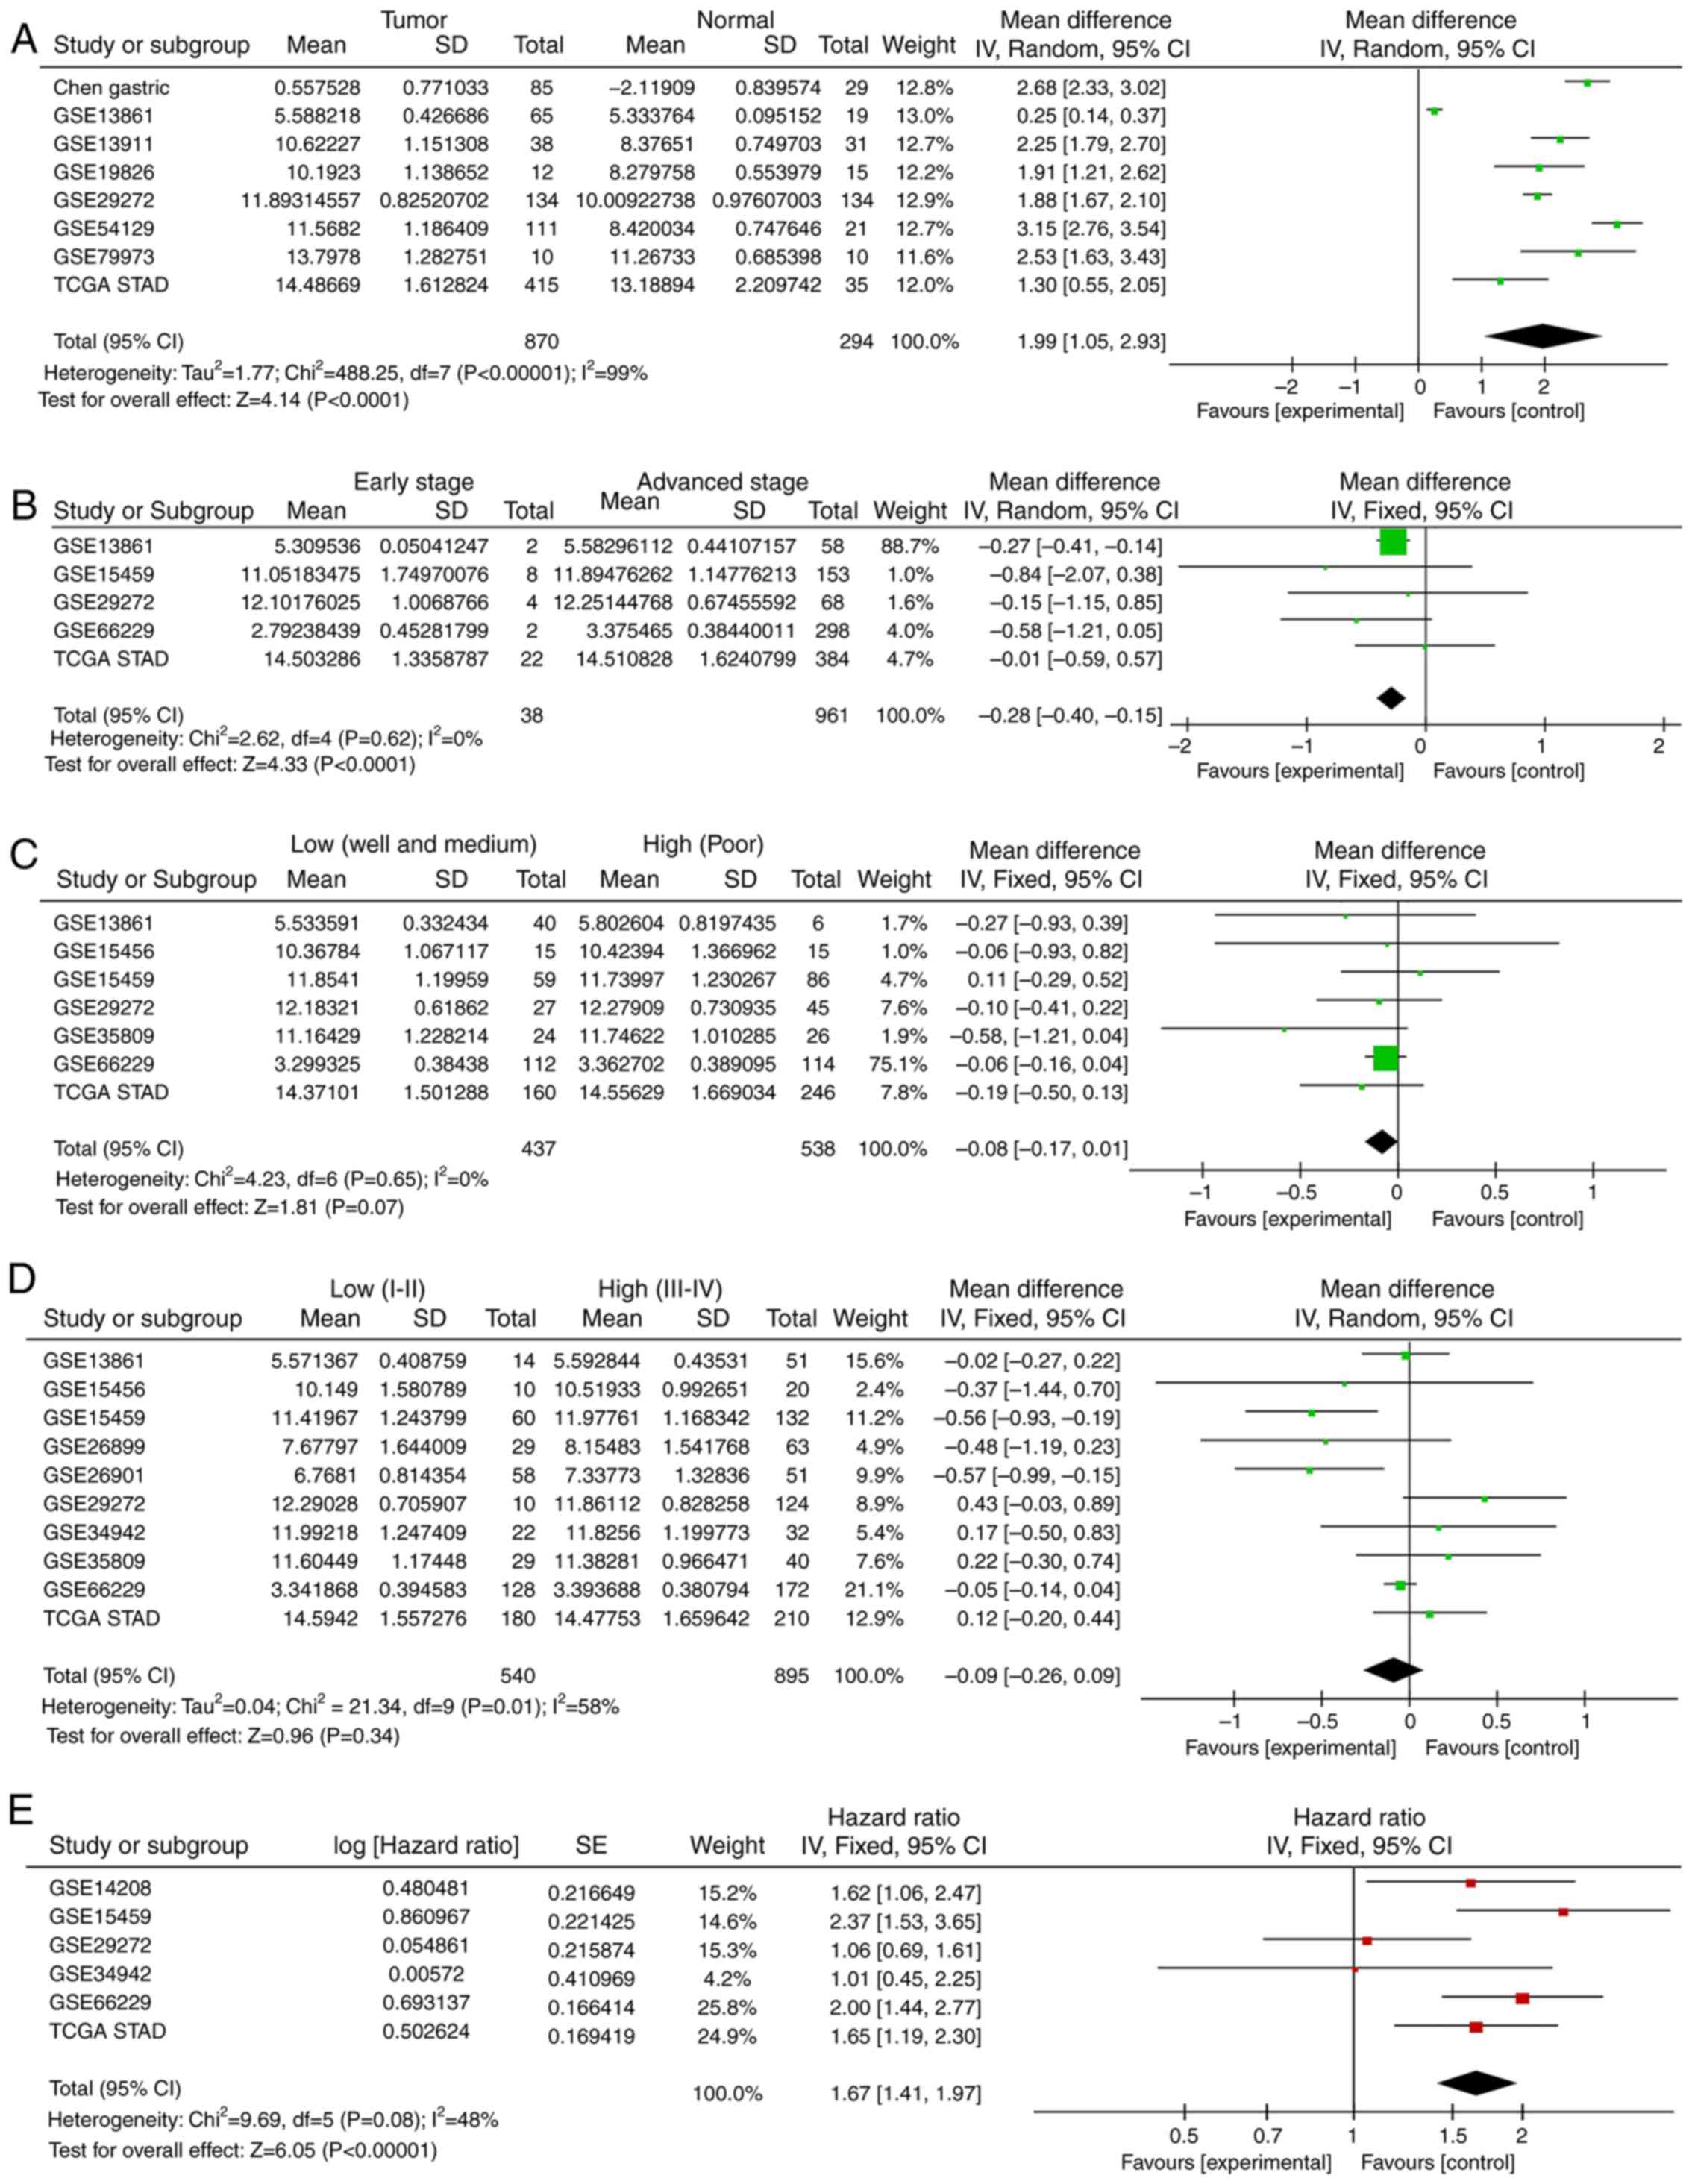
tissues compared with normal tissues (Fig. 1A). Meta-analysis of all the cohorts
revealed a significant combined mean difference of 1.99
(P<0.001; Fig. 2A). These results
indicated that FN1 expression was significantly higher in GC
tissues compared with that in adjacent normal tissues.
Association between FN1 expression and
clinicopathological factors
Compared with that in the early T stage (T1) group,
the expression of FN1 was significantly increased in the
advanced T stage (T2+T3+T4) group (P=0.002; Fig. 1B) in one cohort, which was further
confirmed by meta-analysis in all examined cohorts (P<0.001;
Fig. 2B). The expression of
FN1 was not associated with differentiation in any cohort
(Figs. 1C and 2C). Only two cohorts exhibited increased
FN1 expression in patients with high clinical
Tumor-Node-Metastasis (TNM) stage (36) (III + IV) compared with that in
patients with low clinical TNM stage (I + II) (Fig. 1D). No significant differences between
patients with high and low TNM stage were observed in the
meta-analysis of all cohorts (Fig.
2D).
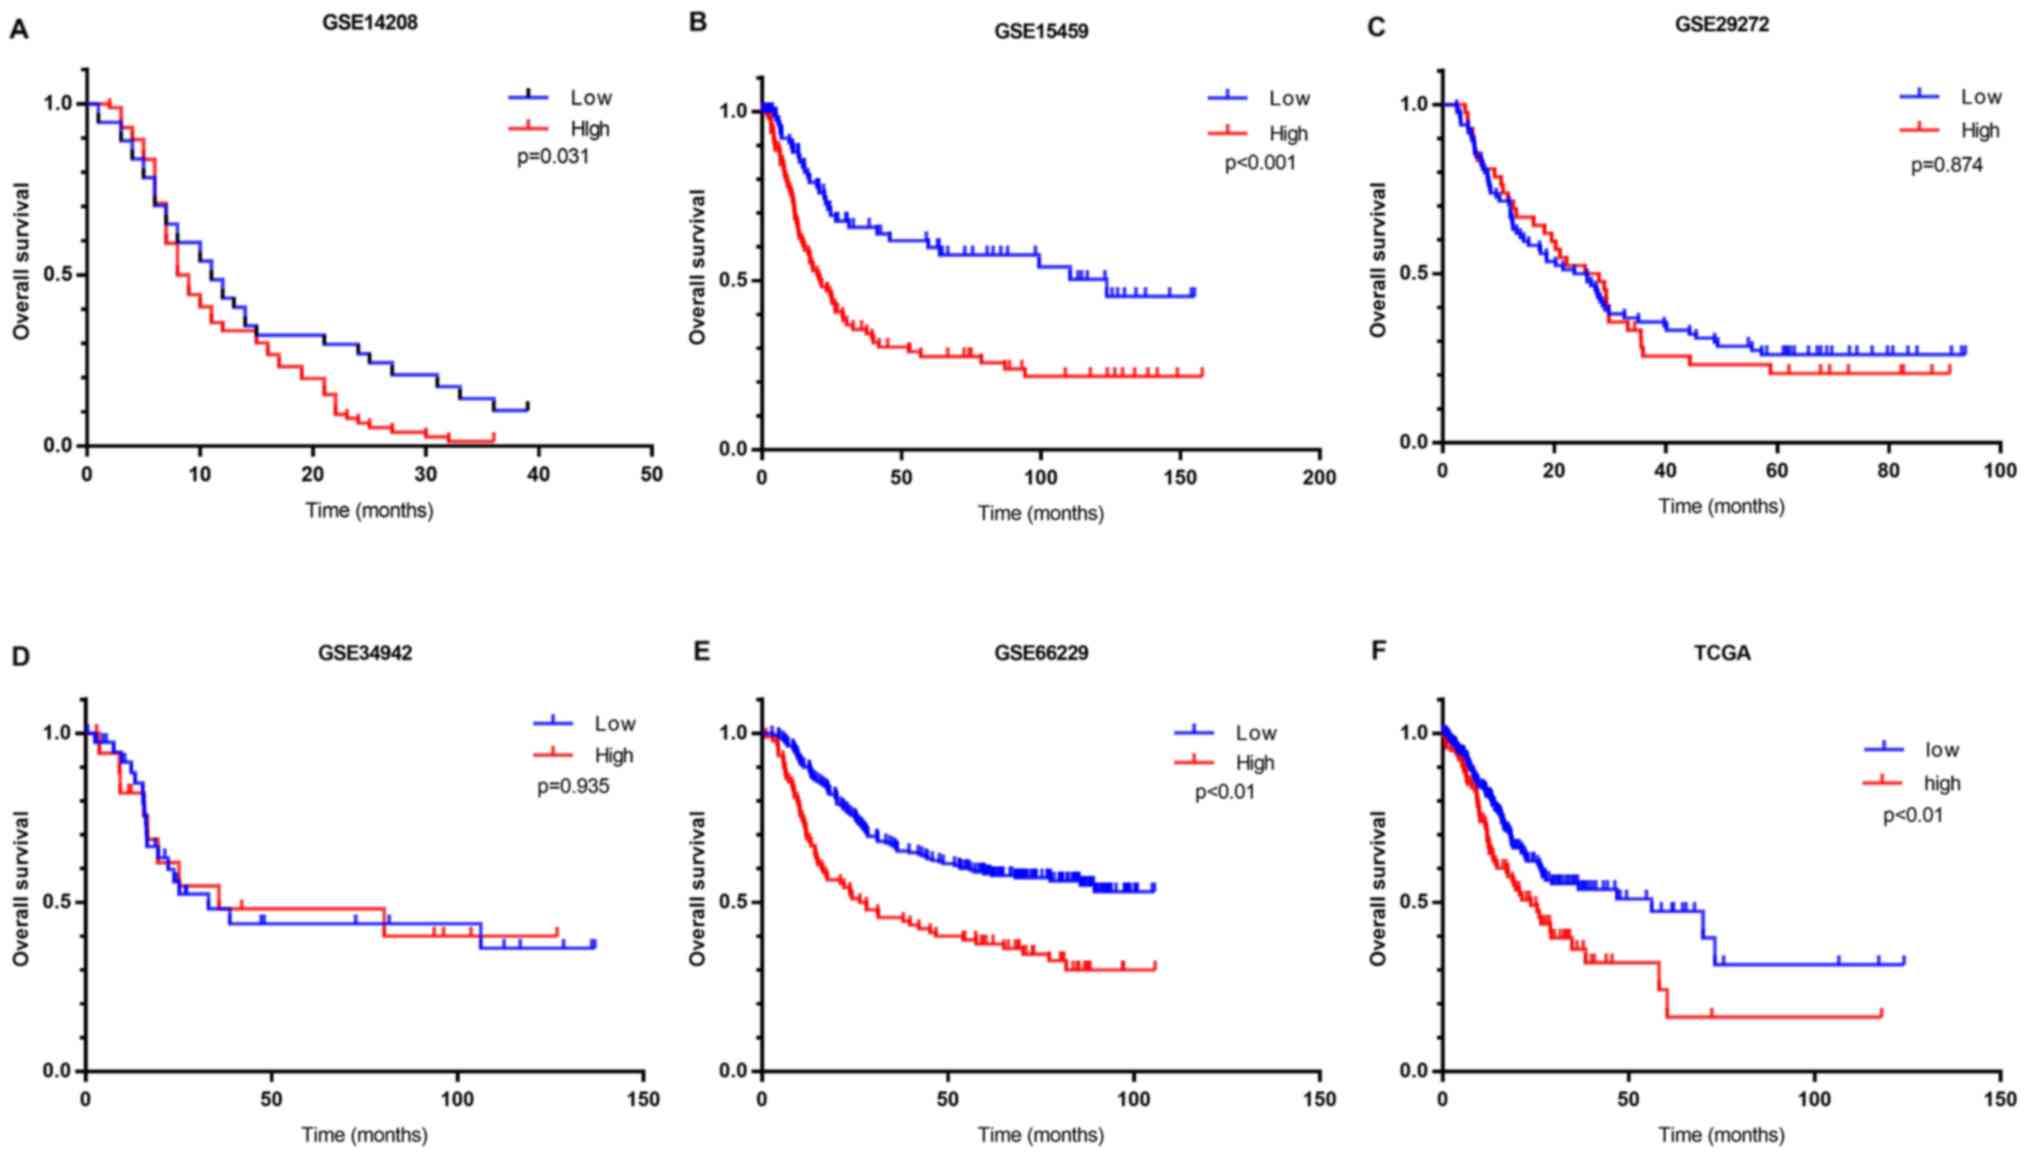
High FN1 expression level indicates
poor clinical outcomes
Kaplan-Meier survival analysis was performed using
clinical data. OS analysis demonstrated that high FN1
expression was associated with unfavorable prognosis compared with
low FN1 expression in four of the six cohorts containing
prognostic information (Fig. 3). A
meta-analysis of all cohorts validated this result, as it exhibited
a significant combined FN1 hazard ratio (HR) of 1.67
(P<0.001; Fig. 2E). This
indicated that the expression of FN1 is a potential
indicator of clinical outcome in patients with GC.
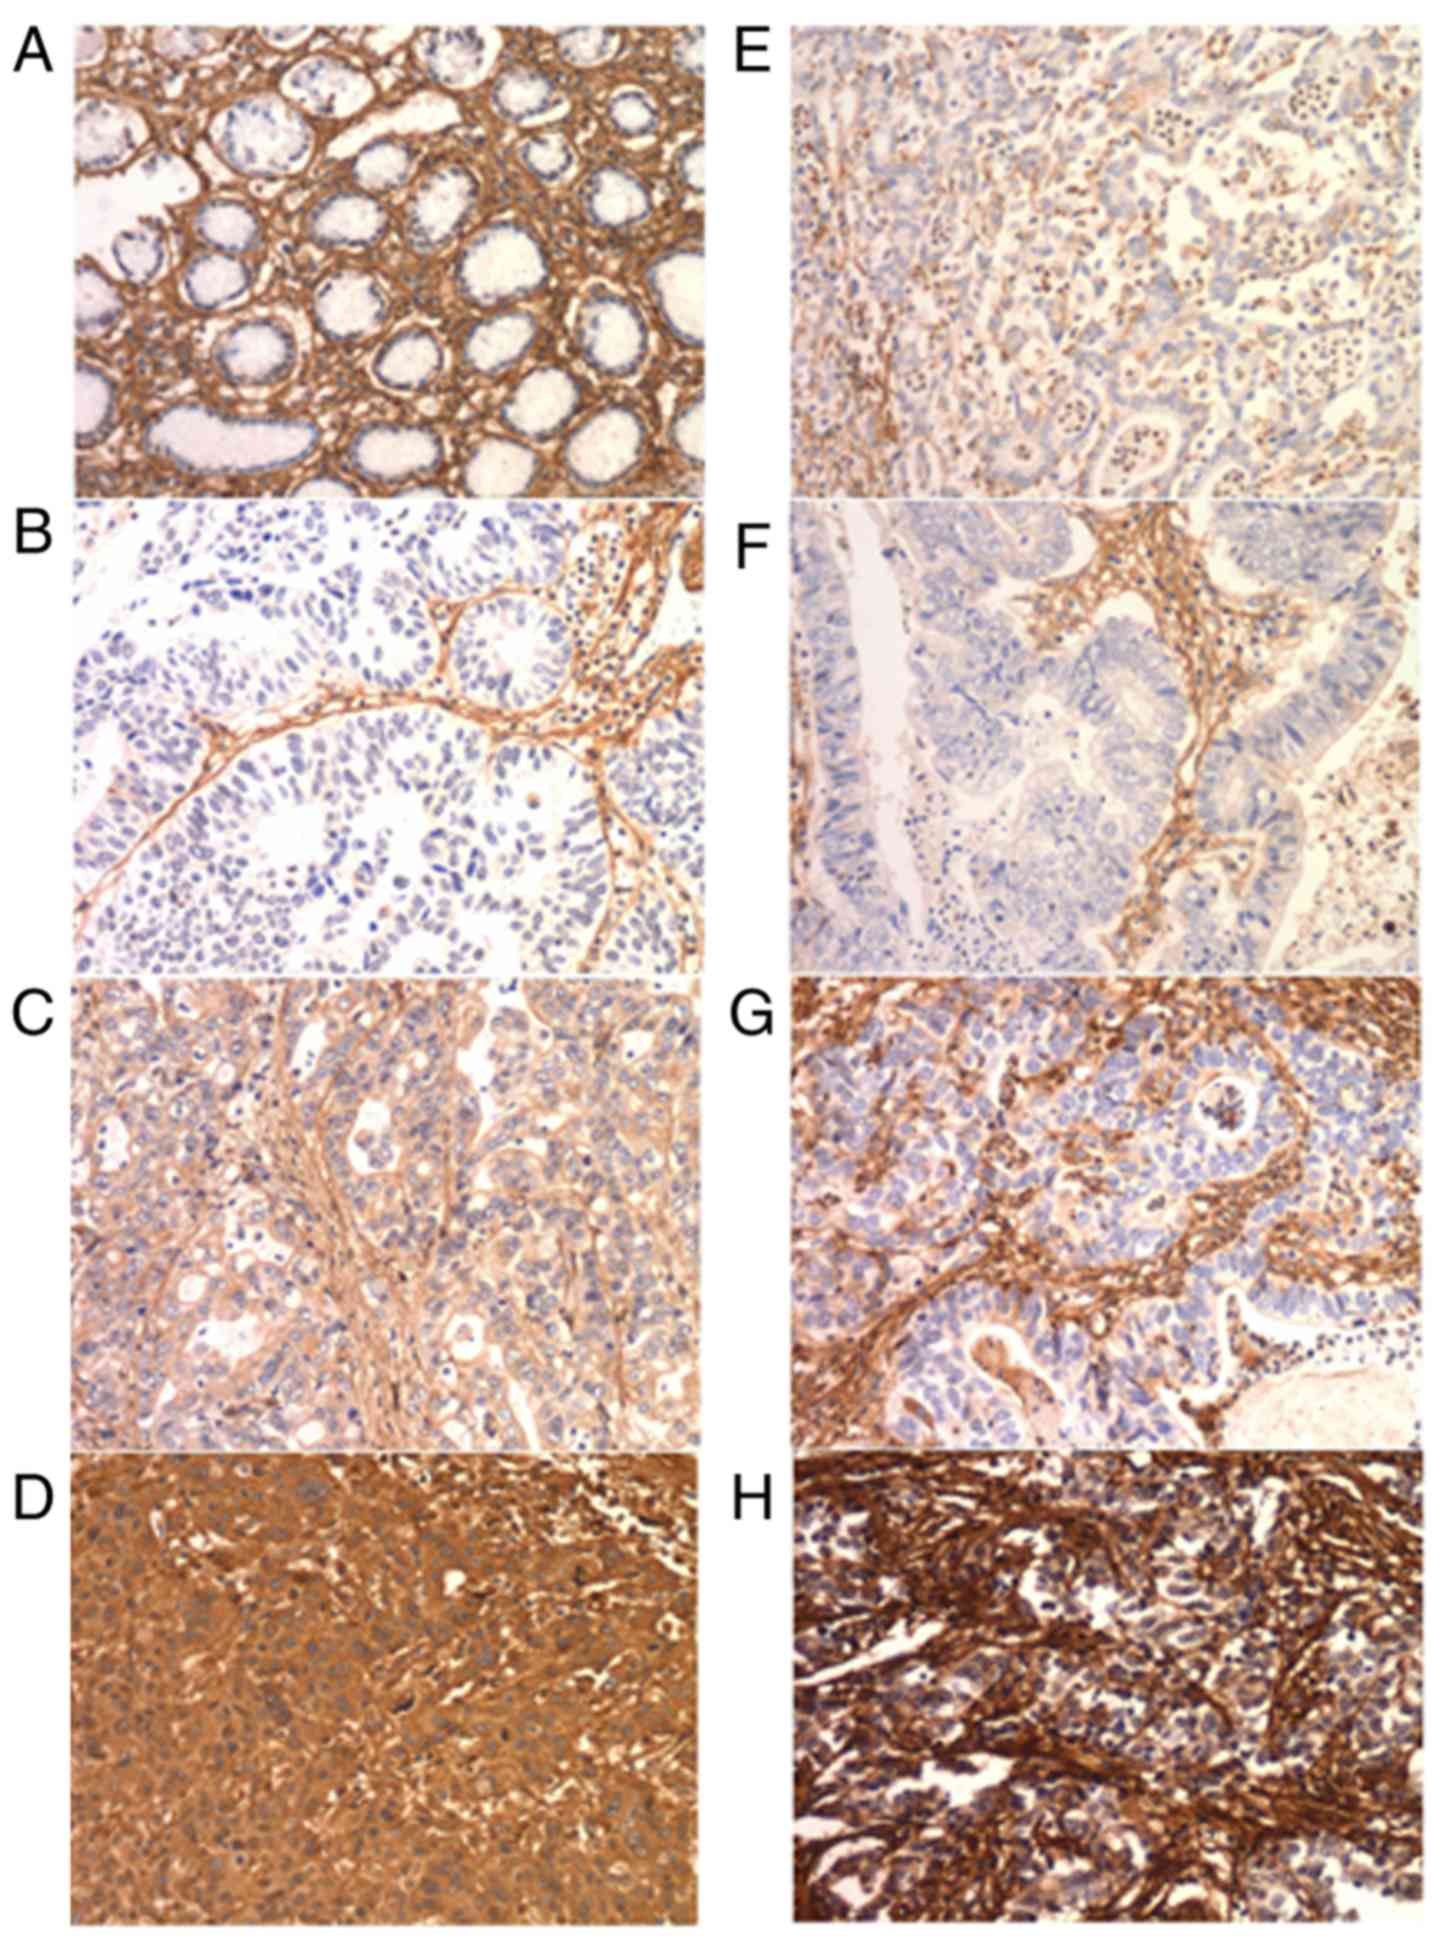
FN1 immunohistochemistry
FN1 is expressed in cancer cells and the
intratumoral matrix in GC (Fig. 4).
In the IHC cohort, normal epithelial cells exhibited no FN1
expression. E-FN1 expression was positive in 85 of the 190
cases (44.7%). S-FN expression was graded as no/weak in 11 (5.8%),
moderate in 71 (37.4%) and strong in 108 (56.8%) cases (Table II). No association was identified
between E-FN1 and S-FN1 expression (P=0.112; Table III). E-FN1 expression in GC
exhibited a significant association with tumor size (P=0.037),
whereas S-FN1 expression was associated with sex (P=0.027)
(Table II).
| Table II.Patient characteristics based on the
immunohistochemistry results of FN1 expression in gastric
cancer. |
Table II.
Patient characteristics based on the
immunohistochemistry results of FN1 expression in gastric
cancer.
|
|
| Expression of
E-FN1 (%) |
| Expression of
S-FN1 (%) |
|
|---|
|
|
|
|
|
|
|
|---|
| Characteristic | No. of patients
(n=190) | Negative
(n=85) | Positive
(n=105) | P-value | No/weak (n=11) | Moderate
(n=71) | Strong (n=108) | P-value |
|---|
| Sex |
|
|
| 0.380 |
|
|
| 0.027a |
|
Female | 46 | 18 (39.14) | 28 (60.9) |
| 0 (0.0) | 13 (28.3) | 33 (71.7) |
|
|
Male | 144 | 67 (46.5) | 77 (53.5) |
| 11 (7.6) | 58 (40.3) | 75 (52.1) |
|
| Age (years) |
|
|
| 0.508 |
|
|
| 0.361 |
|
<60 | 100 | 47 (47.0) | 53 (53.0) |
| 4 (4.0) | 41 (41.0) | 55 (55.0) |
|
|
≥60 | 90 | 38 (42.2) | 52 (57.8) |
| 7 (7.8) | 30 (33.3) | 53 (58.9) |
|
| Tumor diameter
(cm) |
|
|
| 0.037a |
|
|
| 0.639 |
|
<5 | 114 | 58 (50.9) | 56 (49.1) |
| 8 (7.0) | 41 (36.0) | 65 (57.0) |
|
| ≥5 | 76 | 27 (35.5) | 49 (64.5) |
| 3 (3.9) | 30 (39.5) | 43 (56.6) |
|
| T stage |
|
|
| 0.742 |
|
|
| 0.962 |
| T1 +
T2 | 47 | 22 (46.8) | 25 (53.2) |
| 3 (6.4) | 18 (38.3) | 26 (55.3) |
|
| T3 +
T4 | 143 | 63 (44.1) | 80 (55.9) |
| 8 (5.6) | 53 (37.1) | 82 (57.3) |
|
| N stage |
|
|
| 0.080 |
|
|
| 0.616 |
| N0 +
N1 | 112 | 56 (50.0) | 56 (50.0) |
| 8 (7.1) | 42 (37.5) | 62 (55.4) |
|
| N2 +
N3 | 78 | 29 (37.2) | 49 (62.8) |
| 3 (3.8) | 29 (37.2) | 46 (59.0) |
|
| TNM stage |
|
|
| 0.352 |
|
|
| 0.510 |
| I +
II | 89 | 43 (48.3) | 46 (51.7) |
| 7 (7.9) | 32 (36.0) | 50 (56.2) |
|
| III +
IV | 101 | 42 (41.6) | 59 (58.4) |
| 4 (4.0) | 39 (38.6) | 58 (57.4) |
|
| Table III.Association between epithelial and
stromal expression of FN1 in gastric cancer. |
Table III.
Association between epithelial and
stromal expression of FN1 in gastric cancer.
|
| Expression of
E-FN1 |
|
|
|---|
|
|
|
|
|
|---|
| Expression of
S-FN1 | Negative (%) | Positive (%) | Total (%) | P-value |
|---|
| No/Weak | 7 (63.6) | 4 (36.4) | 11 (5.8) |
|
| Moderate | 34 (47.9) | 37 (52.1) | 71 (37.4) |
|
| Strong | 44 (40.7) | 64 (59.3) | 108 (56.8) |
|
| Total (%) | 85 (100.0) | 105 (100.0) | 190 (100.0) | 0.112 |
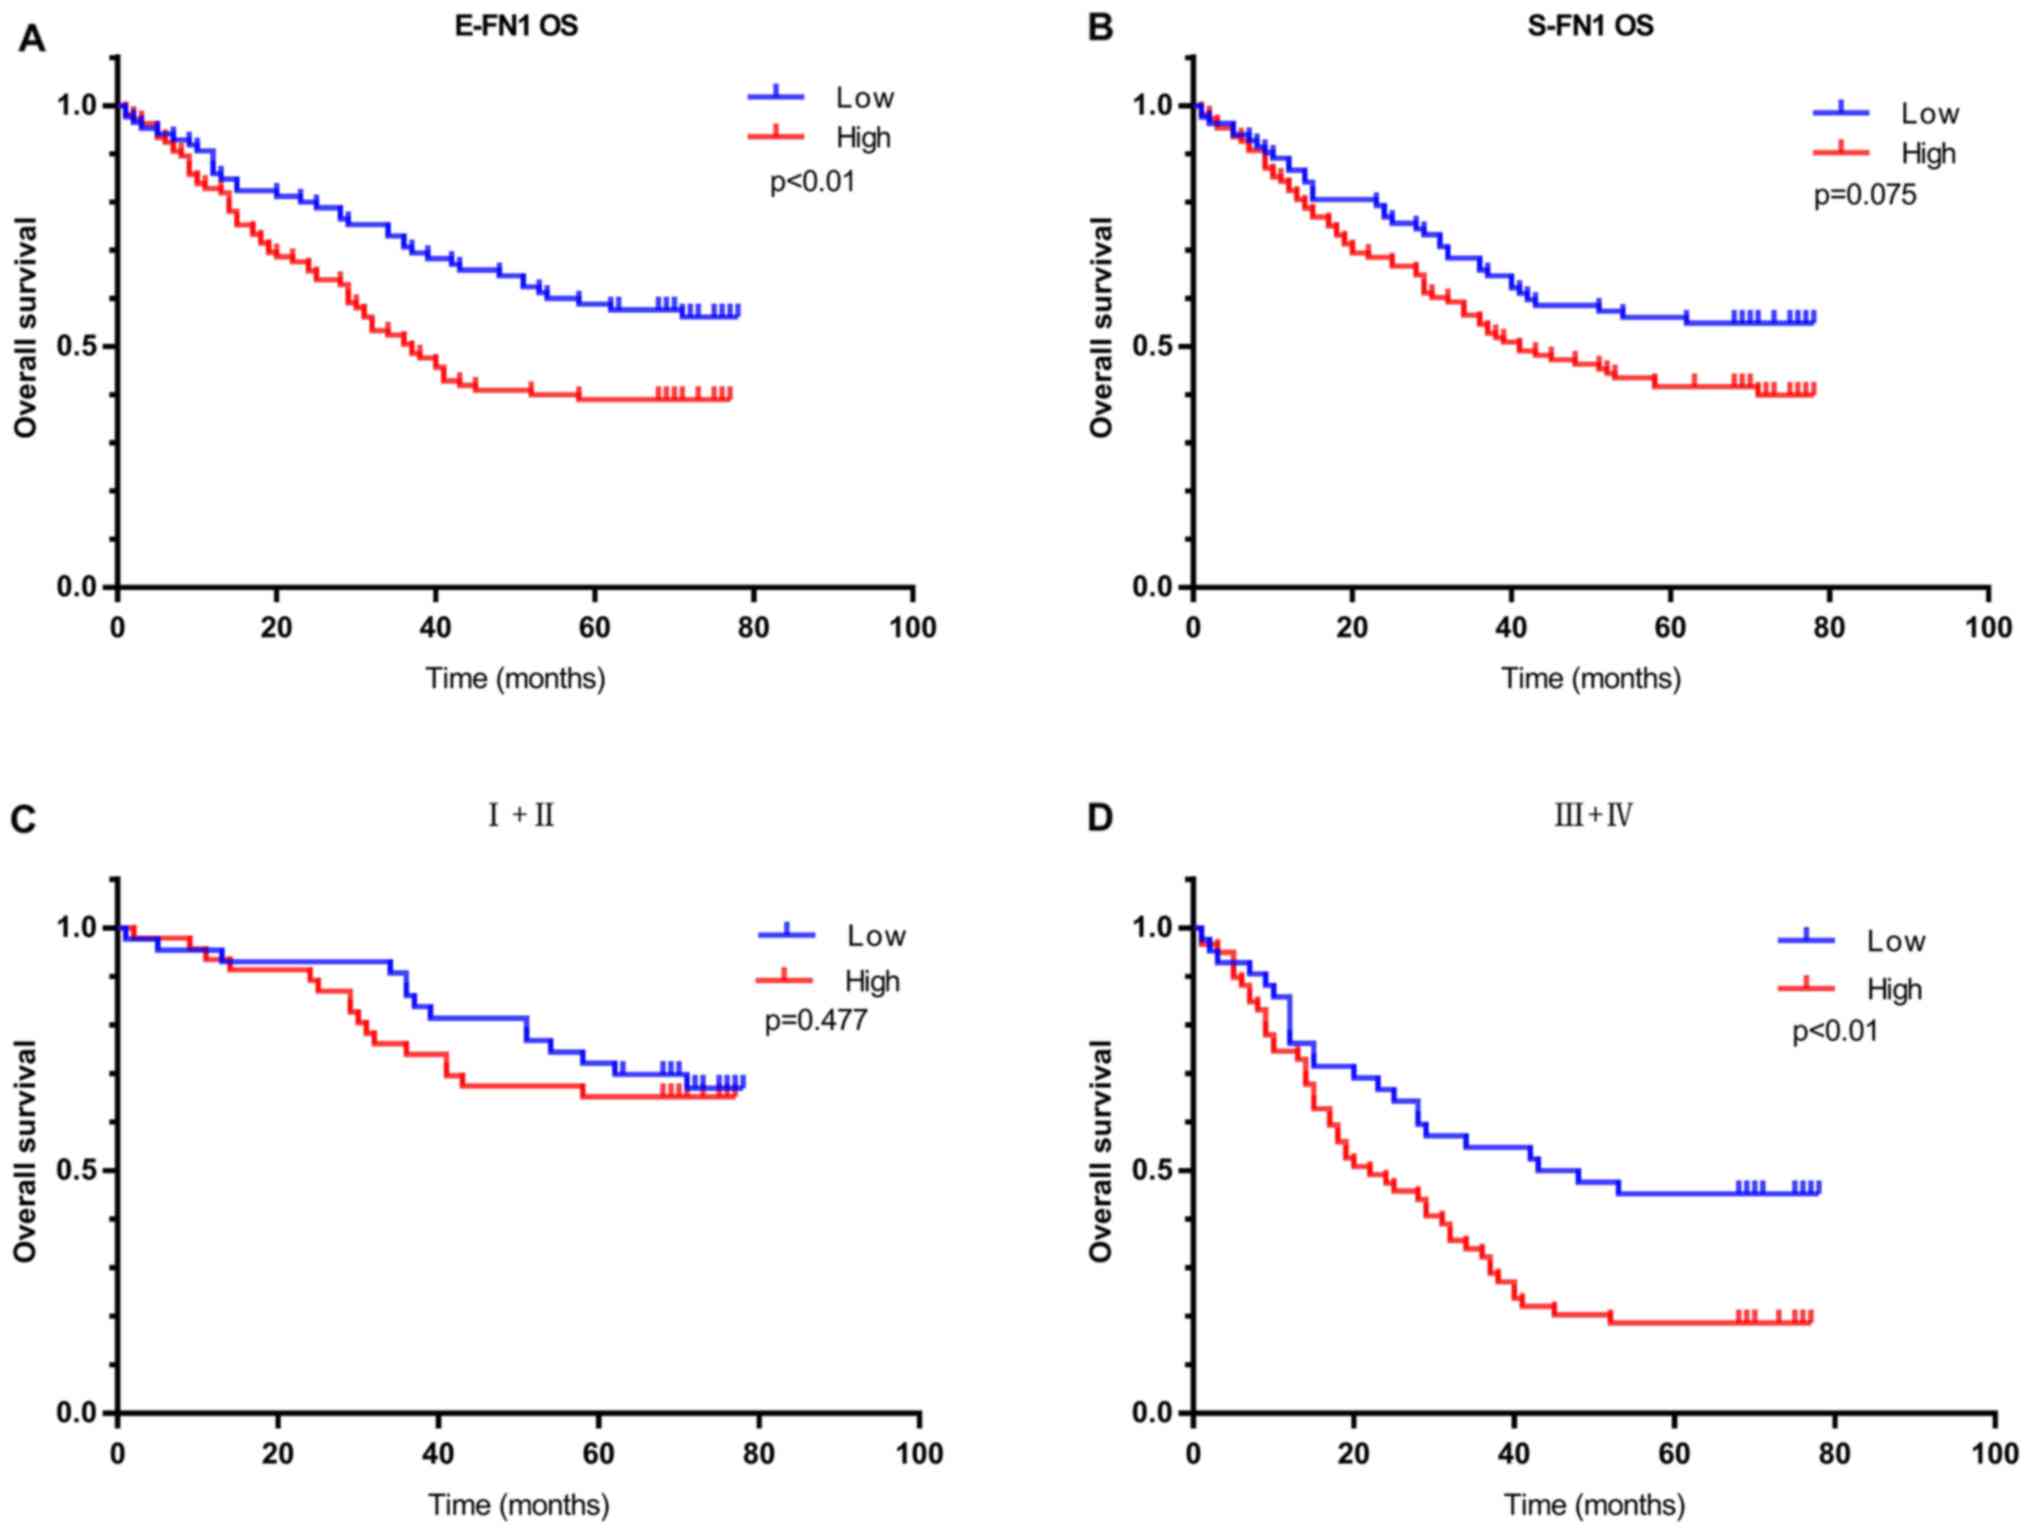
E-FN1-positive patients with GC in the IHC
cohort exhibited worse OS compared with E-FN1-negative
patients (P=0.009; Fig. 5A).
S-FN1 expression exhibited no significant effect on OS
(P=0.075, Fig. 5B). In addition, in
patients with high clinical TNM stage (III + IV), E-FN1
positivity was strongly associated with OS; however, in patients
with low clinical TNM stage (I + II), no difference was observed in
overall survival between patients with low and high E-FN1
expression (Fig. 5C and D).
E-FN1 was also confirmed as an independent predictor of
overall survival in GC by multivariate analysis (HR, 2.115; 95% CI,
1.343–3.333; P=0.001; Table
IV).
| Table IV.Multivariate analysis of overall
survival in 190 patients with gastric cancer. |
Table IV.
Multivariate analysis of overall
survival in 190 patients with gastric cancer.
|
|
| 95.0% CI for
HR |
|
|---|
|
|
|
|
|
|---|
| Characteristic | HR | Lower | Upper | P-value |
|---|
| E-FN1
expression |
|
|
| 0.001b |
|
Negative vs. positive | 2.115 | 1.343 | 3.333 |
|
| Tumor size |
|
|
| 0.083 |
| <5
cm vs. ≥5 cm | 1.442 | 0.954 | 2.181 |
|
| Tumor grade |
|
|
| 0.024a |
| Low +
intermediate vs. high | 1.286 | 1.034 | 1.601 |
|
| Depth of
invasion |
|
|
| 0.028a |
| T1+T2
vs. T3+T4 | 2.352 | 1.097 | 5.043 |
|
| TNM stage |
|
|
| 0.005b |
| I + II
vs. III + IV | 2.124 | 1.258 | 3.585 |
|
Discussion
In this study, FN1 gene expression was
analyzed in 17 independent GC cohorts. The results demonstrated an
increase in FN1 expression in GC compared with normal
tissues and a possible increase in the advanced T stage (T2+T3+T4)
group compared with that in the early T stage (T1) group in one
cohort; however, no association between FN1 expression
levels and differentiation or clinical TNM stage was identified. In
addition, upregulation of the FN1 gene may be a predictor of
poor prognosis following radical gastrectomy for GC. In summary,
the results of the present study support FN1 as a biomarker
of poor prognosis in GC.
FN1, which is an extracellular matrix
glycoprotein, is involved in cell proliferation, embryogenesis,
wound healing, host defense, epithelial-mesenchymal transition
(EMT) and metastasis, as well as oncogenic transformation (5). FN1 is involved in the occurrence
and development of various tumors and is upregulated in multiple
cancer types, such as esophageal squamous cell carcinoma,
colorectal cancer, OSCC, and thyroid cancer (8–10,14). For
instance, FN1 is upregulated in OSCC with lymph node
metastasis (LNM); FN1 increases the expression of vascular
endothelial growth factor C, lymphangiogenesis and LNM through FAK
activation and promotes EMT in SAS human OSCC cells (37). FN1 is a key mediator of glioma
progression, as its inhibition delays tumor progression and
immunosuppression through a mechanism that involves the maintenance
of integrin β1 FN receptors (38).
In GC, FN1 is highly expressed in tumor tissues compared
with that in non-tumor tissues, and knockdown of FN1
represses GC cell proliferation, adhesion and metastasis in
vitro (15). The present study
aimed to analyze the relationship between FN1 expression in
GC and clinicopathological factors and prognoses.
The results of the present study demonstrated that
the FN1 gene was upregulated in gastric cancer tissues
compared with that in normal tissues in eight cohorts, and these
data were confirmed by meta-analysis of combinations of all
datasets. This result was consistent with the results of Xu et
al (15) and Zhang et al
(16), who used immunohistochemical
methods to analyze tumor and normal tissue specimens from 40 and 52
patients with gastric cancer, respectively. In summary, previous
studies have reported that the expression of the FN1 gene
was increased in GC tissues compared with that in normal gastric
tissues, but the studies were all small-scale. The present study
used multiple cohorts to provide substantial validation of
increased FN1 expression in GC.
To the best of our knowledge, the association
between FN1 expression and clinicopathological features or
patient prognosis, have not been reported previously. In the
present study, compared with that in the early T stage group, the
expression of FN1 was significantly increased in the
advanced T stage group, which was further confirmed by
meta-analysis in all the examined groups. OS analysis revealed that
high FN1 expression was associated with unfavorable
prognosis in four of the six cohorts containing prognostic
information. A meta-analysis of all cohorts further validated this
finding. These results indicated that the expression of FN1
may be a potential indicator of clinical outcomes in patients with
GC.
FN1 is expressed in cancer cells and the
intratumoral matrix in GC. Hanamura et al (39) reported that the expression of
S-FN1 mRNA was positively correlated with deep invasion and
LNM of colon cancer. Bae et al (34) reported that E-FN1-positive
patients exhibited lower OS and disease-free survival compared with
FN1-negative breast cancer patients. E-FN1 was an
independent predictor for survival in breast cancer in multivariate
analysis, but the expression of S-FN1 had no significant
effect on patient survival (34). In
the present study, E-FN1-positive patients with GC exhibited
worse OS compared with E-FN1-negative patients, whereas
S-FN1 expression had no significant effect on OS. In
addition, in patients with high clinical TNM stage (III + IV),
E-FN1 positivity was strongly associated with OS. FN1
was also confirmed as an independent predictor of overall survival
in patients with GC by multivariate analysis.
Xu et al (15)
and Zhang et al (16)
demonstrated no FN1 expression in the stroma of gastric
cancer. In the IHC cohort of the present study, FN1 was
expressed in tumor cells and stromal cells, but not in normal
epithelial cells. No association was observed between E-FN1
and S-FN1. E-FN1 expression in GC was significantly
associated with tumor size. Soikkeli et al (40) reported that FN1 is required
for tumor and stromal cell growth. It may be speculated in large
tumors, the central region is likely to be necrotic, and the
expression of FN1 may promote the migration of tumor cells
and reduce necrosis.
In the present study, increased expression of the
FN1 gene at the protein and mRNA level in GC tissues was
observed; FN1 was highly expressed at the mRNA level in the
advanced T stage group compared with that in the early T stage
group, and the expression of FN1 at the protein level was
positively associated with tumor size. In addition, FN1
expression at the protein and mRNA level was a predictor of poor
prognosis following radical resection of GC. In conclusion, the
expression of FN1 in GC tissues may be upregulated, and
FN1 may be a biomarker of poor prognosis in patients with
GC.
Acknowledgements
Not applicable.
Funding
Not applicable.
Availability of data and materials
The datasets used and analyzed during the current
study are available from the corresponding author upon reasonable
request.
Authors' contributions
YS wrote the manuscript and performed the majority
of the experiments. CZ and YS participated in the study design,
data acquisition and revision of the manuscript. YL and YH
performed immunohistochemistry scoring, followed up the patients
and collected clinical information. YY, HM and ZW analyzed the
data. All authors read and approved the final manuscript.
Ethics approval and consent to
participate
Written informed consent was obtained from all
patients, and the study was approved by the Biomedical Ethics
Committee of The First Affiliated Hospital of Zhengzhou
University.
Patient consent for publication
Patients provided their consent for publication.
Competing interests
The authors declare that they have no competing
interests.
References
|
1
|
Bray F, Ferlay J, Soerjomataram I, Siegel
RL, Torre LA and Jemal A: Global cancer statistics 2018: GLOBOCAN
estimates of incidence and mortality worldwide for 36 cancers in
185 countries. CA Cancer J Clin. 68:394–424. 2018. View Article : Google Scholar : PubMed/NCBI
|
|
2
|
Chen W, Zheng R, Baade PD, Zhang S, Zeng
H, Bray F, Jemal A, Yu XQ and He J: Cancer statistics in China,
2015. CA Cancer J Clin. 66:115–132. 2016. View Article : Google Scholar : PubMed/NCBI
|
|
3
|
Katai H, Ishikawa T, Akazawa K, Isobe Y,
Miyashiro I, Oda I, Tsujitani S, Ono H, Tanabe S, Fukagawa T, et
al: Five-year survival analysis of surgically resected gastric
cancer cases in Japan: A retrospective analysis of more than
100,000 patients from the nationwide registry of the Japanese
gastric cancer association (2001–2007). Gastric Cancer. 21:144–154.
2018. View Article : Google Scholar : PubMed/NCBI
|
|
4
|
Peng PL, Zhou XY, Yi GD, Chen PF, Wang F
and Dong WG: Identification of a novel gene pairs signature in the
prognosis of gastric cancer. Cancer Med. 7:344–350. 2018.
View Article : Google Scholar : PubMed/NCBI
|
|
5
|
Pankov R and Yamada KM: Fibronectin at a
glance. J Cell Sci. 115:3861–3863. 2002. View Article : Google Scholar : PubMed/NCBI
|
|
6
|
Plow EF, Haas TA, Zhang L, Loftus J and
Smith JW: Ligand binding to integrins. J Biol Chem.
275:21785–21788. 2000. View Article : Google Scholar : PubMed/NCBI
|
|
7
|
Korah R, Boots M and Wieder R: Integrin
alpha5beta1 promotes survival of growth-arrested breast cancer
cells: An in vitro paradigm for breast cancer dormancy in bone
marrow. Cancer Res. 64:4514–4522. 2004. View Article : Google Scholar : PubMed/NCBI
|
|
8
|
Xiao J, Yang W, Xu B, Zhu H, Zou J, Su C,
Rong J, Wang T and Chen Z: Expression of fibronectin in esophageal
squamous cell carcinoma and its role in migration. BMC Cancer.
18:9762018. View Article : Google Scholar : PubMed/NCBI
|
|
9
|
Cai X, Liu C, Zhang TN, Zhu YW, Dong X and
Xue P: Down-regulation of FN1 inhibits colorectal
carcinogenesis by suppressing proliferation, migration, and
invasion. J Cell Biochem. 119:4717–4728. 2018. View Article : Google Scholar : PubMed/NCBI
|
|
10
|
Nakagawa Y, Nakayama H, Nagata M, Yoshida
R, Kawahara K, Hirosue A, Tanaka T, Yuno A, Matsuoka Y, Kojima T,
et al: Overexpression of fibronectin confers cell adhesion-mediated
drug resistance (CAM-DR) against 5-FU in oral squamous cell
carcinoma cells. Int J Oncol. 44:1376–1384. 2014. View Article : Google Scholar : PubMed/NCBI
|
|
11
|
Wang J, Deng L, Huang J, Cai R, Zhu X, Liu
F, Wang Q, Zhang J and Zheng Y: High expression of fibronectin 1
suppresses apoptosis through the NF-κB pathway and is associated
with migration in nasopharyngeal carcinoma. Am J Transl Res.
9:4502–4511. 2017.PubMed/NCBI
|
|
12
|
Lou X, Han X, Jin C, Tian W, Yu W, Ding D,
Cheng L, Huang B, Jiang H and Lin B: SOX2 targets fibronectin 1 to
promote cell migration and invasion in ovarian cancer: New
molecular leads for therapeutic intervention. OMICS. 17:510–518.
2013. View Article : Google Scholar : PubMed/NCBI
|
|
13
|
Waalkes S, Atschekzei F, Kramer MW,
Hennenlotter J, Vetter G, Becker JU, Stenzl A, Merseburger AS,
Schrader AJ, Kuczyk MA and Serth J: Fibronectin 1 mRNA expression
correlates with advanced disease in renal cancer. BMC Cancer.
10:5032010. View Article : Google Scholar : PubMed/NCBI
|
|
14
|
Sponziello M, Rosignolo F, Celano M,
Maggisano V, Pecce V, De Rose RF, Lombardo GE, Durante C, Filetti
S, Damante G, et al: Fibronectin-1 expression is increased in
aggressive thyroid cancer and favors the migration and invasion of
cancer cells. Mol Cell Endocrinol. 431:123–132. 2016. View Article : Google Scholar : PubMed/NCBI
|
|
15
|
Xu TP, Huang MD, Xia R, Liu XX, Sun M, Yin
L, Chen WM, Han L, Zhang EB, Kong R, et al: Decreased expression of
the long non-coding RNA FENDRR is associated with poor prognosis in
gastric cancer and FENDRR regulates gastric cancer cell metastasis
by affecting fibronectin1 expression. J Hematol Oncol. 7:632014.
View Article : Google Scholar : PubMed/NCBI
|
|
16
|
Zhang H, Sun Z, Li Y, Fan D and Jiang H:
MicroRNA-200c binding to FN1 suppresses the proliferation,
migration and invasion of gastric cancer cells. Biomed
Pharmacother. 88:285–292. 2017. View Article : Google Scholar : PubMed/NCBI
|
|
17
|
Wang W, Chin-Sheng H, Kuo LJ, Wei PL, Lien
YC, Lin FY, Liu HH, Ho YS, Wu CH and Chang YJ: NNK enhances cell
migration through alpha7-nicotinic acetylcholine receptor
accompanied by increased of fibronectin expression in gastric
cancer. Ann Surg Oncol. 19 (Suppl):S580–S588. 2012. View Article : Google Scholar : PubMed/NCBI
|
|
18
|
Cho JY, Lim JY, Cheong JH, Park YY, Yoon
SL, Kim SM, Kim SB, Kim H, Hong SW, Park YN, et al: Gene expression
signature-based prognostic risk score in gastric cancer. Clin
Cancer Res. 17:1850–1857. 2011. View Article : Google Scholar : PubMed/NCBI
|
|
19
|
D'Errico M, de Rinaldis E, Blasi MF, Viti
V, Falchetti M, Calcagnile A, Sera F, Saieva C, Ottini L, Palli D,
et al: Genome-wide expression profile of sporadic gastric cancers
with microsatellite instability. Eur J Cancer. 45:461–469. 2009.
View Article : Google Scholar
|
|
20
|
Kim HK, Choi IJ, Kim CG, Kim HS, Oshima A,
Michalowski A and Green JE: A gene expression signature of acquired
chemoresistance to cisplatin and fluorouracil combination
chemotherapy in gastric cancer patients. PLoS One. 6:e166942011.
View Article : Google Scholar : PubMed/NCBI
|
|
21
|
Ooi CH, Ivanova T, Wu J, Lee M, Tan IB,
Tao J, Ward L, Koo JH, Gopalakrishnan V, Zhu Y, et al: Oncogenic
pathway combinations predict clinical prognosis in gastric cancer.
PLoS Genet. 5:e10006762009. View Article : Google Scholar : PubMed/NCBI
|
|
22
|
Chia NY, Deng N, Das K, Huang D, Hu L, Zhu
Y, Lim KH, Lee MH, Wu J, Sam XX, et al: Regulatory crosstalk
between lineage-survival oncogenes KLF5, GATA4 and GATA6
cooperatively promotes gastric cancer development. Gut. 64:707–719.
2015. View Article : Google Scholar : PubMed/NCBI
|
|
23
|
Lei Z, Tan IB, Das K, Deng N, Zouridis H,
Pattison S, Chua C, Feng Z, Guan YK, Ooi CH, et al: Identification
of molecular subtypes of gastric cancer with different responses to
PI3-kinase inhibitors and 5-fluorouracil. Gastroenterology.
145:554–565. 2013. View Article : Google Scholar : PubMed/NCBI
|
|
24
|
Muratani M, Deng N, Ooi WF, Lin SJ, Xing
M, Xu C, Qamra A, Tay ST, Malik S, Wu J, et al: Nanoscale chromatin
profiling of gastric adenocarcinoma reveals cancer-associated
cryptic promoters and somatically acquired regulatory elements. Nat
Commun. 5:43612014. View Article : Google Scholar : PubMed/NCBI
|
|
25
|
Cristescu R, Lee J, Nebozhyn M, Kim KM,
Ting JC, Wong SS, Liu J, Yue YG, Wang J, Yu K, et al: Molecular
analysis of gastric cancer identifies subtypes associated with
distinct clinical outcomes. Nat Med. 21:449–456. 2015. View Article : Google Scholar : PubMed/NCBI
|
|
26
|
He J, Jin Y, Chen Y, Yao HB, Xia YJ, Ma
YY, Wang W and Shao QS: Downregulation of ALDOB is associated with
poor prognosis of patients with gastric cancer. Onco Targets Ther.
9:6099–6109. 2016. View Article : Google Scholar : PubMed/NCBI
|
|
27
|
Tao J, Deng NT, Ramnarayanan K, Huang B,
Oh HK, Leong SH, Lim SS, Tan IB, Ooi CH, Wu J, et al: CD44-SLC1A2
gene fusions in gastric cancer. Sci Transl Med. 3:77ra302011.
View Article : Google Scholar : PubMed/NCBI
|
|
28
|
Lee J, Sohn I, Do IG, Kim KM, Park SH,
Park JO, Park YS, Lim HY, Sohn TS, Bae JM, et al: Nanostring-based
multigene assay to predict recurrence for gastric cancer patients
after surgery. PLoS One. 9:e901332014. View Article : Google Scholar : PubMed/NCBI
|
|
29
|
Li WQ, Hu N, Burton VH, Yang HH, Su H,
Conway CM, Wang L, Wang C, Ding T, Xu Y, et al: PLCE1 mRNA and
protein expression and survival of patients with esophageal
squamous cell carcinoma and gastric adenocarcinoma. Cancer
Epidemiol Biomarkers Prev. 23:1579–1588. 2014. View Article : Google Scholar : PubMed/NCBI
|
|
30
|
Wang Q, Wen YG, Li DP, Xia J, Zhou CZ, Yan
DW, Tang HM and Peng ZH: Upregulated INHBA expression is associated
with poor survival in gastric cancer. Med Oncol. 29:77–83. 2012.
View Article : Google Scholar : PubMed/NCBI
|
|
31
|
Wang G, Hu N, Yang HH, Wang L, Su H, Wang
C, Clifford R, Dawsey EM, Li JM, Ding T, et al: Comparison of
global gene expression of gastric cardia and noncardia cancers from
a high-risk population in china. PLoS One. 8:e638262013. View Article : Google Scholar : PubMed/NCBI
|
|
32
|
Wu Y, Grabsch H, Ivanova T, Tan IB, Murray
J, Ooi CH, Wright AI, West NP, Hutchins GG, Wu J, et al:
Comprehensive genomic meta-analysis identifies intra-tumoural
stroma as a predictor of survival in patients with gastric cancer.
Gut. 62:1100–1111. 2013. View Article : Google Scholar : PubMed/NCBI
|
|
33
|
Sung CO, Park CK and Kim SH:
Classification of epithelial-mesenchymal transition phenotypes in
esophageal squamous cell carcinoma is strongly associated with
patient prognosis. Mod Pathol. 24:1060–1068. 2011. View Article : Google Scholar : PubMed/NCBI
|
|
34
|
Bae YK, Kim A, Kim MK, Choi JE, Kang SH
and Lee SJ: Fibronectin expression in carcinoma cells correlates
with tumor aggressiveness and poor clinical outcome in patients
with invasive breast cancer. Hum Pathol. 44:2028–2037. 2013.
View Article : Google Scholar : PubMed/NCBI
|
|
35
|
Sandsmark E, Andersen MK, Bofin AM,
Bertilsson H, Drablos F, Bathen TF, Rye MB and Tessem MB: SFRP4
gene expression is increased in aggressive prostate cancer. Sci
Rep. 7:142762017. View Article : Google Scholar : PubMed/NCBI
|
|
36
|
Washington K: 7th edition of the AJCC
cancer staging manual: Stomach. Ann Surg Oncol. 17:3077–3079. 2010.
View Article : Google Scholar : PubMed/NCBI
|
|
37
|
Morita Y, Hata K, Nakanishi M, Omata T,
Morita N, Yura Y, Nishimura R and Yoneda T: Cellular fibronectin 1
promotes VEGF-C expression, lymphangiogenesis and lymph node
metastasis associated with human oral squamous cell carcinoma. Clin
Exp Metastasis. 32:739–753. 2015. View Article : Google Scholar : PubMed/NCBI
|
|
38
|
Sengupta S, Nandi S, Hindi ES, Wainwright
DA, Han Y and Lesniak MS: Short hairpin RNA-mediated fibronectin
knockdown delays tumor growth in a mouse glioma model. Neoplasia.
12:837–847. 2010. View Article : Google Scholar : PubMed/NCBI
|
|
39
|
Hanamura N, Yoshida T, Matsumoto E,
Kawarada Y and Sakakura T: Expression of fibronectin and tenascin-C
mRNA by myofibroblasts, vascular cells and epithelial cells in
human colon adenomas and carcinomas. Int J Cancer. 73:10–15. 1997.
View Article : Google Scholar : PubMed/NCBI
|
|
40
|
Soikkeli J, Podlasz P, Yin M, Nummela P,
Jahkola T, Virolainen S, Krogerus L, Heikkila P, von Smitten K,
Saksela O and Hölttä E: Metastatic outgrowth encompasses COL-I,
FN1, and POSTN up-regulation and assembly to fibrillar
networks regulating cell adhesion, migration, and growth. Am J
Pathol. 177:387–403. 2010. View Article : Google Scholar : PubMed/NCBI
|