Introduction
Lung cancer is the leading cause of
cancer-associated mortality worldwide. In 2015, an estimated
221,200 new cases (115,610 in men and 105,590 in women) of lung and
bronchial cancer were diagnosed, and 158,040 deaths (86,380 in men
and 71,660 in women) were estimated to occur as a result of the
disease worldwide (1). Following
diagnosis, only 16.8% of all patients with lung cancer live beyond
5 years (2). This is primarily
attributed to the lack of early effective diagnostic measures and
high recurrence rates. Approximately 50% of patients are diagnosed
with advanced lung cancer, whose 5-year survival rate is <15%
(3–5).
Currently, molecular biomarkers are used to diagnose
lung cancer. ProGRP, SCC-Ag, Cyfra21-1 and CEA are widely used as
lung cancer serum biomarkers (6).
However, a meta-analysis study reported that the sensitivity levels
of ProGRP, SCC-Ag, Cyfra21-1 and CEA in the serum of patients with
lung cancer were <60% (6). Thus,
investigating the molecular mechanism underlying tumorigenesis, and
discovering new biomarkers can help improve diagnosis. In recent
years, a number of high-throughput platforms, such as microarray
technology, have been widely used to study gene expression during
tumorigenesis. Now, a new approach combined with microarray
technology and bioinformatics analysis allows the comprehensive
analysis of gene expression changes in non-small cell lung cancer
(NSCLC) (7–9).
In the present study, taking into account the
microarray results of false positives, three mRNA microarray
datasets were analyzed in order to investigate differentially
expressed genes (DEGs) between NSCLC and normal tissue. Gene
Ontology (GO) and pathway enrichment analysis were combined in
order to identify functional DEGs, followed by protein interaction
and survival analysis to identify hub genes in NSCLC.
Materials and methods
Microarray data
The Gene Expression Omnibus (GEO; http://www.ncbi.nlGSE18842m.nih.gov/geo)
is a public repository for the storage of data, such as microarray
and next-generation sequencing data, which is freely available to
users. The GEO database was used to obtain three gene expression
profiles. GSE18842, GSE30219 and GSE33532 (10–12) were
obtained from the GEO database. Experiments with the selected three
datasets were performed in the Affymetrix Human Genome U133 Plus
2.0 Array microarray platform (GPL570; version 2.0; Affymetrix;
Thermo Fisher Scientific, Inc.).
Identification of DEGs
GEO2R (13) is an
online interactive network tool that allows users to compare two or
more sets of samples in order to identify the DEGs in a GEO data
series. The results are presented as a table of genes ordered by
significance. The present study used GEO2R to screen DEGs between
NSCLC and normal lung samples. The adjusted P-values (adj. P) were
used to correct the occurrence of false positive results. The adj.
P<0.01 and |logFC| >1 were set as the cut-off criterion as an
indicator of significance.
GO and Kyoto Encyclopedia of Genes and
Genomes (KEGG) pathway enrichment analysis
The Database for Annotation, Visualization and
Integrated Discovery (DAVID; version 6.7; http://david.abcc.ncifcrf.gov) is an online
interactive tool that provides a comprehensive set of functional
annotation tools for researchers to understand the biological
meaning behind numerous different genes (7). The GO and KEGG pathway enrichment
analysis panels in the DAVID were applied in order to identify
DEGs. P<0.05 was set as the cut-off criterion for indicating
significance.
Protein-protein interaction (PPI)
network construction and module selection
The Search Tool for the Retrieval of Interacting
Genes (STRING; http://string.embl.de) database was
applied to construct a PPI network of DEGs (14). The confidence score ≥0.4 was set as
the cut-off criterion. Subsequently, the Molecular Complex
Detection (MCODE) panel in the Cytoscape software (version 3.7.2)
was applied to screen significant modules in the PPI network
(15). The degree cutoff=2, node
score cutoff=0.2, k-core=2, and max.depth=100 were set as the
cut-off criterion (16). The
functional enrichment analysis of genes in the selected module was
also performed by KEGG and GO panels in the DAVID.
Survival analysis and protein
expression in human NSCLC
Kaplan-Meier plotter (2018 version; http://kmplot.com/analysis) is an online,
meta-analysis-based web tool that is used for biomarker assessment.
The tool is capable of assessing the effect of 54,675 genes on
survival rate using 10,461 cancer samples. The present study used
this online tool to investigate the prognostic value of DEGs for
patients with NSCLC in a large public clinical microarray database
(http://kmplot.com/analysis/index.php?p=service&cancer=lung)
(17).
Protein expression in NSCLC tissues and normal lung
tissues was determined from The Human Protein Atlas (2018 version,
www.proteinatlas.org).
Results
Identification of DEGs
GSE18842 included 46 NSCLC samples and 45 normal
samples. GSE30219 consisted of 229 NSCLC cancer samples and 14
healthy lung samples. The array data of GSE33532 included 80 NSCLC
tissue samples and 20 normal samples. All samples were confirmed by
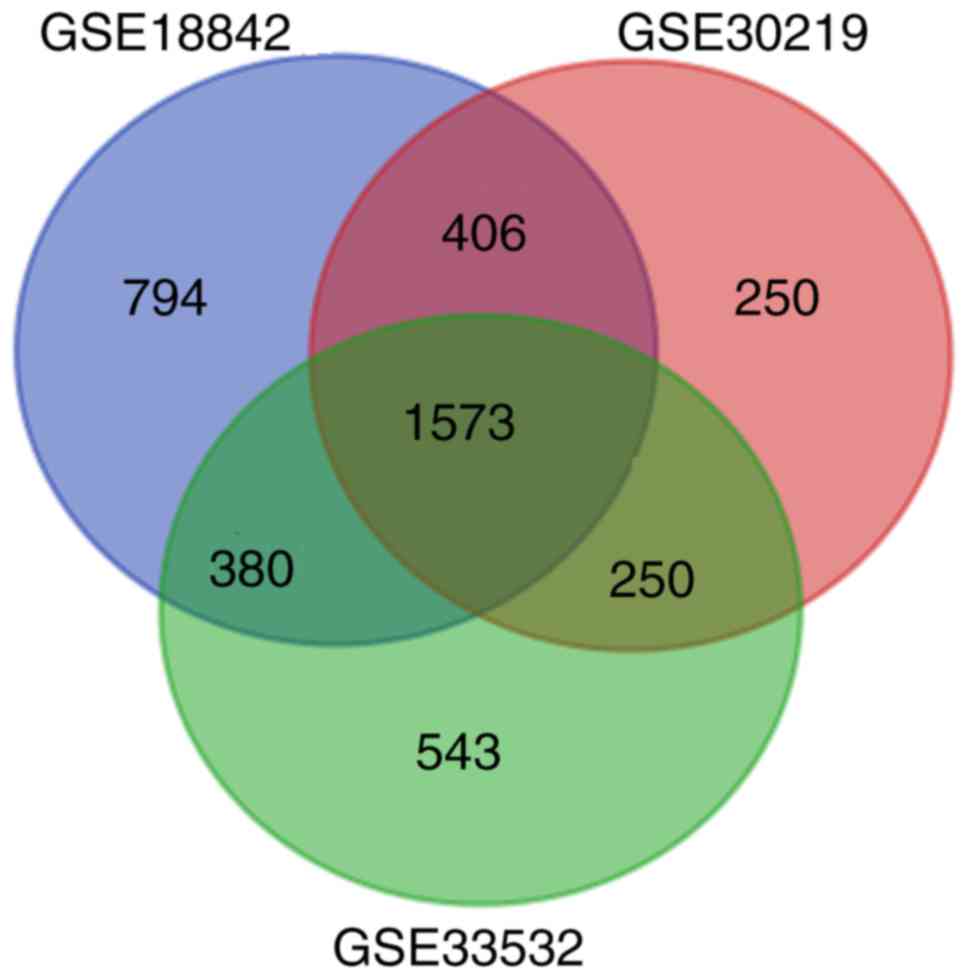
histopathology. Based on the GEO2R analysis, a total of 3,153,
2,479 and 2,746 DEGs were identified from the GSE18842, GSE30219
and GSE33532 datasets, respectively. A total of 1,573 genes were
screened out by taking an intersection of all three GEO datasets
(Fig. 1). Among them, 764 genes
exhibited the same trend in expression, consisting of 428
upregulated and 336 downregulated genes in NSCLC tissues compared
with normal lung tissues (Table
SI).
GO and KEGG pathway enrichment
analysis
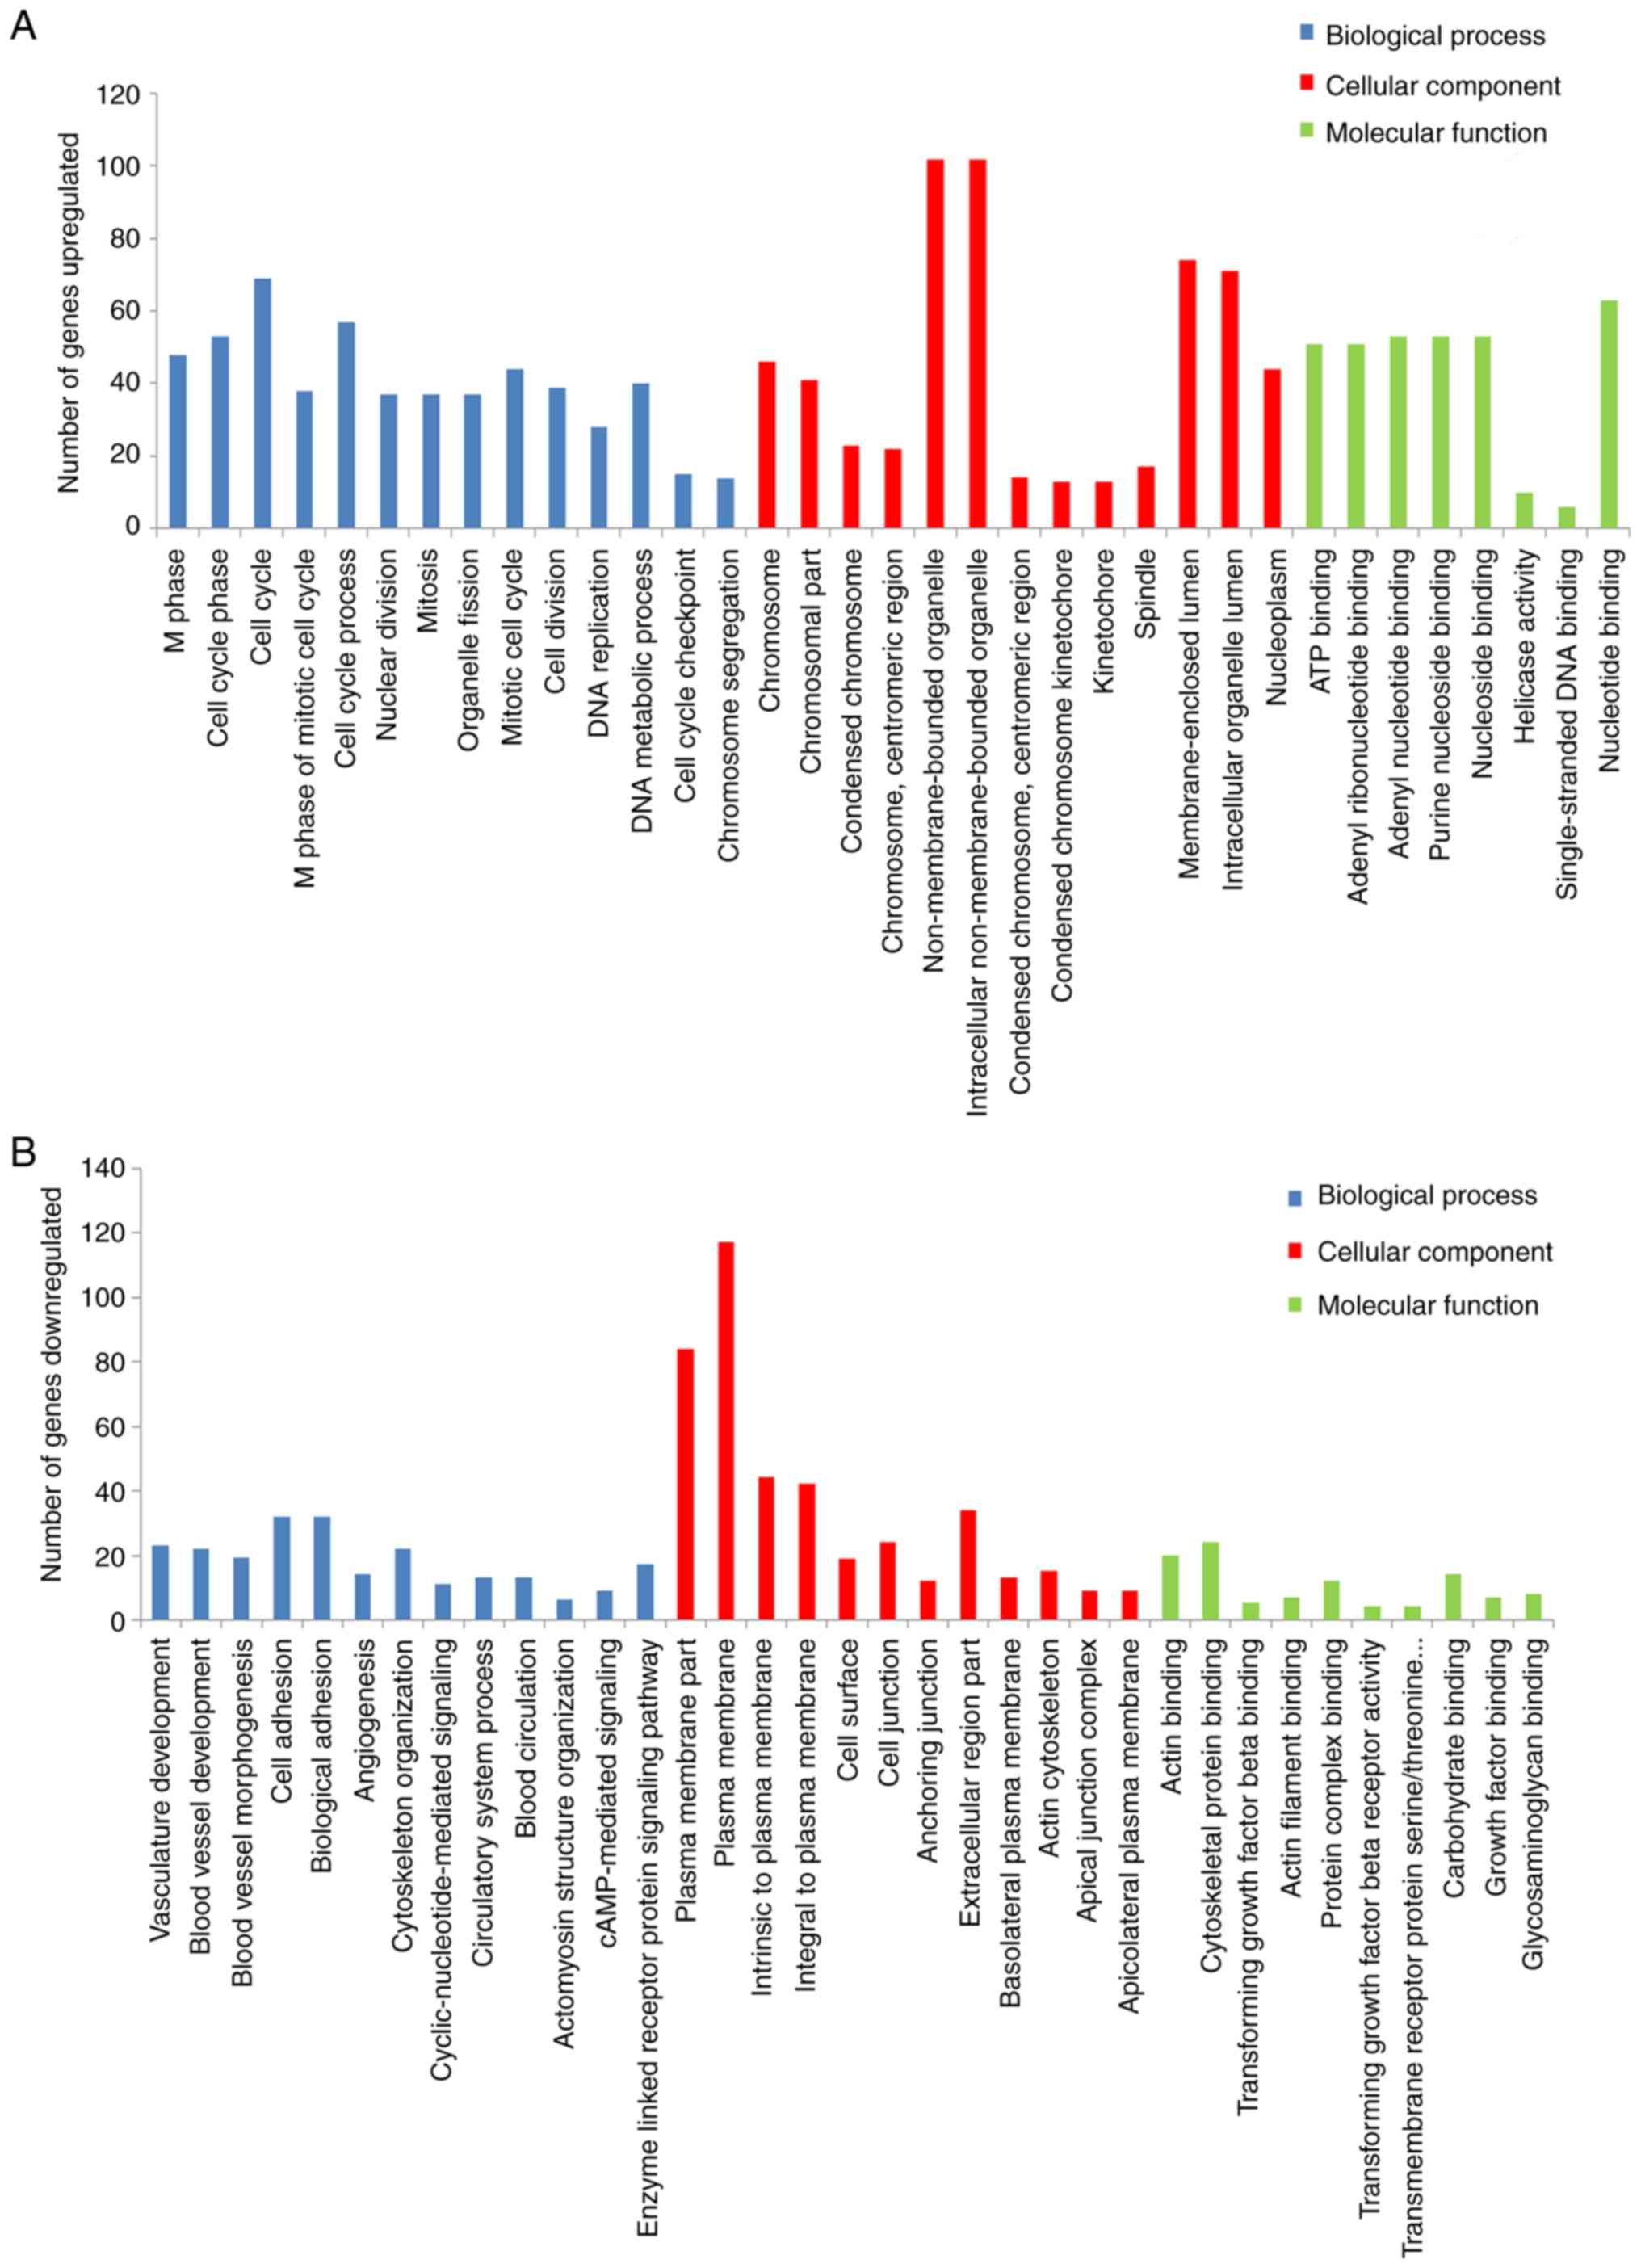
In order to further determine the function of DEGs,
the present study used the DAVID for the functional and pathway
enrichment analysis. The GO analysis revealed that upregulated DEGs
were primarily involved in ‘M phase’ and ‘cell cycle phase’, while
downregulated DEGs were primarily involved in ‘plasma membrane
part’, and ‘vasculature development’. Notably, the KEGG pathways
analysis demonstrated that upregulated DEGs were enriched in the
‘cell cycle’, ‘p53 signaling pathway’ and ‘DNA replication’,
(Fig. 2A and Table I) while downregulated DEGs were
enriched in ‘vascular smooth muscle contraction’, ‘cell adhesion
molecules’ and ‘tight junction’ (Fig.
2B and Table I). Overall, a
total of 115 genes were enriched, including 68 upregulated DEGs and
47 downregulated DEGs (Table SII).
The 115 genes were used for further PPI analysis.
 | Table I.GO and KEGG pathway enrichment
analysis of upregulated and downregulated genes. |
Table I.
GO and KEGG pathway enrichment
analysis of upregulated and downregulated genes.
| (A)
Upregulated |
|---|
|
|---|
| Term | Function | Gene count | % | P-value |
|---|
| GO:0000279 | M phase | 48 | 12.8 |
1.00×10⁻²⁴ |
| GO:0022403 | Cell cycle
phase | 53 | 14.1 |
1.30×10⁻²⁴ |
| GO:0007049 | Cell cycle | 69 | 18.4 |
5.70×10⁻²³ |
| GO:0000087 | M phase of mitotic
cell cycle | 38 | 10.1 |
8.10×10⁻²² |
| GO:0022402 | Cell cycle
process | 57 | 15.2 |
2.10×10⁻²¹ |
| GO:0005694 | Chromosome | 46 | 12.3 |
2.20×10⁻¹⁷ |
| GO:0044427 | Chromosomal
part | 41 | 10.9 |
2.20×10⁻¹⁶ |
| GO:0000793 | Condensed
chromosome | 23 | 6.1 |
8.10×10⁻¹⁴ |
| GO:0000775 | Chromosome,
centromeric region | 22 | 5.9 |
3.50×10⁻¹³ |
| GO:0043228 |
Non-membrane-bounded organelle | 102 | 27.2 |
1.20×10⁻⁹ |
| GO:0005524 | ATP binding | 51 | 13.6 |
3.00×10⁻⁴ |
| GO:0032559 | Adenyl
ribonucleotide binding | 51 | 13.6 |
4.10×10⁻⁴ |
| GO:0030554 | Adenyl nucleotide
binding | 53 | 14.1 |
4.20×10⁻⁴ |
| GO:0001883 | Purine nucleoside
binding | 53 | 14.1 |
6.00×10⁻⁴ |
| GO:0001882 | Nucleoside
binding | 53 | 14.1 |
7.00×10⁻⁴ |
| KEGG:hsa04110 | Cell cycle | 20 | 5.3 |
7.70×10⁻¹¹ |
| KEGG:hsa04115 | p53 signaling
pathway | 11 | 2.9 |
4.20×10⁻⁶ |
| KEGG:hsa03030 | DNA
replication | 7 | 1.9 |
1.90×10⁻⁴ |
| KEGG:hsa00670 | One carbon pool by
folate | 5 | 1.3 |
4.70×10⁻⁴ |
| KEGG:hsa04114 | Oocyte meiosis | 8 | 2.1 |
1.70×10⁻² |
|
| (B)
Downregulated |
|
| Term |
Function | Gene
count | % | P-value |
|
| GO:0044459 | Plasma membrane
part | 84 | 27.5 |
1.70×10⁻¹¹ |
| GO:0005886 | Plasma
membrane | 117 | 38.4 |
1.40×10⁻¹⁰ |
| GO:0001944 | Vasculature
development | 23 | 7.5 |
2.10×10⁻¹⁰ |
| GO:0001568 | Blood vessel
development | 22 | 7.2 |
8.40×10⁻¹⁰ |
| GO:0048514 | Blood vessel
morphogenesis | 19 | 6.2 |
1.50×10⁻⁸ |
| GO:0007155 | Cell adhesion | 32 | 10.5 |
6.40×10⁻⁷ |
| GO:0022610 | Biological
adhesion | 32 | 10.5 |
6.60×10⁻⁷ |
| GO:0003779 | Actin binding | 20 | 6.6 |
2.20×10⁻⁶ |
| GO:0008092 | Cytoskeletal
protein binding | 24 | 7.9 |
1.10×10⁻⁵ |
| GO:0050431 | Transforming growth
factor beta binding | 5 | 1.6 |
1.40×10⁻⁵ |
| GO:0031226 | Intrinsic to plasma
membrane | 44 | 14.4 |
2.20×10⁻⁵ |
| GO:0005887 | Integral to plasma
membrane | 42 | 13.8 |
6.20×10⁻⁵ |
| GO:0009986 | Cell surface | 19 | 6.2 |
8.20×10⁻⁵ |
| GO:0051015 | Actin filament
binding | 7 | 2.3 |
2.40×10⁻⁴ |
| GO:0032403 | Protein complex
binding | 12 | 3.9 |
4.40×10⁻⁴ |
| KEGG:hsa04270 | Vascular smooth
muscle contraction | 9 | 3.0 |
1.20×10⁻³ |
| KEGG:hsa04514 | Cell adhesion
molecules | 9 | 3.0 |
3.50×10⁻³ |
| KEGG:hsa05414 | Dilated
cardiomyopathy | 7 | 2.3 |
7.90×10⁻³ |
| KEGG:hsa04530 | Tight junction | 8 | 2.6 |
1.40×10⁻² |
| KEGG:hsa05410 | Hypertrophic
cardiomyopathy | 6 | 2.0 |
2.20×10⁻² |
PPI network construction and modules
selection
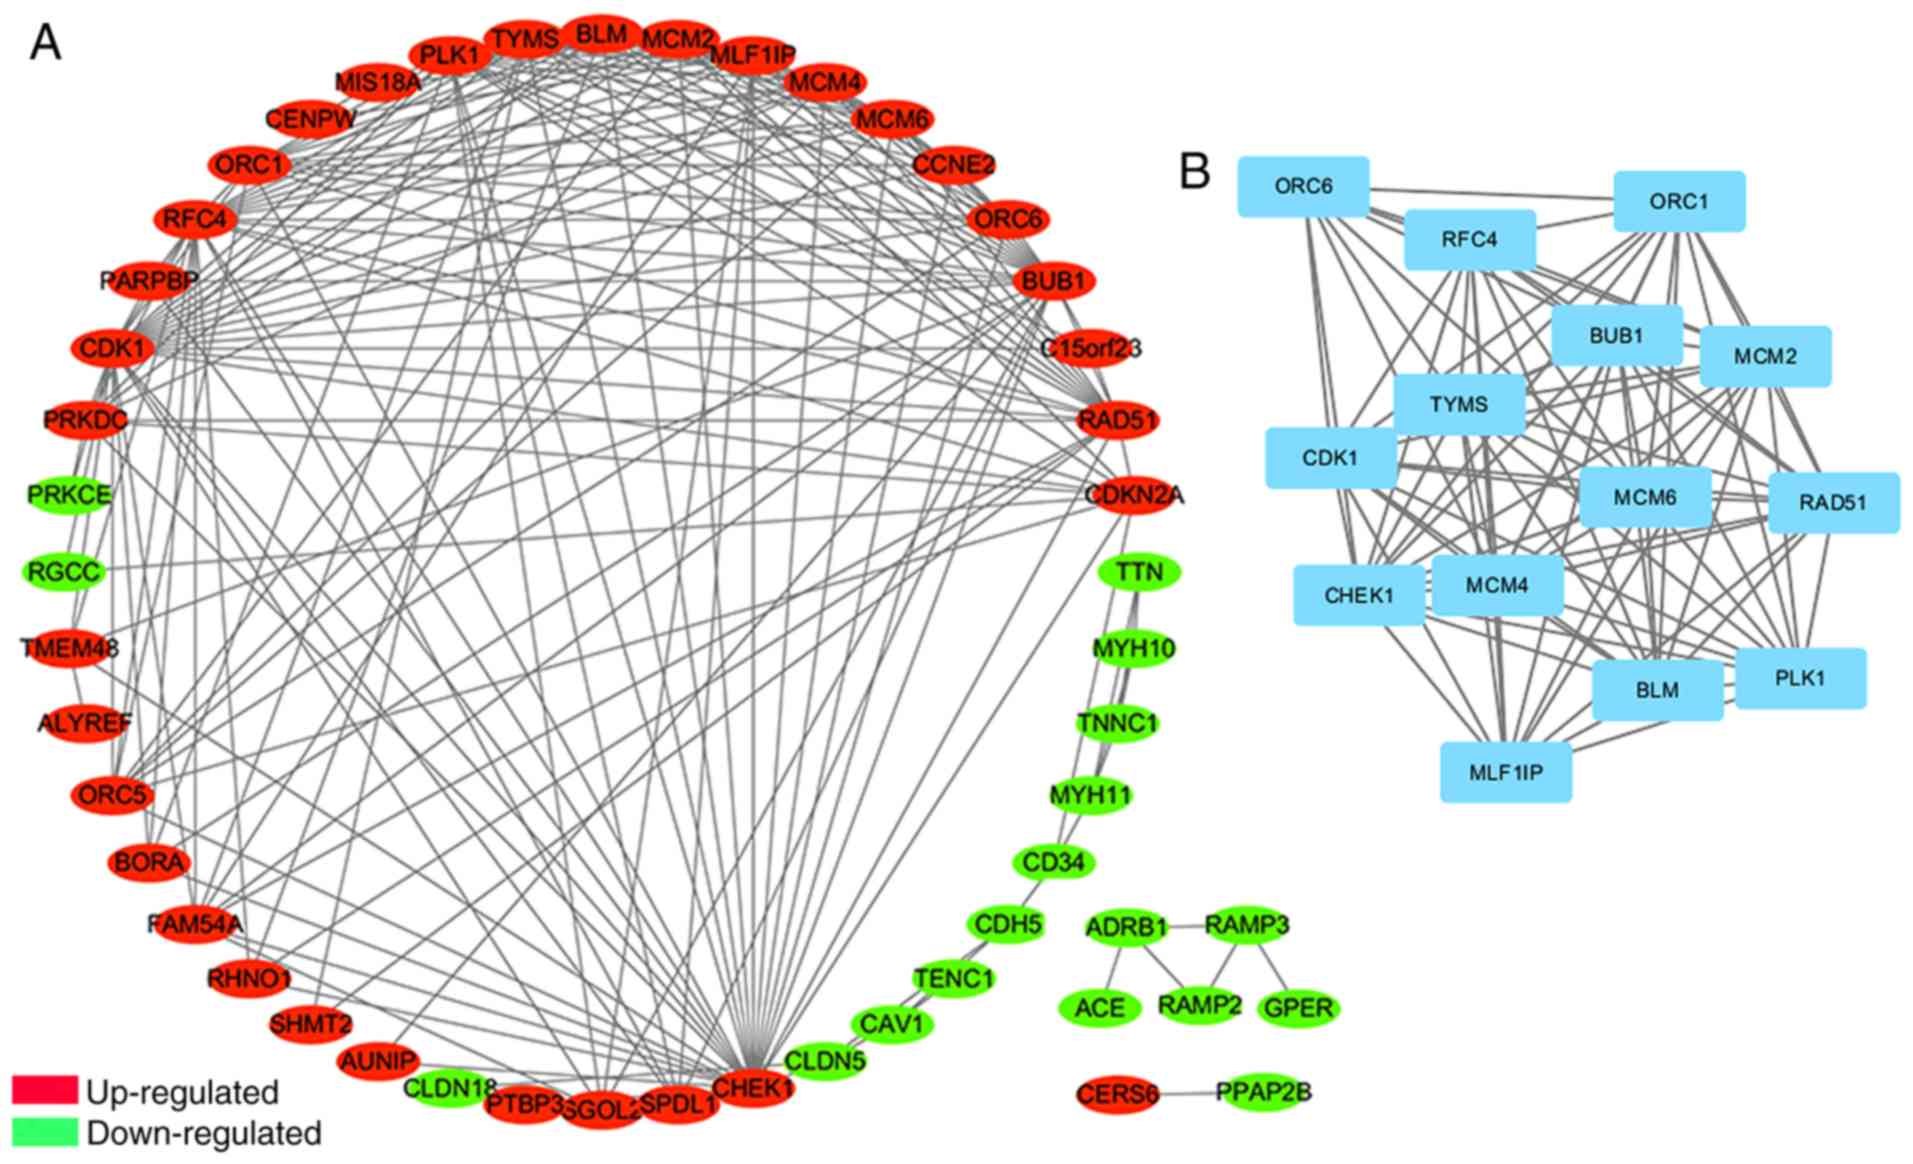
The PPI network of DEGs consisted of 51 nodes and
192 edges, including 33 upregulated and 18 downregulated genes
(Fig. 3A). Degrees ≥10 were set as
the cut-off criterion (Table SIII).
The top 10 genes were selected as hub genes, including
cyclin-dependent kinase 1 (CDK1), checkpoint kinase 1 (CHEK1),
budding uninhibited by benzimidazoles 1 (BUB1), replication factor
C 4 (RFC4), polo-like kinase 1 (PLK1), RAD51 recombinase (RAD51),
minichromosome maintenance complex component (MCM) 2, MCM4, MLF1
interacting protein (MLF1IP) and MCM6; all of which were
upregulated. Furthermore, the most significant module was
identified from the PPI network using the MCODE app, including 14
nodes and 85 edges (Fig. 3B). The GO
and KEGG pathway enrichment analyses revealed that genes in this
module were significantly associated with ‘mitotic cell cycle’,
‘DNA unwinding involved in DNA replication’ and ‘DNA replication
pathway’ (Table II).
| Table II.Functional and pathway enrichment
analysis of genes in the module. |
Table II.
Functional and pathway enrichment
analysis of genes in the module.
| Pathway ID | Pathway
description | Gene count | False discovery
rate | Nodes |
|---|
| GO.0000278 | Mitotic cell
cycle | 12 |
8.58×10⁻¹² | BLM, BUB1, CHEK1,
MCM2, MCM4, MCM6, MLF1IP, ORC1, ORC6, PLK1, RFC4, TYMS |
| GO.0044772 | Mitotic cell cycle
phase transition | 9 |
2.87×10⁻¹⁰ | CDK1, CHEK1, MCM2,
MCM4, MCM6, ORC1, ORC6, PLK1, TYMS |
| GO.1903047 | Mitotic cell cycle
process | 10 |
5.38×10⁻⁹ | BLM, BUB1, CHEK1,
MCM2, MCM4, MCM6, ORC1, ORC6, PLK1, TYMS |
| GO.0000082 | G1/S
transition of mitotic cell cycle | 7 |
1.74×10⁻⁸ | CDK1, MCM2, MCM4,
MCM6, ORC1, ORC6, TYMS |
| GO.0006268 | DNA unwinding
involved in DNA replication | 4 |
5.66×10⁻⁸ | MCM2, MCM4, MCM6,
RAD51 |
| GO.0005524 | ATP binding | 11 |
9.36×10⁻⁸ | BLM, BUB1, CDK1,
CHEK1, MCM2, MCM4, MCM6, ORC1, PLK1, RAD51, RFC4 |
| GO.0000166 | Nucleotide
binding | 12 |
1.62×10⁻⁷ | BLM, BUB1, CDK1,
CHEK1, MCM2, MCM4, MCM6, ORC1, PLK1, RAD51, RFC4, TYMS |
| GO.0043168 | Anion binding | 12 |
2.27×10⁻⁷ | BLM, BUB1, CDK1,
CHEK1, MCM2, MCM4, MCM6, ORC1, PLK1, RAD51, RFC4, TYMS |
| GO.0003697 | Single-stranded DNA
binding | 4 |
3.14×10⁻⁵ | BLM, MCM4, MCM6,
RAD51 |
| GO.0005654 | Nucleoplasm | 14 |
6.79×10⁻¹⁰ | BLM, BUB1, CDK1,
CHEK1, MCM2, MCM4, MCM6, MLF1IP, ORC1, ORC6, PLK1, RAD51, RFC4,
TYMS |
| GO.0044454 | Nuclear chromosome
part | 7 |
8.90×10⁻⁷ | BLM, BUB1, MCM2,
ORC1, ORC6, PLK1, RAD51 |
| GO.0000228 | Nuclear
chromosome | 7 |
1.45×10⁻⁶ | BLM, BUB1, CHEK1,
MCM2, ORC1, ORC6, PLK1 |
| KEGG:hsa04110 | Cell cycle | 8 |
9.91×10⁻¹³ | BUB1, CHEK1, MCM2,
MCM4, MCM6, ORC1, ORC6, PLK1 |
| KEGG:hsa03030 | DNA
replication | 4 |
1.02×10⁻⁶ | MCM2, MCM4, MCM6,
RFC4 |
Survival analysis and protein
expression in human NSCLC
The degree cutoff>16, node score cutoff=0.2,
k-core=2, and max.depth=100 were set as the cut-off criterion for
PPI analysis, applied to predict PPI network of DEGs. The 6 genes
were selected as core hub genes, including CDK1, CHEK1, BUB1, RFC4,
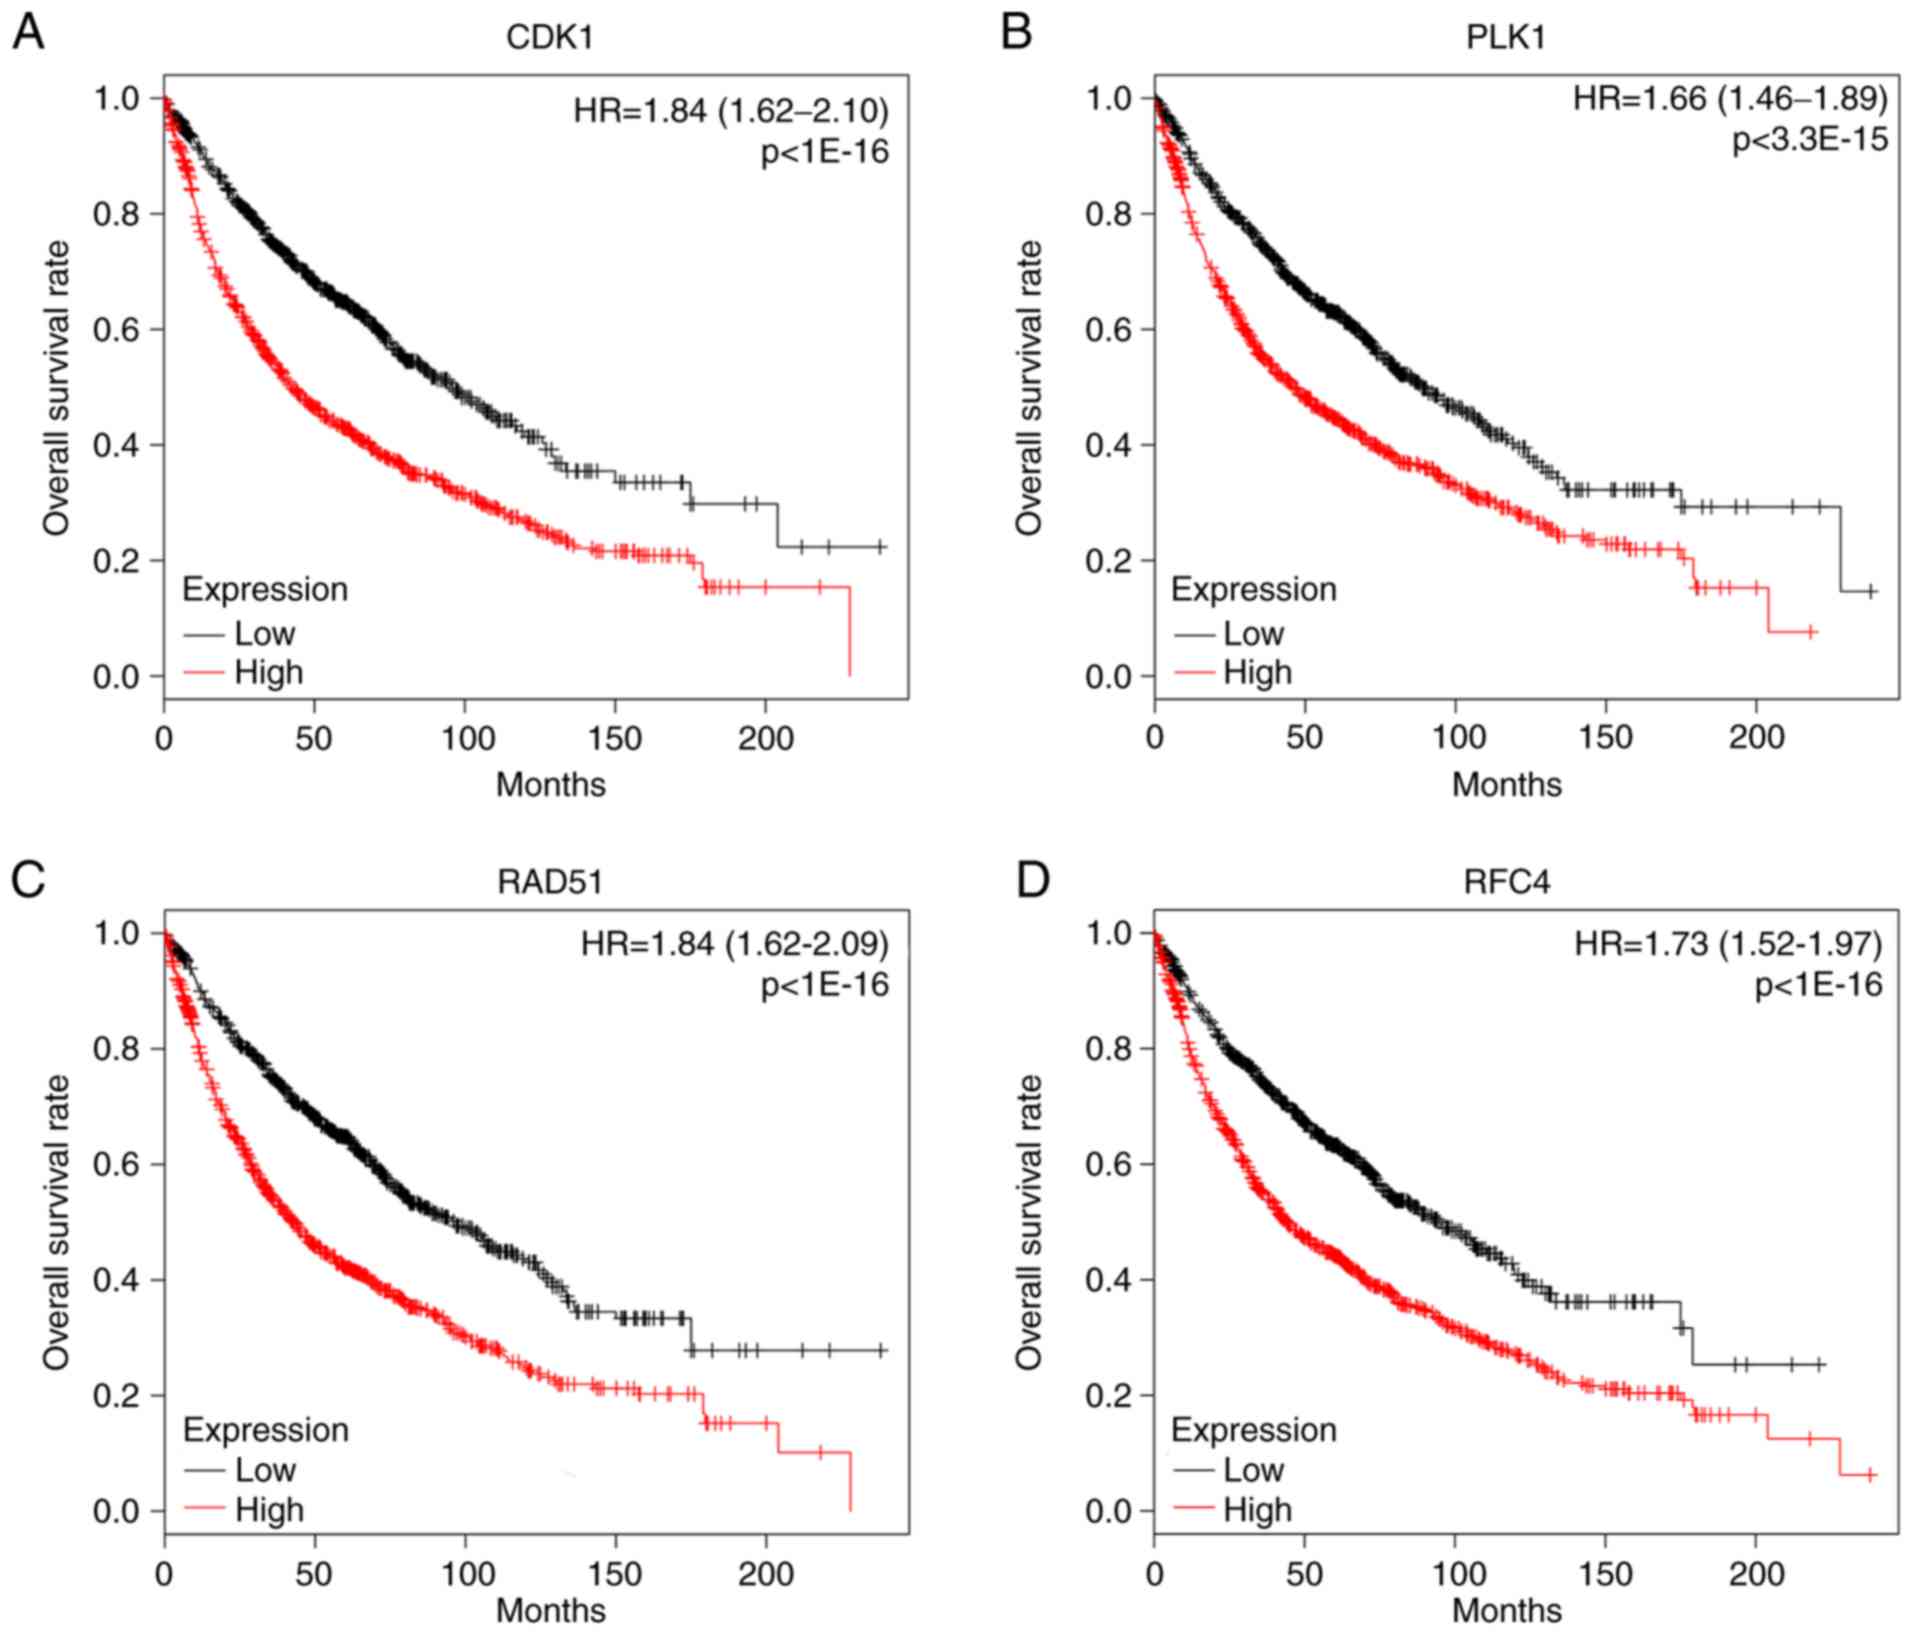
PLK1 and RAD51. The prognostic value of the hub genes was evaluated
using Kaplan-Meier plotter. The overall survival rate analysis
demonstrated that high expression of CDK1 [hazard ratio (HR), 1.84;
95% confidence interval (CI), 1.62–2.10; P<1×10⁻¹⁶;
Fig. 4A] caused the low overall
survival rate for NSCLC, which was the same as PLK1 (HR, 1.66; 95%
CI, 1.46–1.89; P=3.3×10⁻¹⁵; Fig. 4B), RAD51 (HR, 1.84; 95% CI,
1.62–2.09; P<1×10⁻¹⁶; Fig.
4C), RFC4 (HR, 1.73; 95% CI, 1.52–1.97; P<1×10⁻¹⁶
Fig. 4D), BUB1 (HR, 1.21; 95% CI,
1.07–1.38; P=0.0025; data not shown), but not CHEK1 (HR, 1.42;
0.99–2.04; P=0.052; data not shown). HR>1.5 and P<0.05 were
set as the cut-off criterion for the survival analysis. According
to these cut-off criteria, four genes were identified as potential
tumor markers for NSCLC, including CDK1, PLK1, RAD51 and RFC4. In
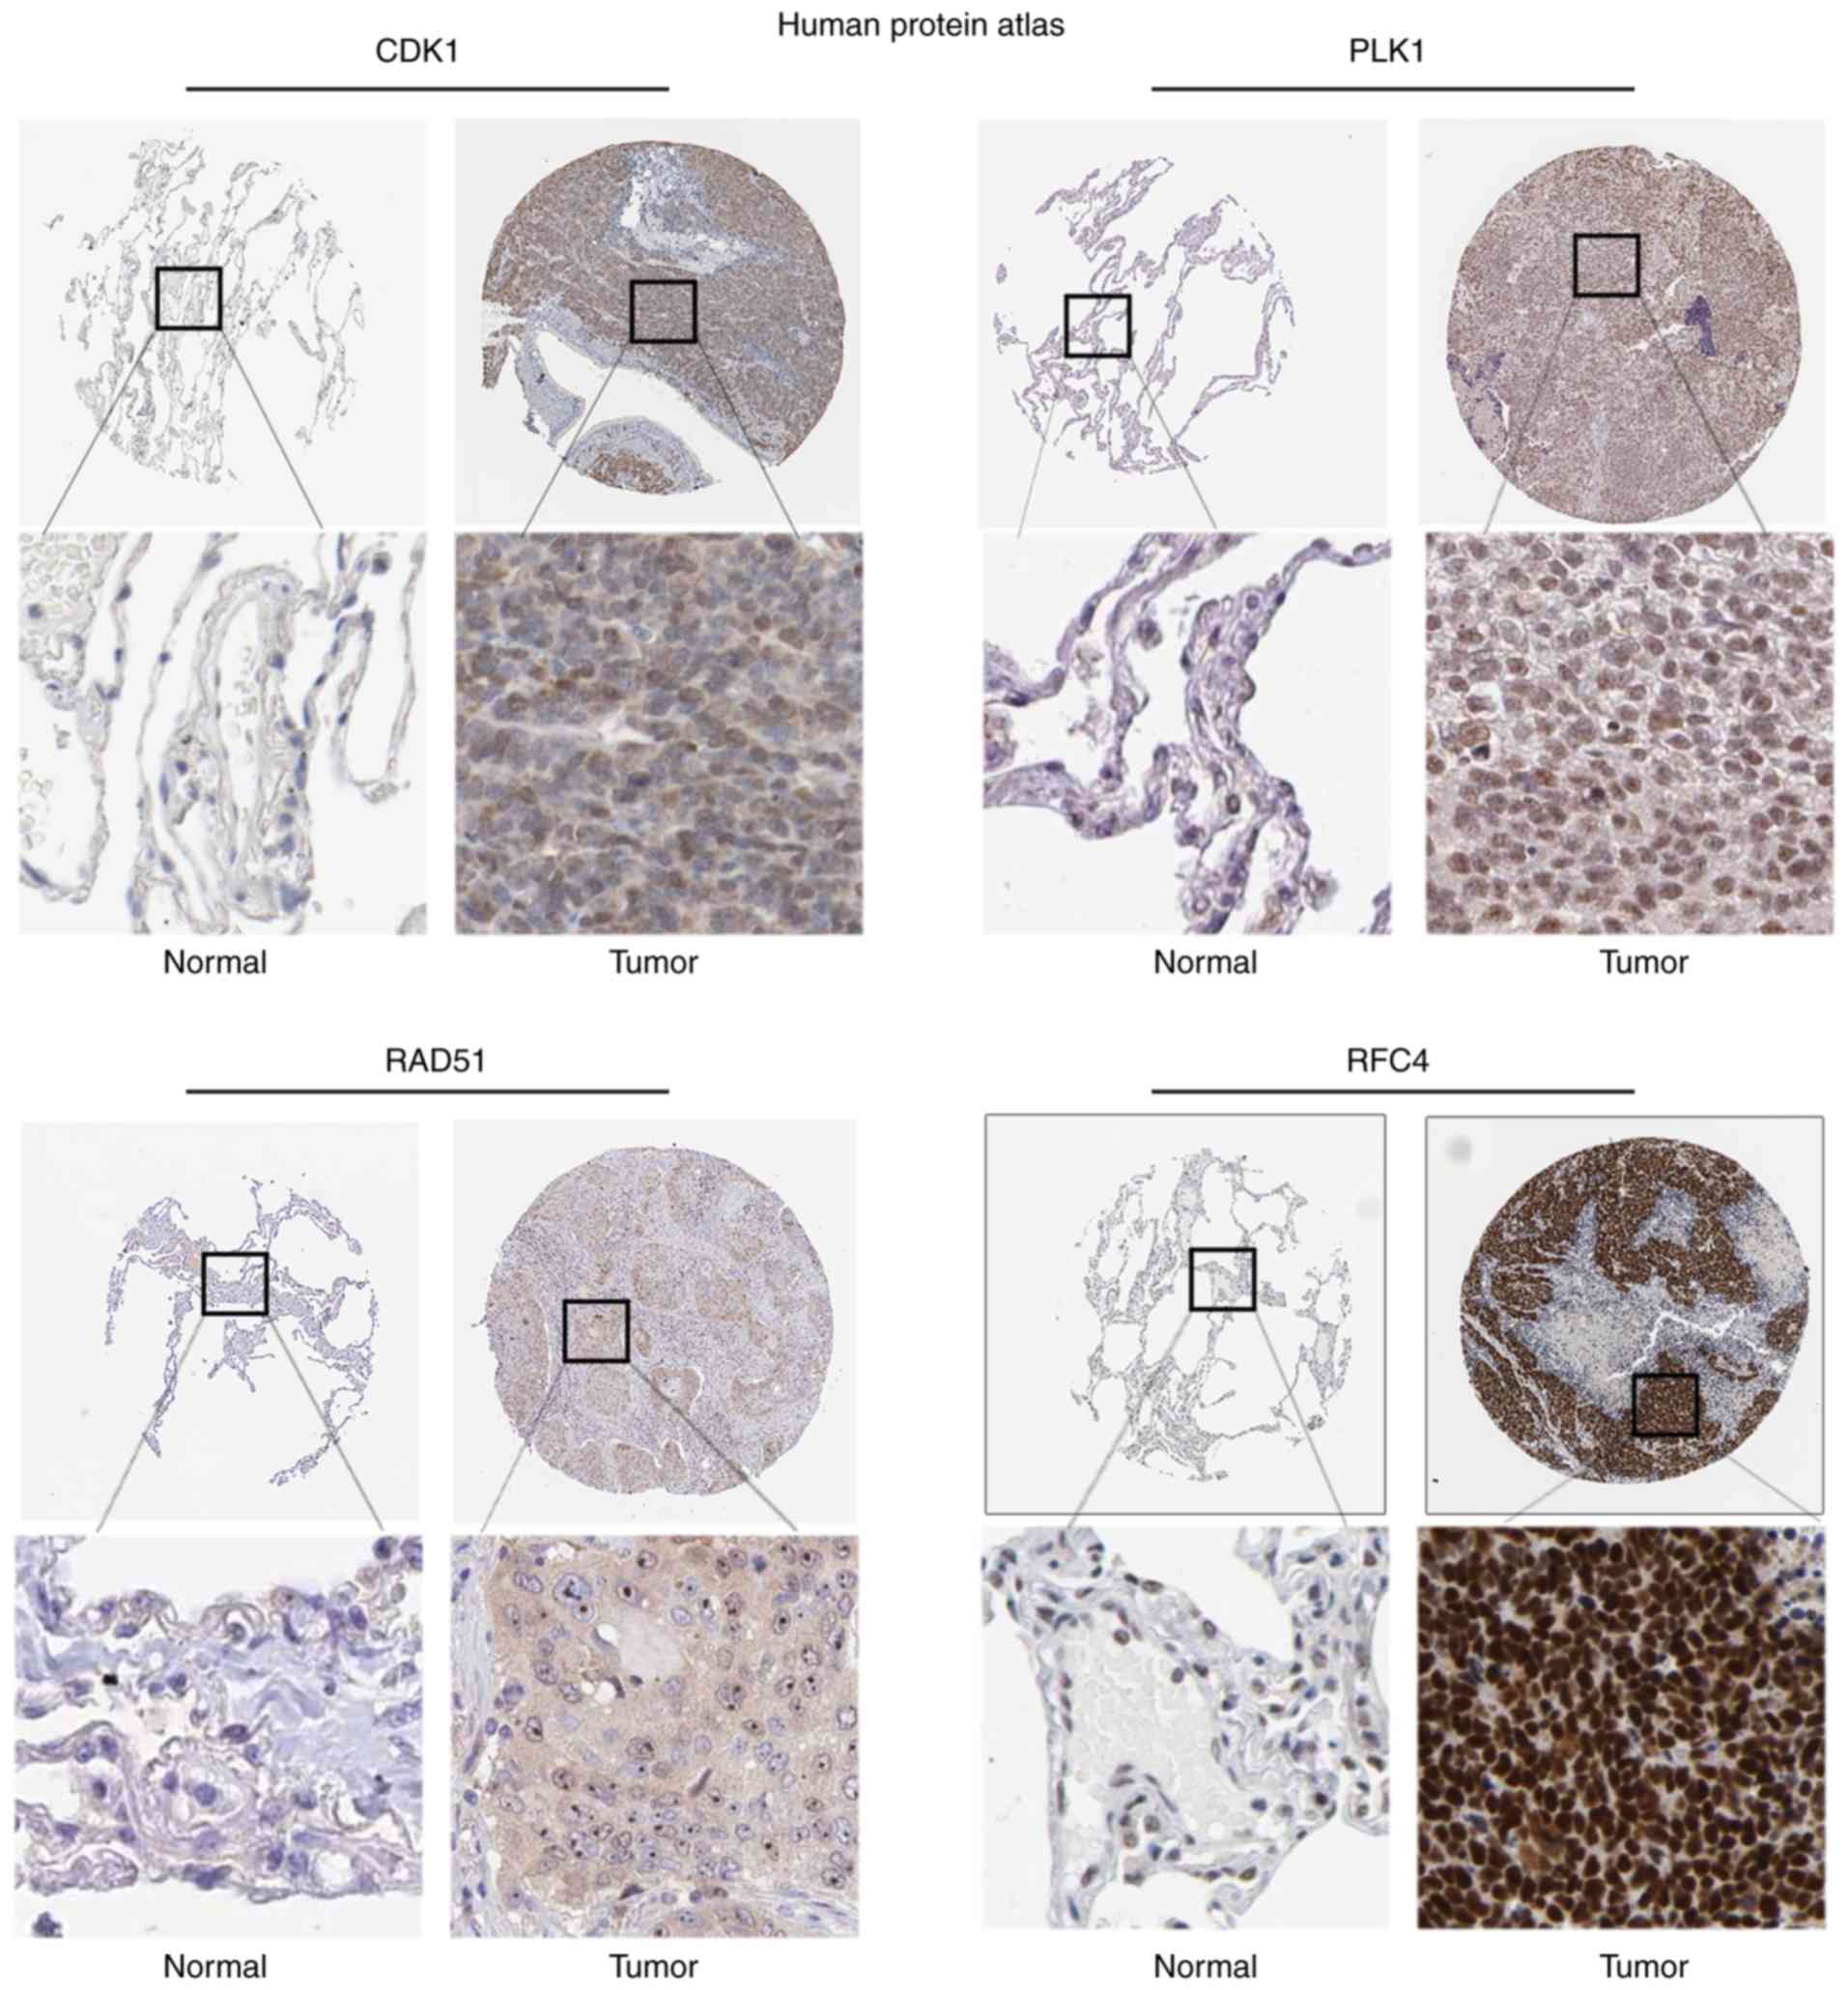
order to determine the clinical relevance of hub gene expression,
the present study then analyzed the expression of proteins from
clinical specimens in The Human Protein Atlas database. The
database indicated that CDK1 (P=1.03×10⁻³) was highly
expressed in NSCLC compared with the low expression observed in
normal lung samples, which was also true for PLK1
(P=4.73×10⁻⁹), RAD51 (P=2.93×10⁻³) and RFC4
(P=7.27×10⁻⁴) (Fig.
5).
Discussion
The development of NSCLC is a multi-step process
that involves interactions between genetic, epigenetic aberrations
and environmental factors, which leads to disorders of key
oncogenes and tumor repressors (1,18).
Knowledge of the molecular mechanism underlying NSCLC is essential
for diagnosis and treatment. The development of microarrays and
high throughput sequencing techniques that can simultaneously
detect mRNA expression levels of thousands of genes has benefited
the prediction of potential diagnostic and therapeutic target genes
for NSCLC (10). The present study
extracted data from three gene expression profiles, GSE18842,
GSE30219 and GSE33532. A total of 428 upregulated and 336
downregulated genes were identified between NSCLC samples and
normal lung tissues. GO and KEGG annotations revealed that DEGs
were enriched in the ‘cell cycle’, ‘cell adhesion molecules’ and
‘tight junction’. Further PPI analysis, survival analysis and The
Human Protein Atlas identified 4 hub genes that can be used as a
tumor marker for diagnosis and prognosis or as a drug therapy
target in NSCLC.
GEO2R (13) is an
online interactive network tool used to identify the DEGs in GEO
datasets. In the present study, a total of 764 DEGs were screened
out between NSCLC samples and normal lung tissues with the GEO2R
analysis, consisting of 428 upregulated and 336 downregulated
genes. The GO and KEGG functional annotations revealed that
upregulated DEGs were enriched in the ‘cell cycle’, ‘p53 signaling
pathway’ and ‘DNA replication’, while downregulated DEGs were
enriched in ‘vascular smooth muscle contraction’, ‘cell adhesion
molecules’ and ‘tight junction’. In accordance with Singhal et
al (19), Voortman et al
(20) reported that an imbalance of
G2-M-phase arrest in the cell cycle can lead to the
occurrence of NSCLC, which is one of its primary causes (21). Furthermore, the majority of NSCLC
cases have p53 mutations and, as a result, an imbalanced expression
of p53 target genes, such as p21, Bax and PUMA, which ultimately
prompts the growth of tumor cells (22).
A total of 10 genes that had a high degree in the
PPI network were selected as hub genes. The top 10 degree hub genes
were as follows: CDK1, CHEK1, BUB1, RFC4, PLK1, RAD51, MCM2, MCM4,
MLF1IP and MCM6. All these genes are upregulated in NSCLC. The GO
and KEGG analyses revealed that the top 10 genes were enriched in
‘mitotic cell cycle transition’, ‘ATP binding’, and ‘DNA
replication’. It has been reported that the cell cycle checkpoint
facilitated cellular responses to DNA damage, and an aberrant cell
cycle facilitated the risk of cancer developing (23).
Survival analysis of the 10 genes revealed that
selected hub genes were significantly associated with worse overall
survival rate in patients with NSCLC, including CDK1, PLK1, RAD51
and RFC4. CDK1 is a member of the Ser/Thr protein kinase family
(24). CDK1 was a master regulator
of mitosis and meiosis, as a SUMO target both in vivo and
in vitro involved in the initiation and transformation
process through mitosis of the cell cycle (25). A number of studies have demonstrated
that CDK1 inhibitors can block cell cycle progression through
blocking mitosis and also have the potential to treat cancer due to
their ability to control cell proliferation or inhibit tumor growth
(26,27). PLK1 belongs to the CDC5/Polo
subfamily and is a Ser/Thr protein kinase (28). PLK1 is highly expressed during
mitosis. PLK1 promotes cell proliferation and has also been
observed to be upregulated in different types of human cancer. The
deletion of PLK1 in cancer cells significantly inhibits cell
proliferation and induces apoptosis (28). RAD51 was another selected hub gene.
RAD51 is known to be involved in the homologous recombination and
repair of DNA by interacting with the single stranded DNA-binding
protein RPA and RAD52 (29). RAD51
is also involved in promoting tumorigenesis through interacting
with BRCA1 and BRCA2, which are tumor suppressors (30–32).
RFC4 is a member of the RFC family, which functions as a clamp
loader that loads PCNA onto DNA and is involved in DNA repair
activities (33,34). Xiang et al (35) reported that RFC4 is upregulated in
patients with colorectal cancer, which could predict its prognosis
as it promotes cell proliferation and cell cycle arrest.
Due to the different selection methods and samples,
the results of the present study were different from those of
previous studies, which used the same lung cancer gene expression
profiles (GSE18842, GSE30219 and GSE33532). Sanchez-Palencia et
al (10) reported that KRT15 and
PKP1, which may be good markers to distinguish squamous-cell
carcinoma samples in GSE18842 (10).
Rousseaux et al (11)
reported that EBI3, PIWIL1, TPTE and NBPF4 may be potential
biomarkers in lung cancer using the GSE30219 dataset (11). Meister et al (12) also reported that COL4A3, COL4A4 and
CHRDL1 may be associated with lung cancer after analyzing the
GSE33532 dataset (12). The present
study revealed that four hub genes were significantly associated
with worse overall survival of patients with NSCLC, including CDK1,
PLK1, RAD51 and RFC4. To the best of our knowledge, RFC4 has not
been reported as involved in the development of lung cancer before.
RFC4 is involved in DNA replication as a clamp loader (35). In the present study, the results
revealed that PLK1 and RFC4 were upregulated in NSCLC and were
present in the cell cycle pathway, suggesting that the two genes
may be important in the progression of NSCLC via the cell cycle
pathway. Therefore, further experimental verification is
required.
Overall, the present study provided a new
comprehensive bioinformatics analysis to identify DEGs. The
screened DEGs, including CDK1, PLK1, RAD51 and RFC4, can be used as
tumor biomarkers for the diagnosis and prognosis, or as a drug
therapy target, in NSCLC. However, further molecular biology
experiments are required in order to confirm the underlying
molecular mechanism of the genes identified in NSCLC.
There is a limitation to the present study.
Heterogeneity within tumor cell populations is commonly observed in
the majority of different types of cancer, particularly in lung
cancer (36), which affects tumor
growth rate, invasion and metastasis, and drug sensitivity and
prognosis (37). NSCLC
histopathology for the present study was confirmed by conventional
paraffin-embedded tissue section, and the control samples were all
from normal lung tissues, but not from their corresponding adjacent
non-tumorous lung tissues. Fend et al (38) reported that the intrinsic
heterogeneity of primary tissues in conventional paraffin
sectioning with a mixture of various reactive cell populations can
influence the results and interpretation of molecular studies. The
authors also stated that a new technology called laser capture
microdissection (LCM), is able to solve this problem (38). LCM is a powerful tool for isolating
and studying the gene expression patterns of desired cells or
tissues from heterogeneous populations (38). Isolation of a specific NSCLC cell
from a heterogeneous tissue helps to obtain more meaningful
molecular analysis results. Overall, the data from the present
study suggested that data mining and integration analysis may be a
useful tool for predicting cancer progression and understanding the
molecular mechanisms underlying tumorgenesis.
Supplementary Material
Supporting Data
Acknowledgements
Not applicable.
Funding
The present study was supported by the Medical
Science and Technology Research Foundation of Guangdong Province
(grant no. B2018217).
Availability of data and materials
The datasets generated and/or analyzed during the
current study are available in the GEO repository, (https://www.ncbi.nlm.nih.gov/geo).
Authors' contributions
WC, SZ conceived and designed the study. YZ, DT and
JX performed the data analysis. WC and SZ wrote the article. All
authors read and approved the final manuscript.
Ethics approval and consent to
participate
Not applicable.
Patient consent for publication
Not applicable.
Competing interests
The authors declare that they have no competing
interests.
References
|
1
|
Ansari J, Shackelford RE and El-Osta H:
Epigenetics in non-small cell lung cancer: From basics to
therapeutics. Transl Lung Cancer Res. 5:155–171. 2016. View Article : Google Scholar : PubMed/NCBI
|
|
2
|
Ramshankar V and Krishnamurthy A: Lung
cancer detection by screening-presenting circulating miRNAs as a
promising next generation biomarker breakthrough. Asian Pac J
Cancer Prev. 14:2167–2172. 2013. View Article : Google Scholar : PubMed/NCBI
|
|
3
|
Naruke T, Goya T, Tsuchiya R and Suemasu
K: Prognosis and survival in resected lung carcinoma based on the
new international staging system. J Thorac Cardiovasc Surg.
96:440–447. 1988. View Article : Google Scholar : PubMed/NCBI
|
|
4
|
Ginsberg RJ and Rubinstein LV: Randomized
trial of lobectomy versus limited resection for T1 N0 non-small
cell lung cancer. Lung Cancer Study Group. Ann Thorac Surg.
60:615–622; discussion 622–623. 1995. View Article : Google Scholar : PubMed/NCBI
|
|
5
|
Goldstraw P, Crowley J, Chansky K, Giroux
DJ, Groome PA, Rami-Porta R, Postmus PE, Rusch V and Sobin L;
International Association for the Study of Lung Cancer
International Staging Committee; Participating Institutions, : The
IASLC Lung Cancer Staging Project: Proposals for the revision of
the TNM stage groupings in the forthcoming (seventh) edition of the
TNM Classification of malignant tumours. J Thorac Oncol. 2:706–714.
2007. View Article : Google Scholar : PubMed/NCBI
|
|
6
|
Lu X, Yang X, Zhang Z and Wang D:
Meta-analysis of serum tumor markers in lung cancer. Zhongguo Fei
Ai Za Zhi. 13:1136–1140, (In Chinese). PubMed/NCBI
|
|
7
|
Dennis G Jr, Sherman BT, Hosack DA, Yang
J, Gao W, Lane HC and Lempicki RA: DAVID: Database for annotation,
visualization, and integrated discovery. Genome Biol. 4:P32003.
View Article : Google Scholar : PubMed/NCBI
|
|
8
|
Ashburner M, Ball CA, Blake JA, Botstein
D, Butler H, Cherry JM, Davis AP, Dolinski K, Dwight SS, Eppig JT,
et al: Gene Ontology: Tool for the unification of biology. The Gene
Ontology Consortium. Nat Genet. 25:25–29. 2000. View Article : Google Scholar : PubMed/NCBI
|
|
9
|
Kanehisa M and Goto S: KEGG: Kyoto
encyclopaedia of genes and genomes. Nucleic Acids Res. 28:27–30.
2000. View Article : Google Scholar : PubMed/NCBI
|
|
10
|
Sanchez-Palencia A, Gomez-Morales M,
Gomez-Capilla JA, Pedraza V, Boyero L, Rosell R and Fárez-Vidal ME:
Gene expression profiling reveals novel biomarkers in nonsmall cell
lung cancer. Int J Cancer. 129:355–364. 2011. View Article : Google Scholar : PubMed/NCBI
|
|
11
|
Rousseaux S, Debernardi A, Jacquiau B,
Vitte AL, Vesin A, Nagy-Mignotte H, Moro-Sibilot D, Brichon PY,
Lantuejoul S, Hainaut P, et al: Ectopic activation of germline and
placental genes identifies aggressive metastasis-prone lung
cancers. Sci Transl Med. 5:186ra662013. View Article : Google Scholar : PubMed/NCBI
|
|
12
|
Meister M, Belousov A, Xu EC, Schnabel P,
Warth A and Hoffman H: Intra-tumor heterogeneity of gene expression
profiles in early stage non-small cell lung cancer. J Bioinf Res
Stud. 1:12014.
|
|
13
|
Barrett T, Wilhite SE, Ledoux P,
Evangelista C, Kim IF, Tomashevsky M, Marshall KA, Phillippy KH,
Sherman PM, Holko M, et al: NCBI GEO: Archive for functional
genomics data sets-update. Nucleic Acids Res. 41:D991–D995. 2013.
View Article : Google Scholar : PubMed/NCBI
|
|
14
|
Franceschini A, Szklarczyk D, Frankild S,
Kuhn M, Simonovic M, Roth A, Lin J, Minguez P, Bork P, von Mering C
and Jensen LJ: STRING v9.1: Protein-protein interaction networks,
with increased coverage and integration. Nucleic Acids Res.
41:D808–D815. 2013. View Article : Google Scholar : PubMed/NCBI
|
|
15
|
Shannon P, Markiel A, Ozier O, Baliga NS,
Wang JT, Ramage D, Amin N, Schwikowski B and Ideker T: Cytoscape: A
software environment for integrated models of biomolecular
interaction networks. Genome Res. 13:2498–2504. 2003. View Article : Google Scholar : PubMed/NCBI
|
|
16
|
Bader GD and Hogue CW: An automated method
for finding molecular complexes in large protein interaction
networks. BMC Bioinformatics. 4:22003. View Article : Google Scholar : PubMed/NCBI
|
|
17
|
Győrffy B, Surowiak P, Budczies J and
Lánczky A: Online survival analysis software to assess the
prognostic value of biomarkers using transcriptomic data in
non-small-cell lung cancer. PLoS One. 8:e822412013. View Article : Google Scholar : PubMed/NCBI
|
|
18
|
Jakopovic M, Thomas A, Balasubramaniam S,
Schrump D, Giaccone G and Bates SE: Targeting the epigenome in lung
cancer: Expanding approaches to epigenetic therapy. Front Oncol.
3:2612013. View Article : Google Scholar : PubMed/NCBI
|
|
19
|
Singhal S, Vachani A, Antin-Ozerkis D,
Kaiser LR and Albelda SM: Prognostic implications of cell cycle,
apoptosis, and angiogenesis biomarkers in non-small cell lung
cancer: A review. Clin Cancer Res. 11:3974–3986. 2005. View Article : Google Scholar : PubMed/NCBI
|
|
20
|
Voortman J, Checińska A and Giaccone AG:
The proteasomal and apoptotic phenotype determine bortezomib
sensitivity of non-small cell lung cancer cells. Mol Cancer.
6:732007. View Article : Google Scholar : PubMed/NCBI
|
|
21
|
Yang Y, Ikezoe TT, Saito T, Kobayashi M,
Koeffler HP and Taguchi H: Proteasome inhibitor PS-341 induces
growth arrest and apoptosis of non-small cell lung cancer cells via
the JNK/c-Jun/AP-1 signaling. Cancer Sci. 95:176–180. 2004.
View Article : Google Scholar : PubMed/NCBI
|
|
22
|
Huang CL, Yokomise H and Miyatake A:
Clinical significance of the p53 pathway and associated gene
therapy in non-small cell lung cancers. Future Oncol. 3:83–93.
2007. View Article : Google Scholar : PubMed/NCBI
|
|
23
|
Kastan MB and Bartek J: Cell-cycle
checkpoints and cancer. Nature. 432:316–323. 2004. View Article : Google Scholar : PubMed/NCBI
|
|
24
|
Malumbres M and Barbacid M: Mammalian
cyclin-dependent kinases. Trends Biochem Sci. 30:630–641. 2005.
View Article : Google Scholar : PubMed/NCBI
|
|
25
|
Wang Q, Su L, Liu N, Zhang L, Xu W and
Fang H: Cyclin dependent kinase 1 inhibitors: A review of recent
progress. Curr Med Chem. 18:2025–2043. 2011. View Article : Google Scholar : PubMed/NCBI
|
|
26
|
Sharma PS, Sharma R and Tyagi R:
Inhibitors of cyclin dependent kinases: Useful targets for cancer
treatment. Curr Cancer Drug Targets. 8:53–75. 2008. View Article : Google Scholar : PubMed/NCBI
|
|
27
|
Malumbres M, Pevarello P, Barbacid M and
Bischoff JR: CDK inhibitors in cancer therapy: What is next? Trends
Pharmacol Sci. 29:16–21. 2008. View Article : Google Scholar : PubMed/NCBI
|
|
28
|
Yim H: Current clinical trials with
polo-like kinase 1 inhibitors in solid tumors. Anticancer Drugs.
24:999–1006. 2013. View Article : Google Scholar : PubMed/NCBI
|
|
29
|
Baumann P and West SC: Role of the human
RAD51 protein in homologous recombination and double-stranded-break
repair. Trends Biochem Sci. 23:247–251. 1998. View Article : Google Scholar : PubMed/NCBI
|
|
30
|
Venkitaraman AR: Cancer susceptibility and
the functions of BRCA1 and BRCA2. Cell. 108:171–182. 2002.
View Article : Google Scholar : PubMed/NCBI
|
|
31
|
Raderschall E, Stout K, Freier S, Suckow
V, Schweiger S and Haaf T: Elevated levels of Rad51 recombination
protein in tumor cells. Cancer Res. 62:219–225. 2002.PubMed/NCBI
|
|
32
|
Davies AA, Masson JY, McIlwraith MJ,
Stasiak AZ, Stasiak A, Venkitaraman AR and West SC: Role of BRCA2
in control of the RAD51 recombination and DNA repair protein. Mol
Cell. 7:273–282. 2001. View Article : Google Scholar : PubMed/NCBI
|
|
33
|
Johnson A, Yao NY, Bowman GD, Kuriyan J
and O'Donnell M: The replication factor C clamp loader requires
arginine finger sensors to drive DNA binding and proliferating cell
nuclear antigen loading. J Biol Chem. 281:35531–35543. 2006.
View Article : Google Scholar : PubMed/NCBI
|
|
34
|
Kim HS and Brill SJ: Rfc4 interacts with
Rpa1 and is required for both DNA replication and DNA damage
checkpoints in Saccharomyces cerevisiae. Mol Cell Biol.
21:3725–3737. 2001. View Article : Google Scholar : PubMed/NCBI
|
|
35
|
Xiang J, Fang L, Luo Y, Yang Z, Liao Y,
Cui J, Huang M, Yang Z, Huang Y, Fan X, et al: Levels of human
replication factor C4, a clamp loader, correlate with tumor
progression and predict the prognosis for colorectal cancer. J
Transl Med. 12:3202014. View Article : Google Scholar : PubMed/NCBI
|
|
36
|
Lin J, Marquardt G, Mullapudi N, Wang T,
Han W, Shi M, Keller S, Zhu C, Locker J and Spivack SD: Lung cancer
transcriptomes refined with laser capture microdissection. Am J
Pathol. 184:2868–2884. 2014. View Article : Google Scholar : PubMed/NCBI
|
|
37
|
Hallou A, Jennings J and Kabla AJ: Tumour
heterogeneity promotes collective invasion and cancer metastatic
dissemination. R Soc Open Sci. 4:1610072017. View Article : Google Scholar : PubMed/NCBI
|
|
38
|
Fend F and Raffeld M: Laser capture
microdissection in pathology. J Clin Pathol. 53:666–672. 2000.
View Article : Google Scholar : PubMed/NCBI
|