Introduction
Gastric cancer (GC) is currently the fifth most
common type of cancer and the third leading cause of
cancer-associated mortality worldwide among both sexes (1,2). Stomach
adenocarcinoma (STAD) accounts for 95% of malignant GC cases
(3). The incidence of GC increased
annually in young Hispanic and US populations (20–49 years) between
2,000 and 2014 (4,5). Patients with advanced GC exhibit poor
prognosis, which is frequently explained by a lack of early
diagnostic biomarkers and effective treatment (6). As the prognosis of GC is associated
with the stage of the disease at diagnosis, novel effective
diagnostic tools for early stages of GC are urgently required
(7).
The phenotypic alterations and the molecular
mechanisms underlying GC have been increasingly elucidated, and the
majority of researchers believe that GC is a multifactorial
disease, the development of which involves various risk factors,
such as Helicobacter pylori infection, smoking habits and
dietary factors (8–10). With the advances in molecular biology
and genetic detection techniques, the aberrant expression of
certain genes, including miR-125b, −199a and −100 has been
demonstrated to be significantly associated with the pathogenesis
and prognosis of GC (11). However,
the aberrant expression of a limited number of genes cannot
accurately reflect the pathogenesis and prognosis of GC. Therefore,
it may be clinically useful to develop statistical models for
disease risk prediction and tools for subsequent risk assessment
(12,13).
Risk assessment tools are considered to be able to
help estimate the probability that a person with a specific set of
risk factors will develop a disease of interest (13). These risk assessment tools can
facilitate the identification of high-risk populations in relation
to a disease and are useful in the subsequent clinical
decision-making process for healthcare providers and patients
(12). Risk assessment tools have
been used to predict the outcome of a number of diseases, such as
thromboembolism, Lynch syndrome and certain types of cancer,
including GC (12,14–20).
This indicates the potential to establish a risk assessment tool
using valuable prognostic factors with predictive capacity. Wang
et al (20) developed a
53-gene signature for predicting prognosis of patients with GC.
Although the prognostic scoring system has been demonstrated to
successfully predict patient overall survival, the detection of
expression of these 53 genes in one patient at a time is a
complicated task in the clinical setting. Therefore, further
efforts to establish a prognostic prediction model with fewer genes
are still warranted.
The present study aimed to use large amounts of mRNA
expression profiling data from STAD samples to screen significantly
differentially expressed genes (DEGs) and establish a risk score
(RS) model based on the screened genes. The RS model was
simultaneously validated by means of an independent dataset from
another database and via a correlation analysis between clinical
characteristics and prognosis. This RS model might provide a new
tool for predicting the prognosis of patients with STAD.
Materials and methods
Analysis workflow
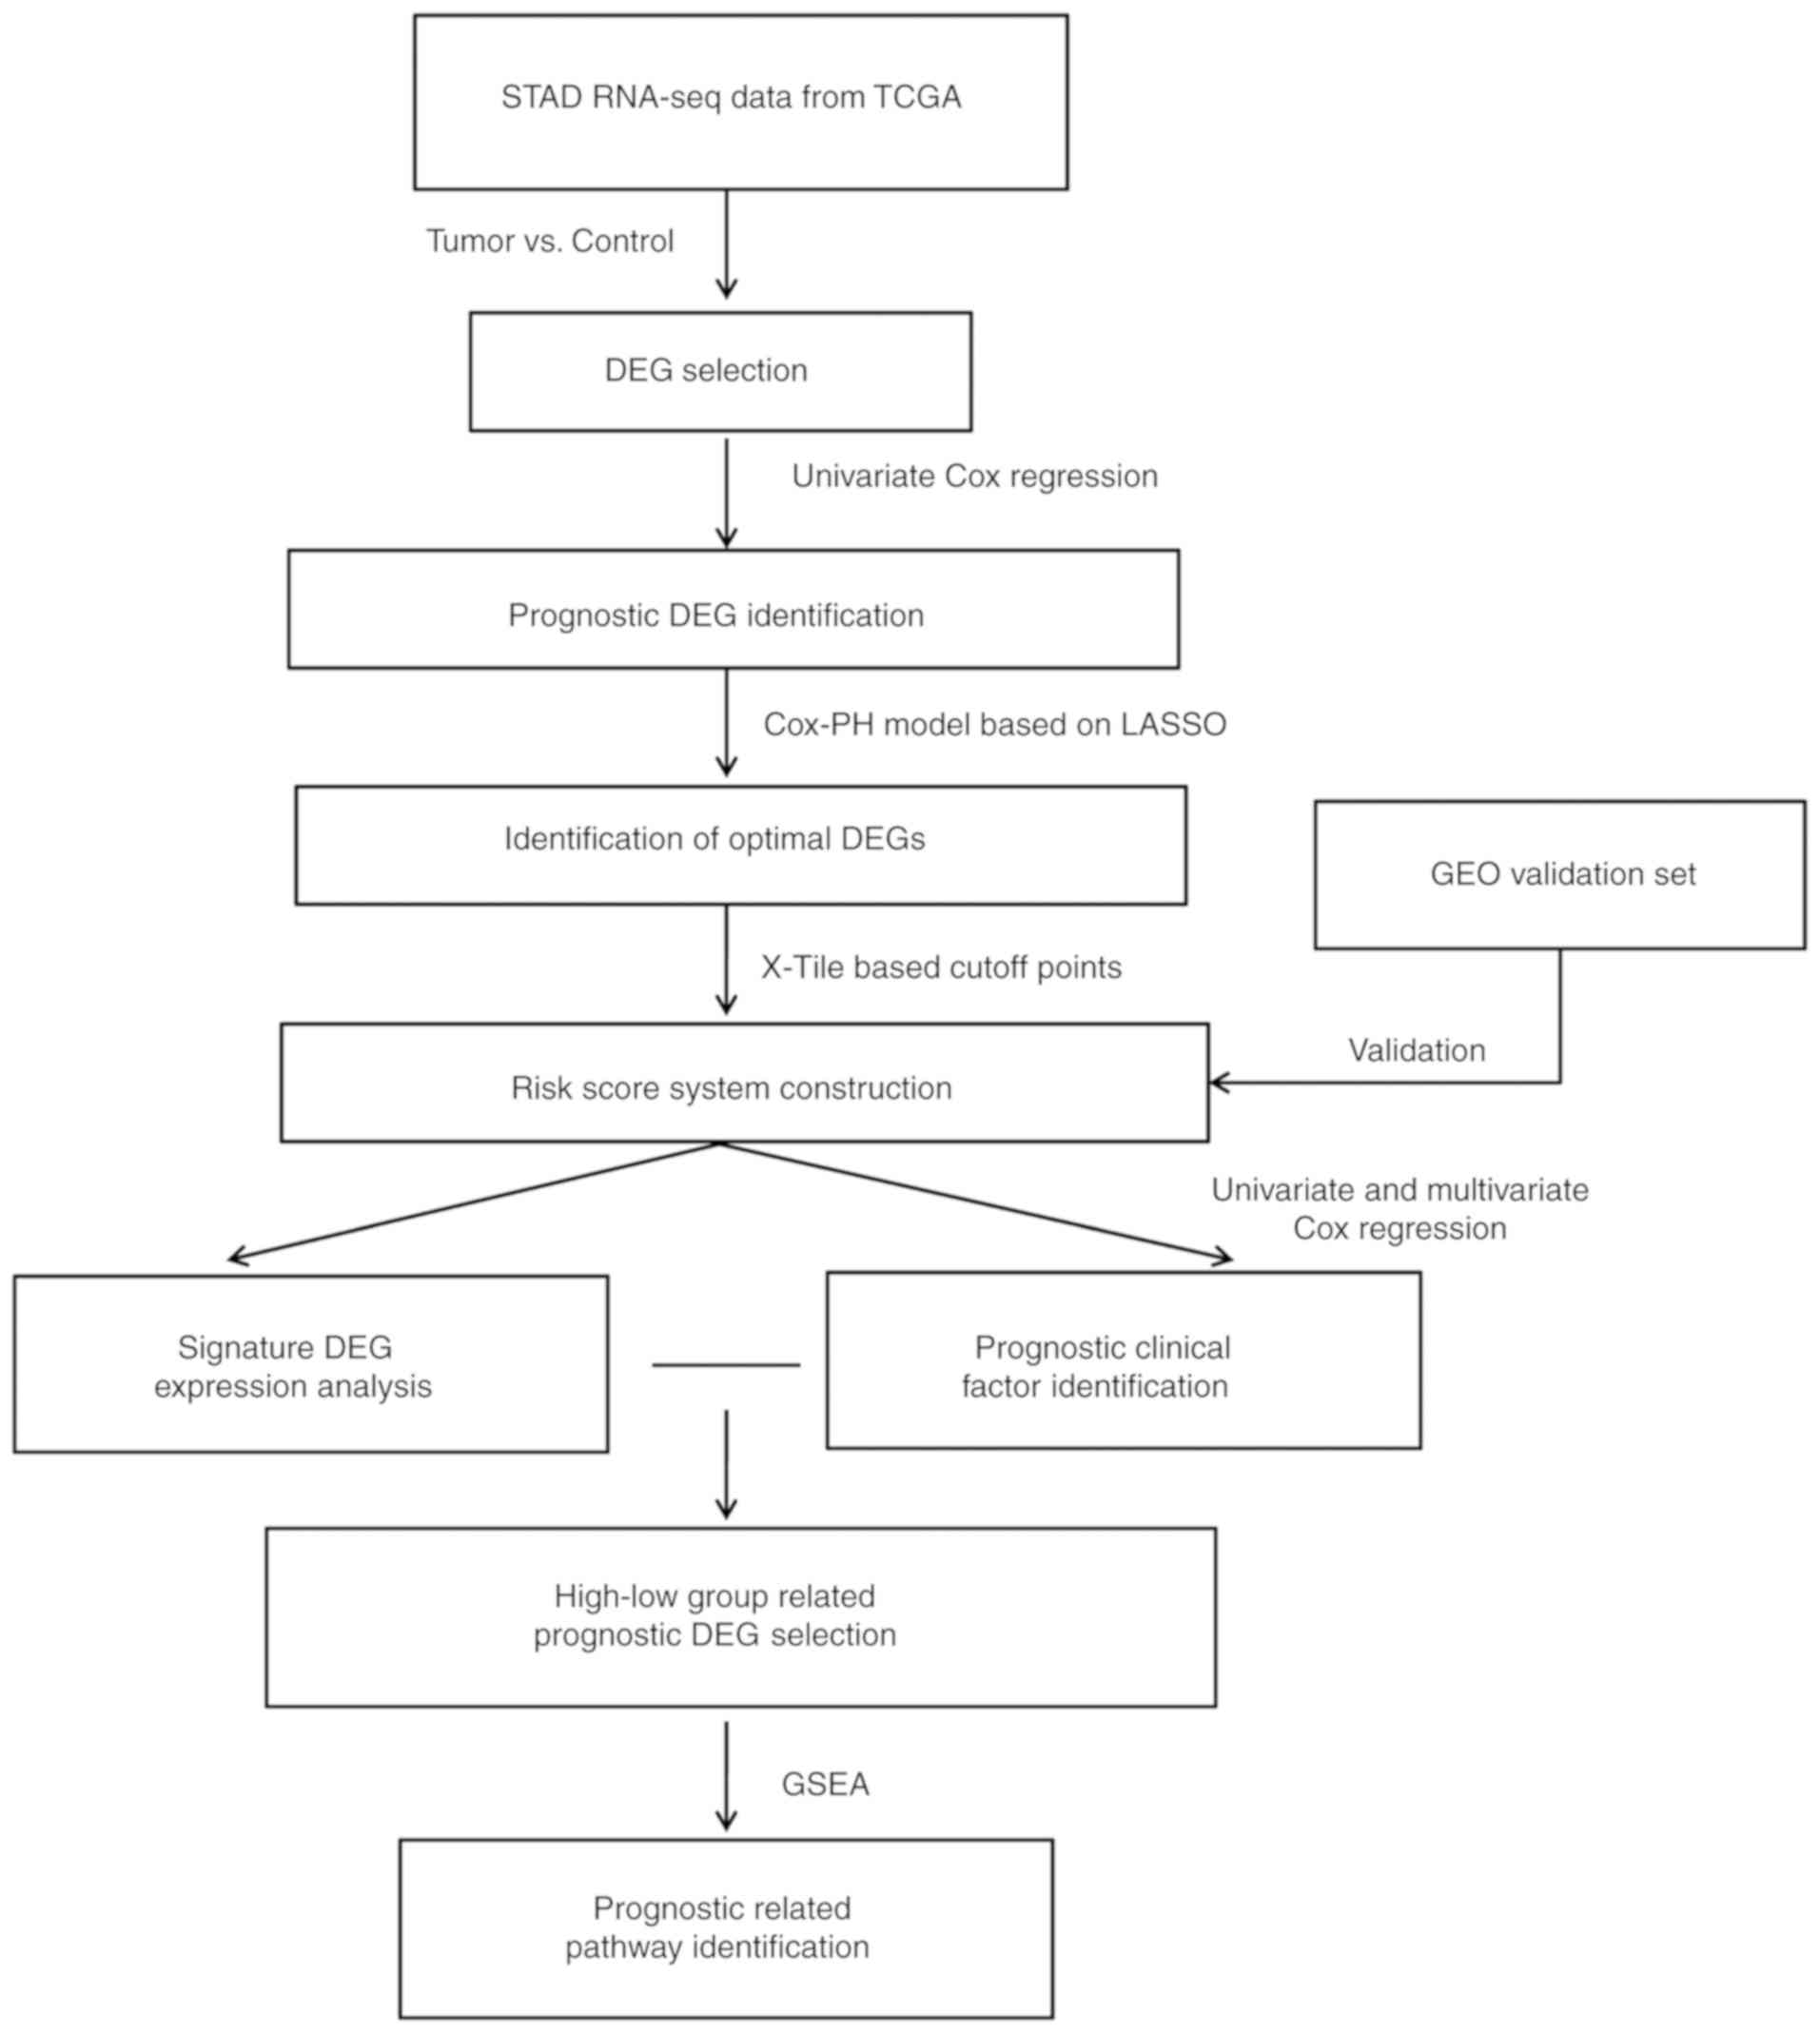
The steps of the workflow were as follows: i)
High-throughput RNA sequencing (RNA-seq) expression profiles and
clinical data from patients with STAD were downloaded from The
Cancer Gene Atlas (TCGA) database (https://portal.gdc.cancer.gov) and to be used as a
training dataset; ii) the samples in the training set were
subdivided into tumor and control samples according to the clinical
data and were subjected to screening to identify DEGs; iii)
prognostic DEGs were identified in the training set by univariate
Cox regression analysis; iv) the prognostic DEGs selected in the
previous step were screened using the least absolute shrinkage and
selection operator (LASSO) regularization regression algorithm
(21), and the resulting genes were
used to develop the RS model. The model validation and
effectiveness evaluation were performed on an independent dataset
retrieved from the Gene Expression Omnibus (GEO) database
(http://www.ncbi.nlm.nih.gov/geo); v)
screening and stratified analysis of clinical factors were
performed to identify independent prognostic risk factors; vi)
screening of mRNA-seq data for DEGs and Gene Set Enrichment
Analysis (GSEA) were performed in groups with different estimated
prognosis. The overall analysis process is presented in Fig. 1.
Data
On April 8, 2018, the training dataset, comprising
348 samples with RNA-seq expression profile data and corresponding
clinical information, was downloaded from TCGA. The 348 samples
comprised 37 control samples and 311 STAD samples with survival
times >6 months. The validation dataset GSE62254 (22), comprising 300 samples with RNA-seq
expression profile data and the corresponding clinical information,
was retrieved from the National Center for Biotechnology
Information GEO database [platform GPL570 (HG-U133_Plus_2),
Affymetrix Human Genome U133 Plus 2.0 Array]. The clinical
information from the training and validation datasets is presented
in Table I.
 | Table I.Clinical information of samples in
the training and validation datasets. |
Table I.
Clinical information of samples in
the training and validation datasets.
| Characteristic | TCGA (n=311) | GSE62254
(n=300) |
|---|
| Age, years, mean ±
SD, | 64.91±10.23 | 61.94±11.36 |
| Sex,
male/female | 203/108 | 199/101 |
| Subtype,
MSI-H/MSI-L/MSS/unknown | 60/42/208/1 | Unknown |
| Reflux,
yes/no/unknown | 36/163/112 | Unknown |
| H. pylori
infection, yes/no/unknown | 20/141/150 | Unknown |
| Pathological T,
T1/T2/T3/T4/unknown | 15/64/138/93/1 | 2/186/91/21 |
| Pathological N,
N0/N1/N2/N3 | 93/82/60/70/6 | 38/131/80/51 |
| Pathological M,
M0/M1/unknown | 285/15/11 | 273/27/0 |
| Pathological stage,
I/II/III/IV/unknown | 43/96/145/26/1 | 30/96/95/77/2 |
| Grade,
1/2/3/unknown | 7/109/186/9 | Unknown |
| Antireflux
treatment, yes/no/unknown | 30/137/144 | Unknown |
| Radiation therapy,
yes/no/unknown | 57/248/6 | Unknown |
| Recurrence,
yes/no | 44/218 | 125/157/18 |
| Survival status,
dead/alive/unknown | 122/189/0 | 135/148/17 |
| Progression-free
survival, months, mean ± SD | 17.78±17.28 | 33.72±29.82 |
| Overall survival,
months, mean ± SD | 18.45±17.15 | 50.59±31.42 |
Screening of RNA-seq data for mRNAs
with significant differential expression between groups with
different prognosis
The edgeR package, version 3.20.9, of the R 3.4.0
language (http://bioconductor.org/packages/release/bioc/html/edgeR.html)
(23) was used with the training
dataset to identify significant differences in mRNA expression
between the 311 STAD samples and 37 control samples. There were two
thresholds selected: False discovery rate <0.05 and
|log2(fold-change)| >0.5. According to the
significant differences in mRNA expression between the training set
samples, two-way hierarchical clustering analysis of the mRNA
expression values was performed using pheatmap version 1.0.8 in R
3.4.0 (https://cran.r-project.org/web/packages/pheatmap/index.html)
(24) according to a centered
Pearson correlation algorithm (25).
Identification of prognosis-associated
mRNAs and clinical factors
Cox regression analysis was performed on the 311
STAD tumor samples in the training dataset using survival package
version 2.41.3 in R 3.4.0 (https://cran.r-project.org/web/packages/survival/index.html)
(26,27) to screen the mRNAs and clinical
factors for those significantly associated with overall survival
time. The screening threshold was log-rank test P<0.05.
Establishment and evaluation of the risk
assessment tool (RS model)
Selection of an optimal mRNA
combination
Based on the identified prognosis-associated mRNAs,
the optimal mRNA combination was identified by the LASSO
regularization regression algorithm (21) in the penalized package, version
0.9.50 in R 3.4.0 (https://cran.r-project.org/web/packages/penalized/index.html)
(28). Optimized parameter l in the
screening model was determined through cyclic execution of 1,000
repetitions of cross-validation likelihood (CVL) algorithm
(29).
Determination of the mRNA expression
level cutoff
For each mRNA included in the optimal mRNA
combination, the expression level cutoff value was determined using
the X-Tile Software (https://medicine.yale.edu/lab/rimm/research/software.aspx)
(30). Monte-Carlo P<0.05 was
used as the threshold to determine the cut-off value. The status of
each sample was determined according to the cut-off value of each
mRNA; when the mRNA expression level in the sample was higher
compared with the cut-off value, the status of this sample was
defined as 1; otherwise, the status of this sample was defined as
0. Subsequently, a sample RS model was constructed using a linear
combination of mRNA expression levels weighted by a regression
coefficient (β) (obtained using the Cox regression model); thus, a
prognostic index of each sample (i.e., RS) was calculated as
follows: RS = Σ [β (mRNAn) × status (mRNAn)].
The RS of each sample in the training set was calculated, and the
training samples were divided into prognostic high- (samples with
an RS value ≥ median RS value) and low-risk groups (samples with an
RS value < the median RS value) according to the median RS
value. The prognostic difference between the high- and low-risk
groups was evaluated using Kaplan-Meier curves and the significance
was calculated using the log-rank test, and the effectiveness of
the RS model was estimated by the area under the receiver-operating
characteristic curve. In the validation set, the expression level
of each mRNA was converted to the same probability distributions as
that of the training dataset using Z score transformation, and the
prognosis of the samples in the validation set was evaluated using
the RS model.
Construction of a nomogram to study
the association between independent prognostic factors and survival
prognosis
In order to further investigate the association
between clinical data and survival prognosis, the mRNAs identified
to be significantly associated with prognosis were used to develop
a nomogram using RMS package version 5.1–2 in R 3.4.0 (https://cran.r-project.org/web/packages/rms/index.html)
(30). The scoring criteria were
established according to the regression coefficients of all
independent variables. Each value of an independent variable was
assigned a score, and a total score was calculated for each sample.
The probability of the outcome for each sample was calculated from
the total score using a transforming function. The probability
evaluation was performed using the nomogram method (31), and the nomogram was used to assess
the association between the clinical factors and prognosis.
Screening and pathway analysis of
mRNAs associated with prognostic risk
The training dataset samples were divided into high-
and low-risk groups according to the RS. The differences between
the groups in the mRNA expression matrix of the samples were
analyzed using the edgeR package with false discovery rate <0.05
and |log2(fold-change)|>1 applied as thresholds to
define significant differences. Pathway enrichment analysis was
performed on the mRNAs with significant differential expression
between the high- and low-risk groups using the GSEA (32). P<0.05 was selected as the
threshold for identification of Kyoto Encyclopedia of Genes and
Genomes (KEGG) pathways significantly enriched in the DEG set
(33).
Results
Identification of mRNAs with
significant differential expression between groups with different
prognosis
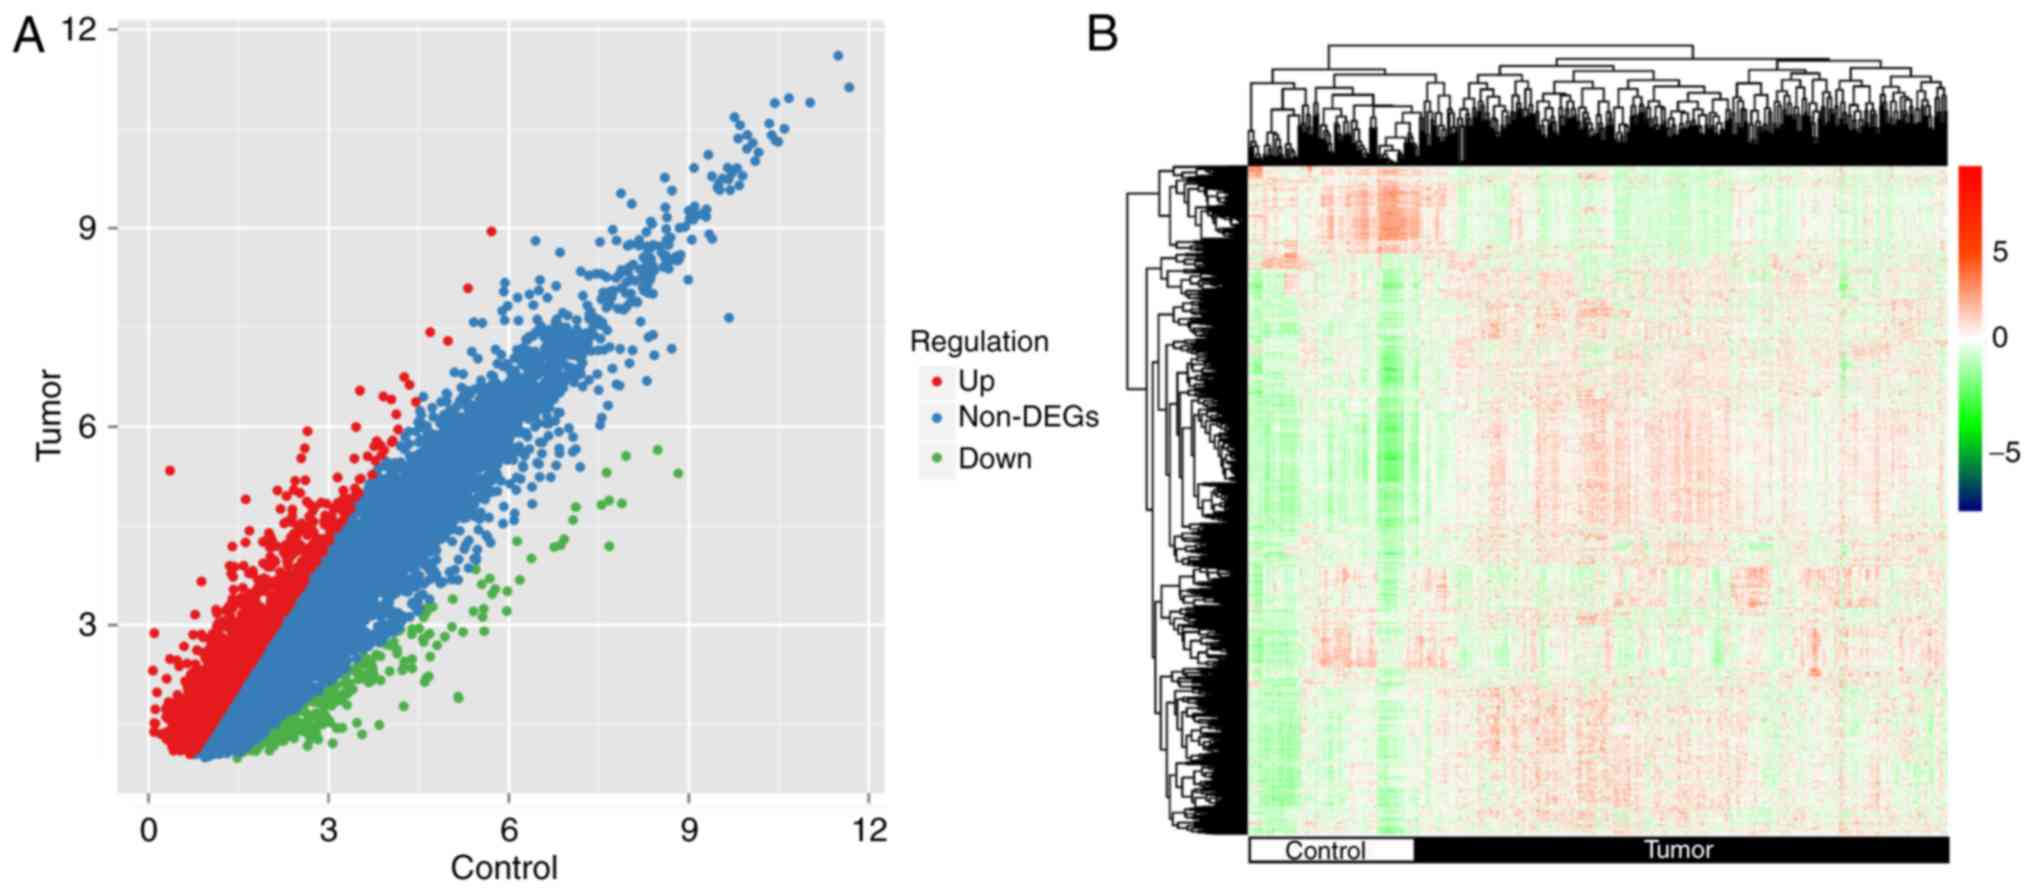
According to the source tissue, the 348 samples in
the training set were divided into 311 STAD and 37 control samples,
and the differences in the mRNA expression levels between the two
groups were analyzed using the edgeR package. A total of 1,597
significantly differentially expressed mRNAs were identified
(Fig. 2A). The results of
hierarchical clustering analysis revealed a significant difference
in the gene expression patterns between the tumor and control
samples (Fig. 2B).
Screening for prognosis-associated
genes and clinical factors
In the training set, univariate Cox regression
analysis was performed on the 1,597 significantly differentially
expressed mRNAs, 92 of which were identified to be significantly
associated with survival prognosis (P<0.05; data not shown). In
addition, the clinical information associated with the samples in
the training set was subjected to univariate and multivariate Cox
regression analyses; the results demonstrated that age, radiation
therapy and recurrence were significantly associated with prognosis
and were significant independent prognostic factors (Table II).
| Table II.Prognostic analysis of clinical
factors in the training dataset. |
Table II.
Prognostic analysis of clinical
factors in the training dataset.
|
| Univariate | Multivariate |
|---|
|
|
|
|
|---|
| Variables | HR (95% CI) | P-value | HR (95% CI) | P-value |
|---|
| Age, years | 1.023
(1.005–1.041) | 0.013a | 2.293
(1.334~3.943) | 0.003a |
| Sex,
male/female | 1.476
(0.989–2.201) | 0.055 | – | – |
| Subtype,
MSI-H/MSI-L/MSS/- | 1.191
(0.940–1.508) | 0.146 | – | – |
| Reflux,
yes/no/- | 0.718
(0.370–1.393) | 0.325 | – | – |
| Antireflux
treatment, yes/no/- | 0.899
(0.499–1.619) | 0.723 | – | – |
| H. pylori
infection, yes/no/- | 0.519
(0.222–1.212) | 0.123 | – | – |
| Radiation therapy,
yes/no/- | 0.467
(0.279–0.780) | 0.003a | 0.459
(0.223–0.948) | 0.035a |
| Pathological_M,
M0/M1/- | 2.480
(1.292–4.760) | 0.005a | 1.917
(0.666–5.518) | 0.228 |
| Pathological_N,
N0/N1/N2/N3 | 1.282
(1.091–1.506) | 0.002a | 1.062
(0.765–1.476) | 0.719 |
| Pathological_T,
T1/T2/T3/T4/- | 1.340
(1.067–1.684) | 0.012a | 1.339
(0.895–2.005) | 0.156 |
| Pathological stage,
I/II/III/IV/- | 1.565
(1.248–1.964) |
<0.001a | 1.208
(0.675–2.159) | 0.525 |
| Grade, 1/2/3/4 | 1.351
(0.947–1.927) | 0.020a | 1.513
(0.869–2.633) | 0.143 |
| Recurrence,
yes/no/- | 2.261
(1.407–3.635) |
<0.001a | 1.334
(1.047–3.943) | 0.001a |
Establishment and evaluation of the RS
model
Selection of an optimal mRNA
combination
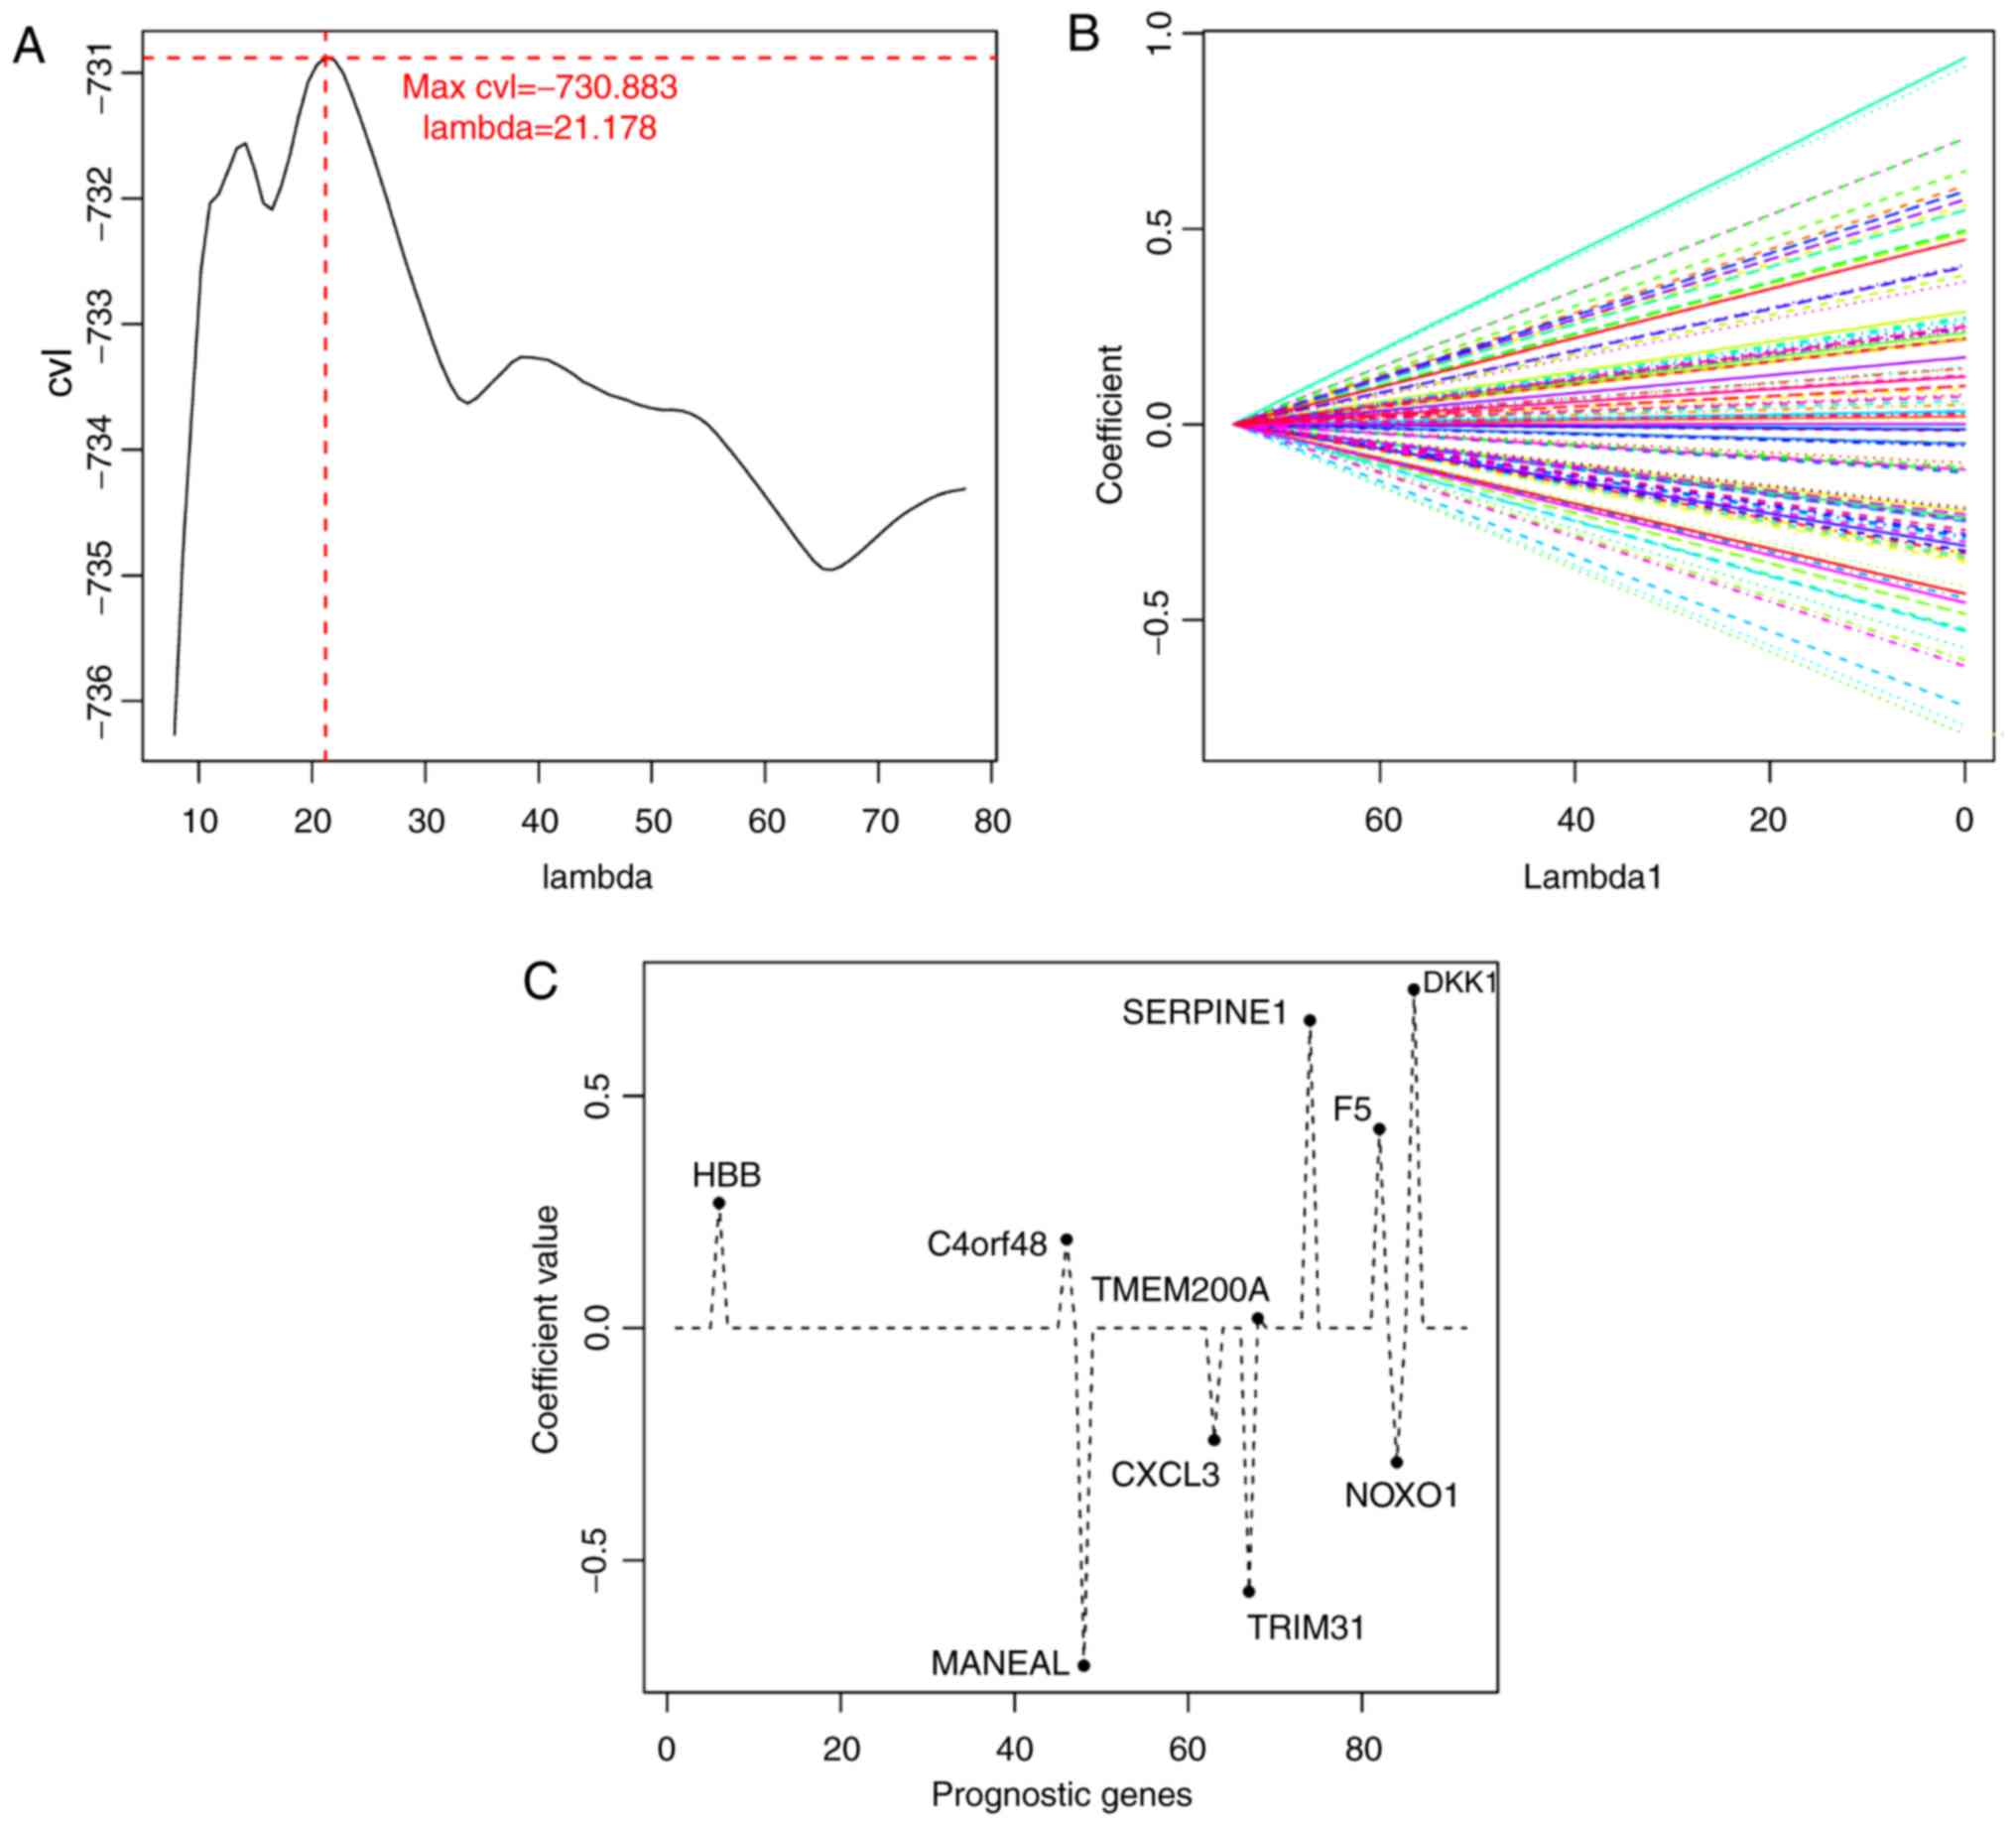
The expression matrix of the 92 mRNAs significantly
associated with prognosis in the training set was selected as the
input, and mRNA combinations were screened for optimal results
using the LASSO Cox regression model in the penalized package. In
the cyclic execution of the 1,000 CVL algorithm, the maximum CVL
value (−730.883) was obtained with λ=21.178 (Fig. 3A and B), and 10 mRNAs were selected
based on this parameter: Hemoglobin β (HBB), chromosome 4
open reading frame 48 (C4orf48), mannosidase endo-α-like
(MANEAL), C-X-C motif chemokine ligand 3 (CXCL3),
tripartite motif-containing 31 (TRIM31), transmembrane
protein 200A (TMEM200A), serpin family E member 1
(SERPINE1), coagulation factor V (F5), NADPH oxidase
organizer 1 (NOXO1) and Dickkopf WNT signaling pathway
inhibitor 1 (DKK1 (Table
III; Fig. 3C).
| Table III.Optimized mRNA combination. |
Table III.
Optimized mRNA combination.
| Gene | coef | HR (95%CI) | P-value |
|---|
| HBB | 0.270 | 1.115
(1.012–1.230) | 0.028 |
| C4orf48 | 0.191 | 1.206
(1.043–1.394) | 0.011 |
| MANEAL | −0.726 | 0.756
(0.639–0.895) | 0.001 |
| CXCL3 | −0.240 | 0.891
(0.807–0.984) | 0.023 |
| TRIM31 | −0.567 | 0.869
(0.788–0.959) | 0.005 |
|
TMEM200A | 0.022 | 1.234
(1.026–1.484) | 0.025 |
|
SERPINE1 | 0.663 | 1.236
(1.093–1.397) | 0.001 |
| F5 | 0.429 | 1.147
(1.025–1.282) | 0.016 |
| NOXO1 | −0.288 | 0.782
(0.669–0.914) | 0.002 |
| DKK1 | 0.729 | 1.129
(1.045–1.220) | 0.002 |
Determination of the mRNA expression
cutoff values
For each mRNA included in the optimal mRNA
combination, the expression level cut-off value was selected using
the X-Tile Software with the Monte-Carlo P<0.05. As presented in
Fig. 4, the cut-off values of
HBB, C4orf48, DKK1, F5, NOXO1, SERPINE1, CXCL3, TMEM200A,
MANEAL and TRIM31 were 6.4, 4.4, 1.6, 3.0, 1.2, 3.8,
5.8, 0.9, 1.4 and 0.9, respectively. Improved survival time was
observed in patients with high expression levels of HBB,
C4orf48, DKK1, F5, SERPINE1 and TMEM200A compared with
patients with high expression levels of these genes, as well as in
patients with low expression levels of NOXO1, CXCL3, MANEAL
and TRIM31 compared with patients with low expression levels
of these genes (Fig. 4).
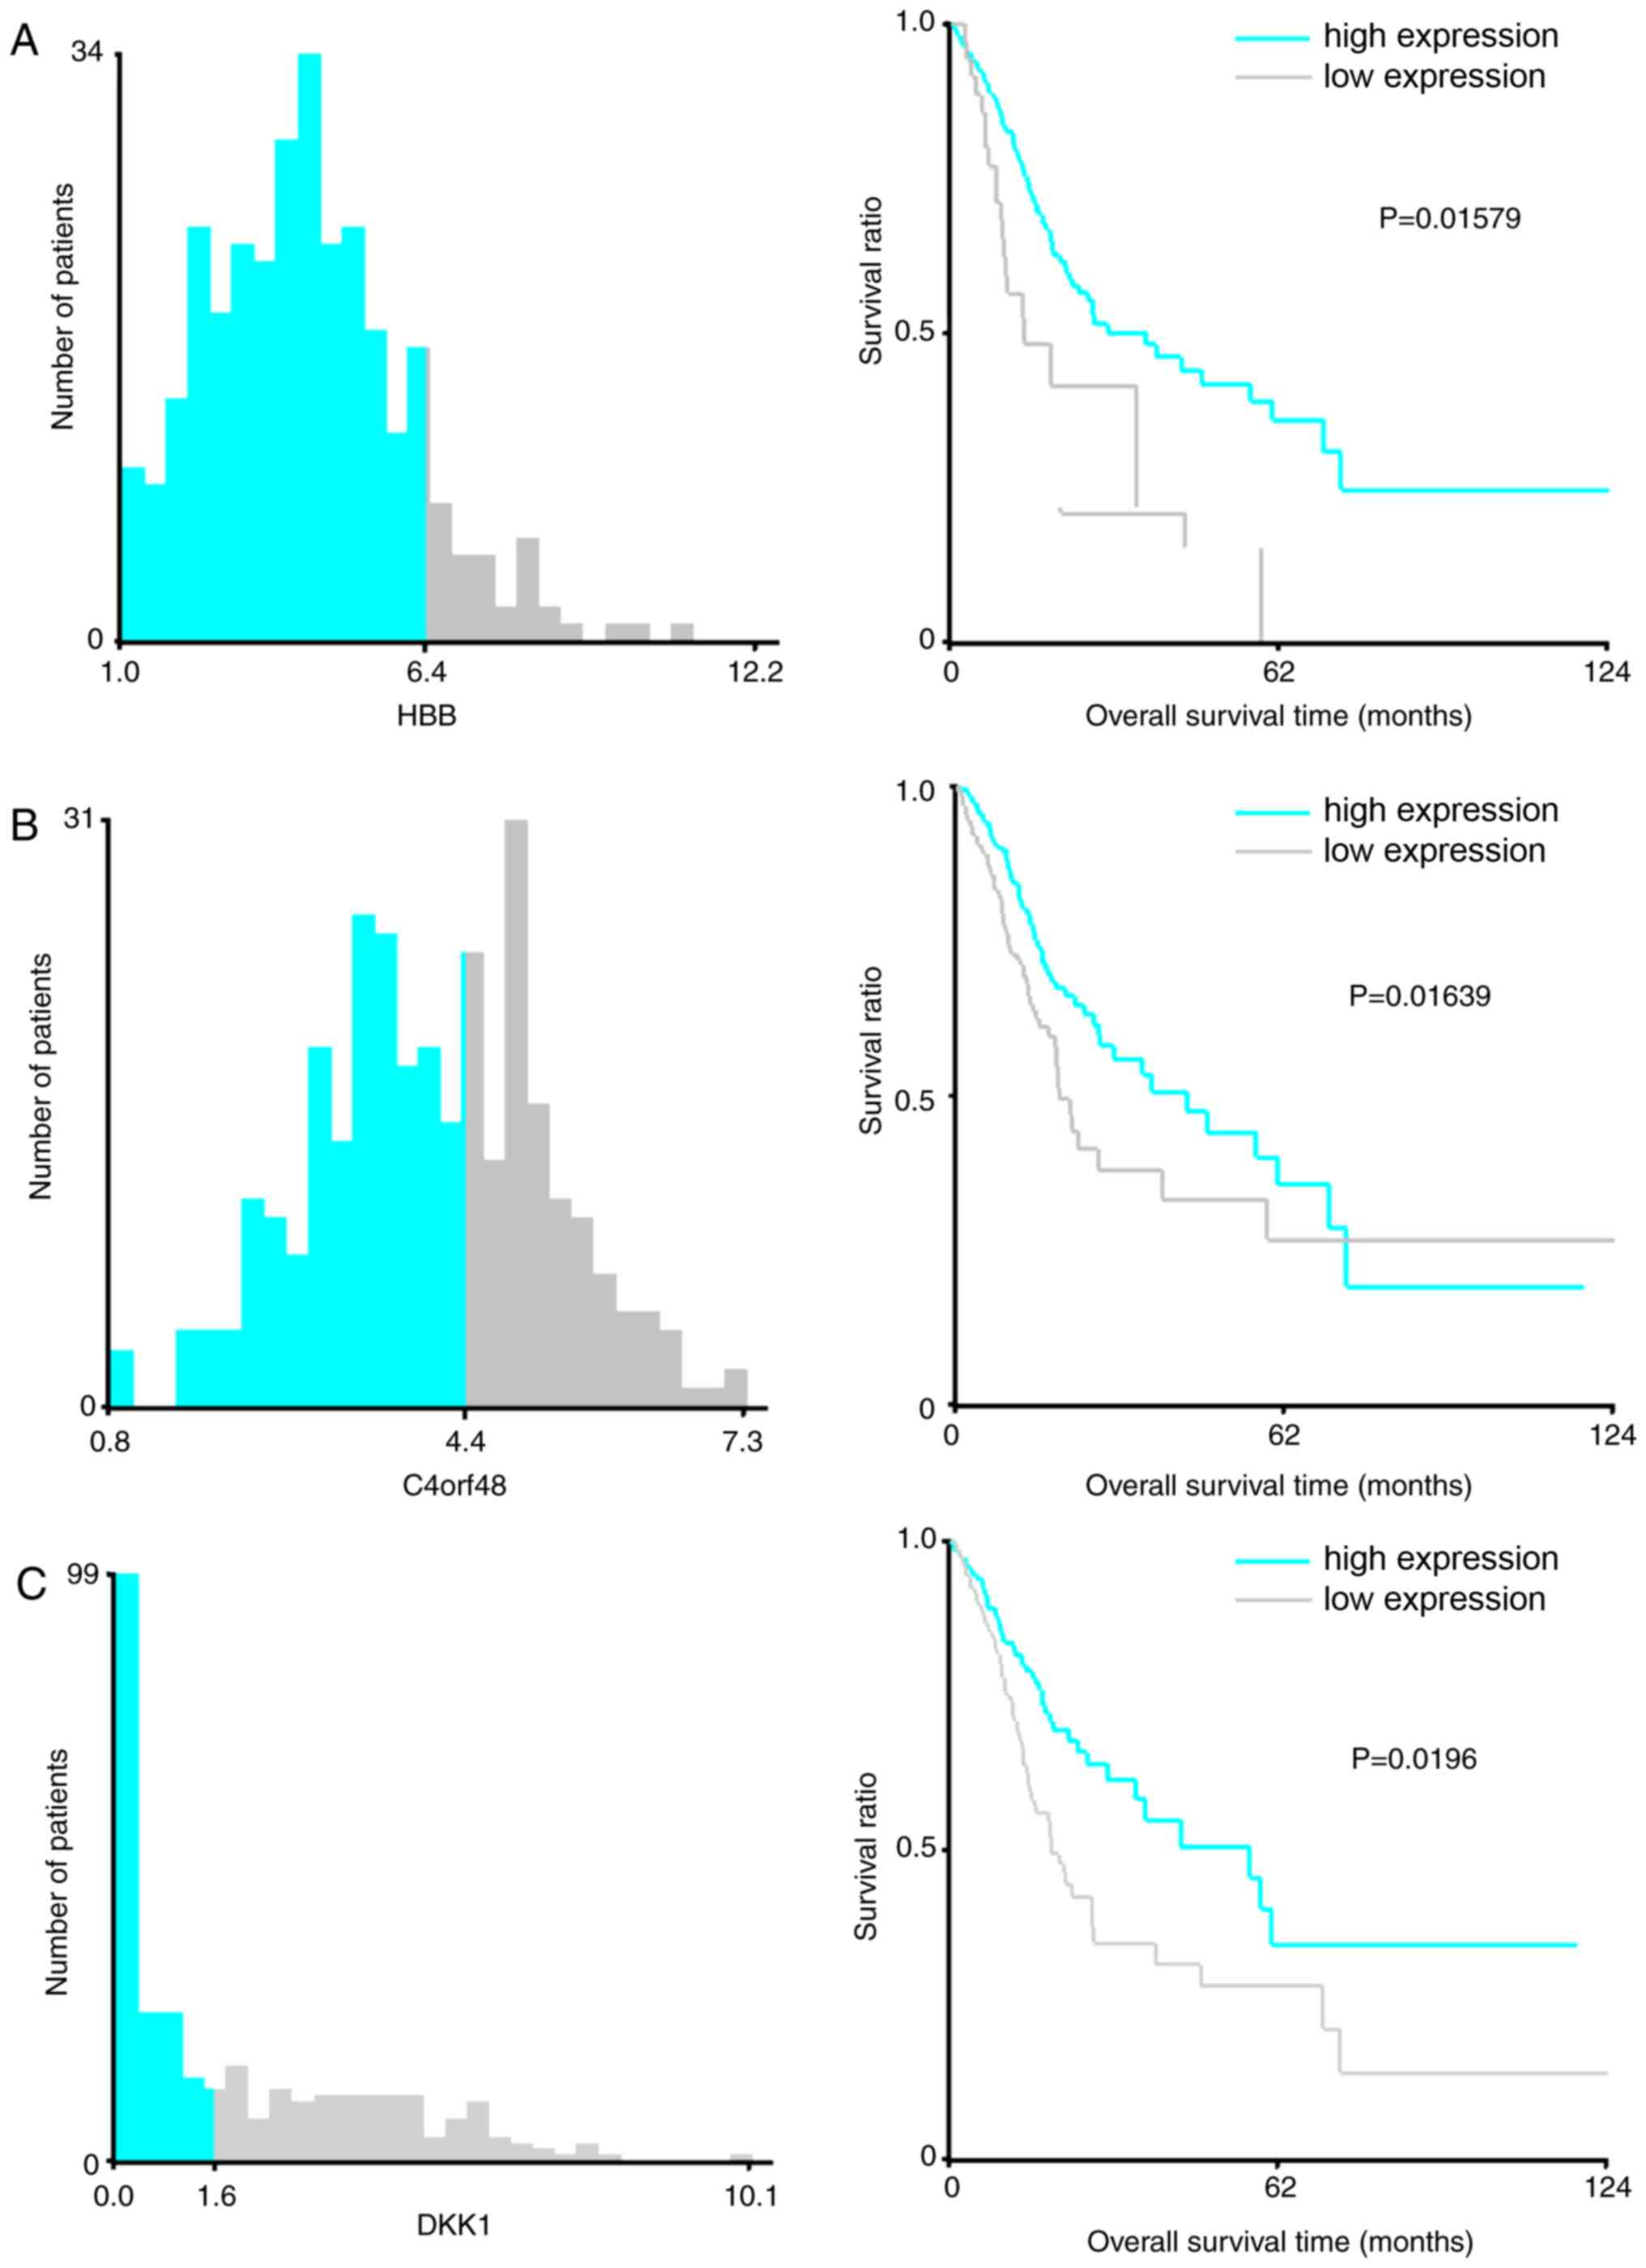 | Figure 4.X-Tile analysis results on (A)
HBB, (B) C4orf48 and (C) DKK1. Cyan and gray
bars indicate the number of samples exhibiting high- and
low-expression levels, respectively. The number at the junction of
two colors represents the cutoff value of for high- and
low-expression samples. In the right panel, cyan and gray
Kaplan-Meier curves represent mRNAs in the high- and low-expression
groups, respectively. HBB, hemoglobin β; C4orf48,
chromosome 4 open reading frame 48; MANEAL, mannosidase
endo-α-like; CXCL3, C-X-C motif chemokine ligand 3;
TRIM31, tripartite motif-containing 31; TMEM200A,
transmembrane protein 200A; SERPINE1, serpin family E member
1; F5, coagulation factor V; NOXO1, NADPH oxidase
organizer 1; DKK1, Dickkopf WNT signaling pathway inhibitor
1; AUC, area under the curve. X-Tile analysis results on (D)
F5, (E) NOXO1 and (F) SERPINE1. Cyan and gray
bars indicate the number of samples exhibiting high- and
low-expression levels, respectively. The number at the junction of
two colors represents the cutoff value of for high- and
low-expression samples. In the right panel, cyan and gray
Kaplan-Meier curves represent mRNAs in the high- and low-expression
groups, respectively. HBB, hemoglobin β; C4orf48,
chromosome 4 open reading frame 48; MANEAL, mannosidase
endo-α-like; CXCL3, C-X-C motif chemokine ligand 3;
TRIM31, tripartite motif-containing 31; TMEM200A,
transmembrane protein 200A; SERPINE1, serpin family E member
1; F5, coagulation factor V; NOXO1, NADPH oxidase
organizer 1; DKK1, sDickkopf WNT signaling pathway inhibitor
1; AUC, area under the curve. X-Tile analysis results on (G)
CXCL3, (H) TMEM200A (I) MANEAL. Cyan and gray
bars indicate the number of samples exhibiting high- and
low-expression levels, respectively. The number at the junction of
two colors represents the cutoff value of for high- and
low-expression samples. In the right panel, cyan and gray
Kaplan-Meier curves represent mRNAs in the high- and low-expression
groups, respectively. HBB, hemoglobin β; C4orf48,
chromosome 4 open reading frame 48; MANEAL, mannosidase
endo-α-like; CXCL3, C-X-C motif chemokine ligand 3;
TRIM31, tripartite motif-containing 31; TMEM200A,
transmembrane protein 200A; SERPINE1, serpin family E member
1; F5, coagulation factor V; NOXO1, NADPH oxidase
organizer 1; DKK1, Dickkopf WNT signaling pathway inhibitor
1; AUC, area under the curve. X-Tile analysis results on (J)
CXCL3. Cyan and gray bars indicate the number of samples
exhibiting high- and low-expression levels, respectively. The
number at the junction of two colors represents the cutoff value of
for high- and low-expression samples. In the right panel, cyan and
gray Kaplan-Meier curves represent mRNAs in the high- and
low-expression groups, respectively. HBB, hemoglobin β;
C4orf48, chromosome 4 open reading frame 48; MANEAL,
mannosidase endo-α-like; CXCL3, C-X-C motif chemokine ligand
3; TRIM31, tripartite motif-containing 31; TMEM200A,
transmembrane protein 200A; SERPINE1, serpin family E member
1; F5, coagulation factor V; NOXO1, NADPH oxidase
organizer 1; DKK1, Dickkopf WNT signaling pathway inhibitor
1; AUC, area under the curve. |
The RS prediction model was established as follows:
RS = 0.27 × status (HBB) + 0.191 × status (C4orf48) +
(−0.726) × status (MANEAL) + (−0.240) × status
(CXCL3) + (−0.567) × status (TRIM31) + 0.022 × status
(TMEM200A) + 0.663 × status (SERPINE1) + 0.429 ×
status (F5) + (−0.288) × status (NOXO1) + 0.729 ×
Status (DKK1). The RS prediction model was used to evaluate
and verify the risk prediction effect for samples in the training
and validation datasets (Fig. 5).
According to the median RS value, high- and low-risk stratified
analyses of the samples were performed. As exhibited in Table IV, five clinical factors were
revealed to be associated with overall survival time according to
univariable analysis, including age, pathological T, pathological
stage, radiation therapy and recurrence in the low-risk group
(P<0.05). Further multivariable Cox regression analysis revealed
that radiation therapy was an independent clinical factor
associated with STAD prognosis (P=0.035). In the high-risk group,
H. pylori infection, pathological T, pathological N,
pathological M, pathological stage and tumor grade were
significantly associated with overall survival time (P<0.05).
Among these factors, pathological N was an independent clinical
factor for STAD prognosis (P=0.011).
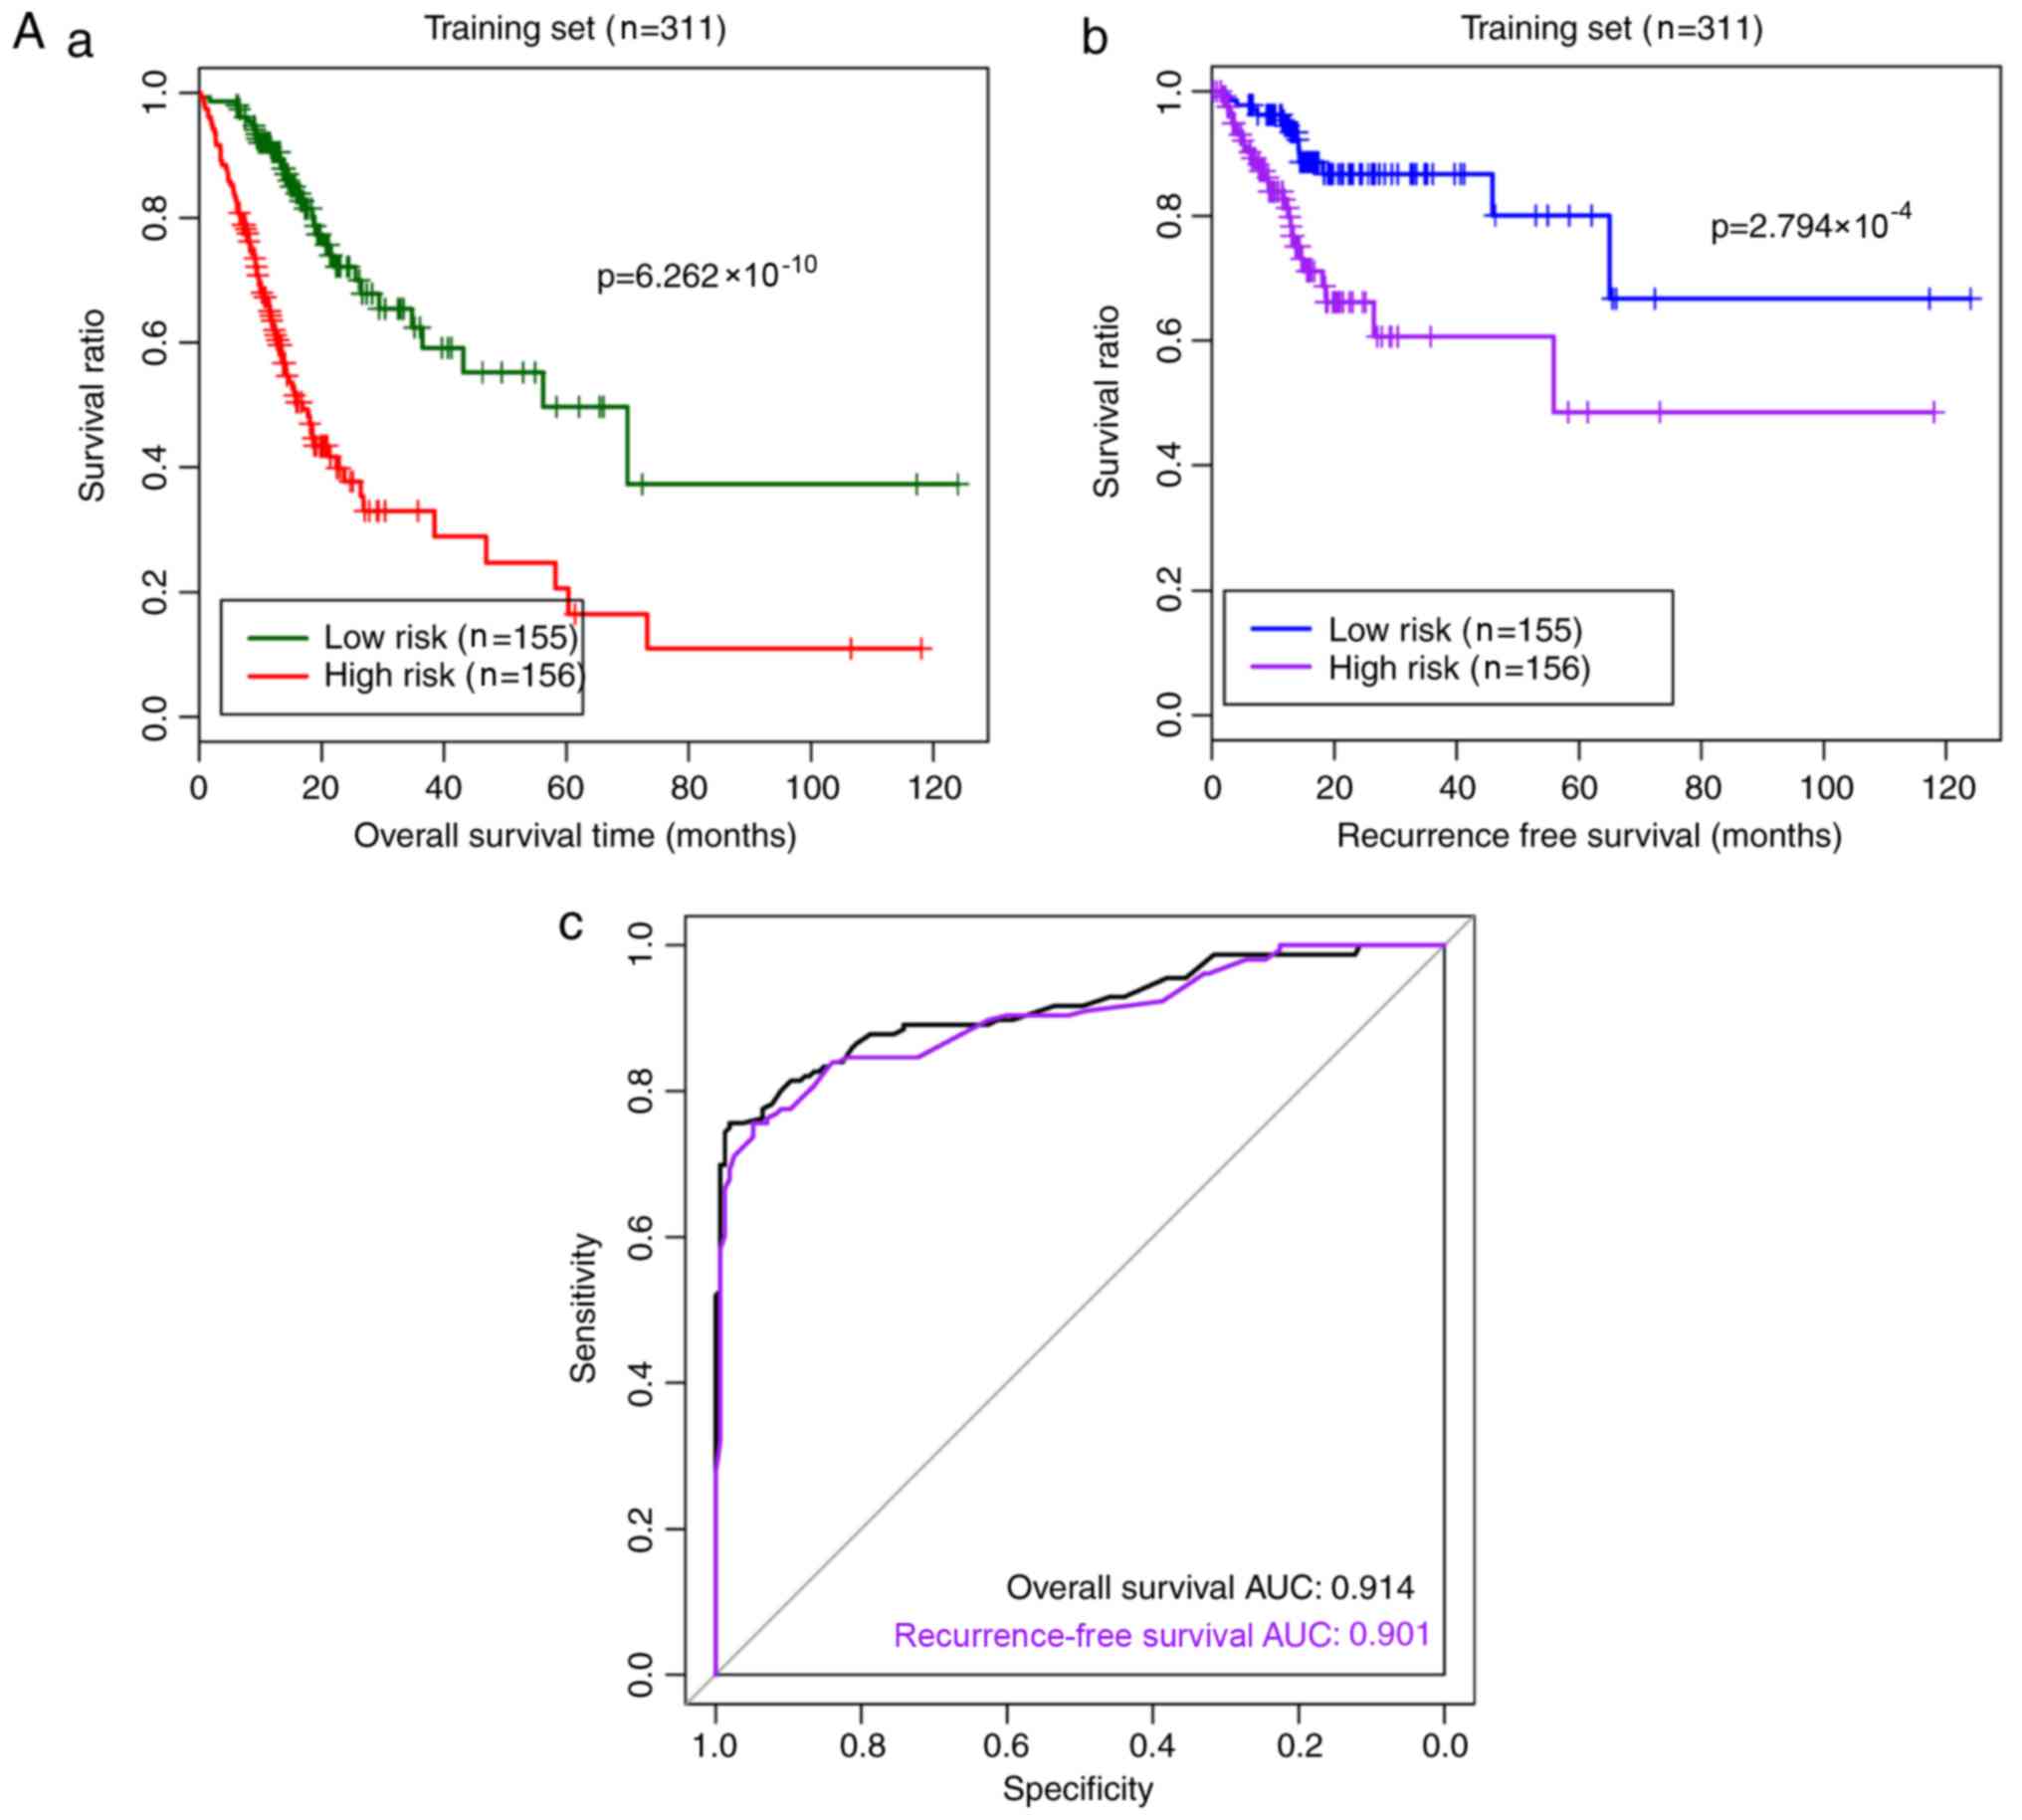 | Figure 5.Risk prediction effect of the RS
model for samples in the (A) training and (B) validation datasets.
(A-a) The Kaplan-Meier curves of overall survival in the training
dataset. Green and red curves denote low- and high-risk samples,
respectively. (A-b) The Kaplan-Meier curves of recurrence-free
survival in the training set. Blue and purple curves represent low-
and high-risk samples, respectively. (A-c) The ROC curve for the
training set. Black and purple indicate ROC curves for overall and
recurrence-free survival, respectively. (B-a) The Kaplan–Meier
curves of overall survival in the validation set. Green and red
curves represent low- and high-risk samples, respectively. (B-b)
The Kaplan-Meier curves of recurrence-free survival in the
validation set. Blue and purple curves represent low- and high-risk
samples, respectively. (B-c) The ROC curve for the validation set.
Black and purple indicate ROC curves for overall and
recurrence-free survival, respectively. ROC, receiver operating
characteristic; AUC, area under the curve. Risk prediction effect
of the RS model for samples in the (A) training and (B) validation
datasets. (A-a) The Kaplan-Meier curves of overall survival in the
training dataset. Green and red curves denote low- and high-risk
samples, respectively. (A-b) The Kaplan-Meier curves of
recurrence-free survival in the training set. Blue and purple
curves represent low- and high-risk samples, respectively. (A-c)
The ROC curve for the training set. Black and purple indicate ROC
curves for overall and recurrence-free survival, respectively.
(B-a) The Kaplan-Meier curves of overall survival in the validation
set. Green and red curves represent low- and high-risk samples,
respectively. (B-b) The Kaplan-Meier curves of recurrence-free
survival in the validation set. Blue and purple curves represent
low- and high-risk samples, respectively. (B-c) The ROC curve for
the validation set. Black and purple indicate ROC curves for
overall and recurrence-free survival, respectively. ROC, receiver
operating characteristic; AUC, area under the curve. |
| Table IV.Stratified analysis of
clinicopathological characteristics in the high- and low-risk
groups. |
Table IV.
Stratified analysis of
clinicopathological characteristics in the high- and low-risk
groups.
| A, Low-risk group
(n=155) |
|---|
|
|---|
|
| Univariate | Multivariate |
|---|
|
|
|
|
|---|
| Variables | HR (95% CI) | P-value | HR (95% CI) | P-value |
|---|
| Age, years | 1.060
(1.020–1.103) | 0.003a | 1.041
(0.99–1.096) | 0.118 |
| Sex,
male/female | 1.207
(0.613–2.375) | 0.586 | – | – |
| Subtype,
MSI-H/MSI-L/MSS/- | 0.938
(0.650–1.353) | 0.732 | – | – |
| Reflux,
yes/no/- | 1.240
(1.092–2.647) | 0.997 | – | – |
| H. pylori
infection, yes/no/- | 0.969
(0.286–3.287) | 0.960 | – | – |
| Pathological T,
T1-T2/T3-T4/- | 1.320
(0.865–2.016) | 0.198 | – | – |
| Pathological N,
N0-N1/N2-N3/- | 1.367
(1.014–1.843) | 0.040a | 1.022
(0.598–1.746) | 0.937 |
| Pathological M,
M0/M1/- | 1.148
(0.273–4.821) | 0.851 | – | – |
| Pathological stage,
I/II/III/IV/- | 1.804
(1.158–2.810) | 0.009a | 2.006
(0.872–4.612) | 0.101 |
| Grade, 1/2/3/4 | 0.882
(0.476–1.637) | 0.691 | – | – |
| Anti-reflux
treatment, yes/no/- | 1.177
(0.443–3.130) | 0.743 | – | – |
| Radiation therapy,
yes/no/- | 0.198
(0.068–0.575) | 0.003a | 0.197
(0.044–0.889) | 0.035a |
| Recurrence,
yes/no/- | 3.622
(1.466–8.948) | 0.005a | 1.911
(0.691–5.289) | 0.212 |
|
| B, High-risk
group (n=156) |
|
|
|
Univariate |
Multivariate |
|
|
|
|
|
Variables | HR (95%
CI) | P-value | HR (95%
CI) | P-value |
|
| Age, years | 1.012
(0.992–1.032) | 0.247 | – | – |
| Sex,
male/female | 1.334
(0.808–2.204) | 0.260 | – | – |
| Subtype,
MSI-H/MSI-L/MSS/- | 1.138
(0.818–1.583) | 0.444 | – | – |
| Reflux,
yes/no/- | 0.751
(0.378–1.492) | 0.413 | – | – |
| H. pylori
infection, yes/no/- | 0.166
(0.038–0.725) | 0.017a | 0.175
(0.039–0.777) | 0.171 |
| Pathological T,
T1-T2/T3-T4/- | 1.542
(1.157–2.054) | 0.003a | 1.689
(0.757–3.771) | 0.201 |
| Pathological N,
N0-N1/N2+N3/- | 1.307
(1.077–1.586) | 0.007a | 1.790
(1.145–2.796) | 0.011a |
| Pathological M,
M0/M1/- | 3.965
(1.858–8.465) |
<0.001a | 5.620
(1.297–14.348) | 0.199 |
| Pathological stage,
I/II/III/IV/- | 1.643
(1.254–2.152) |
<0.001a | 0.963
(0.465–1.992) | 0.918 |
| Grade, 1/2/3/4 | 1.552
(0.995–2.420) | 0.053 | – | – |
| Anti-reflux
treatment, yes/no/- | 0.490
(0.209–1.148) | 0.101 | – | – |
| Radiation therapy,
yes/no/- | 0.902
(0.501–1.624) | 0.730 | – | – |
| Recurrence,
yes/no/- | 1.342
(0.767–2.349) | 0.302 | – | – |
Association between clinical factors
and survival prognosis according to the nomogram analysis
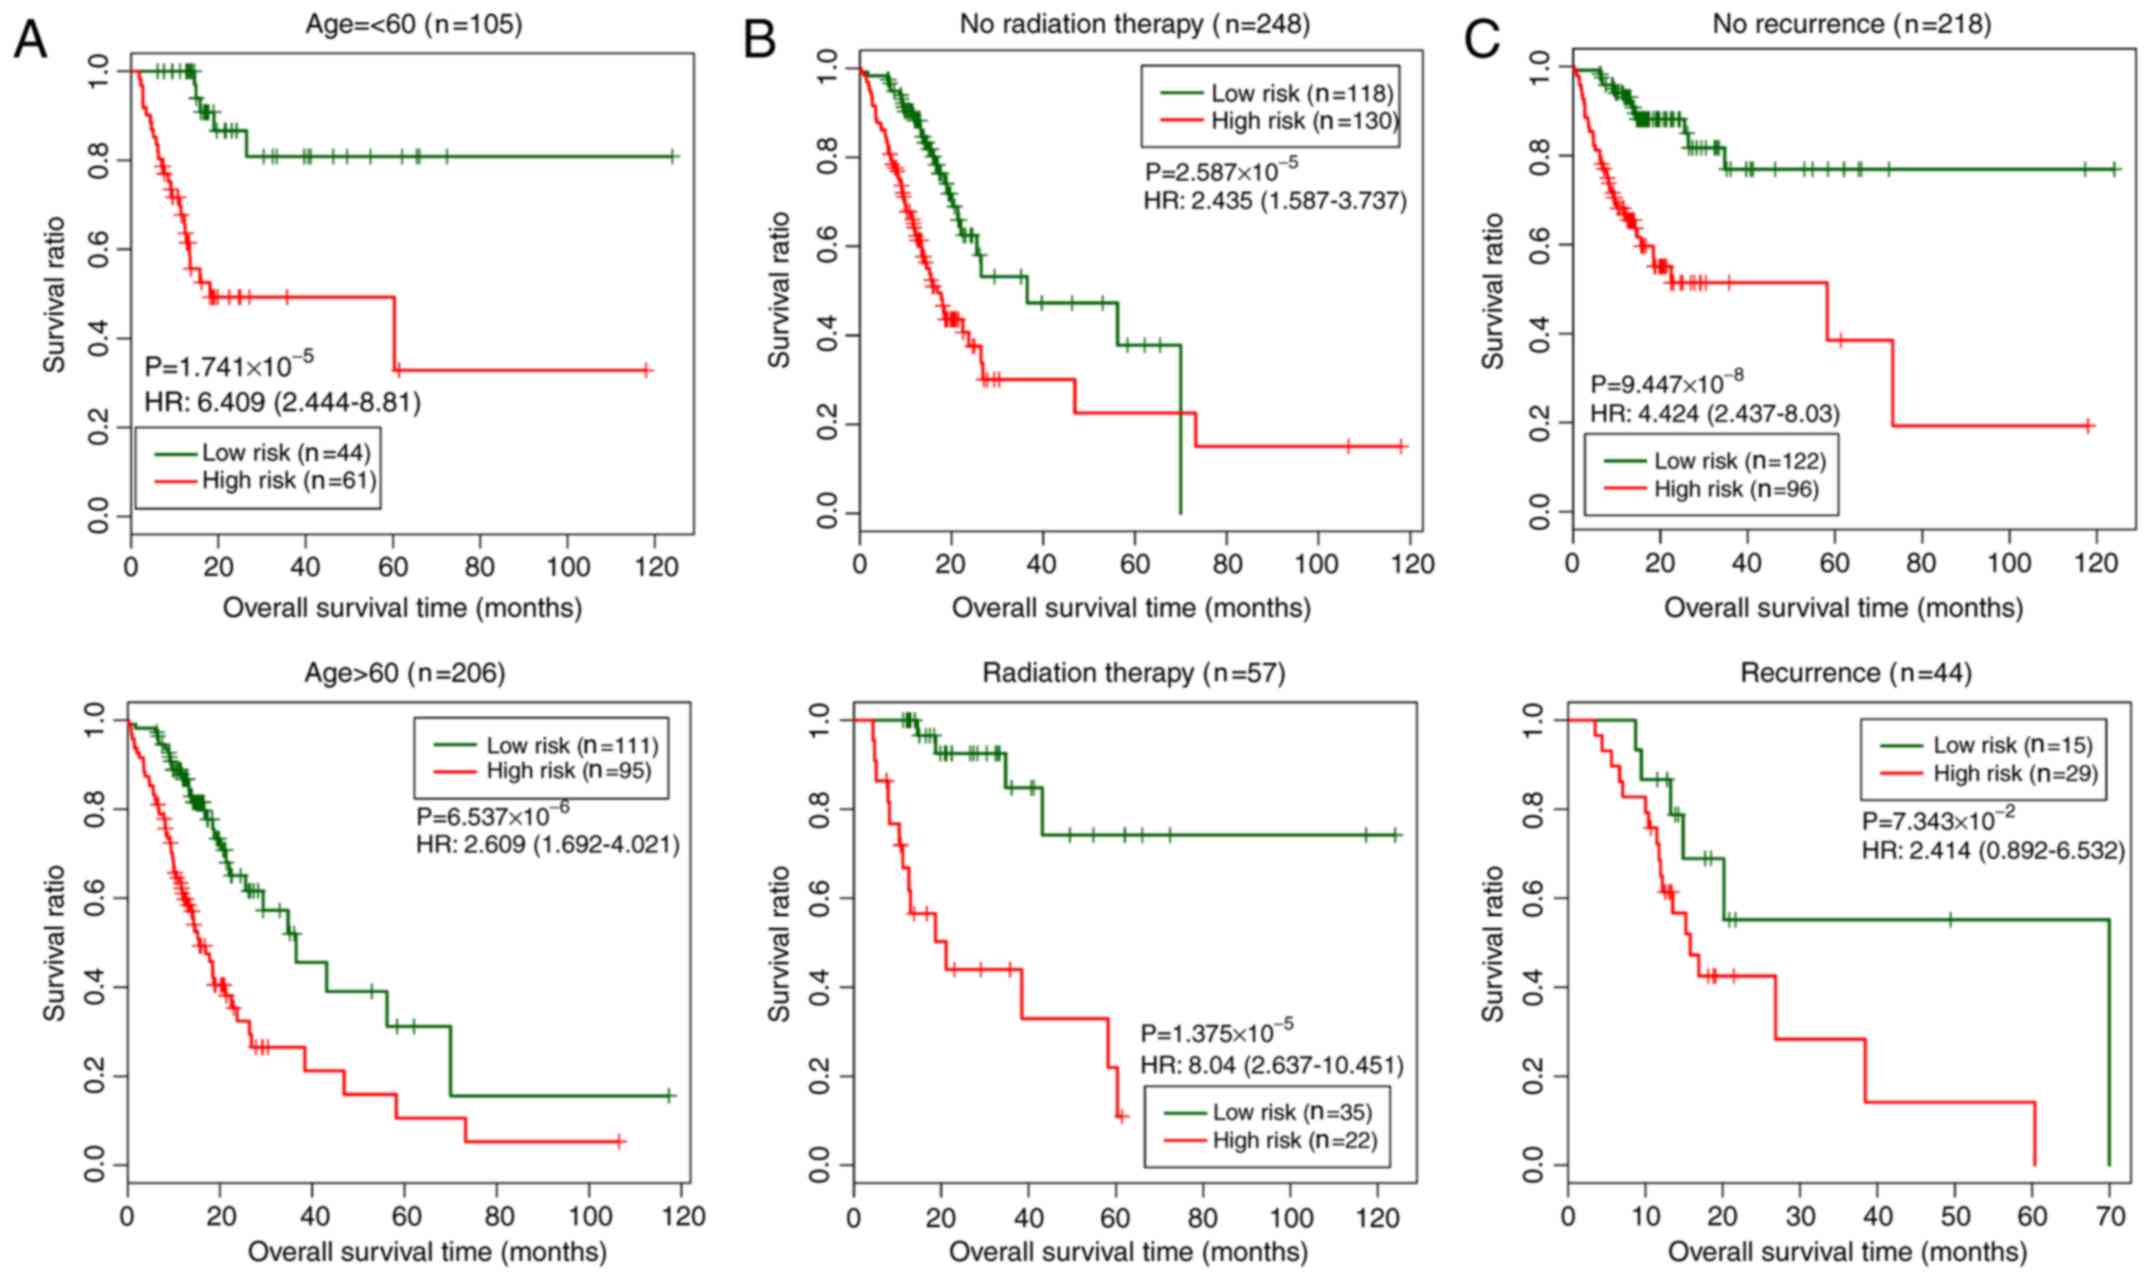
In the training set, three clinical factors (age,
radiation therapy and recurrence) were subjected to stratified
analysis in order to study the differences between the low- and
high-risk groups for each clinical factor (Fig. 6). As shown in Fig. 6, the low-risk group exhibited longer
overall survival times than the high-risk group.
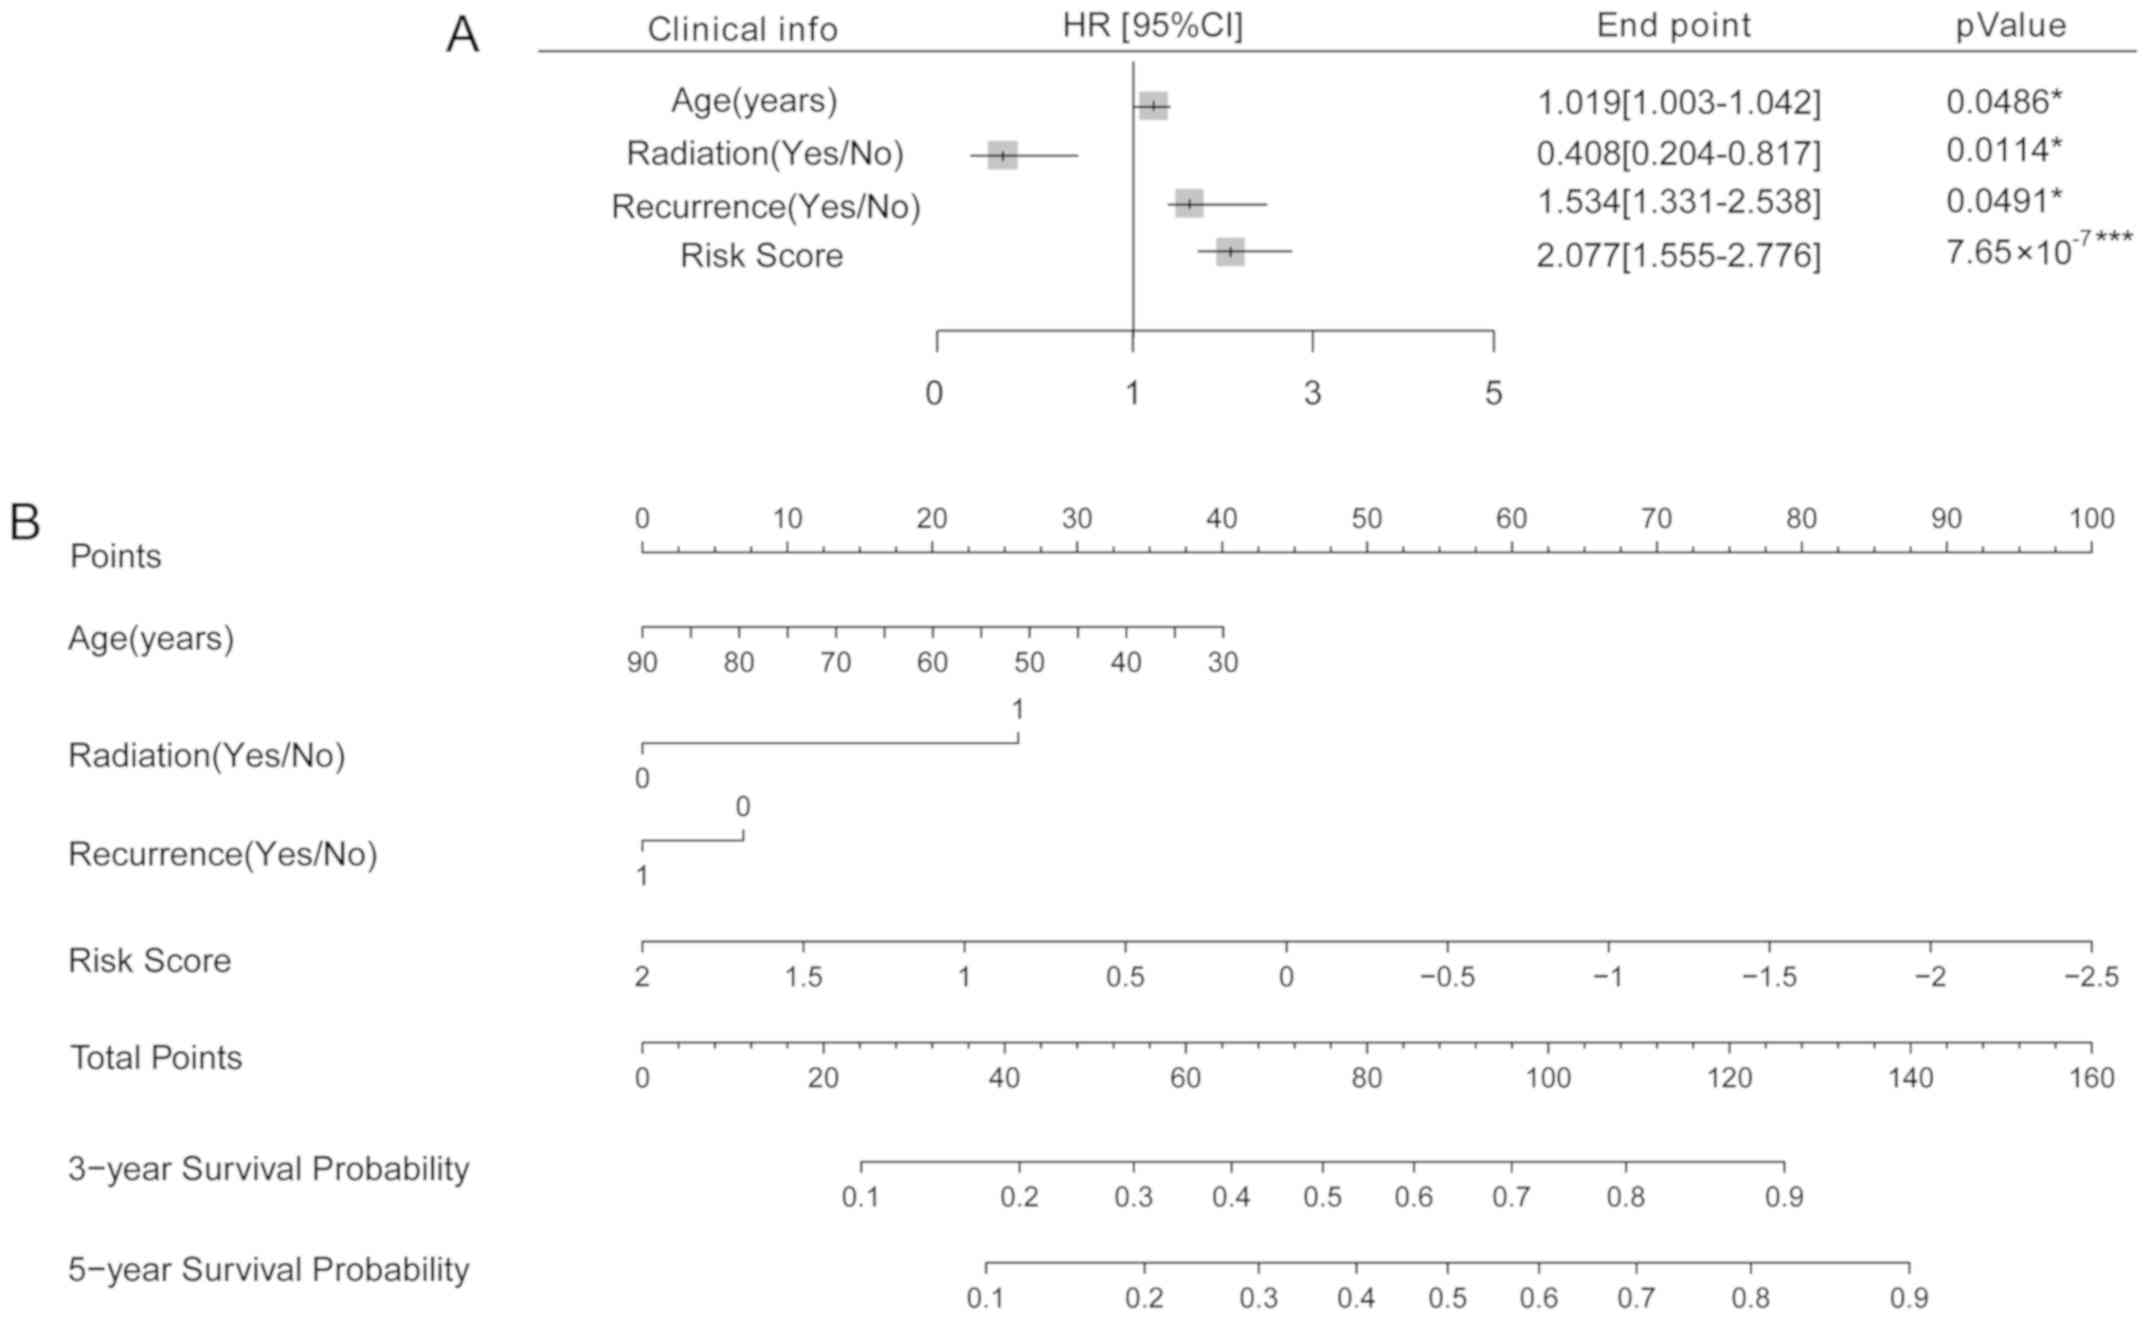
In order to further analyze the association between
age, radiation treatment, recurrence, and risk score with survival
prognosis, a nomogram analysis was performed. Cox regression
analysis suggested these four clinical factors were all
significantly associated with survival prognosis (P<0.05,
Fig. 7A). Then, a nomogram was
established to predict the survival time of the samples. According
to the nomogram, the 3- and 5- year survival probability may be
predicted by matching the clinical indicators to the ‘Total Points’
axis (Fig. 7B).
Pathway analysis of the mRNAs
associated with prognosis
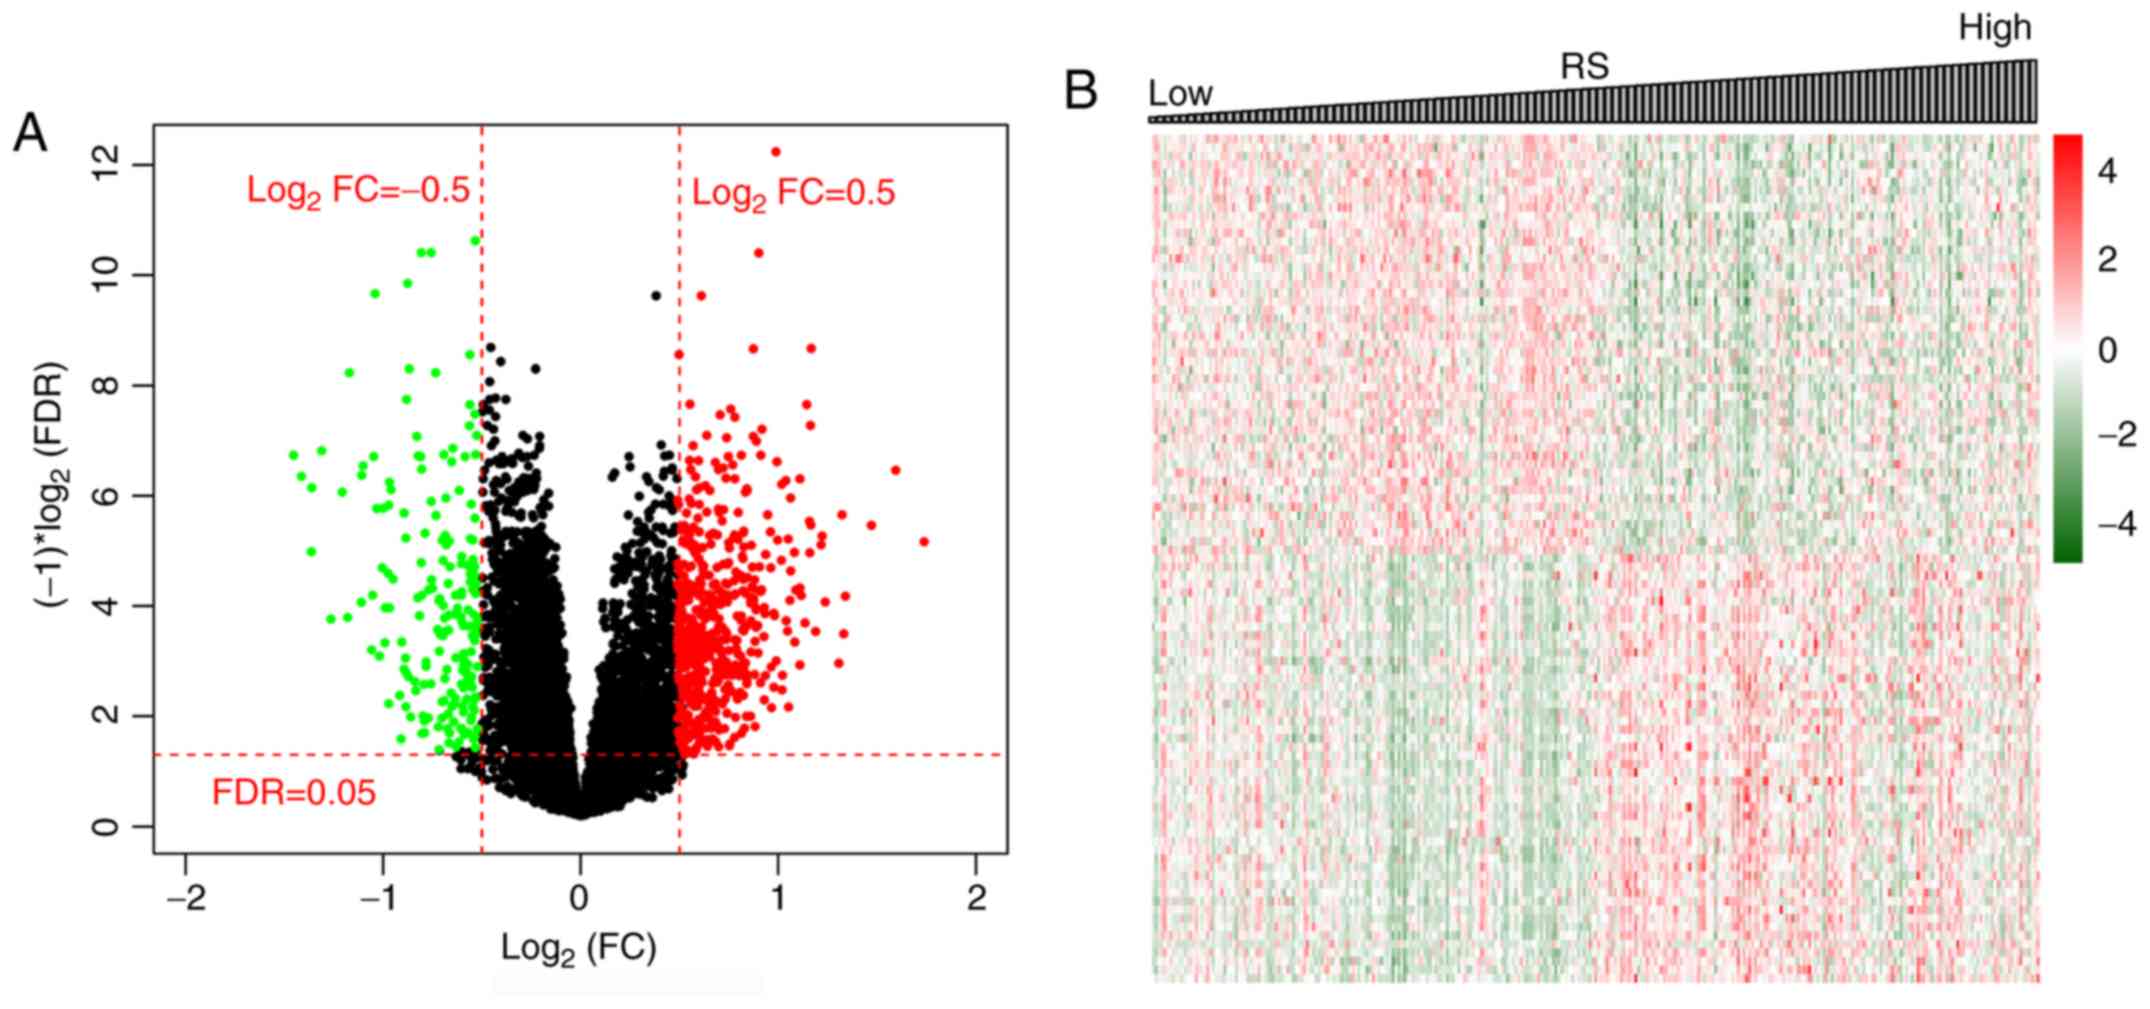
The training dataset was subdivided into high- and
low-risk groups according to the RS, and the differences in the
mRNA expression matrix of the samples between these groups were
analyzed using the edgeR package (Fig.
8A). A total of 728 significant DEGs were identified, including
221 downregulated and 507 upregulated DEGs. The samples were sorted
according to the cor value and were clustered using the top
100 DEGs (top 50 positive and negative cor values; Fig. 8B).
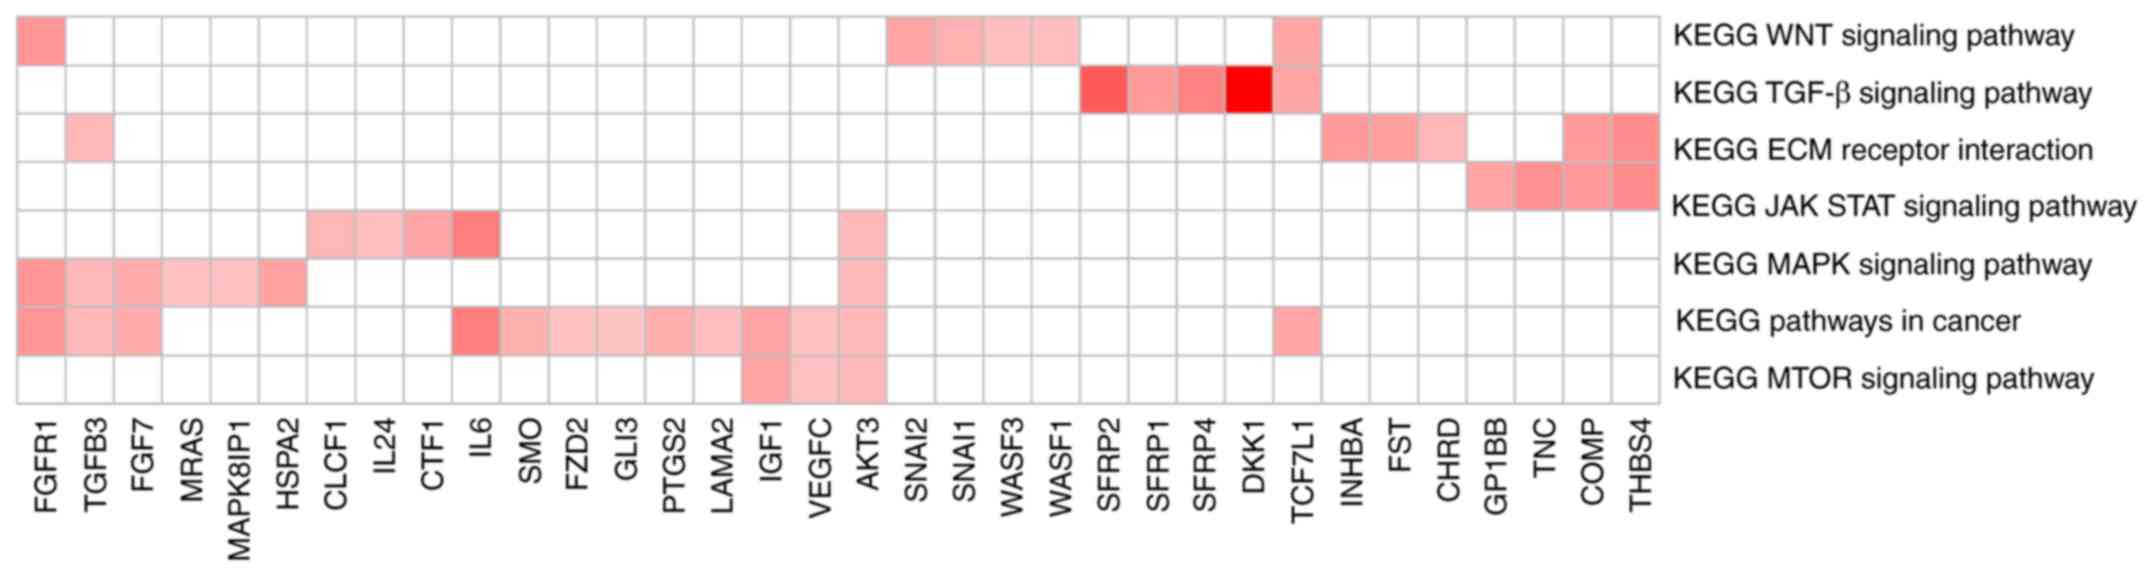
GSEA pathway enrichment annotation was performed on
the DEGs significantly associated with risk factors, and a total of
eight significant KEGG pathways were identified (Table V). The heatmap of the genes involved
in each pathway and the association between gene expression levels
and pathways are presented in Fig.
9.
| Table V.KEGG pathways significantly
associated with risk grouping. |
Table V.
KEGG pathways significantly
associated with risk grouping.
| Name | ES | NES | NOM P-value |
|---|
|
KEGG_ADHERENS_JUNCTION | 0.608 | 1.288 | 0.017 |
|
KEGG_TGF_BETA_SIGNALING_PATHWAY | 0.605 | 1.167 | 0.030 |
|
KEGG_ECM_RECEPTOR_INTERACTION | 0.567 | 1.076 | 0.041 |
|
KEGG_WNT_SIGNALING_PATHWAY | 0.524 | 1.093 | 0.042 |
|
KEGG_JAK_STAT_SIGNALING_PATHWAY | 0.429 | 1.009 | 0.043 |
|
KEGG_MAPK_SIGNALING_PATHWAY | 0.486 | 1.050 | 0.045 |
|
KEGG_PATHWAYS_IN_CANCER | 0.366 | 1.015 | 0.047 |
|
KEGG_MTOR_SIGNALING_PATHWAY | 0.589 | 1.017 | 0.049 |
Discussion
The aberrant expression levels of certain genes are
significantly associated with the pathogenesis and prognosis of GC
(34). In the present study, a large
amount of mRNA expression profiling data and clinical information
from patients with STAD documented in TCGA database were used to
identify statistically significant DEGs between STAD and healthy
tissues. A total of 92 mRNAs significantly associated with survival
were obtained by univariate Cox regression analysis.
The risk assessment tools that are based on gene
expression levels can identify high-risk populations in relation to
a specific disease and may be useful in the subsequent clinical
decision-making process for healthcare providers and patients
(12). In order to construct a risk
assessment tool for the assessment of prognosis in patients with
STAD, an optimal mRNA combination was identified among the 92
significant DEGs comprising 10 mRNAs in the present study, which
were selected as a prognostic gene signature to create the RS
model. The effectiveness of this model was evaluated in the
training and validation datasets, and the results suggested that
this risk assessment tool was useful for identifying populations
with a high risk of developing STAD. To the best of our knowledge,
aside from the present study, there is only one published RS model
constructed according to gene expression levels, which includes a
53-gene signature and a prognostic scoring system (20). There are two other risk assessment
tools that have been developed for the Japanese population, and
their risk factors include age, sex, the combination of an
anti-H. pylori antibody and serum pepsinogen, HbA1c level,
smoking status, family history of GC and consumption of high-salt
food (12,18). The risk assessment tool developed in
the present study is simple and inexpensive enough to be used both
in normal clinical practice and for mass screening.
The results of the present study revealed an
improved prognosis for patients with high expression levels of
HBB, C4orf48, DKK1, F5, SERPINE1 and TMEM200A and low
expression levels of NOXO1, CXCL3, MANEAL and TRIM31.
Although there are limited relevant studies on F5 and
TMEM200A, certain functions of the remaining genes have been
investigated. HBB is a globin protein constituting the most common
form of hemoglobin in adult humans, and abnormal expression of HBB
can lead to blood diseases, such as hemoglobinopathy and hereditary
nigremia (11,35). C4orf48 is a gene identified in
the Wolf-Hirschhorn syndrome critical chromosomal region that
encodes a putative neuropeptide and is important for development of
the neocortex and cerebellar (36)
and cell differentiation (37). DKK1
protein is a soluble inhibitor of WNT that serves important roles
in skeletal development (38) and is
associated with the presence of lytic bone lesions in patients with
multiple myeloma (39).
SERPINE1, also known as plasminogen activator inhibitor type
1, is a member of the serine protease inhibitor family and is the
major physiological regulator of the urokinase-type plasminogen
activator-dependent pericellular plasmin-generating cascade
(40,41). SERPINE1 has also been reported
to serve roles in in acute lymphoblastic leukemia (42) and keratinocyte migration (43).
With the exception of MANEAL, which may be
involved in neurological disorders (44), the other three genes with high
expression levels in the samples with good prognosis are associated
with cancer, particularly NOXO1 and TRIM31 (45–49).
NOXO1 can be induced in tumor epithelial cells and serves an
important role in tumorigenicity and the tumor-initiating property
of GC cells (46). In addition,
NOXO1 may affect colon epithelium homeostasis and prevent
inflammation (45). Previous studies
have demonstrated that CXCL3 may be a biomarker of breast and
prostate cancer (47,49). TRIM31, which is a ring finger, B-box
and coiled-coil protein upregulated in GC cells and a potential
biomarker of GC, can inhibit cell proliferation (48), and its cellular level may be
regulated by a number of mechanisms, including the
ubiquitin-proteasome system (50).
GSEA pathway enrichment annotation revealed that eight pathways
were enriched in the DEGs significantly associated with the risk
factors, such as the ‘adherens junction’, ‘TGF-β signaling
pathway’, ‘Wnt signaling pathway’, ‘JAK-STAT signaling pathway’,
‘MAPK signaling pathway’, ‘mTOR signaling pathway’ and ‘pathways in
cancer’, all of which serve substantial roles in human
carcinogenesis (51–54). The functions of these prognostic
genes are different compared with those of the genes identified in
a previous study, which were associated with the cell cycle,
RNA/non-coding RNA processes, acetylation and extracellular-matrix
organization (20).
Independent validation of two different datasets and
previous studies indicate that the RS model developed in the
present study may be effective. However, a limitation of the
present study was that it was an extensive bioinformatics analysis
based on published data; the results should be validated using
in vitro or in vivo models. However, the results of
the present study may help other investigators to conduct relevant
research.
In conclusion, a risk assessment tool for assessing
the prognosis of patients with STAD was developed and validated in
the present study. The 10 identified prognostic mRNAs were
associated with several cellular processes and signaling pathways,
such as the ‘adherens junction’, TGF-β signaling pathway’, ‘Wnt
signaling pathway’, ‘JAK-STAT signaling pathway’, ‘MAPK signaling
pathway’, ‘mTOR signaling pathway’ and ‘pathways in cancer’, and
may be recommended as promising prognostic biomarkers or a
prognostic signature of STAD. The present risk assessment tool may
help identify patients with a high risk of STAD, and the proposed
prognostic mRNAs may help elucidate the pathogenesis of STAD.
Acknowledgements
Not applicable.
Funding
No funding was received.
Availability of data and materials
The datasets used and/or analyzed during the current
study are available from the corresponding author on reasonable
request.
Authors' contributions
ZL designed the present study. EG and FT conducted
the bioinformatics analysis. EG contributed to writing the
manuscript. All authors read and approved the final manuscript.
Ethics approval and consent to
participate
Not applicable.
Patient consent for publication
Not applicable.
Competing interests
The authors declare that they have no competing
interests.
Glossary
Abbreviations
Abbreviations:
|
CVL
|
cross-validation likelihood
|
|
DEG
|
differentially expressed gene
|
|
GC
|
gastric cancer
|
|
GEO
|
Gene Expression Omnibus
|
|
GSEA
|
Gene Set Enrichment Analysis
|
|
KEGG
|
Kyoto Encyclopedia of Genes and
Genomes
|
|
RNA-seq
|
high-throughput RNA sequencing
|
|
RS
|
risk score
|
|
STAD
|
stomach adenocarcinoma
|
|
TCGA
|
The Cancer Genome Atlas
|
References
|
1
|
Ferlay J, Soerjomataram I, Dikshit R, Eser
S, Mathers C, Rebelo M, Parkin DM, Forman D and Bray F: Cancer
incidence and mortality worldwide: Sources, methods and major
patterns in GLOBOCAN 2012. Int J Cancer. 136:E359–E386. 2015.
View Article : Google Scholar : PubMed/NCBI
|
|
2
|
Rugge M, Fassan M and Graham DY:
Epidemiology of Gastric Cancer. Springer International Publishing;
New York, NY: pp. 23–34. 2015
|
|
3
|
Sanei MH, Mirmosayyeb O, Chehrei A, Ansari
J and Saberi E: 5-year survival in gastric adenocarcinoma with
epithelial and stromal versican expression. Iran J Pathol.
14:26–32. 2019. View Article : Google Scholar : PubMed/NCBI
|
|
4
|
He XK and Sun LM: The increasing trend in
the incidence of gastric cancer in the young population, not only
in young Hispanic men. Gastric Cancer. 20:10102017. View Article : Google Scholar : PubMed/NCBI
|
|
5
|
Merchant SJ, Kim J, Choi AH, Sun V, Chao J
and Nelson R: A rising trend in the incidence of advanced gastric
cancer in young Hispanic men. Gastric Cancer. 20:226–234. 2017.
View Article : Google Scholar : PubMed/NCBI
|
|
6
|
Li Z, Lei H, Luo M, Wang Y, Dong L, Ma Y,
Liu C, Song W, Wang F, Zhang J, et al: DNA methylation
downregulated mir-10b acts as a tumor suppressor in gastric cancer.
Gastric Cancer. 18:43–54. 2015. View Article : Google Scholar : PubMed/NCBI
|
|
7
|
Ng EK, Chong WW, Jin H, Lam EK, Shin VY,
Yu J, Poon TC, Ng SS and Sung JJ: Differential expression of
microRNAs in plasma of patients with colorectal cancer: A potential
marker for colorectal cancer screening. Gut. 58:1375–1381. 2009.
View Article : Google Scholar : PubMed/NCBI
|
|
8
|
Shikata K, Doi Y, Yonemoto K, Arima H,
Ninomiya T, Kubo M, Tanizaki Y, Matsumoto T, Iida M and Kiyohara Y:
Population-based prospective study of the combined influence of
cigarette smoking and Helicobacter pylori infection on gastric
cancer incidence: The Hisayama Study. Am J Epidemiol.
168:1409–1415. 2008. View Article : Google Scholar : PubMed/NCBI
|
|
9
|
Yamagata H, Kiyohara Y, Aoyagi K, Kato I,
Iwamoto H, Nakayama K, Shimizu H, Tanizaki Y, Arima H, Shinohara N,
et al: Impact of Helicobacter pylori infection on gastric cancer
incidence in a general Japanese population: The Hisayama study.
Arch Intern Med. 160:1962–1968. 2000. View Article : Google Scholar : PubMed/NCBI
|
|
10
|
Shikata K, Kiyohara Y, Kubo M, Yonemoto K,
Ninomiya T, Shirota T, Tanizaki Y, Doi Y, Tanaka K, Oishi Y, et al:
A prospective study of dietary salt intake and gastric cancer
incidence in a defined Japanese population: The Hisayama study. Int
J Cancer. 119:196–201. 2006. View Article : Google Scholar : PubMed/NCBI
|
|
11
|
Ueda T, Volinia S, Okumura H, Shimizu M,
Taccioli C, Rossi S, Alder H, Liu CG, Oue N, Yasui W, et al:
Relation between microRNA expression and progression and prognosis
of gastric cancer: A microRNA expression analysis. Lancet Oncol.
11:136–146. 2010. View Article : Google Scholar : PubMed/NCBI
|
|
12
|
Iida M, Ikeda F, Hata J, Hirakawa Y, Ohara
T, Mukai N, Yoshida D, Yonemoto K, Esaki M, Kitazono T, et al:
Development and validation of a risk assessment tool for gastric
cancer in a general Japanese population. Gastric Cancer.
21:383–390. 2018. View Article : Google Scholar : PubMed/NCBI
|
|
13
|
Pavlou M, Ambler G, Seaman SR, Guttmann O,
Elliott P, King M and Omar RZ: How to develop a more accurate risk
prediction model when there are few events. BMJ. 351:h38682015.
View Article : Google Scholar : PubMed/NCBI
|
|
14
|
Hussein AA, Ghani KR, Peabody J, Sarle R,
Abaza R, Eun D, Hu J, Fumo M, Lane B, Montgomery JS, et al:
Development and validation of an objective scoring tool for
robot-assisted radical prostatectomy: Prostatectomy assessment and
competency evaluation. J Urol. 197:1237–1244. 2017. View Article : Google Scholar : PubMed/NCBI
|
|
15
|
Nimeri AA, Bautista J, Ibrahim M, Philip
R, Al Shaban T, Maasher A and Altinoz A: Mandatory risk assessment
reduces venous thromboembolism in bariatric surgery patients. Obes
Surg. 28:541–547. 2018. View Article : Google Scholar : PubMed/NCBI
|
|
16
|
Aminian A, Andalib A, Khorgami Z, Cetin D,
Burguera B, Bartholomew J, Brethauer SA and Schauer PR: Who should
get extended thromboprophylaxis after bariatric surgery?: A risk
assessment tool to guide indications for post-discharge
pharmacoprophylaxis. Ann Surg. 265:143–150. 2017. View Article : Google Scholar : PubMed/NCBI
|
|
17
|
Kastrinos F, Uno H, Ukaegbu C, Alvero C,
McFarland A, Yurgelun MB, Kulke MH, Schrag D, Meyerhardt JA, Fuchs
CS, et al: Development and validation of the PREMM5
model for comprehensive risk assessment of lynch syndrome. J Clin
Oncol. 35:2165–2172. 2017. View Article : Google Scholar : PubMed/NCBI
|
|
18
|
Charvat H, Sasazuki S, Inoue M, Iwasaki M,
Sawada N, Shimazu T, Yamaji T and Tsugane S; JPHC Study Group, :
Prediction of the 10-year probability of gastric cancer occurrence
in the Japanese population: The JPHC study cohort II. Int J Cancer.
138:320–331. 2016. View Article : Google Scholar : PubMed/NCBI
|
|
19
|
Yuan SQ, Wu WJ, Qiu MZ, Wang ZX, Yang LP,
Jin Y, Yun JP, Gao YH, Li YH, Zhou ZW, et al: Development and
validation of a nomogram to predict the benefit of adjuvant
radiotherapy for patients with resected gastric cancer. J Cancer.
8:3498–3505. 2017. View Article : Google Scholar : PubMed/NCBI
|
|
20
|
Wang P, Wang Y, Hang B, Zou X and Mao JH:
A novel gene expression-based prognostic scoring system to predict
survival in gastric cancer. Oncotarget. 7:55343–55351.
2016.PubMed/NCBI
|
|
21
|
Tibshirani R: The lasso method for
variable selection in the Cox model. Stat Med. 16:385–395. 1997.
View Article : Google Scholar : PubMed/NCBI
|
|
22
|
Cristescu R, Lee J, Nebozhyn M, Kim KM,
Ting JC, Wong SS, Liu J, Yue YG, Wang J, Yu K, et al: Molecular
analysis of gastric cancer identifies subtypes associated with
distinct clinical outcomes. Nat Med. 21:449–456. 2015. View Article : Google Scholar : PubMed/NCBI
|
|
23
|
Robinson MD, McCarthy DJ and Smyth GK:
edgeR: A Bioconductor package for differential expression analysis
of digital gene expression data. Bioinformatics. 26:139–140. 2010.
View Article : Google Scholar : PubMed/NCBI
|
|
24
|
Wang L, Cao C, Ma Q, Zeng Q, Wang H, Cheng
Z, Zhu G, Qi J, Ma H, Nian H and Wang Y: RNA-seq analyses of
multiple meristems of soybean: Novel and alternative transcripts,
evolutionary and functional implications. BMC Plant Biol.
14:1692014. View Article : Google Scholar : PubMed/NCBI
|
|
25
|
Eisen MB, Spellman PT, Brown PO and
Botstein D: Cluster analysis and display of genome-wide expression
patterns. Proc Natl Acad Sci USA. 95:14863–14868. 1998. View Article : Google Scholar : PubMed/NCBI
|
|
26
|
Therneau T: A Package for Survival
Analysis in S. version 2.38. https://CRAN.R-project.org/package=survival2015
|
|
27
|
Thernea u, Terry M, Grambsc h and Patricia
M: Modeling Survival Data: Extending the Cox Model. Springer; New
York, NY: 2000, View Article : Google Scholar
|
|
28
|
Goeman JJ: L1 penalized estimation in the
Cox proportional hazards model. Biom J. 52:70–84. 2010.PubMed/NCBI
|
|
29
|
Bachoc F: Cross validation and maximum
likelihood estimations of hyper-parameters of gaussian processes
with model misspecification. Comput Stat Data Anal. 66:55–69. 2013.
View Article : Google Scholar
|
|
30
|
Camp RL, Dolled-Filhart M and Rimm DL:
X-tile: A new bio-informatics tool for biomarker assessment and
outcome-based cut-point optimization. Clin Cancer Res.
10:7252–7259. 2004. View Article : Google Scholar : PubMed/NCBI
|
|
31
|
Eng KH, Schiller E and Morrell K: On
representing the prognostic value of continuous gene expression
biomarkers with the restricted mean survival curve. Oncotarget.
6:36308–36318. 2015. View Article : Google Scholar : PubMed/NCBI
|
|
32
|
Iasonos A, Schrag D, Raj GV and Panageas
KS: How to build and interpret a nomogram for cancer prognosis. J
Clin Oncol. 26:1364–1370. 2008. View Article : Google Scholar : PubMed/NCBI
|
|
33
|
Subramanian A, Tamayo P, Mootha VK,
Mukherjee S, Ebert BL, Gillette MA, Paulovich A, Pomeroy SL, Golub
TR, Lander ES and Mesirov JP: Gene set enrichment analysis: A
knowledge-based approach for interpreting genome-wide expression
profiles. Proc Natl Acad Sci USA. 102:15545–15550. 2005. View Article : Google Scholar : PubMed/NCBI
|
|
34
|
Kanehisa M and Goto S: KEGG: Kyoto
encyclopedia of genes and genomes. Nucleic Acids Res. 28:27–30.
2000. View Article : Google Scholar : PubMed/NCBI
|
|
35
|
Piel FB, Howes RE, Patil AP, Nyangiri OA,
Gething PW, Bhatt S, Williams TN, Weatherall DJ and Hay SI: The
distribution of haemoglobin C and its prevalence in newborns in
Africa. Sci Rep. 3:16712013. View Article : Google Scholar : PubMed/NCBI
|
|
36
|
Thom CS, Dickson CF, Gell DA and Weiss MJ:
Hemoglobin variants: Biochemical properties and clinical
correlates. Cold Spring Harb Perspect Med. 3:a0118582013.
View Article : Google Scholar : PubMed/NCBI
|
|
37
|
Endele S, Nelkenbrecher C, Bördlein A,
Schlickum S and Winterpacht A: C4ORF48, a gene from the
Wolf-Hirschhorn syndrome critical region, encodes a putative
neuropeptide and is expressed during neocortex and cerebellar
development. Neurogenetics. 12:155–163. 2011. View Article : Google Scholar : PubMed/NCBI
|
|
38
|
Deeb A: Diabetes mellitus secondary to
acute pancreatitis in a child with Wolf-Hirschhorn syndrome. Case
Rep Endocrinol. 2017:38924672017.PubMed/NCBI
|
|
39
|
Grotewold L and Rüther U: The Wnt
antagonist Dickkopf-1 is regulated by Bmp signaling and c-Jun and
modulates programmed cell death. EMBO J. 21:966–975. 2002.
View Article : Google Scholar : PubMed/NCBI
|
|
40
|
Tian EM, Zhan F, Walker R, Rasmussen E, Ma
Y, Barlogie B and Shaughnessy JD Jr: The role of the Wnt-signaling
antagonist DKK1 in the development of osteolytic lesions in
multiple myeloma. N Engl J Med. 349:2483–2494. 2003. View Article : Google Scholar : PubMed/NCBI
|
|
41
|
Providence KM, White LA, Tang J, Gonclaves
J, Staiano-Coico L and Higgins PJ: Epithelial monolayer wounding
stimulates binding of USF-1 to an E-box motif in the plasminogen
activator inhibitor type 1 gene. J Cell Sci. 115:3767–3777. 2002.
View Article : Google Scholar : PubMed/NCBI
|
|
42
|
Turchi L, Chassot AA, Rezzonico R, Yeow K,
Loubat A, Ferrua B, Lenegrate G, Ortonne JP and Ponzio G: Dynamic
characterization of the molecular events during in vitro epidermal
wound healing. J Investig Dermatol. 119:56–63. 2002. View Article : Google Scholar : PubMed/NCBI
|
|
43
|
French D, Hamilton LH, Mattano LA Jr,
Sather HN, Devidas M, Nachman JB and Relling MV; Children's
Oncology Group, : A PAI-1 (SERPINE1) polymorphism predicts
osteonecrosis in children with acute lymphoblastic leukemia: A
report from the Children's Oncology Group. Blood. 111:4496–4499.
2008. View Article : Google Scholar : PubMed/NCBI
|
|
44
|
Providence KM, Higgins SP, Mullen A,
Battista A, Samarakoon R, Higgins CE, Wilkins-Port CE and Higgins
PJ: SERPINE1 (PAI-1) is deposited into keratinocyte migration
‘trails’ and required for optimal monolayer wound repair. Arch
Dermatol Res. 300:303–310. 2008. View Article : Google Scholar : PubMed/NCBI
|
|
45
|
Herebian D, Alhaddad B, Seibt A,
Schwarzmayr T, Danhauser K, Klee D, Harmsen S, Meitinger T, Strom
TM, Schulz A, et al: Coexisting variants in OSTM1 and MANEAL cause
a complex neurodegenerative disorder with NBIA-like brain
abnormalities. Eur J Hum Genet. 25:1092–1095. 2017. View Article : Google Scholar : PubMed/NCBI
|
|
46
|
Moll F, Walter M, Rezende F, Helfinger V,
Vasconez E, De Oliveira T, Greten FR, Olesch C, Weigert A, Radeke
HH and Schröder K: NoxO1 controls proliferation of colon epithelial
cells. Front Immunol. 9:9732018. View Article : Google Scholar : PubMed/NCBI
|
|
47
|
Oshima H, Ishikawa T, Yoshida GJ, Naoi K,
Maeda Y, Naka K, Ju X, Yamada Y, Minamoto T, Mukaida N, et al:
TNF-α/TNFR1 signaling promotes gastric tumorigenesis through
induction of Noxo1 and Gna14 in tumor cells. Oncogene.
33:3820–3829. 2014. View Article : Google Scholar : PubMed/NCBI
|
|
48
|
Gui SL, Teng LC, Wang SQ, Liu S, Lin YL,
Zhao XL, Liu L, Sui HY, Yang Y, Liang LC, et al: Overexpression of
CXCL3 can enhance the oncogenic potential of prostate cancer. Int
Urol Nephrol. 48:701–709. 2016. View Article : Google Scholar : PubMed/NCBI
|
|
49
|
Sugiura T and Miyamoto K: Characterization
of TRIM31, upregulated in gastric adenocarcinoma, as a novel RBCC
protein. J Cell Biochem. 105:1081–1091. 2008. View Article : Google Scholar : PubMed/NCBI
|
|
50
|
See AL, Chong PK, Lu SY and Lim YP: CXCL3
is a potential target for breast cancer metastasis. Curr Cancer
Drug Targets. 14:294–309. 2014. View Article : Google Scholar : PubMed/NCBI
|
|
51
|
Sugiura T: The cellular level of TRIM31,
an RBCC protein overexpressed in gastric cancer, is regulated by
multiple mechanisms including the ubiquitin-proteasome system. Cell
Biol Int. 35:657–661. 2013. View Article : Google Scholar
|
|
52
|
Zhan T, Rindtorff N and Boutros M: Wnt
signaling in cancer. Oncogene. 36:1461–1473. 2017. View Article : Google Scholar : PubMed/NCBI
|
|
53
|
Neuzillet C, Tijeras-Raballand A, Cohen R,
Cros J, Faivre S, Raymond E and de Gramont A: Targeting the TGFβ
pathway for cancer therapy. Pharmacol Ther. 147:22–31. 2015.
View Article : Google Scholar : PubMed/NCBI
|
|
54
|
Zou X and Blank M: Targeting p38 MAP
kinase signaling in cancer through post-translational
modifications. Cancer Lett. 384:19–26. 2017. View Article : Google Scholar : PubMed/NCBI
|
|
55
|
Waddell T, Verheij M, Allum W, Cunningham
D, Cervantes A and Arnold D; European Society for Medical Oncology
(ESMO); European Society of Surgical Oncology (ESSO); European
Society of Radiotherapy Oncology (ESTRO), : Gastric cancer:
ESMO-ESSO-ESTRO clinical practice guidelines for diagnosis,
treatment and follow-up. Ann Oncol. 24 (Suppl 6):vi57–vi63. 2013.
View Article : Google Scholar : PubMed/NCBI
|