Introduction
Osteosarcoma (OS) is a malignant bone tumor that
often occurs in children and adolescents (1). Improving the 5-year survival rate
remains a challenge (2). OS is
characterized by the accumulation of somatic mutations, including
gross insertions and deletions (3).
With the development of next generation sequencing, an increasing
number of OS-associated mutations have been identified. However,
only a small proportion of these represent driver mutations, as the
majority are passenger mutations (4). The identification of driver mutations
may improve the understanding of the molecular mechanisms
underlying OS, as well as provide potential diagnostic and
therapeutic markers. Therefore, the development of accurate
automated computational prediction algorithms capable of screening
driver from passenger mutations is of paramount importance.
The development of next-generation sequencing
technology has allowed the production of a vast amount of mutation
data, which in turn stimulated the development of algorithms for
the identification of variants that are likely to be associated
with disease (5). The Catalogue of
Somatic Mutations in Cancer (COSMIC) is a comprehensive resource
for cataloguing somatic mutations in human tumors (6). However, biological experiments that
investigate the effect of each gene/mutation are time-consuming and
not cost-effective. Computational methods, on the other hand, are
able to mine vast datasets for mutation information. A case group
was constructed using pathogenic mutations (melanoma-associated
mutations) identified using COSMIC (7). All point mutations in COSMIC can be
classified as pathogenic or neutral variants using the algorithm
Functional Analysis Through Hidden Markov Models (FATHMM)-Math
Kernel Library (MKL) (8). FATHMM is
highly precise, with only a small proportion of false positive
somatic mutations (8), and is widely
used to filter variants and to detect driver genes (9). However, as FATHMM is not a
cancer-specific prediction tool, improving the accuracy of
predicting driver genes for a specific type of cancer is urgently
required. Furthermore, cancer development is generally a result of
mutations in multiple genes as opposed to a single gene. Therefore,
network-based methods that consider the interaction between genes
may be advantageous.
While the detection of driver network modules
implicates the constituent genes as being cancer-associated,
several methods have been developed to directly identify genes
involved in cancer pathogenesis (5).
Direct implication of genes may reduce false positive driver gene
prediction in cases where not all genes in a network module have
equal oncogenic potential. Although many gene-level methods rely on
patterns of mutation, networks have also been applied to implicate
driver genes. Mutations For Functional Impact on Network Neighbors
(MUFFINN) is a pathway-centric method that identifies
cancer-associated genes based on the mutation data of both
individual genes and their neighbors connected in functional
networks (10). Application of
MUFFINN revealed that analysis of mutations in indirect neighbors
via diffusion algorithms did not improve the predictive performance
compared to analysis of only direct neighbors in 18 types of cancer
(10).
The present study performed a systematic exploration
of somatic mutations by mining datasets for OS-associated driver
genes using a network-based approach. Firstly, the mutation impact
scores calculated by FATHMM based on COSMIC were integrated, and
only the pathogenic mutations were selected for further study.
Secondly, as the power to detect driver genes depended on how many
mutated genes were connected with functional genes, a
protein-protein interaction (PPI) network consisting of mutated and
functional genes was created. Subsequently, the following method
was used to uncover the driver genes that were associated with the
functional genes. For each mutated gene, the enrichment score for
known functional genes was calculated using a network approach, and
the number of driver genes was summarized into a driver-gene score
to evaluate the function of the driver genes. Furthermore, the
identified driver genes were validated using an independent
validation dataset. The results revealed that the driver genes may
be used as biomarkers to predict clinical outcome in OS. Taken
together, the method described was highly predictive for known
OS-associated genes, particularly genes with low mutation
frequency. Furthermore, the present study revealed that several of
the identified genes were bona fide drivers. Therefore, the present
study described an avenue for the identification of driver genes
from large amounts of cancer genome sequencing data.
Materials and methods
Data collection
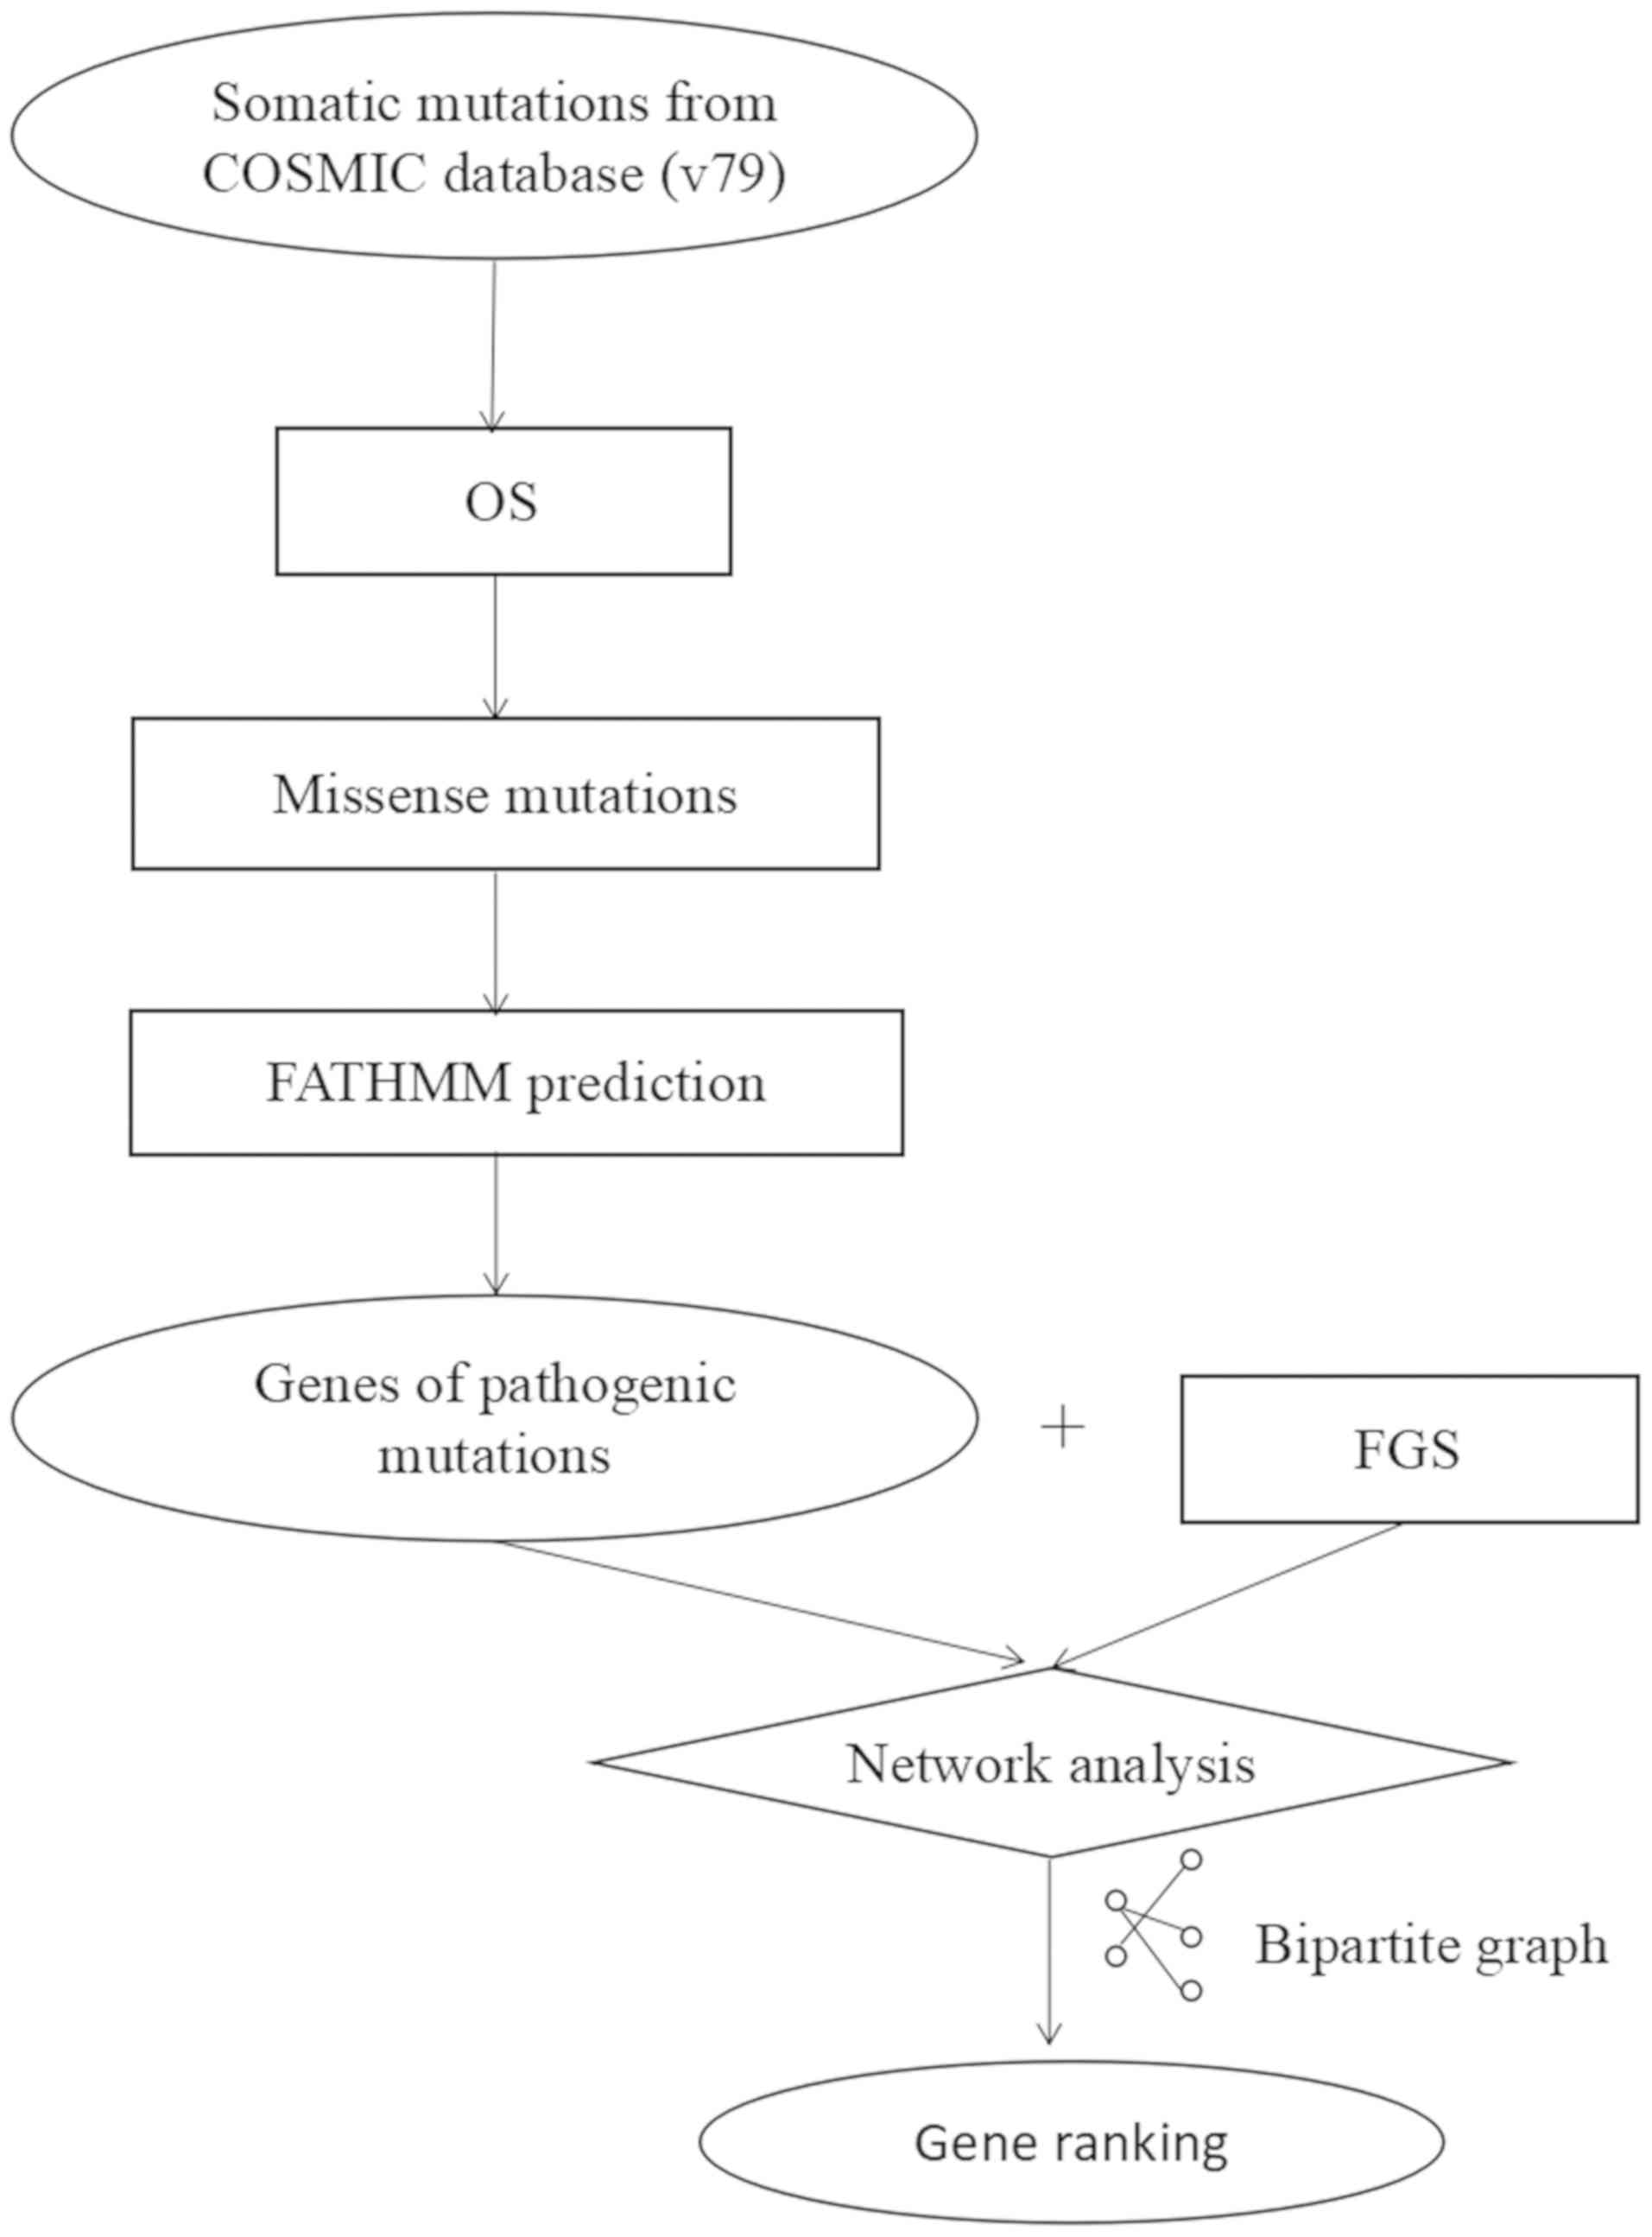
The mutation data used in the present study was
derived from COSMIC (version 79; http://cancer.sanger.ac.uk/cosmic). OS missense
mutations were selected for further study. The present study
focused only on those mutations that were predicted to be
pathogenic (defined as cancerous or damaging) by the FATHMM-MKL
algorithm. The FATHMM score ranged between 0 to 1, and variants
with a score >0.7 were considered to be pathogenic (11) (predicting the functional, molecular
and phenotypic consequences of amino acid substitutions using
hidden Markov models). The official gene names corresponding to the
pathogenic mutations were obtained from the National Center for
Biotechnology Information (https://www.ncbi.nlm.nih.gov/). Following the removal
of duplicated genes, 882 OS-associated genes were identified.
Functional gene sets (FGS) were obtained from the literature
(12), and included genes involved
in signaling and cancer-associated pathways and hallmarks. The
Cancer Gene Census (CGC; cancer.sanger.ac.uk/census), which includes gene
mutations causally implicated in cancer, was downloaded. The CGC is
widely used as the gold standard to evaluate the effect of
predicted driver genes (10).
OS-associated genes were downloaded from the OS database
(osteosarcoma-gene association database, http://osteosarcoma-db.uni-muenster.de/). The gene
expression dataset (GSE42352) (13)
was obtained from the Gene Expression Omnibus (GEO; www.ncbi.nlm.nih.gov/geo).
Network and influence graph
construction
The network was built using the Human Protein
Reference Database (HPRD, release 9; www.hprd.org).
Self-interactions were deleted, and 39,240 interactions among 9,616
proteins were identified. The mutated genes and the FGS were mapped
onto the network. Node i and j represent genes, and the edge
represents an interaction between gene i and gene j in the network.
The influence graph presents the influence of the mutated genes on
these genes in the FGS. Using the network, a bipartite graph was
generated, in which nodes on one side represented the mutated genes
and nodes on the other side represented the FGS. Edges were drawn
if gene i and gene j had an interaction according to the known gene
network, i.e., the influence graph. The aim of the algorithm was to
identify mutated genes that were connected to the majority of genes
in the FGS. The mutated genes were ranked according to their
z-score using the following equation:
z=dAF-μAFσAF
Where dAF is the enrichment score of
mutated genes and the FGS, µAF is the expected mean of
dAF and σAF is the standard deviation of
dAF.
First, a network was constructed using the HPRD
database, and the mutated genes and the FGS were mapped to the
network. Second, the association between the mutated genes and the
FGS was measured using a bipartite graph. In the bipartite graph,
the nodes on the left represented the mutated genes, while the
nodes on the right represented the FGS. An edge was drawn if nodes
on each side interacted in the network. The number of edges for
each of the mutated genes was subsequently calculated. Finally, the
z-score was used as the driver gene score. A mutated gene with a
z-score >2 was considered a driver gene (14).
Performance benchmarking
The well-studied CGC dataset was used as an
approximate benchmarking dataset, as standard benchmarking is
impractical due to lack of ground truth (14). The developed method was compared with
MUFFINN (www.inetbio.org/muffinn/search.php), which is a method
for prioritizing cancer genes that accounts for not only mutations
in individual genes but also those in neighboring genes connected
in functional networks. Candidate cancer genes were identified by
NDmax on HumanNet V1 (http://www.functionalnet.org/humannet/about.html).
Precision, recall and F1 scores were based on the top 100 genes in
our study and were calculated as follows.
Pr ecision=(#Mutated genes in
CGC)∩(#Genes found in our method)(#Genes found in our
method)
Re call=(#Mutated genes in CGC)∩(#Genes
found in our method)(#Mutated genes in CGC)
F1Score=2×Precision×RecallPrecision+Recall
Genes found in our method refers to genes identified
using the proposed method.
Identification of candidate OS driver
genes as putative module biomarkers
The identified OS driver genes were validated as
putative module biomarkers based on their ability to distinguish
between OS and control samples using the random forest method
(15). The performance of the
classification model was assessed using receiver operating
characteristic (ROC) curves and the area under the curve (AUC)
(16).
GO and pathway enrichment
analysis
To interpret the biological significance of the OS
driver genes, Gene Ontology (GO; http://geneontology.org/) and Kyoto Encyclopedia of
Genes and Genomes (https://www.genome.jp/kegg/) pathway enrichment
analyses were performed using the online tool Database for
Annotation, Visualization and Integrated Discovery (DAVID; version
6.7; http://david.ncifcrf.gov/). Enrichment
analysis was calculated using the hypergeometric test. Only terms
with adjusted P<0.05 were considered.
Subnetwork generation
To better understand the interaction between the OS
driver genes, a subnetwork consisting of the OS driver genes was
generated using GenRev software V1 (17). The interaction network was sourced
from the Pathway Commons database (Release 1), which is built on
publicly available pathway data. The GenRev algorithm requires two
inputs, network information and a set of input genes (termed seed
genes), to calculate a subnetwork containing the seed gene and
non-seed genes (linker genes). The present study used the limited
k-walk algorithm (18), with k=3, to
evaluate the relevance of seed genes in relation to linker genes by
using random walk algorithm.
Results
Identification of OS driver genes
Based on the FATHMM score of each variant, variants
were labeled as pathogenic or neutral (11). As the non-pathogenic variants
predicted by FATHMM are not likely to be implicated in cancer, the
present study focused solely on the pathogenic variants, similarly
to previously published studies (7,19).
Furthermore, this approach reduces the noise of false positive
somatic mutations. A total of 1,244 pathogenic mutations in 882
genes were identified. The genes harboring pathogenic variants were
ranked using a computational approach as shown in Fig. 1. A mutated gene with a z-score >2
was considered a driver gene (14).
Using this approach, a total of 15 driver genes were identified.
The results form Table I
demonstrates that tumor protein p53 (TP53) ranked first out of the
driver genes.
 | Table I.Genes ranked by the driver gene score
developed in the present study. |
Table I.
Genes ranked by the driver gene score
developed in the present study.
| Gene | Score | Which exist in
CGC? | Which exist in OS
gene database? |
|---|
| TP53 | 10.29 | Yes | Yes |
| EGFR | 8.08 | Yes | Yes |
| CREBBP | 7.19 | Yes | Yes |
| SMAD4 | 5.87 | Yes | Yes |
| RB1 | 5.05 | Yes | Yes |
| PTK2 | 4.76 | No | Yes |
| TRAF6 | 4.61 | No | Yes |
| SYK | 4.39 | Yes | No |
| PAK1 | 3.21 | No | No |
| RASA1 | 3.21 | No | No |
| FN1 | 3.06 | No | Yes |
| VIM | 2.99 | No | Yes |
| KDR | 2.47 | Yes | Yes |
| LRP1 | 2.33 | No | Yes |
| SOCS1 | 2.03 | Yes | No |
Integrating protein interactions
improves the enrichment of OS genes
In order to evaluate the ability of the approach
developed in the present study to detect driver genes, the results
were compared with results obtained using the MUFFINN algorithm.
The MUFFINN online server requires a set of genes and mutation
frequencies as input. The algorithm takes into account somatic
mutations both in genes and their neighbors connected in functional
networks (10). MUFFINN can also
detect mutations in indirect neighbor genes by diffusing the
mutation occurrence information throughout the network. The output
is a list of ranked cancer genes (10). Based on the MUFFINN score, genes were
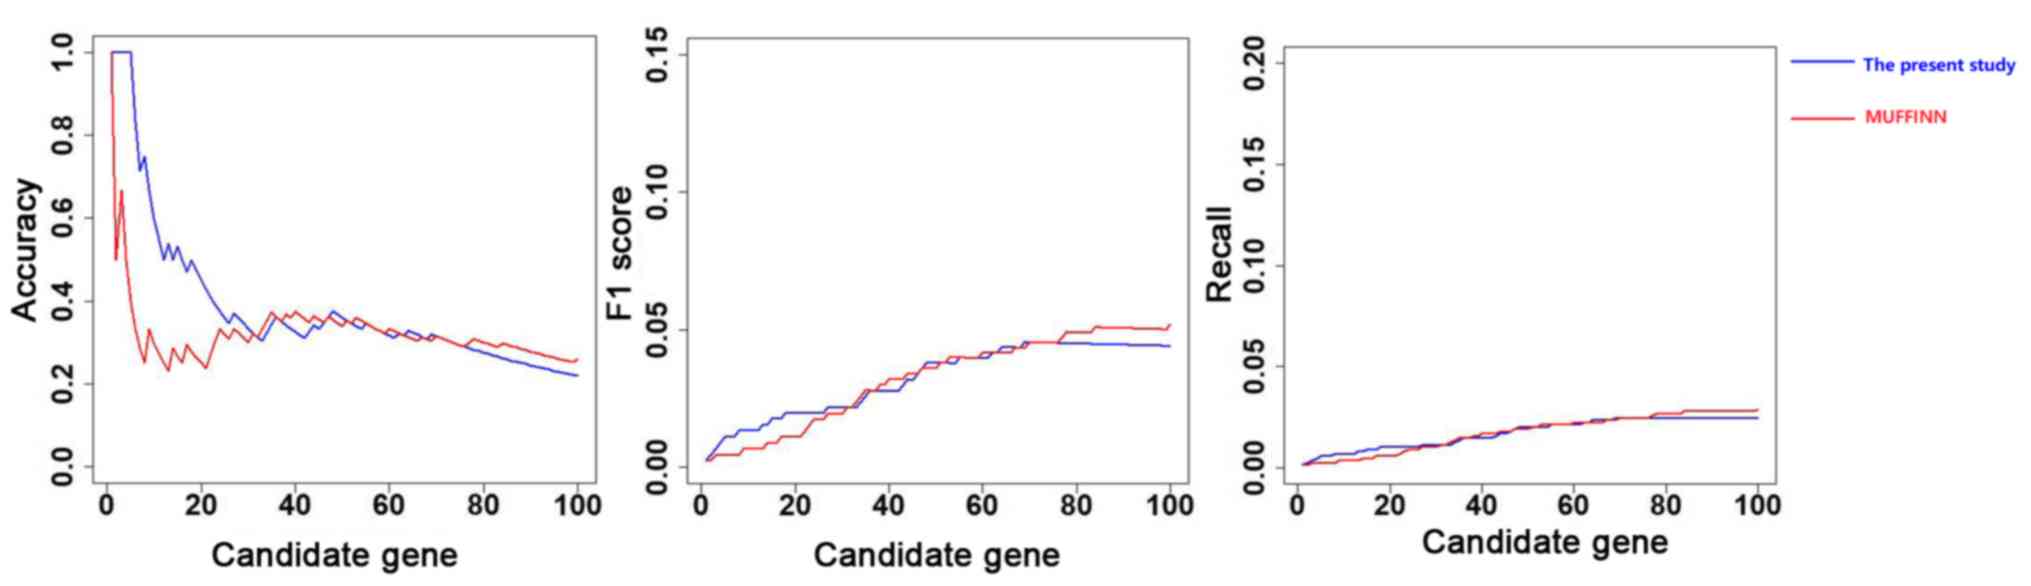
arranged in descending order. Precision, recall and F1 scores were
based on the top N genes (20,21). In
the present study, the predictive performances for the top 100
candidates were comparable. The performance of the method developed
in the present study and MUFFINN were evaluated, and the former
exhibited significant improvement by using mutational data from
direct neighbors in the network. As displayed in Fig. 2, the precision, recall and F1 score
curves for the top 30 genes obtained using the method developed in
the present study are higher than the curves obtained using
MUFFINN. However, the scores for the genes after the top 30 genes
were higher using MUFFINN.
It is worth noting that, TP53 (a well-known cancer
gene) (22) was ranked first in both
the method developed in the present study and MUFFINN. MUFFINN
revealed that UBE2I (ubiquitin conjugating enzyme E2 I) ranked
second. UBE2I is not a mutated gene, but can be connected to the
mutated genes. Overall, the method developed in the present study
performed better than MUFFINN with respect to the CGC, particularly
for the top 30 genes.
Confirmation of predicted OS driver
genes
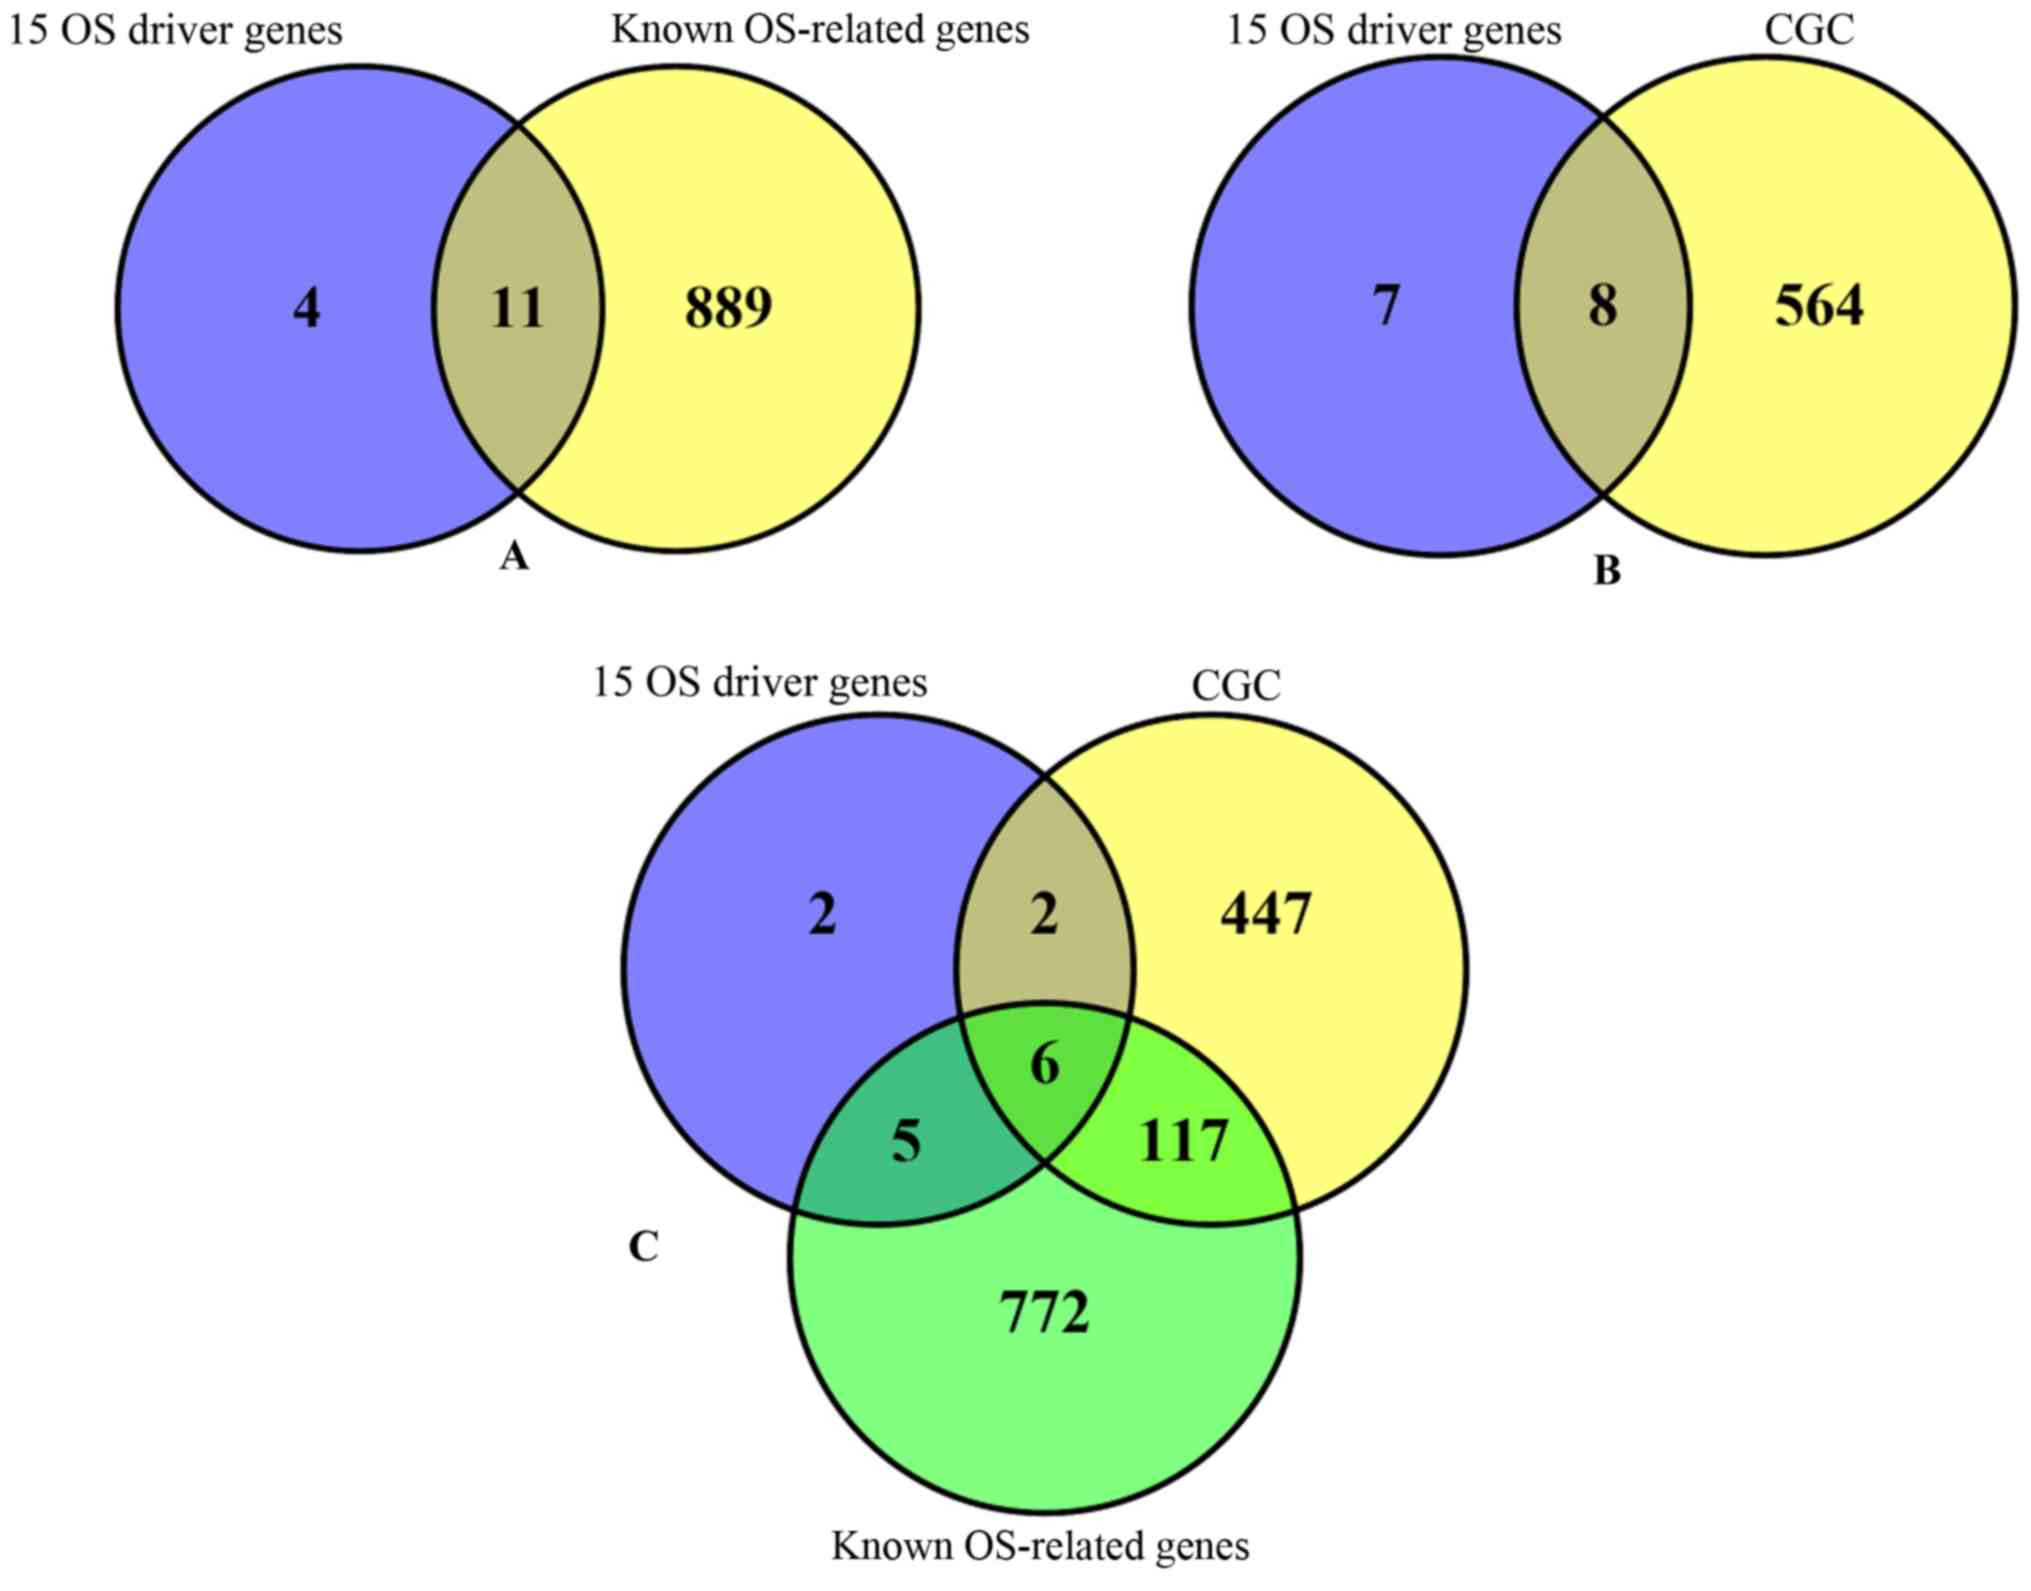
The OS gene database and the CGC were used to
investigate whether the predicted genes had been previously
reported. Among the 15 identified OS driver genes, 13 genes
overlapped with the OS gene database or the CGC (Fig. 3). Statistical analysis was performed
in order to determine whether the overlapped genes were randomly
obtained from the 882 pathogenic genes. The P-value from the
hyper-geometric test was 1.707×10⁻¹³, which demonstrated
that the identified OS driver genes were not randomly obtained. The
results indicated that the approach developed in the present study
detected 15 driver genes that are highly associated with OS.
Genes in the disease-associated
network
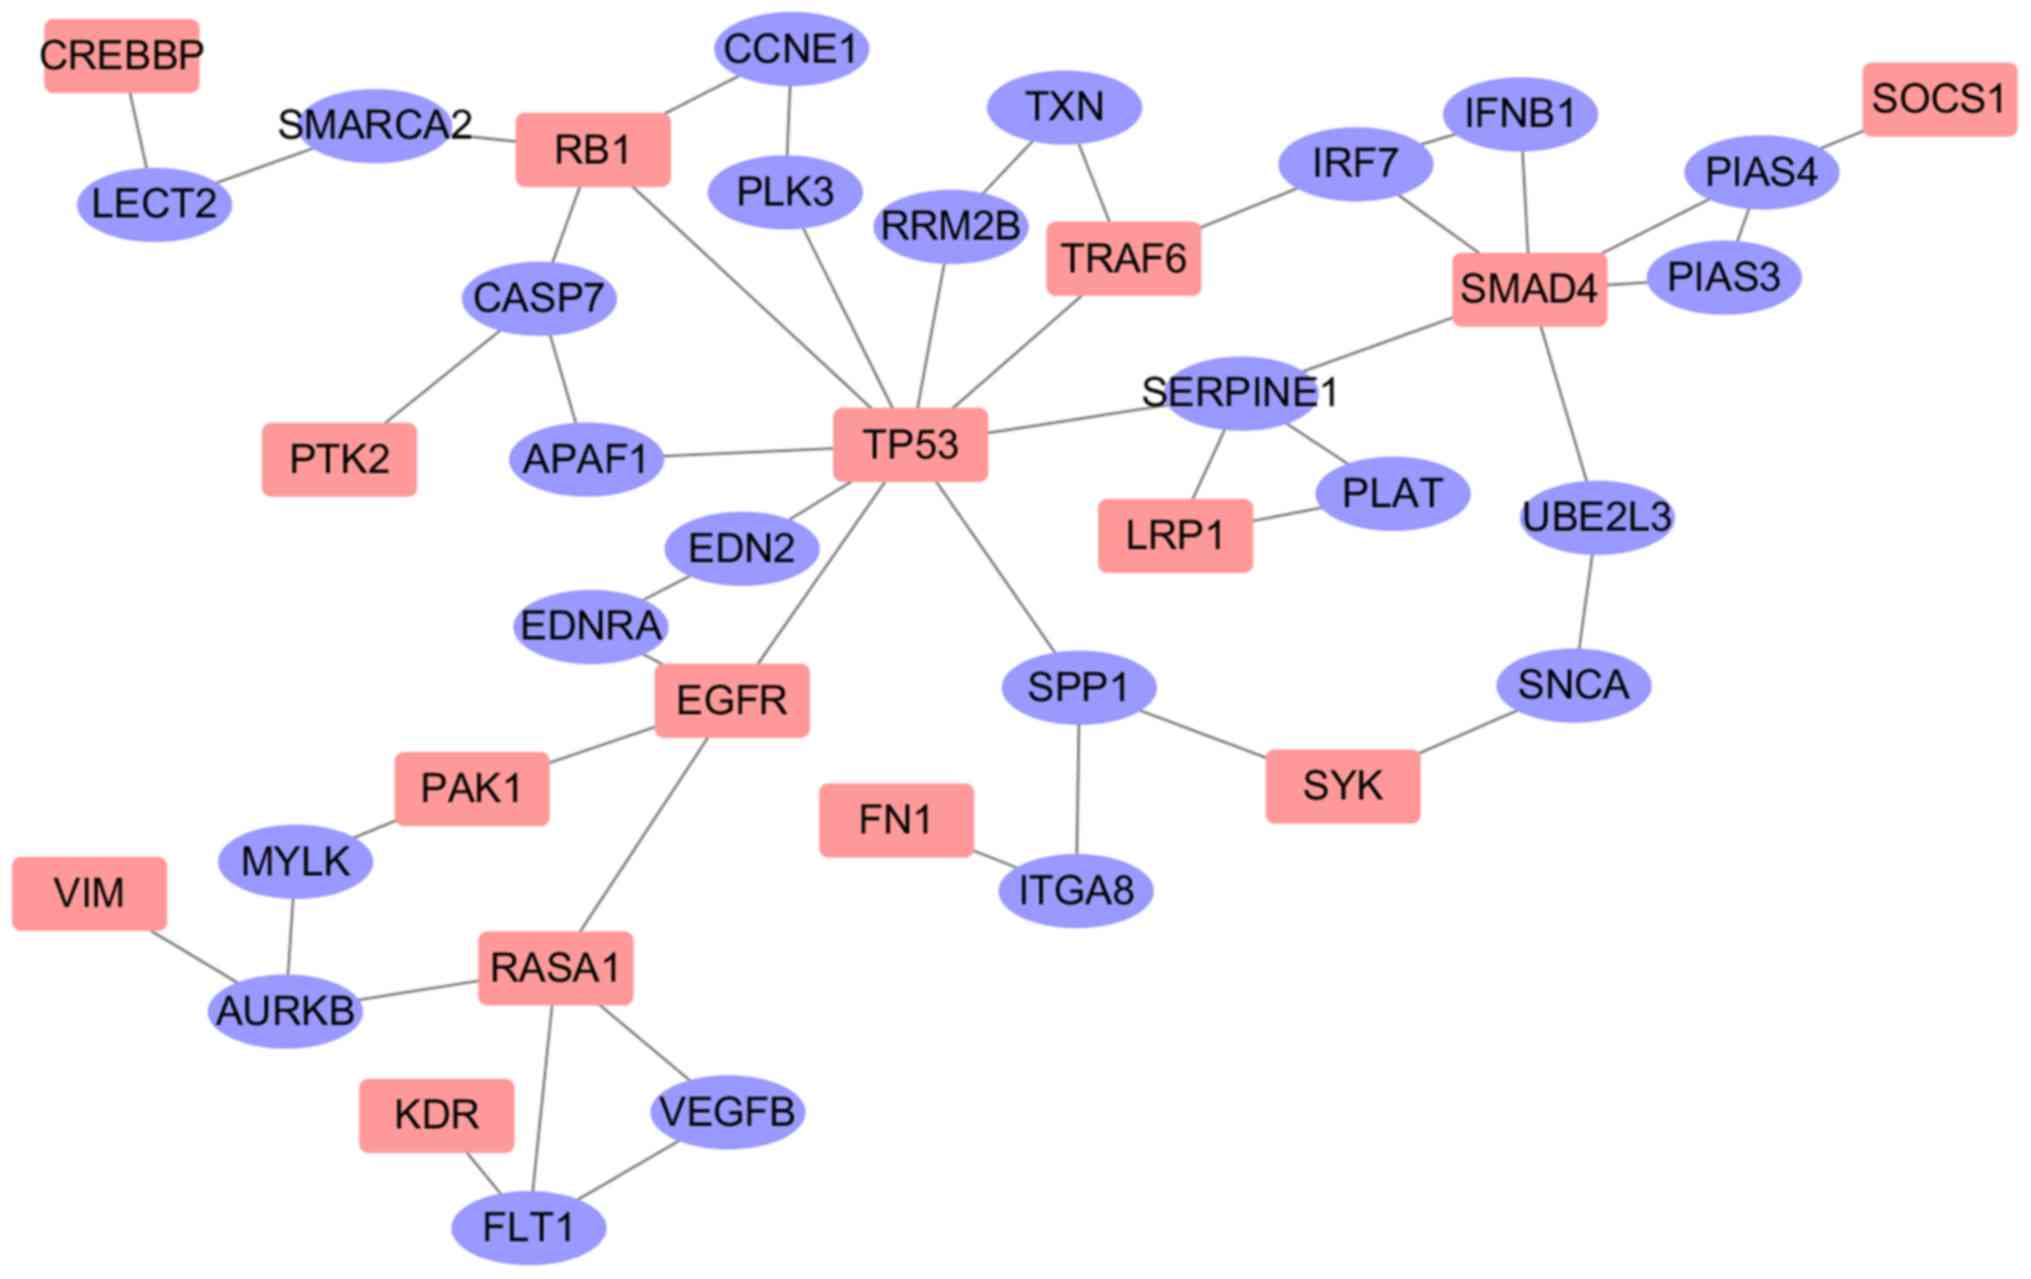
To further explore the biological significance of
the 15 OS driver genes, the driver genes were mapped to the
interaction network. The 15 driver genes were inputted into the
GenRev software, and 15 seed genes and their neighbors were mined.
The interaction of the 15 OS genes is presented in Fig. 4, which demonstrates that all 15 OS
drivers were connected in a subnetwork, where purple and red
vertices represent the linker and seed genes, respectively. The
subnetwork included 39 genes (15 seed genes and 24 linker genes)
and 49 edges (Fig. 4). Among the 24
linker genes, 10 linker genes overlapped with genes in the OS gene
database; however, the association between the other 14 genes and
OS is unclear.
Functional analysis
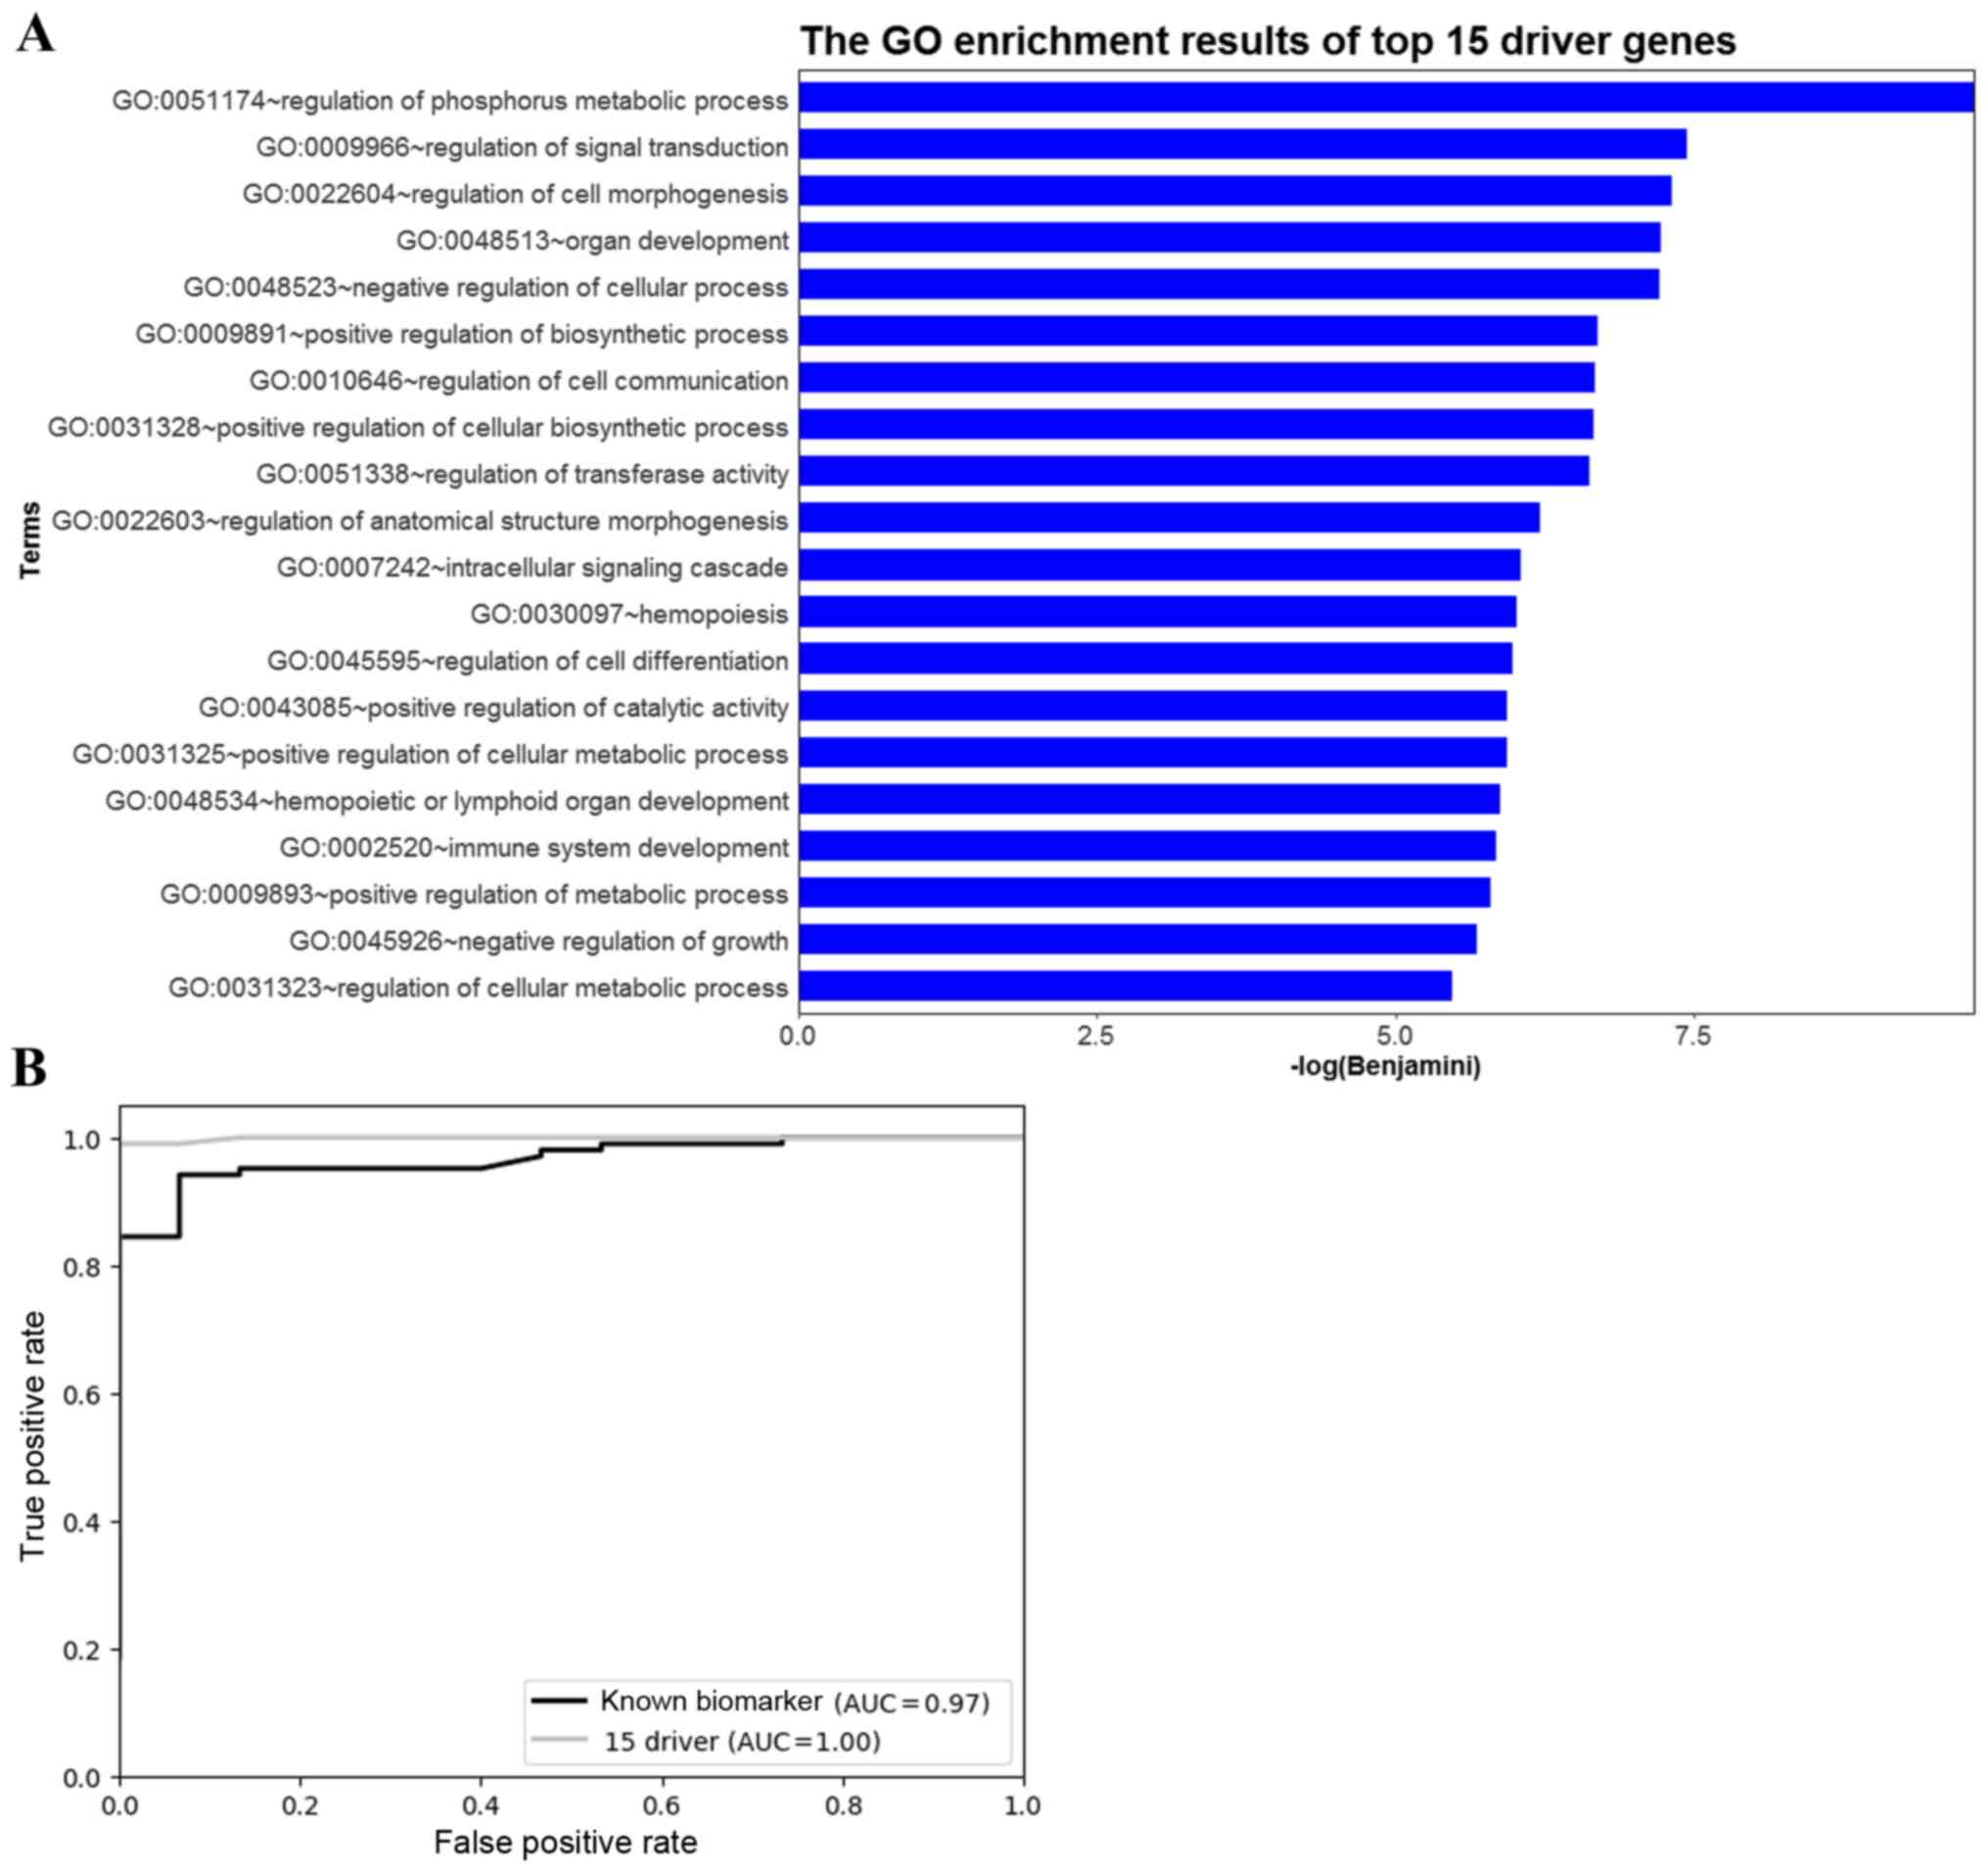
To further investigate the biological function of
the 15 driver genes, functional enrichment analysis was performed
using DAVID. A number of the predicted driver genes were
significantly enriched in biological functions related to
tumorigenesis, including ‘regulation of signal transduction’ and
‘regulation of cell communication’ (Fig.
5A).
Validation of potential OS driver
genes
To further validate the predicted OS driver genes,
these genes were used to distinguish cancer samples from controls.
The gene expression dataset GSE42352 was obtained from the GEO, and
consisted of 15 controls and 103 OS samples. Moreover, the results
were compared with the results obtained using 13 biomarkers
collected from a previous study (23). The performance of the 15 predicted OS
driver genes and the 13 biomarkers was evaluated using a random
forest classifier and 5-fold cross-validation. The ROC curves and
AUC values for the classifications of the 15 predicted OS driver
genes and the 13 biomarkers are shown in Fig. 5B. The AUC was 1 for the 15 predicted
OS driver genes and 0.97 for the 13 known biomarkers. This result
revealed that the identified driver genes performed well compared
with the known biomarkers, which demonstrated that the 15 OS driver
genes are related to OS.
Discussion
Owing to the development of next-generation
sequencing, genomic sequencing is a new paradigm in disease
research (24). A number of somatic
mutations in cancer have been reported from sequencing data
(5). As only a limited number of
mutations are drivers, it is critical to screen driver mutations
from passenger mutations (5). Since
the somatic mutations in the COSMIC database were identified by
genomic sequencing, some false positive somatic mutations exist, as
the early methods for genome/exome sequencing somatic mutations
were less reliable than the new method (25). Although multiple computational
methods have been used to predict the pathogenicity of mutations,
their utility is limited (5). The
present study presented an approach for integrating mutation data
and networks to identify OS driver genes. FATHMM is a tool combined
with other tools to predict driver genes (9). However, the top ranked genes often
receive more attention and are more important than the lower ranked
genes (10,14,21).
The results revealed that the method was effective
in detecting driver genes. A total of 15 driver genes were
identified in the present study, of which 13 have been reported
previously (11 genes in the OS gene database and 8 genes in the
CGC). Based on a literature search, among these identified genes in
our study, TP53 mutations are one of the most common genetic
aberrations in OS. Evidence suggests that EGFR is implicated in the
development and progression of OS (26). A meta-analysis revealed that TP53 is
an effective biomarker of survival time in patients with OS
(27). Epidermal growth factor
receptor (EGFR) belongs to the protein kinase superfamily. EGFR
mutations enhance the kinase activity of EGFR, which activates
pro-survival pathways, including RAS/MAPK pathway (28). Evidence suggests that EGFR is
implicated in the development and progression of OS (26). CREBBP (CREB binding protein) plays a
central role in transcriptional activation. SMAD4 (SMAD family
member 4) encodes a protein that is a part of the transforming
growth factor β (TGF-β) pathway, which has been implicated in
cancer, including OS (29). RB1 (RB
transcriptional corepressor 1) is a tumor suppressor gene, of which
mutations are positively correlated with the survival rate of
patients with OS. PTK2 (protein tyrosine kinase 2) encodes a
cytoplasmic protein tyrosine kinase, which drives tumor growth
through its pro-proliferative and antiapoptotic functions (30). TRAF6 (TNF receptor associated factor
6) is an oncogene that plays a crucial role in RAS-mediated
oncogenesis in lung cancer (31). A
previous study reported that the overexpression of TRAF6 is
correlated with the invasion of OS cells (32). SYK serves a dual role as a tumor
promoter in certain tumors, including B-cell lymphocytic leukemia,
pancreatic cancer and lung cancer), and as a tumor suppressor in
other types of cancer, including breast cancer and melanoma
(33). A previous study suggested
that SYK may be associated with OS (34). PAK1 [p21 (RAC1) activated kinase 1]
is a kinase that confers chemoresistance and poor outcome in
non-small cell lung cancer (35).
RASA1 (RAS p21 protein activator 1) acts as a tumor suppressor gene
that is frequently inactivated in various types of cancer,
including hepatocellular carcinoma (36). Compared with normal human
osteoblasts, FN1 downregulation has been reported in human
osteosarcoma cell lines (37). In
addition, a random forest classifier was used to demonstrate the
ability of the predicted drivers to distinguish between OS and
control samples, and the AUC values suggested a good classification
performance. The 15 driver genes outperformed the known biomarkers
of OS, suggesting that the predicted driver genes are related to
OS.
The present study had a number of limitations.
Experimental validation using small interfering RNA and cell
viability assays was not performed. Therefore, future
investigations are required to further validate the potential
driver genes. Furthermore, despite the good performance for
detecting OS driver genes, the model has certain shortcomings.
Firstly, the network information is incomplete, and genes that
could not be mapped to the network were filtered out. Secondly,
only the missense mutations were explored, and other types of
mutations require further investigation as, for example, synonymous
mutations have been reported to play a crucial role in cancer risk
(38). Hence, the predictive power
of the approach developed in the present study may be enhanced by
additional functional network information.
Taken together, the present study developed a
practical approach to mine COSMIC for potential OS driver genes.
This approach may be generalized to identify new diagnostic
biomarkers and therapeutic targets for OS. Additionally, although
only OS-related genes were explored in the present study, the
method is broadly applicable to other cancer types available in
COSMIC.
Inferring the driver genes in cancer is one of the
goals of systems biology. Given that COSMIC provides a significant
amount of mutation data, the optimization of the use of these data
to identify the driver genes in a given cancer type is important.
In the present study, known interactions were used to consider the
effect of mutated genes on a set of functional genes, and 15 OS
driver genes were identified. These genes were functionally
enriched in OS-associated biological functions, indicating that
these genes are involved in OS. Furthermore, the method developed
in the present study outperformed the MUFFINN algorithm. Therefore,
the network strategy of prioritizing OS genes described in the
present study is effective.
Acknowledgements
Not applicable.
Funding
No funding was received.
Availability of data and materials
The datasets generated and/or analyzed during the
current study are available from COSMIC (https://cancer.sanger.ac.uk/cosmic).
Authors' contributions
ZS and KH conceived the experiment design. ZS
performed the data analysis. ZS wrote the manuscript. ZS and KH
revised the manuscript. All authors have read and approved the
final version of the manuscript.
Ethics approval and consent to
participate
Not applicable.
Patients consent for publication
Not applicable.
Competing interests
The authors declare that they have no competing
interests.
References
|
1
|
Ritter J and Bielack SS: Osteosarcoma. Ann
Oncol. 21 (Suppl 7):vii320–vii325. 2010. View Article : Google Scholar : PubMed/NCBI
|
|
2
|
Tumijan W, Khattak MN, Nadiah WA and Naing
NN: Five-year survival of osteosarcoma patients in hospital
universiti sains malaysia (Husm): An eleven year review. Res J
Pharmacy Technol. 11:3534–3542. 2018. View Article : Google Scholar
|
|
3
|
Chen X, Bahrami A, Pappo A, Easton J,
Dalton J, Hedlund E, Ellison D, Shurtleff S, Wu G, Wei L, et al:
Recurrent somatic structural variations contribute to tumorigenesis
in pediatric osteosarcoma. Cell Rep. 7:104–112. 2014. View Article : Google Scholar : PubMed/NCBI
|
|
4
|
Martincorena I, Raine KM, Gerstung M,
Dawson KJ, Haase K, Van Loo P, Davies H, Stratton MR and Campbell
PJ: Universal patterns of selection in cancer and somatic tissues.
Cell. 171:1029–1041.e21. 2017. View Article : Google Scholar : PubMed/NCBI
|
|
5
|
Cheng F, Zhao J and Zhao Z: Advances in
computational approaches for prioritizing driver mutations and
significantly mutated genes in cancer genomes. Brief Bioinform.
17:642–656. 2016. View Article : Google Scholar : PubMed/NCBI
|
|
6
|
Forbes SA, Beare D, Gunasekaran P, Leung
K, Bindal N, Boutselakis H, Ding M, Bamford S, Cole C, Ward S, et
al: COSMIC: Exploring the world's knowledge of somatic mutations in
human cancer. Nucleic Acids Res. 43((Database Issue)): D805–D811.
2015. View Article : Google Scholar : PubMed/NCBI
|
|
7
|
Rogers MF, Shihab HA, Gaunt TR and
Campbell C: CScape: A tool for predicting oncogenic single-point
mutations in the cancer genome. Sci Rep. 7:115972017. View Article : Google Scholar : PubMed/NCBI
|
|
8
|
Shihab HA, Rogers MF, Gough J, Mort M,
Cooper DN, Day IN, Gaunt TR and Campbell C: An integrative approach
to predicting the functional effects of non-coding and coding
sequence variation. Bioinformatics. 31:1536–1543. 2015. View Article : Google Scholar : PubMed/NCBI
|
|
9
|
Dong C, Guo Y, Yang H, He Z, Liu X and
Wang K: iCAGES: Integrated CAncer GEnome Score for comprehensively
prioritizing driver genes in personal cancer genomes. Genome Med.
8:1352016. View Article : Google Scholar : PubMed/NCBI
|
|
10
|
Cho A, Shim JE, Kim E, Supek F, Lehner B
and Lee I: MUFFINN: Cancer gene discovery via network analysis of
somatic mutation data. Genome Biol. 17:1292016. View Article : Google Scholar : PubMed/NCBI
|
|
11
|
Shihab HA, Gough J, Cooper DN, Stenson PD,
Barker GL, Edwards KJ, Day IN and Gaunt TR: Predicting the
functional, molecular, and phenotypic consequences of amino acid
substitutions using hidden Markov models. Hum Mutat. 34:57–65.
2013. View Article : Google Scholar : PubMed/NCBI
|
|
12
|
Merid SK, Goranskaya D and Alexeyenko A:
Distinguishing between driver and passenger mutations in individual
cancer genomes by network enrichment analysis. BMC Bioinformatics.
15:3082014. View Article : Google Scholar : PubMed/NCBI
|
|
13
|
Kuijjer ML, Peterse EF, van den Akker BE,
Briaire-de Bruijn IH, Serra M, Meza-Zepeda LA, Myklebost O, Hassan
AB, Hogendoorn PC and Cleton-Jansen AM: IR/IGF1R signaling as
potential target for treatment of high-grade osteosarcoma. BMC
Cancer. 13:2452013. View Article : Google Scholar : PubMed/NCBI
|
|
14
|
Zhang T and Zhang D: Integrating omics
data and protein interaction networks to prioritize driver genes in
cancer. Oncotarget. 8:58050–58060. 2017.PubMed/NCBI
|
|
15
|
Breiman L: Random forests. Machine
Learning. 45:5–32. 2001. View Article : Google Scholar
|
|
16
|
Wen Z, Liu ZP, Liu Z, Zhang Y and Chen L:
An integrated approach to identify causal network modules of
complex diseases with application to colorectal cancer. J Am Med
Inform Assoc. 20:659–667. 2013. View Article : Google Scholar : PubMed/NCBI
|
|
17
|
Zheng S and Zhao Z: GenRev: Exploring
functional relevance of genes in molecular networks. Genomics.
99:183–188. 2012. View Article : Google Scholar : PubMed/NCBI
|
|
18
|
Dupont P, Callut J, Dooms G, Monette JN
and Deville Y: Relevant subgraph extraction from random walks in a
graph. Research Report UCL/FSA/INGI RR 2006-07. 2006.
|
|
19
|
Miao YR, Liu W, Zhang Q and Guo AY:
lncRNASNP2: An updated database of functional SNPs and mutations in
human and mouse lncRNAs. Nucleic Acids Res. 46:D276–D280. 2018.
View Article : Google Scholar : PubMed/NCBI
|
|
20
|
Bashashati A, Haffari G, Ding J, Ha G, Lui
K, Rosner J, Huntsman DG, Caldas C, Aparicio SA and Shah SP:
DriverNet: Uncovering the impact of somatic driver mutations on
transcriptional networks in cancer. Genome Biol. 13:R1242012.
View Article : Google Scholar : PubMed/NCBI
|
|
21
|
Hou JP and Ma J: DawnRank: Discovering
personalized driver genes in cancer. Genome Med. 6:562014.
View Article : Google Scholar : PubMed/NCBI
|
|
22
|
Liu Y, Zhang X, Han C, Wan G, Huang X,
Ivan C, Jiang D, Rodriguez-Aguayo C, Lopez-Berestein G, Rao PH, et
al: TP53 loss creates therapeutic vulnerability in colorectal
cancer. Nature. 520:697–701. 2015. View Article : Google Scholar : PubMed/NCBI
|
|
23
|
Li G, Zhang W, Zeng H, Chen L, Wang W, Liu
J, Zhang Z and Cai Z: An integrative multi-platform analysis for
discovering biomarkers of osteosarcoma. BMC Cancer. 9:1502009.
View Article : Google Scholar : PubMed/NCBI
|
|
24
|
Behjati S and Tarpey PS: What is next
generation sequencing. Arch Dis Child Educ Pract Ed. 98:236–238.
2013. View Article : Google Scholar : PubMed/NCBI
|
|
25
|
Ma M, Wang C, Glicksberg BS, Schadt EE, Li
SD and Chen R: Identify cancer driver genes through shared
Mendelian disease pathogenic variants and cancer somatic mutations.
Pac Symp Biocomput. 22:473–484. 2017.PubMed/NCBI
|
|
26
|
Do SI, Jung WW, Kim HS and Park YK: The
expression of epidermal growth factor receptor and its downstream
signaling molecules in osteosarcoma. Int J Oncol. 34:797–803.
2009.PubMed/NCBI
|
|
27
|
Fu HL, Shao L, Wang Q, Jia T, Li M and
Yang DP: A systematic review of p53 as a biomarker of survival in
patients with osteosarcoma. Tumour Biol. 34:3817–3821. 2013.
View Article : Google Scholar : PubMed/NCBI
|
|
28
|
Henson E, Chen Y and Gibson S: EGFR family
Members' regulation of autophagy is at a crossroads of cell
survival and death in cancer. Cancers (Basel). 9:E272017.
View Article : Google Scholar : PubMed/NCBI
|
|
29
|
Lamora A, Talbot J, Mullard M, Brounais-Le
Royer B, Redini F and Verrecchia F: TGF-β signaling in bone
remodeling and osteosarcoma progression. J Clin Med. 5:E962016.
View Article : Google Scholar : PubMed/NCBI
|
|
30
|
Sulzmaier FJ, Jean C and Schlaepfer DD:
FAK in cancer: Mechanistic findings and clinical applications. Nat
Rev Cancer. 14:598–610. 2014. View Article : Google Scholar : PubMed/NCBI
|
|
31
|
Starczynowski DT, Lockwood WW, Deléhouzée
S, Chari R, Wegrzyn J, Fuller M, Tsao MS, Lam S, Gazdar AF, Lam WL
and Karsan A: TRAF6 is an amplified oncogene bridging the RAS and
NF-κB pathways in human lung cancer. J Clin Invest. 121:4095–4105.
2011. View Article : Google Scholar : PubMed/NCBI
|
|
32
|
Meng Q, Zheng M, Liu H, Song C, Zhang W,
Yan J, Qin L and Liu X: TRAF6 regulates proliferation, apoptosis,
and invasion of osteosarcoma cell. Mol Cell Biochem. 371:177–186.
2012. View Article : Google Scholar : PubMed/NCBI
|
|
33
|
Krisenko MO and Geahlen RL: Calling in
SYK: SYK's dual role as a tumor promoter and tumor suppressor in
cancer. Biochim Biophys Acta. 1853:254–263. 2015. View Article : Google Scholar : PubMed/NCBI
|
|
34
|
Sun L, Li J and Yan B: Gene expression
profiling analysis of osteosarcoma cell lines. Mol Med Rep.
12:4266–4272. 2015. View Article : Google Scholar : PubMed/NCBI
|
|
35
|
Chen MJ, Wu DW, Wang YC, Chen CY and Lee
H: PAK1 confers chemoresistance and poor outcome in non-small cell
lung cancer via β-catenin-mediated stemness. Sci Rep. 6:349332016.
View Article : Google Scholar : PubMed/NCBI
|
|
36
|
Chen YL, Huang WC, Yao HL, Chen PM, Lin
PY, Feng FY and Chu PY: Down-regulation of RASA1 is associated with
poor prognosis in human hepatocellular carcinoma. Anticancer Res.
37:781–785. 2017. View Article : Google Scholar : PubMed/NCBI
|
|
37
|
Wolf M, El-Rifai W, Tarkkanen M, Kononen
J, Serra M, Eriksen EF, Elomaa I, Kallioniemi A, Kallioniemi OP and
Knuutila S: Novel findings in gene expression detected in human
osteosarcoma by cDNA microarray. Cancer Genet Cytogenet.
123:128–132. 2000. View Article : Google Scholar : PubMed/NCBI
|
|
38
|
Supek F, Miñana B, Valcárcel J, Gabaldón T
and Lehner B: Synonymous mutations frequently act as driver
mutations in human cancers. Cell. 156:1324–1335. 2014. View Article : Google Scholar : PubMed/NCBI
|