Introduction
Ovarian cancer (OC) is one of the most commonly
diagnosed types of gynecological cancer worldwide and had the
highest mortality rates among all types of cancer of the female
reproductive system in 2017 (1).
Despite the poorly understood etiology of this cancer type, certain
risk factors have been established, which include genetic
predisposition and age. By contrast, contraceptive administration
and increased parity have been found to be major protective factors
(2). The most common subtypes of OC
include serous, mucinous, endometrioid and clear cell carcinoma
(3). Since OC is asymptomatic during
its early stages, it is most commonly diagnosed at late stages,
leading to a poor prognosis and short overall survival time
(4). In total, >80% of OC cases
exhibit a positive response to standard chemotherapy along with
platinum-based and taxane molecules (5); nevertheless, chemoresistance remains a
major limitation in cancer treatment (6).
Although cancer antigen 125 (Ca-125) is the major
biomarker used for diagnosis and disease monitoring in OC, this
glycoprotein is also highly expressed in other types of
malignancies, including breast cancer, mesothelioma, non-Hodgkin's
lymphoma and gastric cancer (7–11), and
is less expressed in some benign cases, including pregnancy and
ovulatory cycles (12,13). Despite the functions of Ca-125 being
poorly understood, certain studies have suggested the implication
of this glycoprotein in the cell-mediated immune response. Ca-125
binds to natural killer (NK) cells via galectin-1 and other
antibodies, leading to a reduction in CD16 expression and
suppression of the NK cell cytotoxic responses (14,15).
Moreover, Ca-125 is able to bind to mesothelin, a 40-kDa protein
expressed by mesothelial cells and certain types of cancer cells,
including epithelial OC cells. Taking into account that peritoneal
cells express the membrane-bound form of mesothelin, this
interaction between both proteins may increase the risk of
metastasis of Ca-125-expressing tumor cells into the peritoneal
cavity (16,17). Furthermore, overexpression of the
mucin 16 gene coding for Ca-125 has been observed to increase the
risk of resistance to certain chemotherapeutic agents, including
cisplatin (18). Ca-125, which is
modulated by various factors, regulates the activity of mechanistic
target of rapamycin (mTOR) kinase, which in turn controls the
expression of its downstream target c-MYC. In addition, knockdown
of the MUC16 gene in pancreatic cancer cells has been shown to lead
to a decrease in glucose uptake and lactate secretion, and to an
alteration of cellular proliferation and metabolism (19).
In >80% of different types of cancer case,
telomerase is expressed by cancer cells to ensure their
immortalization (20). This enzyme
promotes telomere length stabilization and elongation through de
novo synthesis of repeats lost after DNA replication or
oxidative stress (21). Recently,
inhibitors of telomerase activity, including BIBR1532, have been
investigated as potential adjuvants to platinum-based chemotherapy
in OC cells in vitro (22).
The catalytic subunit of telomerase, human telomerase reverse
transcriptase (hTERT), regulates telomerase activity through the
variation of its expression (23).
In fact, hTERT mRNA expression is regulated by a number of
proteins; however, the transcription factor c-MYC serves an
essential role in the activation of this expression by forming a
complex with the MYC-associated factor X protein and binding to the
E boxes of the promoter region (24). The expression of c-MYC is linked to
various signaling pathways, including the
phosphatidylinositol-4,5-bisphosphate 3-kinase (PI3K)/protein
kinase B (Akt)/mTOR, Wnt/β catenin and mitogen-activated protein
kinase signaling pathways (25,26).
Increased glucose metabolism is a distinct
characteristic of highly proliferative cells, including cancer
cells, stem cells and immune cells (27). Even in the presence of oxygen, cancer
cells tend to metabolize glucose into lactate instead of undergoing
oxidative phosphorylation. This process is termed the Warburg
effect (28). Since one of the eight
hallmark characteristics of cancer cells is their ability to
reprogram glucose metabolism (29),
the effect of glucose restriction on cancer cell proliferation,
apoptosis and response to treatment has been recently studied. In
fact, glucose levels in cancer patients may be an important
prognostic indicator. In OC, increased expression of glucose
transporter 1 (GLUT1), a transmembrane protein responsible for
glucose uptake, is related to shorter survival time in patients
with OC (30). In addition,
decreasing glucose availability for colon cancer cells has been
reported to contribute to an increase in cell death (31). Moreover, the combination of glucose
restriction and autophagy inhibition has been shown to result in
decreased tumor growth and cancer cell proliferation (32). Furthermore, a decrease in telomerase
activity and a higher response rate to the telomerase inhibitor
BIBR-1532 was observed in breast cancer cells cultured in medium
with low glucose concentration (33).
Considering the fact that most relapse cases in
patients with OC occur due to chemoresistance, mechanisms aiding in
reversing resistance or preventing its occurrence should be
investigated. Several studies have proven the involvement of hTERT
in cancer cell immortalization. Moreover, Ca-125 affects the
response of cancer cells to chemotherapy and glucose restriction
decreases cancer cell proliferation and viability (34). Based on these facts, the effect of
chemotherapy combined with glucose restriction on the expression
and activity of Ca-125 and telomerase was assessed in the present
study. Additionally, the modulation of Ca-125 expression by hTERT
and the possible involvement of the PI3K/Akt/mTOR signaling pathway
were investigated.
Materials and methods
Cell culture and drugs
The present study was performed on 3 OC cell lines,
namely the Igrov-1 (Institut Gustave Roussy), SKOV-3 and Ovcar-3
(both American Type Culture Collection) cell lines. SKOV-3 and
Igrov-1 cells were cultured in 4.5 g/l DMEM supplemented with 10%
FBS and 1% penicillin-streptomycin (PS; Sigma-Aldrich; Merck KGaA)
according to the manufacturer's protocol, whereas Ovcar-3 cells was
cultured in F12 medium supplemented with 20% FBS and 1% PS
(Sigma-Aldrich; Merck KGaA). All cells were incubated in a
humidified incubator at 37°C with 5% CO2. CDDP
(Sigma-Aldrich; Merck KGaA) was freshly dissolved in 0.9% NaCl
solution, whereas PTX (Sigma-Aldrich; Merck KGaA) was prepared in
DMSO and stored at −20°C.
Short-term combinatorial
treatment
The three OC cell types were seeded in 6-well plates
(2×10⁵ cells/well) and treated with 20 µM cisplatin
(CDDP) and 100 nM paclitaxel (PTX) for 48 h at 37°C at 80%
confluence. This treatment was performed in three different cell
culture media: i) DMEM with 4.5 g/l glucose, ii) DMEM with 1 g/l
glucose and iii) DMEM with 0.5 g/l glucose. The negative control
corresponded to non-treated cells. The supernatant was subsequently
collected and the treated cells were subjected to RNA extraction
using Nucleospin RNA Extraction kit (Macherey-Nagel, GmbH).
Generation of platinum-taxane escape
(PTES) cells (35)
To generate PTES cells, 1×10⁵ SKOV-3,
Ovcar-3 and Igrov-1 cells were seeded in 6-well plates and treated
at 37°C with 20 µM CDDP for 1 h, followed by 100 nM PTX for 3 h
once per week for 6 weeks. Prior to and during the treatment, the
cells were exposed to glucose restriction for 48 h by administering
three different glucose concentrations (4.5, 1 and 0.5 g/l glucose)
in the culture media. After 6 weeks, the live cells were considered
as PTES cells.
Determination of telomere length
The PTES cells remained in culture for 1 month after
the treatment, and were subsequently harvested and subjected to DNA
extraction using the Nucleospin DNA Extraction kit (Macherey-Nagel,
GmbH) following the manufacturer's protocol. Telomere length was
assessed according to the protocol proposed by R. Cawthon (36) Briefly, quantitative PCR (qPCR) was
performed using the following primer pairs: Telo forward,
5′-CGGTTTGTTTGGGTTTGGGTTTGGGTTTGGGTTTGGGTT-3′ and reverse,
5′-GGCTTGCCTTACCCTTACCCTTACCCTTACCCTTACCCT-3′); and 36B4 (reference
gene), forward, 5′-CAGCAAGTGGGAAGGTGTAATCC-3′ and reverse,
5′-CCCATTCTATCAACGGGTACAA-3′. The following thermocycling
conditions were applied: For telomeres, 5 min at 95°C, followed by
18 cycles of 95°C for 15 sec, 54°C for 2 min and 72°C for 10 sec,
and then 40°C for 30 sec; and for 36b4, 10 min at 95°C, followed by
30 cycles of 95°C for 15 sec, 58°C for 60 sec and 72°C for 10 sec,
and then 40°C for 30 sec (37).
Treatment with hTERT and PI3K/Akt/mTOR
inhibitors
A total of 1×10⁵ SKOV-3, Ovcar-3 and
Igrov-1 cells were seeded in 6-well plates. Once they reached 80%
confluence, these cells were treated at 37°C for 48 h with the
following inhibitors: Telomerase inhibitors BIBR-1532 (5 and 10
µM), costunolide (5 and 10 µM) and MST-312 (1 and 2 µM); PI3K
inhibitors PI 828, wortmanin and GSK (10 µM); AKT inhibitor GSK
690693 (100 nM); and mTOR inhibitor rapamycin (200 nM) (all Tocris
Bioscience). The negative control corresponded to non-treated cells
maintained in the same conditions as treated cells. In order to
indicate the concentrations that should be used for each inhibitor,
a toxicity test was performed, and the concentrations were chosen
according to the highest concentration that has no toxic effect,
therefore no effect on cell viability.
hTERT silencing
Small interfering RNA (siRNA, 5 nmol) specific for
hTERT (sense, 5′-GGAGCAAGUUGCAAAGCAUTT-3′ and antisense,
5′-AUGCUUUGCAACUUGCUCCAG-3′) with non-silencing (negative control)
and cell death (positive control) siRNAs were used for hTERT
silencing (all Qiagen Inc.). The SKOV-3, Ovcar-3 and Igrov-1 cells
were seeded in 6-well plates at a density of 2×10⁵
cells/well and transfected for 72 h with the siRNAs at a
concentration of 20 µM using the HighPerfect transfection reagent
(Qiagen, Inc.), according to the manufacturer's protocols.
Knockdown efficacy of hTERT was confirmed by reverse
transcription-quantitative polymerase chain reaction (RT-qPCR).
Transfection with hTERT-wild type
construct
The three cell lines were transfected with two types
of vectors, pBabe-neo-hTERT (cat. no. 1774) and pBabe-neo (control;
cat. no. 1767), gifted from Addgene, Inc. After plasmid
purification from transformed bacteria using a GenElute HP Plasmid
Maxiprep kit (Sigma-Aldrich; Merck KGaA), the transfection was
performed using Attractene Transfection Reagent (Qiagen Inc.),
according to the manufacturer's protocols. Briefly, the cells were
seeded in 6-well plates at a density of 0.5×10⁶
cells/well. Prior to seeding, 1.2 µg of plasmid, attractene and
serum-free DMEM (4.5 g/l glucose; for SKOV-3 and Igrov-1), or F-12
for Ovcar-3, were mixed in the wells and incubated for 15 min at
room temperature. Subsequently, cells were seeded in 6-well plates
for 48 h at 37°C prior to subsequent experiments.
RT-qPCR
To assess the effect of CDDP + PTX treatment on the
mRNA expression of hTERT, Ca-125 and certain molecules [interleukin
(IL)-6, IL-8, bone morphogenetic protein 2 (BMP2) and excision
repair cross-complementation group 1 (ERCC1)] involved in
chemoresistance, total RNA was extracted from the PTES and 48-h
treated cells using Nucleospin RNA extraction kit. In addition,
cells treated with hTERT and PI3K/Akt/mTOR inhibitors underwent RNA
extraction using Nucleospin RNA extraction kit. Total RNA (40 ng)
was reverse transcribed into cDNA using the iScript cDNA synthesis
kit (Bio-Rad Laboratories, Inc.) according to the manufacturer's
instruction. Subsequently, the mRNA expression levels of hTERT,
Ca-125, IL-6, IL-8, BMP2 and ERCC1, glucose transporters 1 and 3
(GLUT-1 and GLUT-3) and hypoxia inducible subunit α (HIF1α), and
the internal reference gene GAPDH were quantified by qPCR using the
QuantiFast SYBR Green PCR kit (Qiagen, Inc.) using specific primers
for each gene (Table I). cDNA
amplification was performed following a PCR program of 40 cycles,
with denaturation at 95°C for 10 sec and annealing at 58°C (IL-6,
IL-8, BMP-2 and Ca-125) or 60°C for 30 sec, followed by elongation
at 72°C for 10 sec (hTERT, ERCC1 and GAPDH) using a Rotor-Gene qPCR
cycler (Qiagen GmbH). The mRNA levels were quantified using the
2−ΔΔCq method, where the control was normalized to 1 and
the treated samples were compared with their control (38).
 | Table I.List of primer sequences. |
Table I.
List of primer sequences.
| Gene | Primer sequence
(5′-3′) |
|---|
| hTERT | F:
CGGAAGAGTGTCTGGAGCAA |
|
| R:
CTCCCACGACGTAGTCCATG |
| Ca-125 | F:
CTGCATGTACTCCCATCTCTTCAA |
|
|
GAGAGAGATGGGAGTAGATGCAG |
|
| R:
CTGCATCTACTCCCATCTCTCTC |
|
|
TTGAAGAGATGGGAGTAGATGCAG |
| IL-6 | F:
TCAATATTAGAGTCTCAACCCCCA |
|
| R:
TTCTCTTTCGTTCCCGGTGG |
| IL-8 | F:
CCACCGGAGCACTCCATAAG |
|
| R:
GATGGTTCCTTCCGGTGGTT |
| BMP2 | F:
TTTCAATGGACGTGTCCCCG |
|
| R:
AGCAGCAACGCTAGAAGAA |
| ERCC1 | F:
AGGCACAAGTAACAGGCTCAC |
|
| R:
AAGGTCGTAATTCCTTTGCAC |
| GAPDH | F:
TGAGCCAGATAGGCTGGAA |
|
| R:
TAACGCAGGCGATGTTGTC |
| GLUT-3 | F:
CCCAGATCTTTGGTCTGGAA |
|
| R:
AAGGGCTGCACTTTGTAGGA |
| GLUT-1 | F:
GATGATGCGGGAGAAGAAGG |
|
| R:
AAGACAGCGTTGATGCCAGAC |
| HIF1α | F:
TATGAGCCAGAAGAACTTTTAGGC |
|
| R:
CACCTCTTTTGGCAAGCATCCTG |
Measurement of Ca-125 in cell
supernatant
Ca-125 levels secreted into the supernatant by
treated and control SKOV-3, Ovcar-3 and Igrov-1 cells
(5×10⁵ cells) were quantified using the DuoSet Human
Ca-125/MUC16 ELISA Kit (R&D Systems, Inc; cat. no. DY990)
according to the manufacturer's protocols. The supernatant was
collected after all treatments were performed and then assayed. The
optical density, which is proportional to Ca-125 concentration, was
measured using an ELISA reader (Thermo Fisher Scientific, Inc.) at
450 nm and the results were normalized according to the number of
cells.
Statistical analysis
All data are presented as the mean ± SD and each
experiment was repeated at least three times. All data were
assessed with SPSS software using one-way ANOVA followed by the LSD
post hoc test. P<0.05 was considered to indicate a statistically
significant difference.
Results
Short-term combination of chemotherapy
and glucose restriction
To study the effect of glucose restriction on the
efficacy of chemotherapy, a 48-h short-term treatment was performed
on the SKOV-3, Ovcar-3 and Igrov-1 cell lines using three different
glucose concentrations. The comparison between the control and
treated cells in the same glucose conditions revealed an increase
in the mRNA expression of hTERT in the treated cells (range,
1.5–2.5 fold; Fig. 1A). Moreover,
this short-term treatment also lead to an increase in Ca-125 mRNA
levels (range, 1.5–3 fold; Fig. 1B).
As presented in Fig. 1C, an
approximate 2-fold increase was observed in the secretion of Ca-125
in the Ovcar-3 cells; however, Ca-125 secretion by the SKOV-3 and
Igrov-1 cells was undetectable by ELISA. Nevertheless, no
significant difference was observed among the cells treated in
different glucose conditions, indicating that the expression of
both proteins was not affected by the decrease in glucose levels
during the treatment.
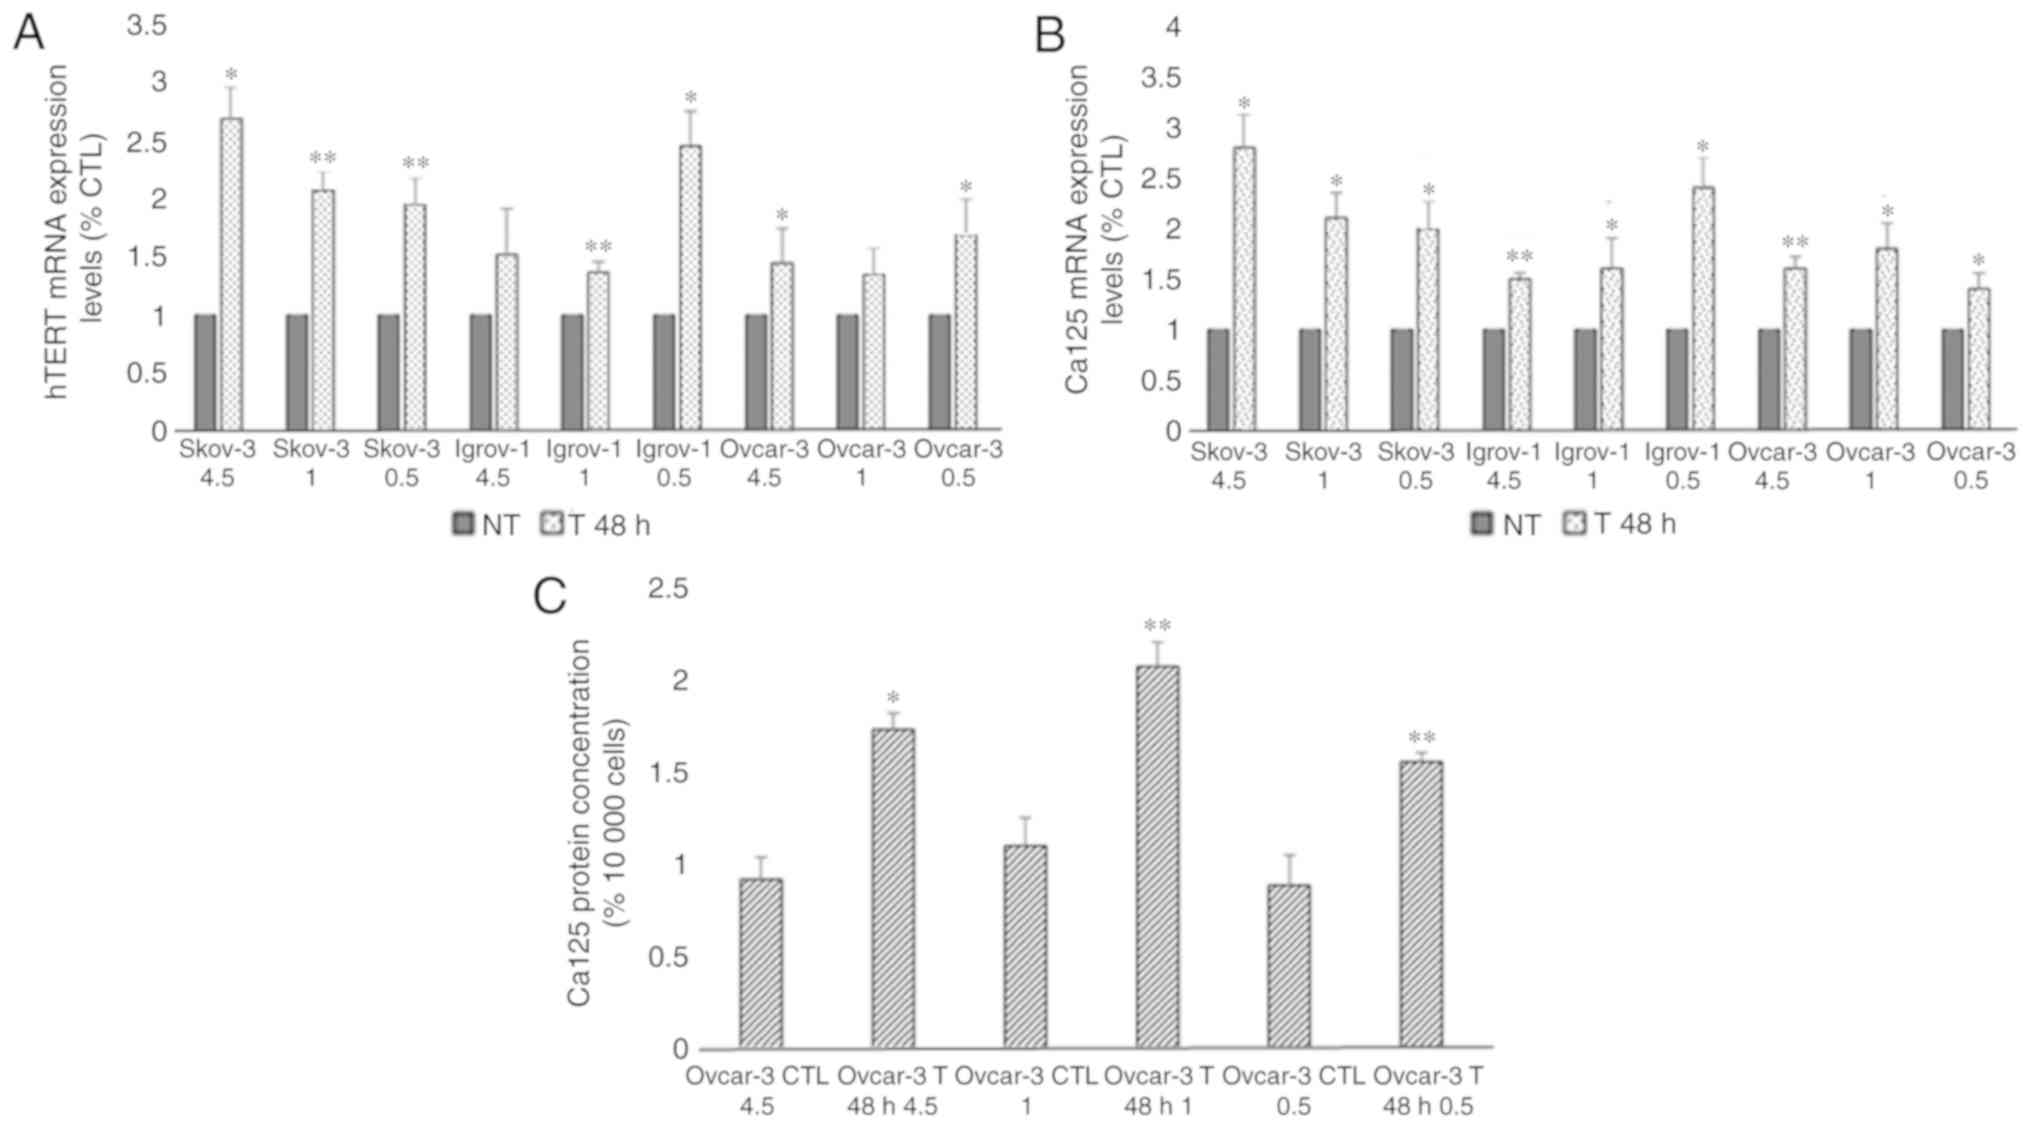 | Figure 1.Effect of 48-h combinatory treatment
of CDDP, PTX and glucose restriction on hTERT and Ca-125 expression
and secretion. SKOV-3, Ovcar-3 and Igrov-1 cells were seeded in 6
well-plates. These cells were treated with three different glucose
concentrations (4.5, 1 and 0.5 g/l) with 20 µM CDDP and 100 nM PTX
for 48 h. Supernatant was collected following the treatment in
order to quantify secreted Ca-125 using ELISA. The cells were then
harvested, and RNA was isolated for hTERT and Ca-125 mRNA
quantification by reverse transcription-quantitative polymerase
chain reaction. (A and B) hTERT and Ca-125 mRNA expression levels
were found to be increased in all treated cells; these results did
not appear to be significantly affected by the different glucose
levels. (C) A similar effect was observed with regard to Ca-125
secretion in the treated Ovcar-3 cells. The values displayed in
this figure refer to values adjusted to 10,000 cells, since cell
number usually affects the levels of secreted proteins. Cell count
was performed following cell harvesting and values were normalized
to 10,000 cells. Each value represents the mean from three
different experiments. The control group was set to 1, and the
remaining values were compared with the control. The results are
presented as the mean ± SD. *P<0.05 vs. control group, and
**P<0.01 vs. control group. CTL, control; CDDP, cisplatin; PTX,
paclitaxel; hTERT, human telomerase reverse transcriptase; Ca-125,
cancer antigen 125; NT, non-treated cells. |
Generation of PTES cells
For the development of OC cell lines with double
resistance to cisplatin and paclitaxel, the SKOV-3, Ovcar-3 and
Igrov-1 cell lines were treated with CDDP and PTX once per week for
6 consecutive weeks. The doses of the chemotherapeutic agents (20
µM CDDP and 100 nM PTX) were chosen according to the peak plasma
levels reached when 100 mg/m2 of CDDP and 175
mg/m2 of PTX were administered intravenously in patients
with ovarian cancer (35). The cells
were treated with CDDP for 1 h and PTX for 3 h. The treatment
durations correspond to the half-life of these chemotherapeutic
agents in the human body (35). The
treatment was performed in culture media of the three cell lines
with the following glucose concentrations, which correspond to the
physiological alterations observed in blood glucose levels: i) 4.5
g/l glucose, high; ii) 1 g/l glucose, low; and (iii) 0.5 g/l
glucose, fasting.
After 6 weeks of treatment, the remaining living
cells were considered as PTES cells. Six PTES cell types were
generated: PTES SKOV-3 cultured in three different glucose
concentrations and PTES Igrov-1 cultured in these same conditions.
Despite their resistance to clinically relevant concentrations of
cisplatin, PTES Ovcar-3 cells could not be generated. In order to
confirm the decrease in the sensitivity of PTES cells to additional
chemotherapeutic challenges, these cells were subjected to a single
exposure of higher doses of CDDP, PTX and a combination of both
treatments in the same glucose conditions as the initial treatment.
According to the obtained results, SKOV-3 and Igrov-1 PTES cells
required higher concentrations of the chemotherapeutic treatment to
reach the same levels of proliferation observed in the parental
cells treated with lower doses (Fig.
2). The chemoresistance profile of the PTES cells was evaluated
by quantifying the mRNA expression levels of the IL-6, IL-8 and
BMP2 proteins, implicated in environment-mediated drug resistance,
and the ERCC1 protein, which is directly involved in DNA repair
(39). The obtained results revealed
a significant increase in the expression of these mRNAs in all PTES
cells, indicating that these cells may have developed resistance to
the chemotherapeutic treatment (Fig.
3). Additional investigations concerning the effect of the
combination of chemotherapy with induced hypo-, normo- and
hyperglycemia on the expression of GLUT1, GLUT3 and HIF1α were
performed by measuring the mRNA expression levels of these genes in
control and PTES cells. The results revealed a significant increase
in the expression of both glucose transporters in PTES cells
treated with the three glucose concentrations, with no significant
difference between them (Fig. 4A and
B). However, HIF1α expression level was significantly increased
only in SKOV-3 4.5 PTES cells (Fig.
4C).
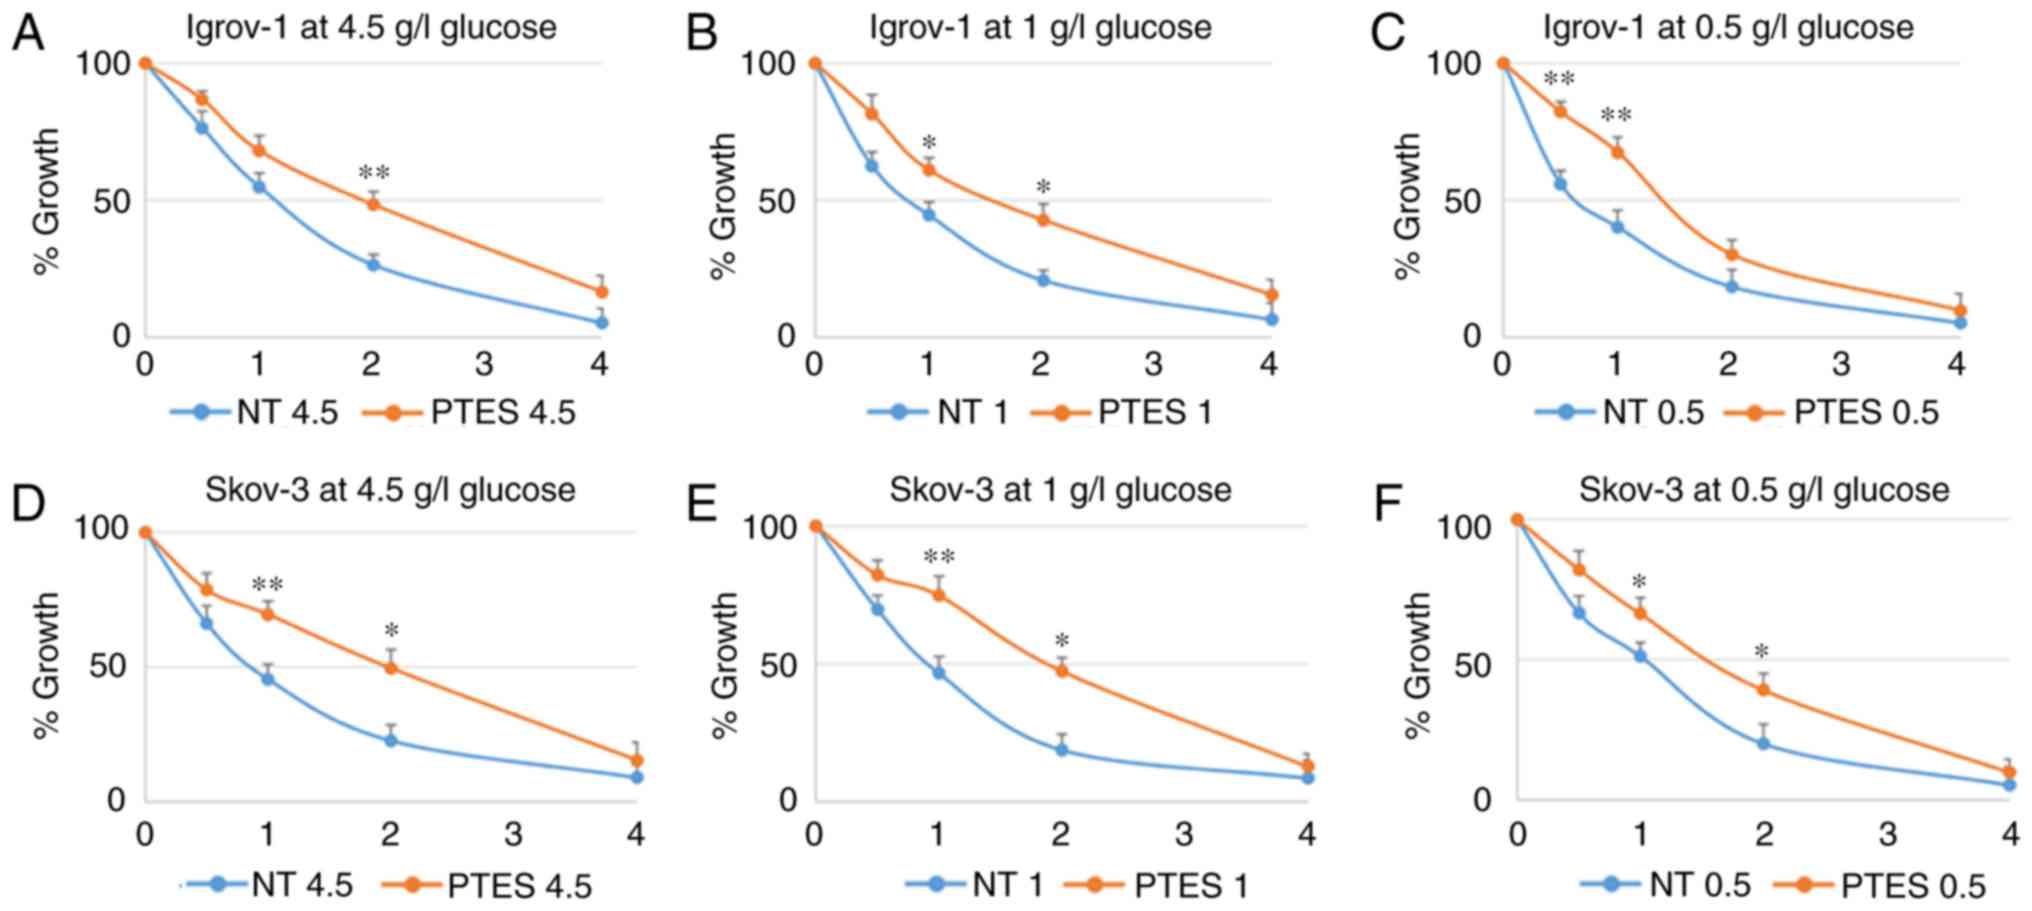 | Figure 2.Characterization of SKOV-3 and
Igrov-1 cells with induced resistance to CDDP and PTX. Igrov-1
(A-C) and SKOV-3 (D-F) control and PTES cells were treated with a
single exposure of increasing doses of CDDP + PTX. The numbers
presented on the x-axis (1, 2, 3 and 4) correspond to CDP1, CDP2,
CDP3 and CDP4, respectively. CDP 1 indicates the treatment of PTES
cells with one single physiological dose of the chemotherapeutic
agents (20 µM CDDP for 1 h + 100 nM PTX for 3 h). CDP 2 indicates
the treatment of PTES cells with twice the physiological dose, CDP
3 with triple the dose, and CDP 4 with four times the physiological
dose. The control group value was set to 1 and the remaining values
were compared with the control. The results are presented as the
mean ± SD. *P<0.05 compared with the control group and
**P<0.01 compared with the control group. CDDP, cisplatin; PTX,
paclitaxel; PTES, platinum-taxane escape; NT, non-treated
cells. |
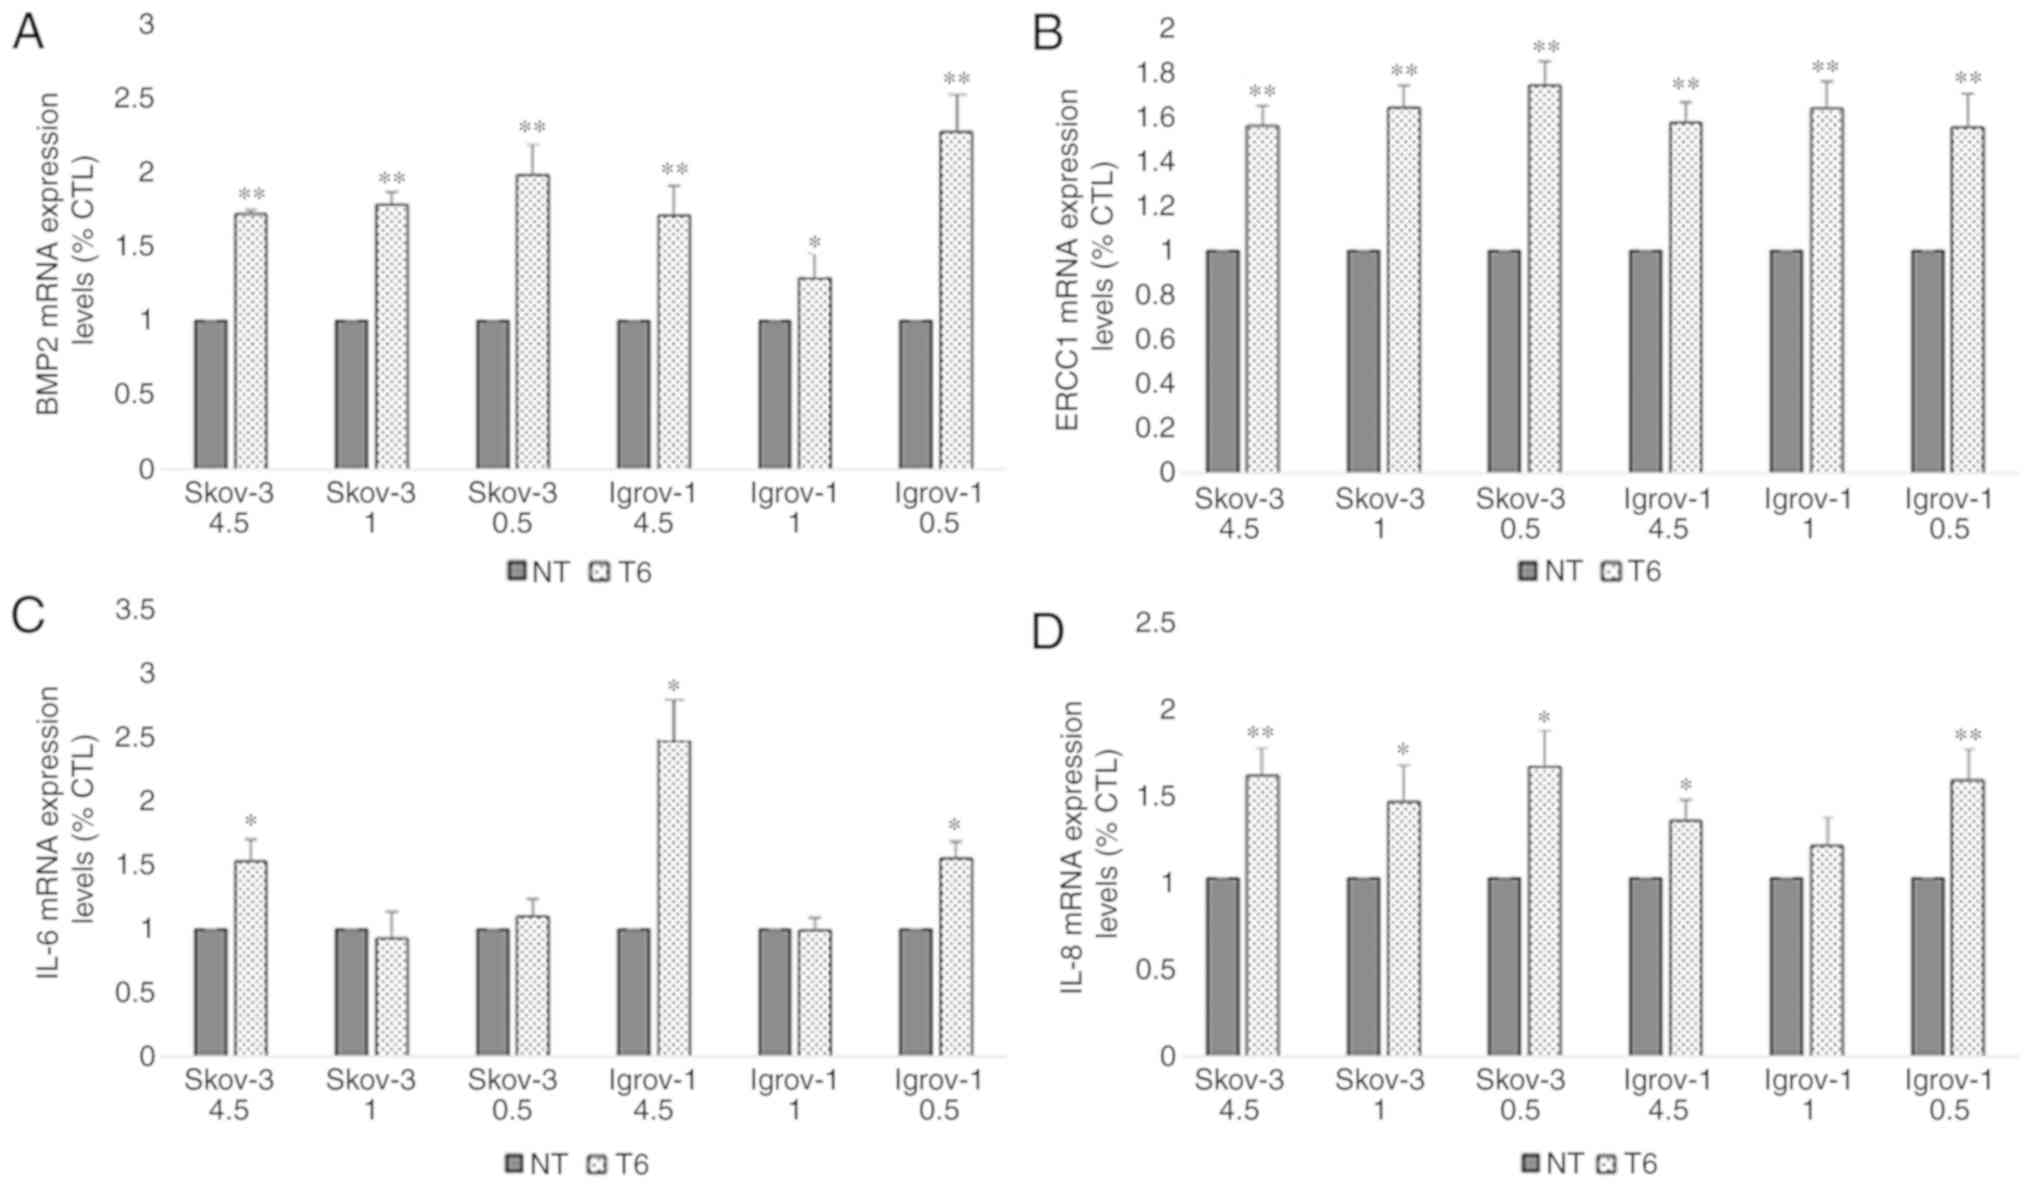 | Figure 3.Effect of 6-week treatment on markers
of chemoresistance in PTES cells. Cells from the three ovarian
cancer cell lines were seeded in 6-well plates. These cells were
cultured with 4.5, 1 and 0.5 g/l glucose concentrations 48 h prior
to the treatment. Next, they were treated with 20 µM CDDP for 1 h,
followed by 100 nM PTX for 3 h. This procedure was repeated once
per week for six consecutive weeks. Subsequently, the cells were
harvested and subjected to RNA extraction, followed by reverse
transcription-quantitative polymerase chain reaction for (A) BMP2,
(B) ERCC1, (C) IL-6 and (D) IL-8. A significant increase was
observed in the expression of the majority of these proteins under
the different conditions. The observed values represent the mean
from three different experiments. Using the 2−ΔΔCq
method, the control group was set to 1, and the remaining results
were compared with the control. The results are presented as the
mean ± SD. *P<0.05 vs. control group, and **P<0.01 vs.
control group. PTES, platinum-taxane escape; CDDP, cisplatin; PTX,
paclitaxel; BMP2, bone morphogenetic protein 2; IL-6,
interleukin-6; IL-8, interleukin-8; ERCC1, excision repair
cross-complementation group 1. |
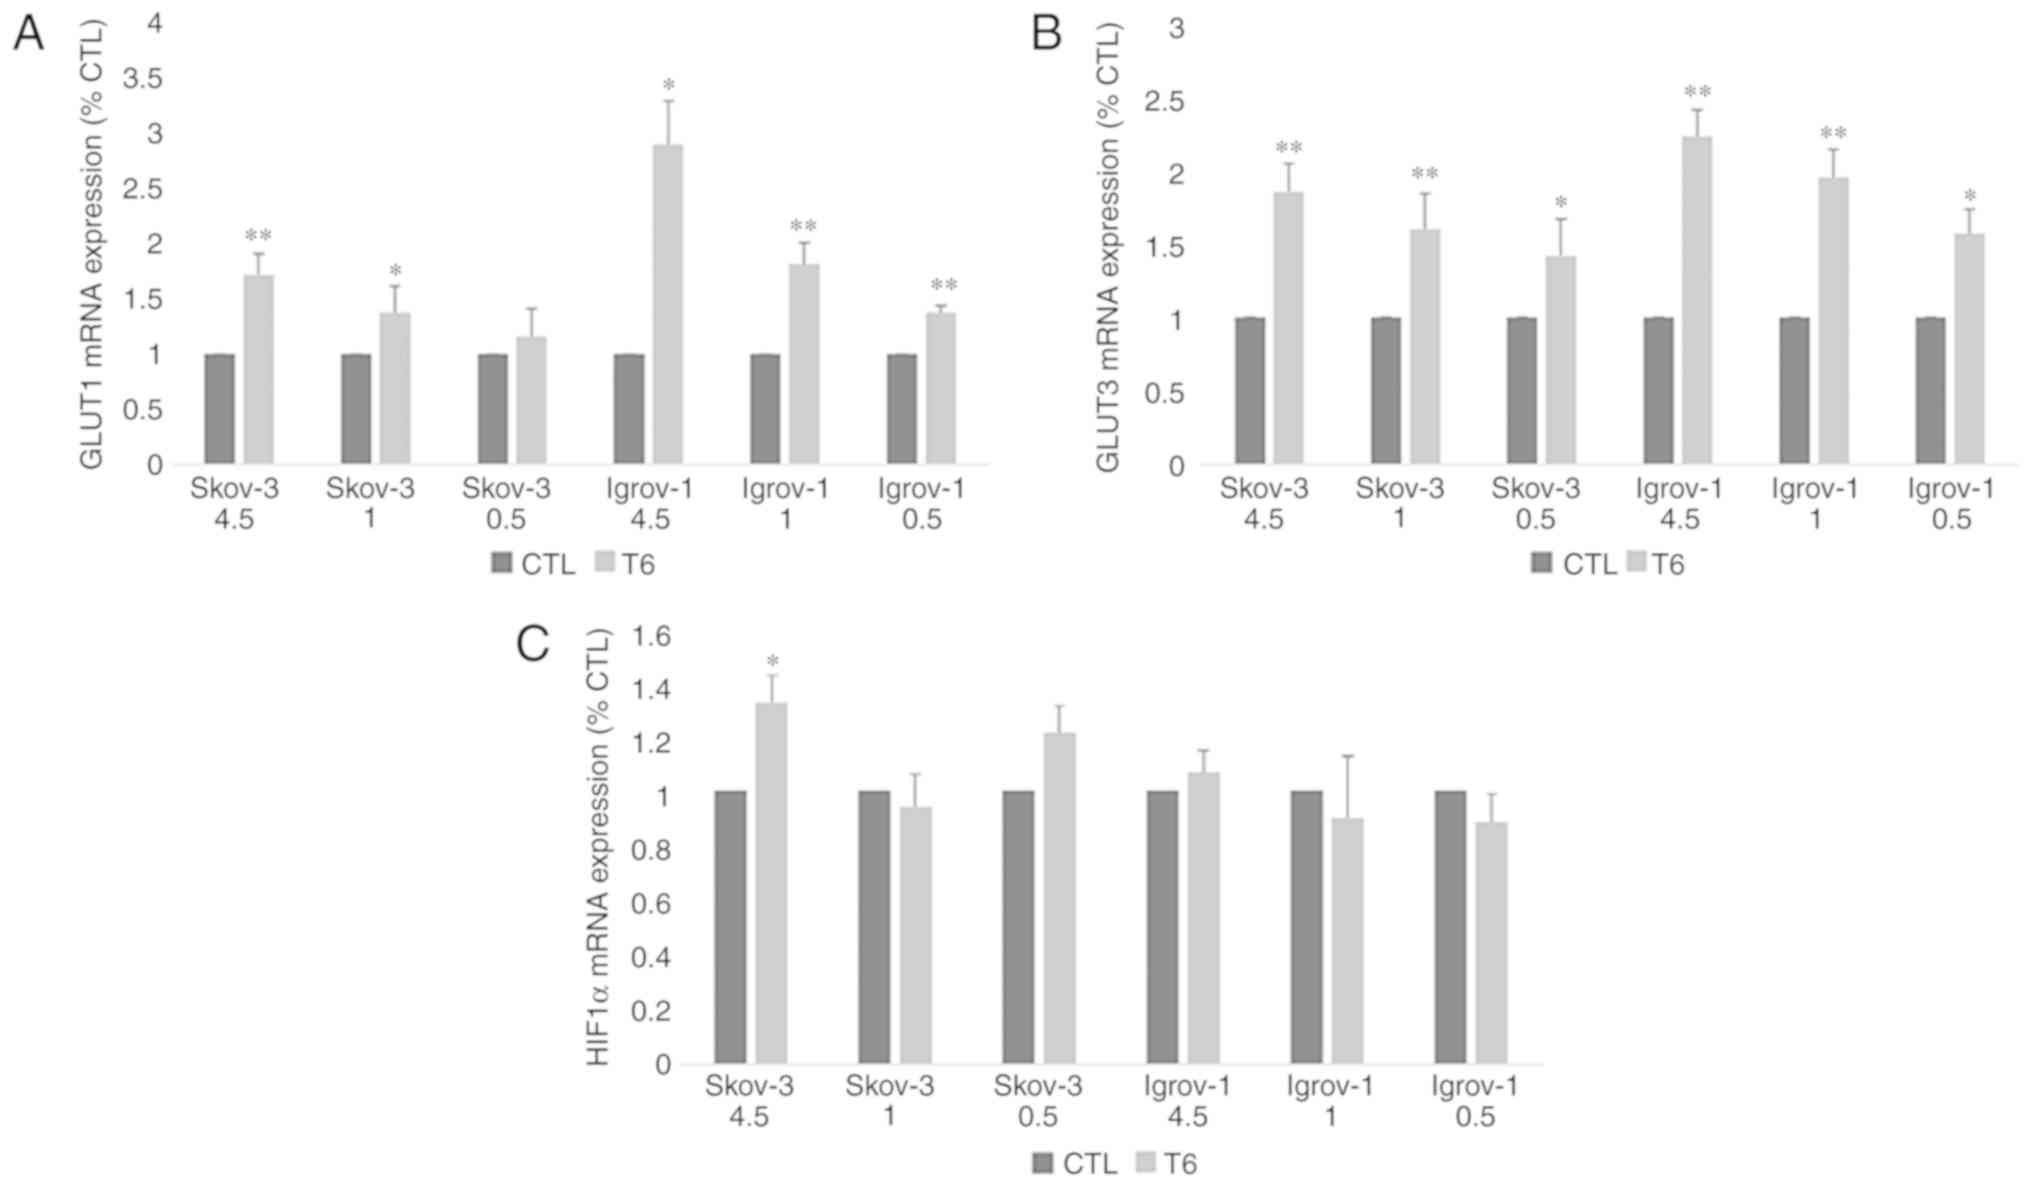 | Figure 4.Effect of 6-week treatment in hyper-,
normo- and hypoglycemic conditions on glucose transporters and
HIF1α expression in PTES cells. Control and PTES cells were
harvested and subjected to RNA extraction, followed by reverse
transcription-quantitative polymerase chain reaction for GLUT1 (A),
GLUT3 (B) and HIF1α (C). A significant increase was observed in the
expression of the glucose transporters under the different
conditions. The observed values represent the mean from three
different experiments. Using the 2−ΔΔCq method, the
control group was set to 1, and the remaining results were compared
with the control. The results are presented as the mean ± SD.
*P<0.05 vs. control group, and **P<0.01 vs. control group.
CTL, control; HIF1α, hypoxia inducible factor 1 subunit α; PTES,
platinum-taxane escape; GLUT1, glucose transporter 1; GLUT3,
glucose transporter 3. |
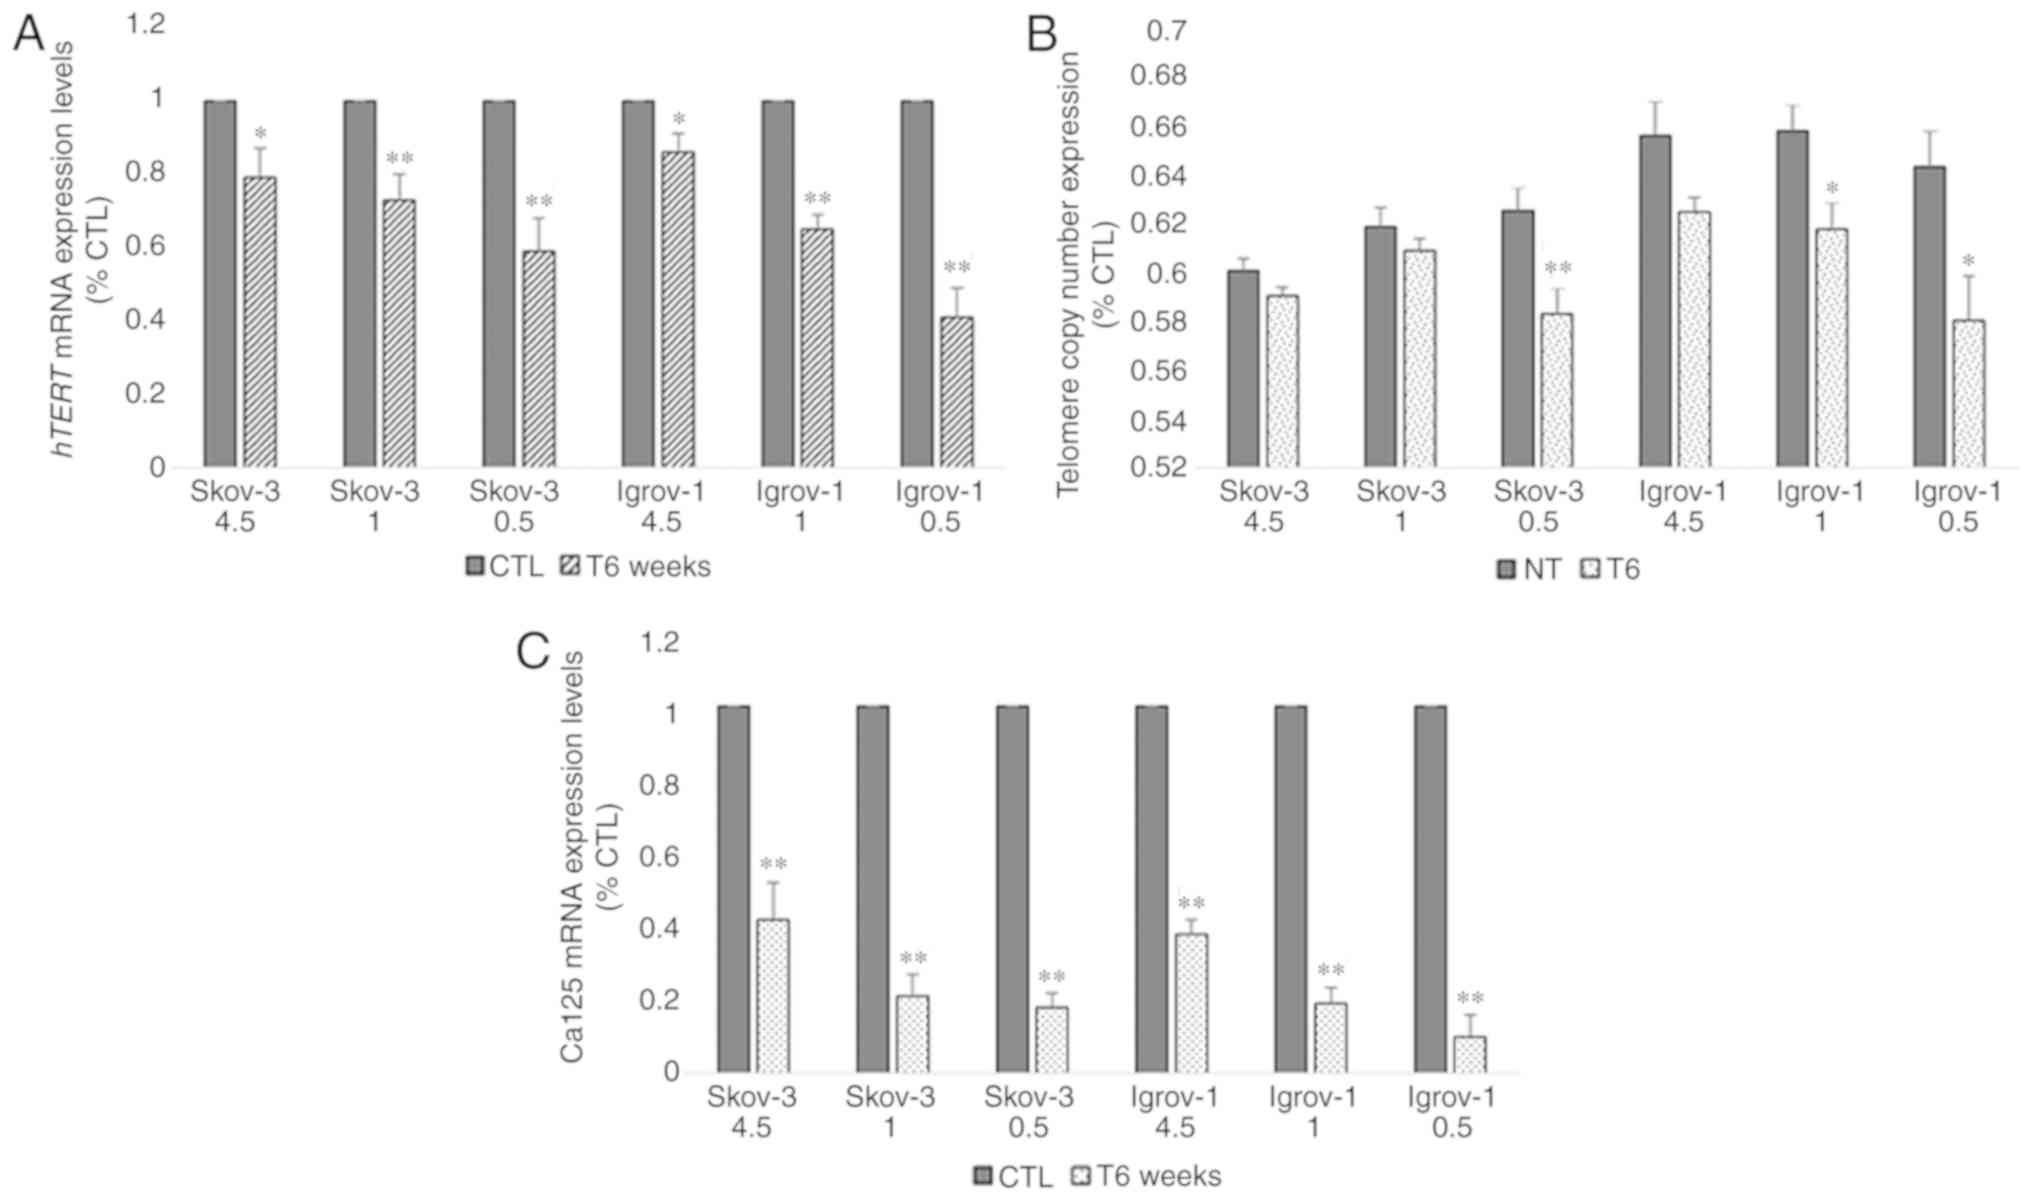
Decrease of telomere length and hTERT
and Ca-125 expression in PTES cells
Next, the effect of this combined long-term (6
weeks) treatment on the expression of hTERT, the catalytic subunit
of telomerase, was assessed in all PTES cell lines. The results
demonstrated a 20% decrease in the hTERT mRNA expression levels of
PTES SKOV-3 cells treated with 4.5 g/l of glucose; however, this
decrease reached 40% with 0.5 g/l of glucose. A similar effect was
observed in the PTES Igrov-1 cells, where the reduction ranged from
15% with 4.5 g/l glucose to 60% with fasting glucose concentrations
(Fig. 5A). Telomere length was
subsequently evaluated to assess the effect of this reduction on
telomerase expression. A non-significant decrease was observed in
PTES SKOV-3 and Igrov-1 cultured with 4.5 and 1 g/l glucose.
However, the decrease in telomere length was greater in the both
PTES cell lines treated with fasting glucose concentrations
(Fig. 5B). Additionally, the Ca-125
mRNA expression levels were quantified in chemosensitive and
chemoresistant cells. It was observed that Ca-125 expression
decreased in a similar manner as the hTERT expression; however, the
reduction ranged between 60 and 80% in the PTES SKOV-3 cells and
between 65 and 85% in the PTES Igrov-1 cells (Fig. 5C).
Effect of hTERT inhibition on Ca-125
expression and secretion
Based on the aforementioned results, a parallel
change in the expression of hTERT and Ca-125 was observed after
both short-term and long-term treatments. Taking into consideration
that telomerase regulates the expression of various genes, the role
of hTERT in the modulation of Ca-125 expression and secretion was
investigated. Thus, chemosensitive cells from the three cell lines
were treated with three telomerase inhibitors: BIBR1532 at 5 and 10
µM, costunolide at 5 and 10 µM and MST-312 at 1 and 2 µM. The
concentrations of these inhibitors were selected according to a
dose-response curve, which demonstrated that they did not exert any
cytotoxic effects. The results indicated a significant decrease in
the mRNA and protein expression of Ca-125 in the three cell lines
after treatment with all three inhibitors compared with the
control. However, the highest effect was observed with BIBR1532 at
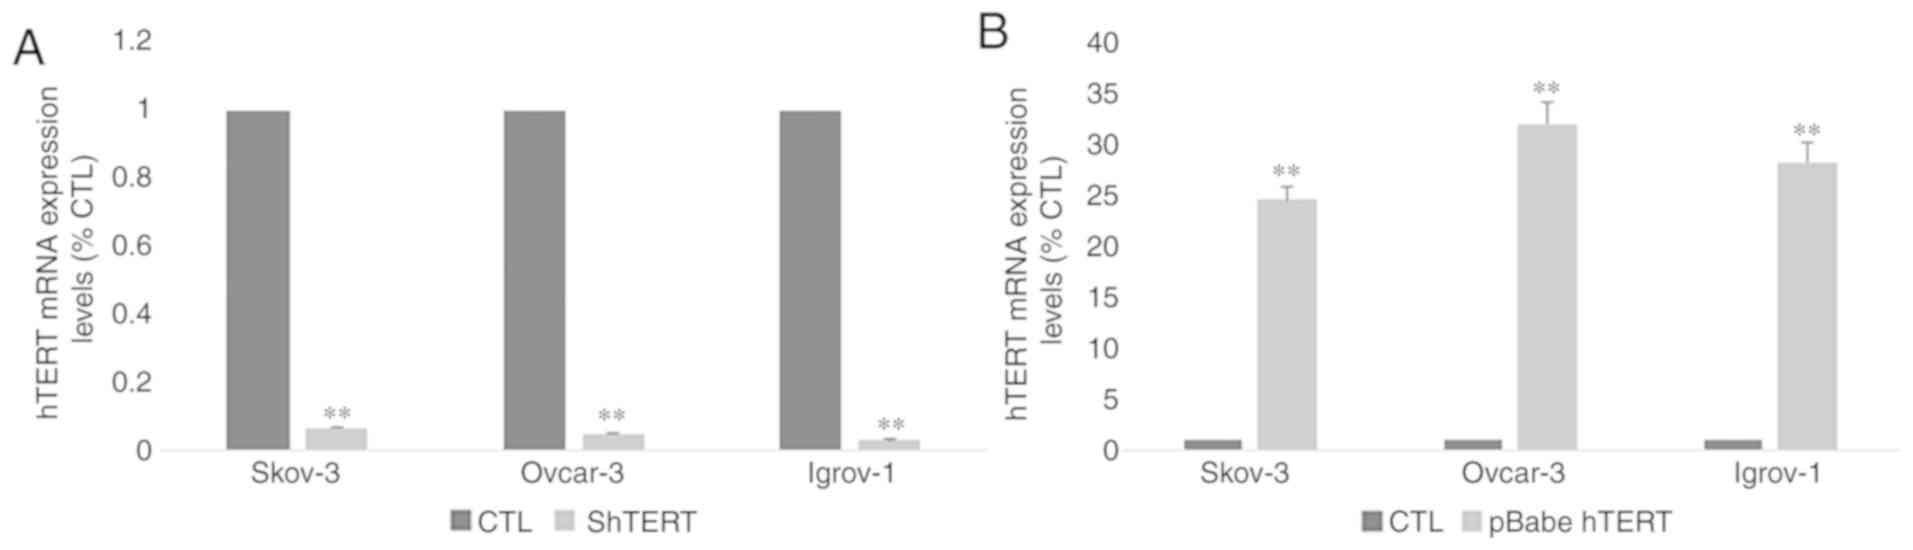
5 µM for SKOV-3 and Ovcar-3 and at 10 µM for Igrov-1 (Fig. 6A and B). Transfection of all three
cell lines with hTERT siRNA was performed to confirm the direct
involvement of hTERT in Ca-125 modulation and to exclude the
possibility of extratelomeric action of the hTERT inhibitors. In
order to make sure that the transfection was successful, hTERT mRNA
expression was assessed in control and transfected cells. The
results (Fig. 7A) demonstrated a
significant decrease (~90%) in hTERT expression level in
transfected cells compared with control cells. As expected, the
mRNA expression pattern obtained by gene silencing was similar to
that obtained after treatment with the inhibitors (Fig. 6C and D). A significant decrease was
observed in the mRNA expression of Ca-125 in the three cell lines,
and in the protein expression of Ca-125 in Ovcar-3 cell line
following hTERT silencing.
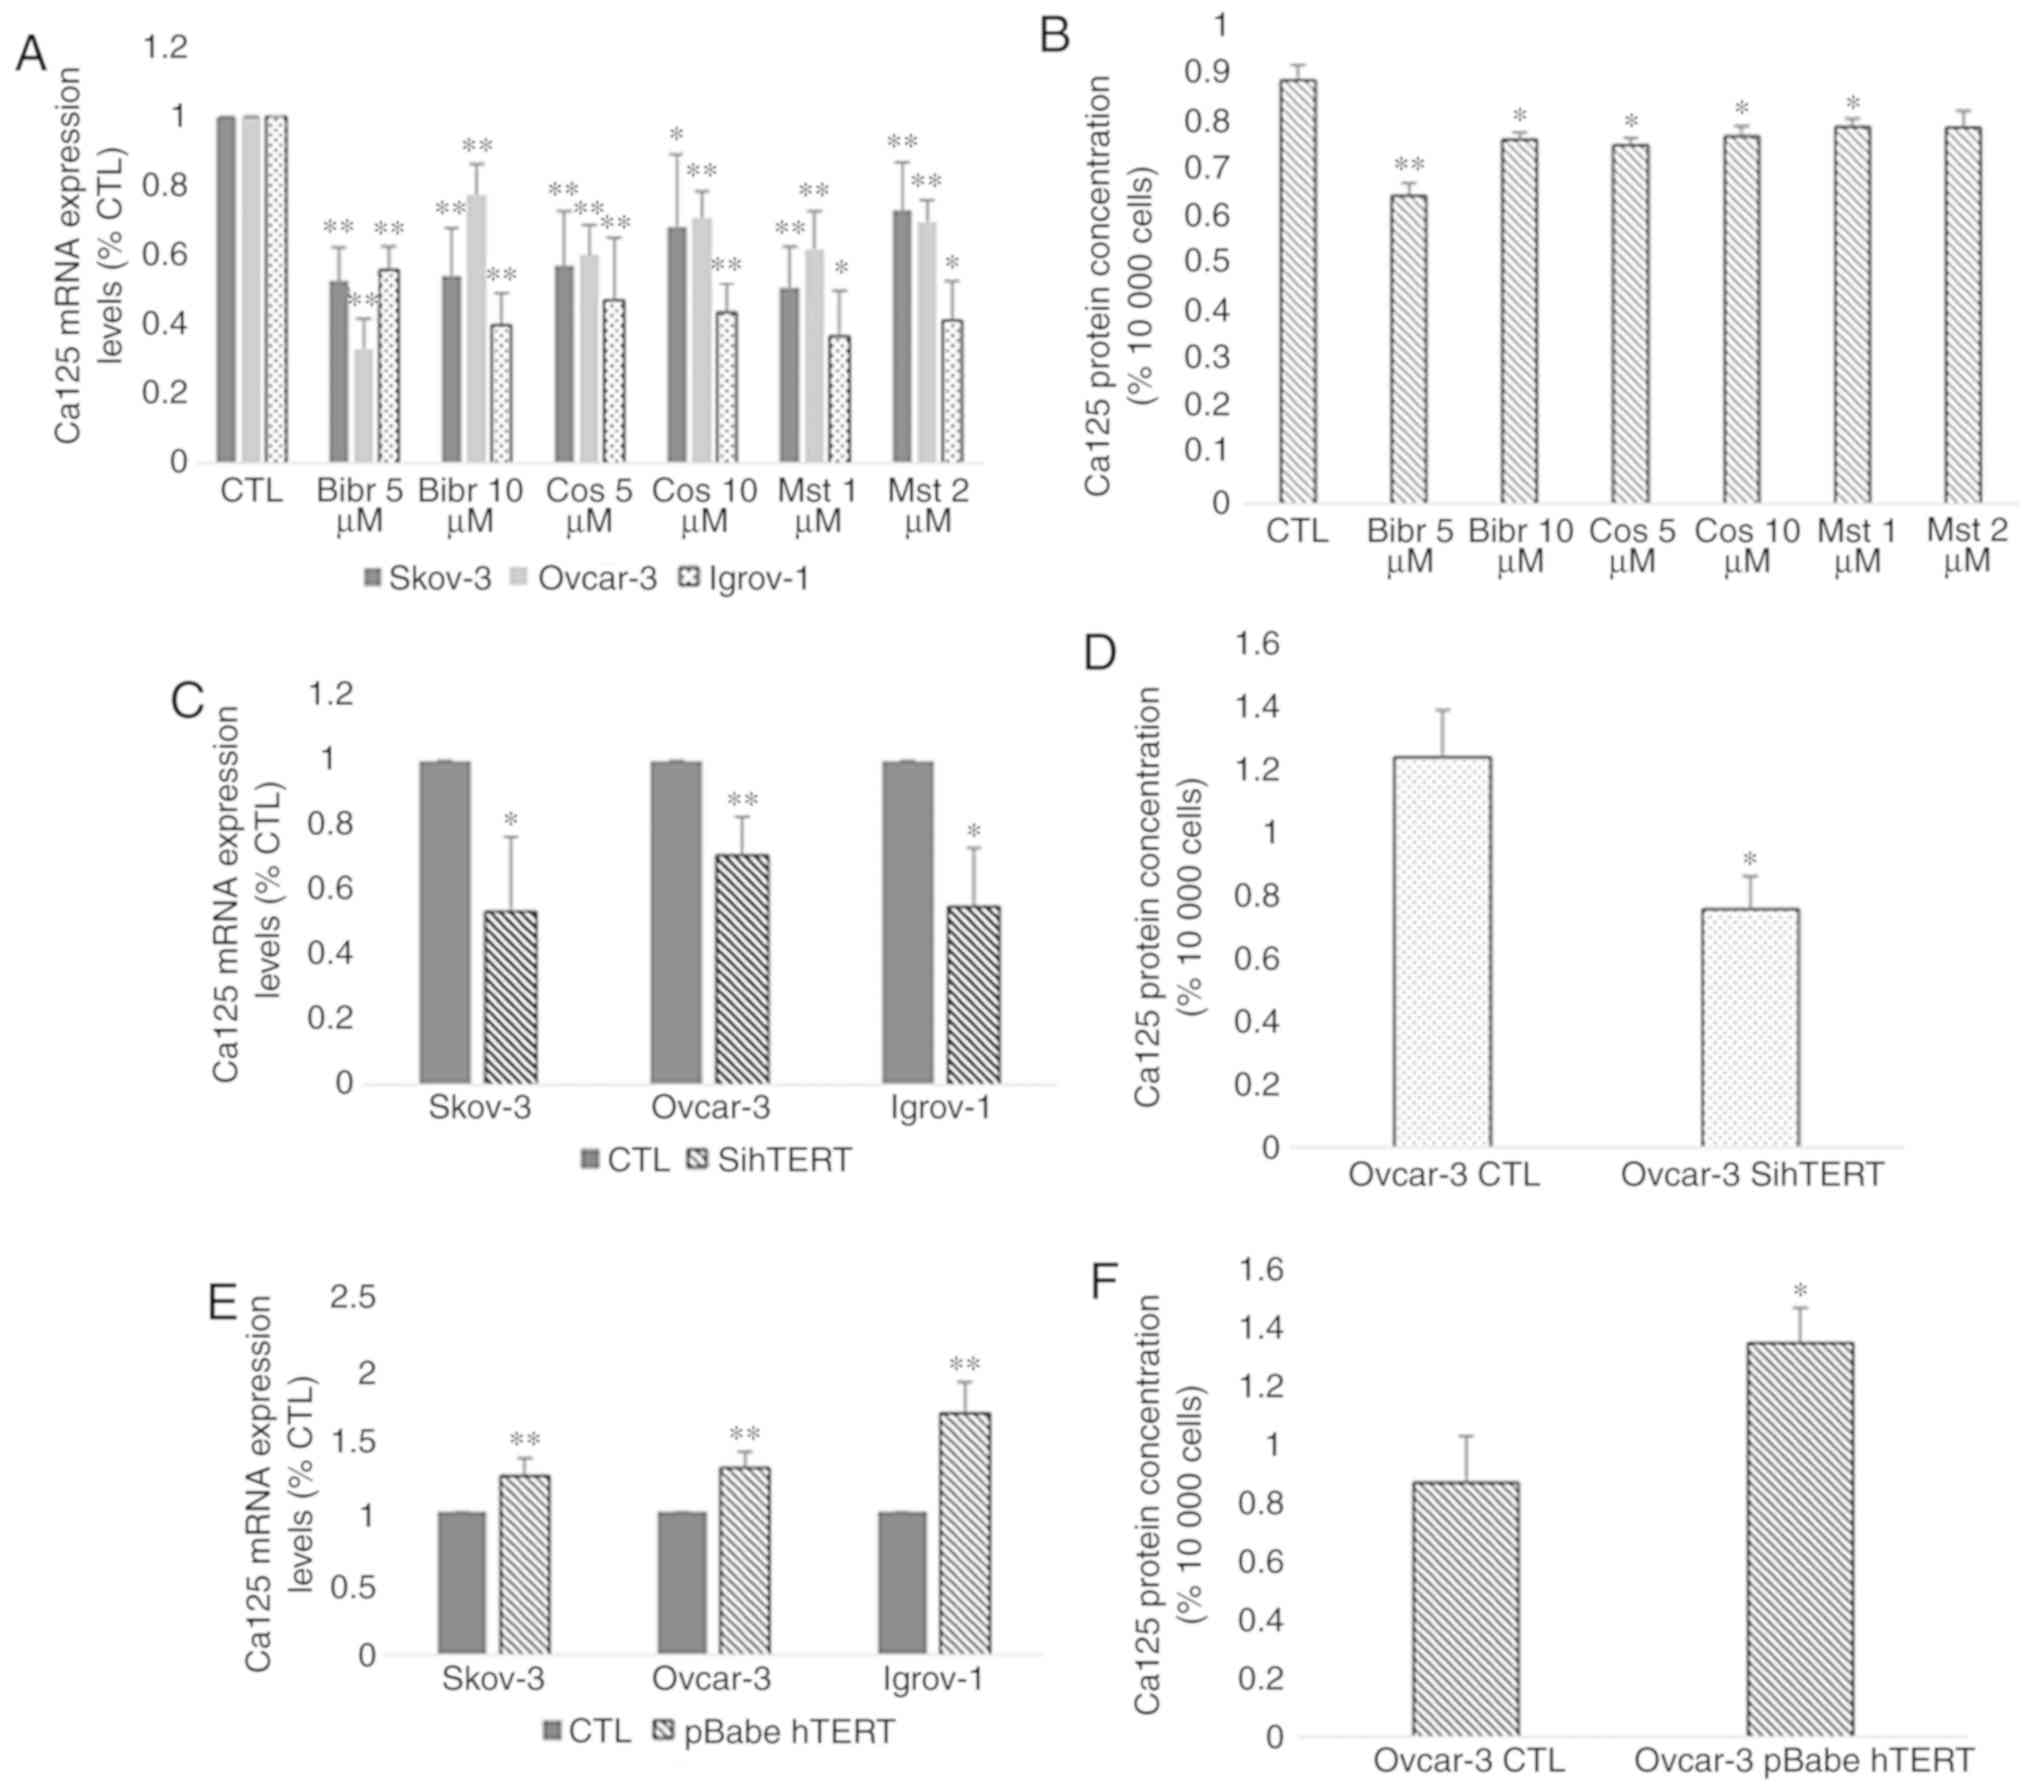 | Figure 6.Effect of hTERT inhibition and
overexpression on Ca-125 mRNA and protein expression. Cells from
the three cell lines were cultured in 6-well plates. At 80%
confluence, these cells were treated with telomerase inhibitors
BIBR1532 (5 and 10 µM), costunolide (5 and 10 µM) and MST-312 (1
and 2 µM). Next, the supernatant was collected, and the cells were
harvested for RNA extraction. Ca-125 mRNA expression was assayed by
reverse transcription-quantitative polymerase chain reaction and
protein secretion levels by ELISA. (A and B) A significant decrease
was observed after treatment with all inhibitors compared with the
control; however, the greatest effect was caused by BIBR1532. In
addition, the cells were transfected with siRNA for hTERT and
pBabe-neo-hTERT to evaluate the effect of both gene silencing and
gene overexpression on Ca-125. (C and D) The effect of sihTERT was
similar to the effect of hTERT inhibitors. (E and F) However,
transfection with pBabe-neo-hTERT caused a significant increase in
both mRNA and protein levels of Ca-125 compared with the control.
The values displayed in this figure refer to values adjusted to
10,000 cells, since cell number usually affects the levels of
secreted proteins. Cell count was performed following cell
harvesting and values were normalized to 10,000 cells. Each
experiment was performed at least three times, and the values
included in these graphs represent the mean from these experiments.
The results are presented as the mean ± SD. *P<0.05 vs. control
group, and **P<0.01 vs. control group. CTL, control; hTERT,
human telomerase reverse transcriptase; sihTERT, siRNA for hTERT;
siRNA, small interfering RNA; Ca-125, cancer antigen 125. |
Effect of hTERT overexpression on
Ca-125 expression and secretion
After investigating the effect of hTERT inhibition,
the SKOV-3, Ovcar-3 and Igrov-1 cells were transfected with
pBabe-neo-hTERT to evaluate the effect of telomerase overexpression
on Ca-125 expression and secretion. In order to make sure that the
transfection was successful, hTERT mRNA expression was assessed in
control and transfected cells. The results (Fig. 7B) demonstrated a significant 25–30
fold increase in hTERT expression level in transfected cells
compared with control cells. The results indicated a significant
increase affecting both the mRNA and protein levels of Ca-125 after
48 h of transfection. Notably, an increase of ~30% in the SKOV-3
and Ovcar-3 cells, and an increase of 50% in Igrov-1 cells was
observed with regards to Ca-125 mRNA expression, compared with the
control (Fig. 6E and F).
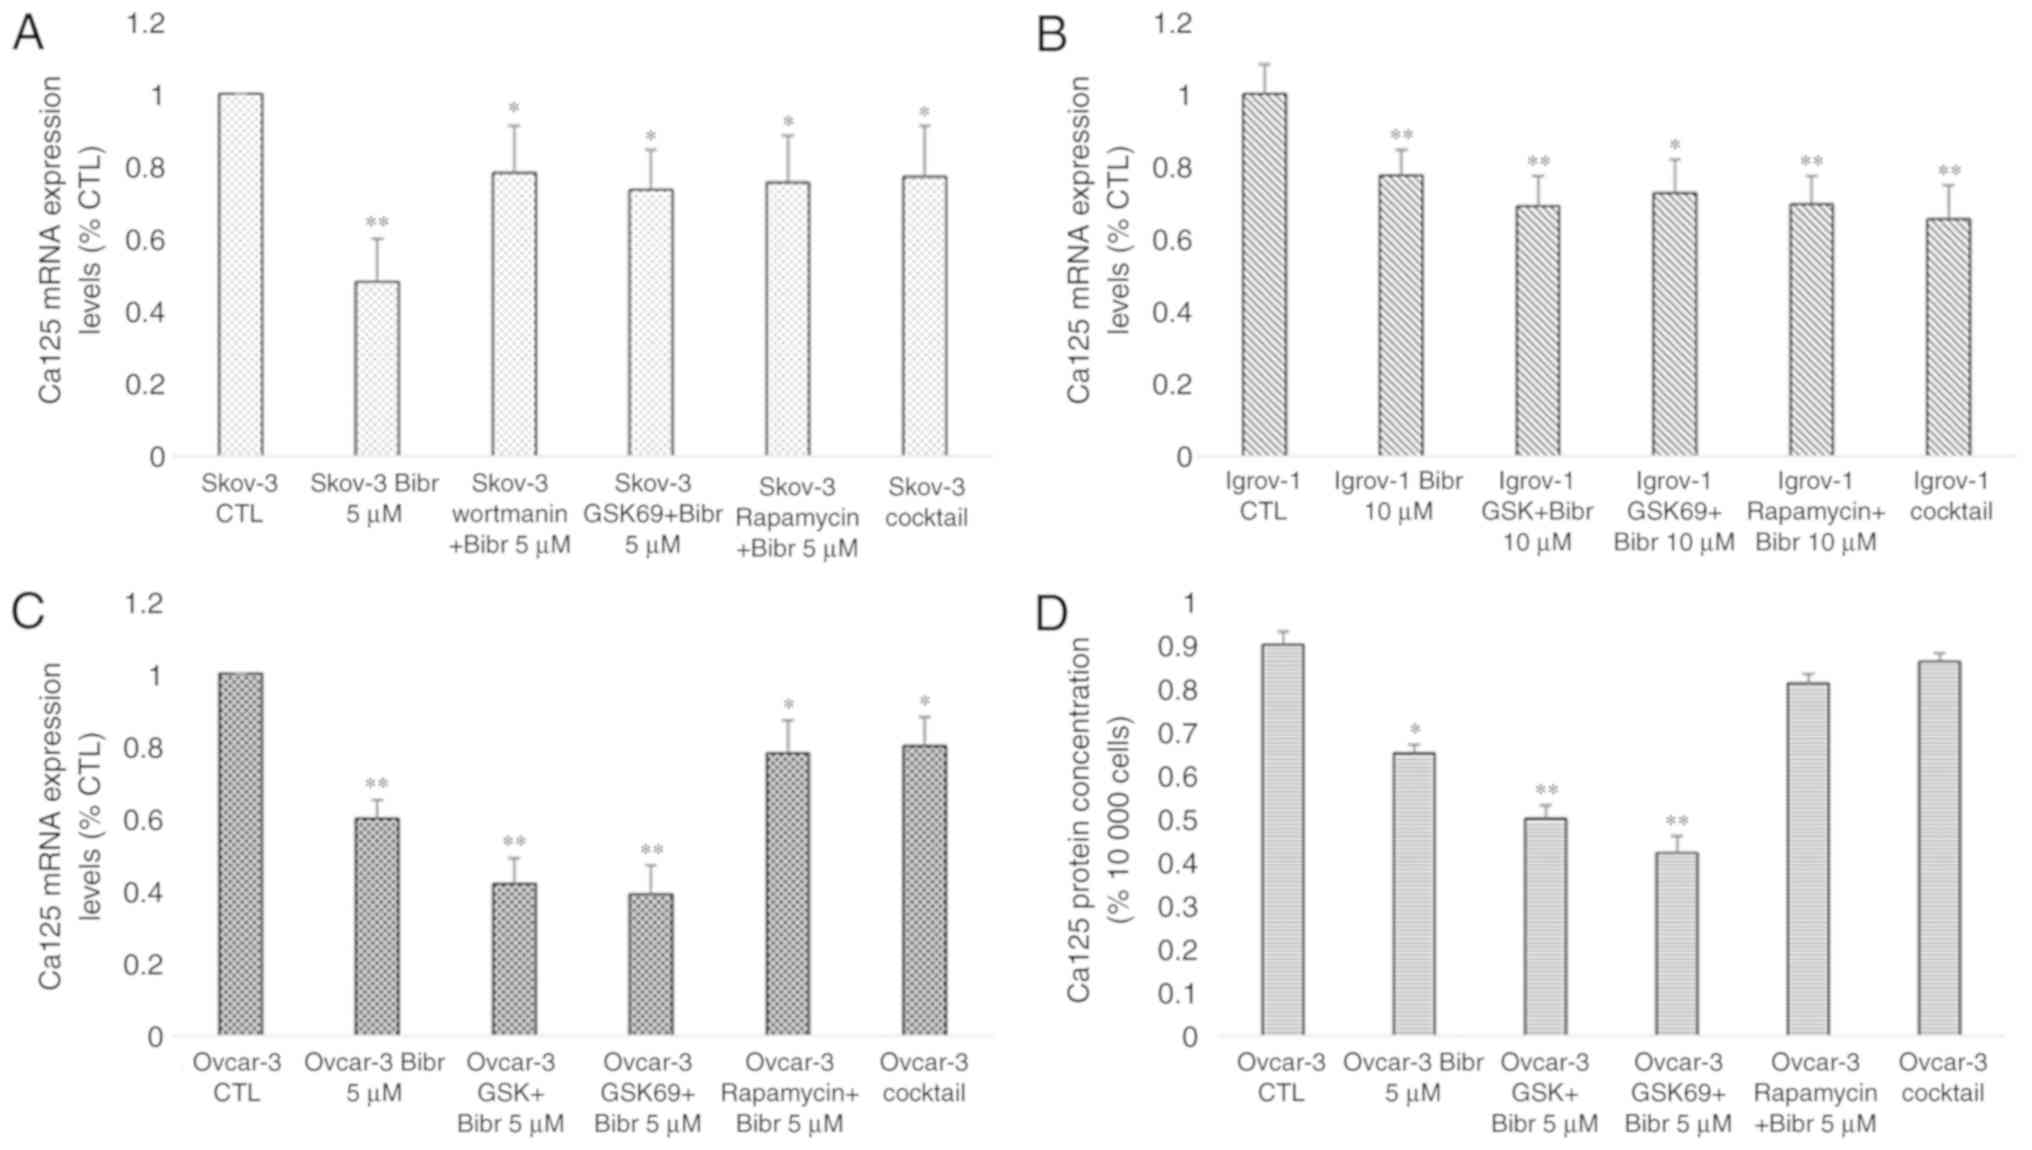
Effect of PI3K/Akt/mTOR signaling
pathway inhibition on Ca-125 expression and secretion
As aforementioned, previous studies have
investigated the potential link between Ca-125 and the protein
mTOR. Since this protein is implicated in the PI3K/Akt/mTOR
signaling pathway and a mutual modulation links hTERT to this
pathway (40), the regulation of
Ca-125 expression and secretion by PI3K/Akt/mTOR was examined. The
SKOV-3, Ovcar-3 and Igrov-1 cells were treated with various
inhibitors specific to proteins in this pathway for 48 h. The
decrease in Ca-125 mRNA expression reached 60% after treatment with
PI3K and Akt inhibitors (PI828, GSK 2126458 and Wortmanin for PI3K,
and GSK 69029 for Akt) in the Igrov-1 cells and 40% with the mTOR
inhibitor rapamycin (Fig. 8A). mRNA
expression and protein secretion in the treated Ovcar-3 cells
exhibited similar results (Fig. 8A and
B, respectively). Thus, the PI3K/Akt/mTOR signaling pathway was
indicated as a potential regulator of Ca-125 in OC cells.
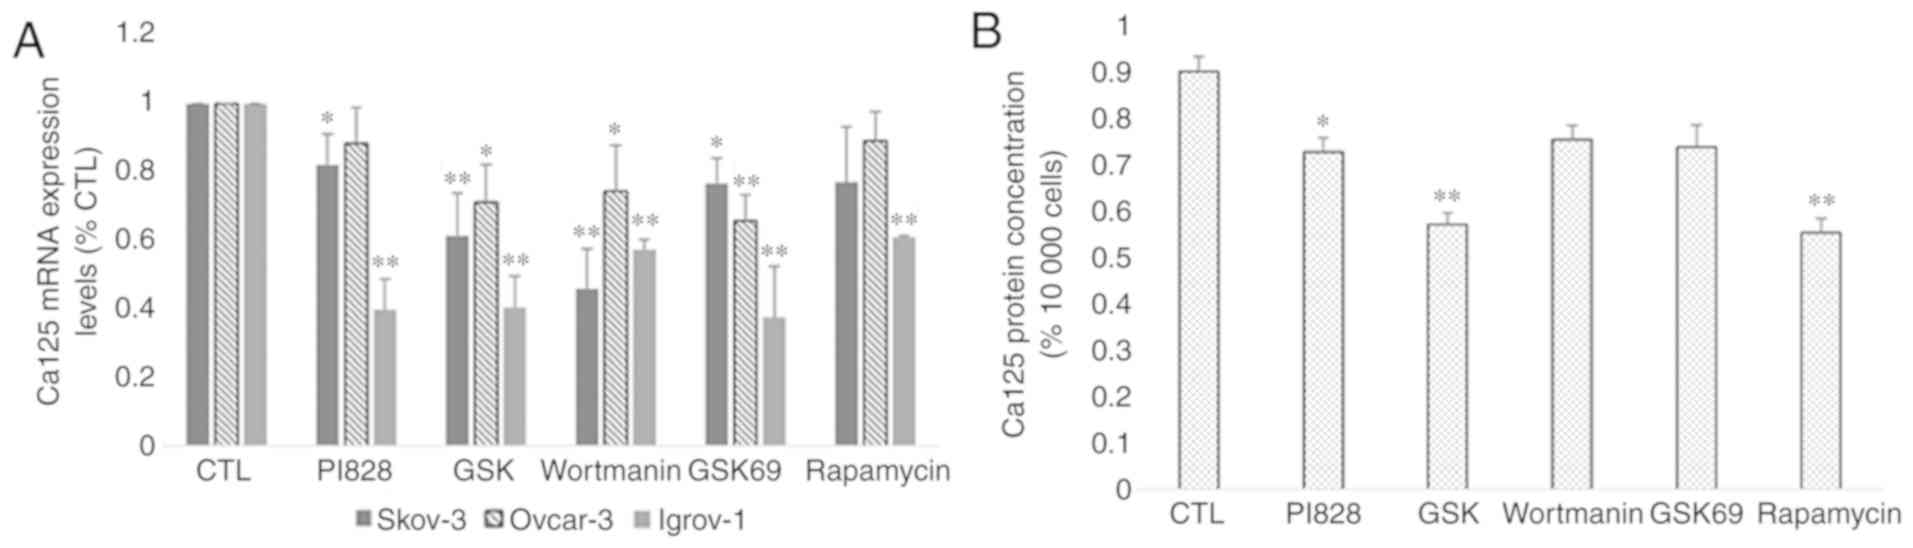 | Figure 8.Effect of PI3K/Akt/mTOR inhibitors on
Ca-125 mRNA and protein expression. SKOV-3, Ovcar-3 and Igrov-1
cells were seeded in 6-well plates. At 80% confluence, these cells
were treated with inhibitors of PI3K (PI828, wortmanin and GSK; 10
µM), Akt (GSK690693; 100 nM) and mTOR (rapamycin; 200 nM) for 48 h.
Next, the supernatant was collected for quantification of secreted
Ca-125 by ELISA, and the cells were harvested for RNA extraction,
followed by reverse transcription-quantitative polymerase chain
reaction for quantifying Ca-125 mRNA expression. (A) A significant
decrease was observed in the majority of cells treated with the
inhibitors; however, Igrov-1 exhibited the lowest values. (B) This
decrease was also observed in protein secretion in the treated
Ovcar-3 cells. Ca-125 level in the supernatants of SKOV-3 and
Igrov-1 cell lines were undetectable using ELISA. The values
displayed in this figure refer to values adjusted to 10,000 cells,
since cell number usually affects the levels of secreted proteins.
Cell count was performed following cell harvesting and values were
normalized to 10,000 cells. Each experiment was performed at least
3 times, and the values listed in these graphs represent the mean
from these experiments. The results are presented as the mean ± SD.
*P<0.05 vs. control group, and **P<0.01 vs. control group.
Ca-125, cancer antigen 125. |
Effect of the combination of
telomerase and PI3K/Akt/mTOR inhibitors on Ca-125
hTERT and the PI3K/Akt/mTOR pathway are both
regulators of Ca-125 in OC cells. Taking into account that
telomerase is an activator of this signaling pathway, the possible
regulation of Ca-125 by hTERT via PI3K/Akt/mTOR was investigated.
The PTES cells were treated with telomerase inhibitors (BIBR-1532,
Costunolide and MST-312) combined with PI3K, Akt and mTOR
inhibitors for 48 h. However, this combination did not potentiate
the effects observed on Ca-125 mRNA and protein levels in all three
cell lines (Fig. 9).
Discussion
Resistance to chemotherapy is a major limitation in
the treatment of various types of cancer, including OC. Several
mechanisms are responsible for the onset and development of
chemoresistance, including the activation of DNA repair mechanisms
(41), the development of sequential
genetic alterations inducing transient environment-mediated drug
resistance (42) and the presence of
cancer-initiating cells embedded within the tumor (43). To overcome chemoresistance, a
previous study focused on the development of new strategies and
treatment combinations, including the establishment of second-line
chemotherapy or coupling standard treatment regimens with
immunotherapy (44). Another
recently explored strategy is based on the targeting of cancer cell
metabolism to improve its response to therapeutics. A previous
study demonstrated the effect of targeting certain glycolytic
enzymes to overcome resistance to trastuzumab in breast cancer
cells (45). Furthermore, a previous
study on breast cancer highlighted the potential use of lactate
dehydrogenase A as a target to reverse resistance to PTX (46). Thus, glucose availability and
metabolism in cancer serve important roles in the sensitivity of
cells to chemotherapeutic drugs. Based on these facts, the effect
of chemotherapy combined with glucose restriction on the
development of chemoresistance was evaluated in the present study.
Moreover, the outcome of this combinatorial treatment on the
immortality of cancer cells was investigated by studying telomerase
expression and activity, and the ability of these cells to secrete
the serum marker Ca-125. The PTES cells were initially treated with
the chemotherapeutic agents CDDP and PTX for 48 h in 3 different
glucose concentrations. The three concentrations were chosen so as
to mimic the physiology of a patient following high, low and
fasting glucose diets. Following this short-term treatment,
expression of both hTERT and Ca-125 increased significantly. A
similar effect on hTERT expression was observed in a previous study
after treatment of hepatocellular carcinoma cells with low doses of
cisplatin for 24 h. It was reported that increased expression of
the transcription factor c-MYC resulted in hTERT upregulation
(47). In addition, higher Ca-125
levels after short-term treatment may be explained by the
implication of this protein in the modulation of the response of OC
cells to genotoxic drugs, including cisplatin (48). However, no significant difference was
detected among the cells treated with various glucose
concentrations. This may be explained by the short period of
exposure to glucose restriction and cell adaptation that requires
additional time for metabolic flux changes.
After the long-term treatment of cells with specific
concentrations of CDDP and PTX, the expression levels of IL-6,
IL-8, BMP2 and ERCC1, which are implicated in the initiation and
development of resistance to chemotherapy, were evaluated. The
increased expression of all these proteins observed in the PTES
cells compared with the control explains the ability of these cells
to survive 6 weeks of treatment. These proteins are associated with
various mechanisms implicated in chemoresistance. For instance,
ERCC1 is involved in the nucleotide excision repair mechanism.
Interleukin expression corresponds to the environment-mediated drug
resistance developed by the PTES cells (49). However, no significant difference was
observed in the expression of these markers among the PTES cells
treated with various glucose concentrations. Thus, decreasing
glucose availability during treatment may not directly affect the
ability of cancer cells to develop chemoresistance.
Following several cellular divisions, the telomeric
ends of the chromosomes reach a critical length, leading to the
activation of apoptosis. However, telomerase serves a key role in
the elongation of these telomeres in cancer cells. To assess the
effect of the combinatorial treatment on the immortalization of the
PTES cells, the mRNA expression of the catalytic subunit hTERT was
examined in the present study. Previous studies revealed that
telomerase expression was increased in osteosarcoma
cisplatin-resistant cells, thus leading to the suppression of
cisplatin-induced apoptosis (50).
However, hTERT expression was significantly decreased in the PTES
cells in the present study. This decrease was greater in the PTES
cells treated with fasting glucose concentrations. To further
investigate the effect of this reduction, the length of the
telomeres in control and resistant cells was assessed. A decrease
in telomere length was observed; however, the shortening of
telomeres was statistically significant only in the PTES cells
treated with fasting glucose concentrations. The non-significant
results for 4.5 and 1 g/l glucose concentrations may be explained
by the fact that slight decreases affecting telomerase expression
and availability do not necessarily lead to a shortening in
telomeres, since telomerase has the ability to elongate the
chromosomal telomeric ends, even if present in low quantities
(51). Based on these findings, it
may be suggested that the combination of chemotherapy and glucose
restriction could lead to a decrease in both hTERT expression and
telomere length in PTES cells, which in turn may result in a
decrease in cancer cell immortalization.
Ca-125 is a key regulator of the metastasis of OC
cells into the peritoneal cavity due to its strong affinity to
mesothelin. Moreover, the sensitivity of OC cells to cisplatin has
been narrowly linked to the expression of the surface marker
Ca-125. Based on these facts, the changes in the expression of
Ca-125 were investigated in both PTES and control groups. A
decrease was observed in Ca-125 expression, which was lowest after
treatment with fasting glucose concentrations. These findings are
contradictory to those of previous studies stating that increased
expression of the Ca-125 gene leads to a decrease in the
sensitivity of cells to genotoxic drugs, including cisplatin. Other
studies have demonstrated that increased levels of Ca-125 at the
end of the chemotherapeutic treatment are considered as a marker of
poor prognosis and are associated with shorter progression-free and
overall survival rates (52). The
results of the present study revealed that the combination of
chemotherapy with fasting glucose levels during the treatment
resulted in the lowest Ca-125 expression in all three types of PTES
cells. Thus, this combination may contribute to improved survival
rates in patients with OC, coupled with decreased levels of cancer
cell immortalization due to the shortening of telomeres.
Based on the aforementioned results, telomerase and
Ca-125 expression varied similarly after both short- and long-term
treatments. To explain the low levels of Ca-125 observed after 6
weeks of chemotherapy, the possible regulation of Ca-125 gene
expression by hTERT was investigated. In addition to its canonical
function, one of the non-canonical functions of hTERT is its
ability to regulate the expression of several genes in cancer
(53). The decrease observed after
the inhibition of hTERT by inhibitors (BIBR-1532, Costunolide and
MST-312) and the silencing of the gene by hTERT siRNA demonstrated
that hTERT regulates Ca-125 expression in OC. Moreover, the
overexpression of Ca-125 after transfection of the PTES cells with
pBabe-neo-hTERT verified the association between both proteins. A
previous study reported that Ca-125 serum levels were higher in
patients with telomerase-positive OC compared with patients with
telomerase-negative OC (54).
Moreover, a clinical study linking hTERT expression in ovarian
biopsies and serum Ca-125 to the grade and stage of OC revealed a
linear relationship between these two biomarkers (55). Therefore, it may be postulated that
the decrease in hTERT expression in PTES cells may account for the
decline in Ca-125 expression and secretion.
Telomerase regulates the expression of several genes
either directly or via its ability to control various signaling
pathways, including the PI3K/Akt/mTOR pathway. Previous studies
have highlighted the modulation of Ca-125 expression by mTOR via
the transcription factor c-MYC; therefore, the possible implication
of the PI3K/Akt/mTOR pathway in the modulation of Ca-125 by hTERT
was investigated. The results observed after the treatment with
inhibitors of the pathway alone indicate a possible implication of
this pathway in the regulation of Ca-125 expression. However, when
combined with hTERT inhibitors, the treatment did not significantly
potentiate the effect of the signaling pathway inhibitors when used
as a mono-treatment. Thus, other signaling pathways may be involved
in the regulation of Ca-125 by hTERT. A possible pathway may be the
nuclear factor-κB pathway. In fact, mesothelin, a protein modulated
by the activation of this pathway, interacts with Ca-125 to promote
peritoneal metastasis (56).
To the best of our knowledge, the present study was
the first to demonstrate the effect of chemotherapy combined with
glucose restriction on the immortalization and metastasis of OC
cells. When neoadjuvant or adjuvant chemotherapy was administered
under fasting glucose conditions, telomerase expression was found
to significantly decrease, thus contributing to the shortening of
chromosomal telomeric ends, which in turn decreases the
immortalization of cancer cells. Since telomerase serves an
essential role in cisplatin resistance, this decrease may improve
the response to chemotherapy. Moreover, this combined treatment was
demonstrated to decrease Ca-125 expression and secretion, which
could contribute to improved prognosis, since it is able to reduce
the risk of peritoneal metastasis. Furthermore, since the
combination of chemotherapy with hypoglycemic drugs is currently
used in the treatment of various cancer types, including OC, the
present study indicates a potential advantage in using this
treatment regimen in both neoadjuvant and adjuvant forms.
Acknowledgements
Not applicable.
Funding
This study was funded by the Research Council of
Saint Joseph University (grant no. FM 302).
Availability of data and materials
All data generated or analyzed during this study are
included in the published article.
Authors' contributions
SA performed cell culture, cell treatments, RT-qPCR,
ELISA and transfections, participated in the design of the study
and wrote the manuscript. DA participated in the design of the
study and manuscript. RT supervised and participated in the
experimental work (cell culture and treatments), troubleshooting
and data analysis. MDA made substantial contributions to analysis
and interpretation of data. MM participated in the design of the
manuscript. ENA and GH were responsible for the clinical data
interpretation. GC made substantial contributions to interpretation
of clinical data. GH designed the study, provided guidance and
edited the manuscript.
Ethics approval and consent to
participate
The present study was approved by the Ethical
Committee of Saint Joseph University (Beirut, Lebanon).
Patient consent for publication
Not applicable.
Competing interests
The authors declare that they have no competing
interests.
Glossary
Abbreviations
Abbreviations:
|
BMP2
|
bone morphogenetic protein 2
|
|
Ca-125
|
cancer antigen 125
|
|
CDDP
|
cisplatin
|
|
ERCC1
|
excision repair cross-complementation
group 1
|
|
hTERT
|
human telomerase reverse
transcriptase
|
|
IL-6
|
interleukin-6
|
|
IL-8
|
interleukin-8
|
|
MAPK
|
mitogen-activated protein kinase
|
|
mTOR
|
mechanistic target of rapamycin
|
|
NK
|
natural killer
|
|
PI3K
|
phosphatidylinositol-4,5-bisphosphate
3-kinase
|
|
PTES
|
platinum-taxane escape
|
|
PTX
|
paclitaxel
|
|
RT-qPCR
|
reverse transcription-quantitative
polymerase chain reaction
|
|
siRNA
|
small interfering RNA
|
References
|
1
|
National Cancer Institute: Cancer
Statistics, . https://www.cancer.gov/about-cancer/understanding/statisticsMay
18–2017
|
|
2
|
McLemore MR, Miaskowski C, Aouizerat BE,
Chen LM and Dodd MJ: Epidemiologic and genetic factors associated
with ovarian cancer. Cancer Nurs. 32:281–290. 2009. View Article : Google Scholar : PubMed/NCBI
|
|
3
|
Vajpeyi R: WHO Classification of Tumours:
Pathology and Genetics of Tumours of the Breast and Female Genital
Organs. J Clin Pathol. 58:671–672. 2005.PubMed/NCBI
|
|
4
|
Jelovac D and Armstrong DK: Recent
progress in the diagnosis and treatment of ovarian cancer. CA
Cancer J Clin. 61:183–203. 2011. View Article : Google Scholar : PubMed/NCBI
|
|
5
|
Kim A, Ueda Y, Naka T and Enomoto T:
Therapeutic strategies in epithelial ovarian cancer. J Exp Clin
Cancer Res. 31:142012. View Article : Google Scholar : PubMed/NCBI
|
|
6
|
Argento M, Hoffman P and Gauchez AS:
Ovarian cancer detection and treatment: Current situation and
future prospects. Anticancer Res. 28:3135–3138. 2008.PubMed/NCBI
|
|
7
|
Morgado M, Sutton MN, Simmons M, Warren
CR, Lu Z, Constantinou PE, Liu J, Francis LL, Conlan RS, Bast RC Jr
and Carson DD: Tumor necrosis factor-α and interferon-γ stimulate
MUC16 (CA125) expression in breast, endometrial and ovarian cancers
through NFκB. Oncotarget. 7:14871–14884. 2016. View Article : Google Scholar : PubMed/NCBI
|
|
8
|
Norum LF, Erikstein B and Nustad K:
Elevated CA125 in breast cancer--A sign of advanced disease. Tumour
Biol. 22:223–228. 2001. View Article : Google Scholar : PubMed/NCBI
|
|
9
|
Cheng X, Gou HF, Liu JY, Luo DY and Qiu M:
Clinical significance of serum CA125 in diffuse malignant
mesothelioma. SpringerPlus. 5:3682016. View Article : Google Scholar : PubMed/NCBI
|
|
10
|
Namikawa T, Kawanishi Y, Fujisawa K,
Munekage E, Iwabu J, Munekage M, Maeda H, Kitagawa H, Kobayashi M
and Hanazaki K: Serum carbohydrate antigen 125 is a signifcant
prognostic marker in patients with unresectable advanced or
recurrent gastric cancer. Surg Today. 48:388–394. 2018. View Article : Google Scholar : PubMed/NCBI
|
|
11
|
Memar B, Aledavood A, Shahidsales S, Ahadi
M, Farzadnia M, Raziee H, Noori S, Tayebi-Meybodi N, Amouian S and
Mohtashami S: The Prognostic Role of Tumor Marker CA-125 in B-Cell
non-Hodgkin's Lymphoma. Iran J Cancer Prev. 8:42–46.
2015.PubMed/NCBI
|
|
12
|
Baalbergen A, Janssen JW and van der
Weiden RM: CA-125 levels are related to the likelihood of pregnancy
after in vitro fertilization and embryo transfer. Am J Reprod
Immunol. 43:21–24. 2000. View Article : Google Scholar : PubMed/NCBI
|
|
13
|
Bon GG, Kenemans P, Dekker JJ, Hompes PG,
Verstraeten RA, van Kamp GJ and Schoemaker J: Fluctuations in CA
125 and CA 15-3 serum concentrations during spontaneous ovulatory
cycles. Hum Reprod. 14:566–570. 1999. View Article : Google Scholar : PubMed/NCBI
|
|
14
|
Das S and Batra K: Understanding the
unique attributes of MUC16 (CA125): Potential implications in
targeted therapy. Cancer Res. 75:4669–4674. 2015. View Article : Google Scholar : PubMed/NCBI
|
|
15
|
Hoogstad-van Evert JS, Maas RJ, Van der
Meer J, Cany J, Van der Steen S, Jansen JH, Miller JS, Bekkers R,
Hobo W, Massuger L and Dolstra H: Peritoneal NK cells are
responsive to IL-15 and percentages are correlated with outcome in
advanced ovarian cancer patients. Oncotarget. 9:34810–34820.
2018.PubMed/NCBI
|
|
16
|
Su Y, Tatzel K, Wang X, Belt B, Binder P,
Kuroki L, Powell MA, Mutch DG, Hawkins WG and Spitzer D:
Mesothelin's minimal MUC16 binding moiety converts TR3 into a
potent cancer therapeutic via hierarchical binding events at the
plasma membrane. Oncotarget. 7:31534–31549. 2016. View Article : Google Scholar : PubMed/NCBI
|
|
17
|
He X, Wang L, Riedel H, Wang K, Yong Y,
Dinu CZ and Rojanasakul Y: Mesothelin promotes
epithelial-to-mesenchymal transition and tumorigenicity of human
lung cancer and mesothelioma cells. Mol Cancer. 16:632017.
View Article : Google Scholar : PubMed/NCBI
|
|
18
|
Chanvorachote P, Luanpitpong S, Chunhacha
P, Promden W and Sriuranpong V: Expression of CA125 and cisplatin
susceptibility of pleural effusion-derived human lung cancer cells
from a Thai patient. Oncol Lett. 4:252–256. 2012. View Article : Google Scholar : PubMed/NCBI
|
|
19
|
Shukla SK, Gunda V, Abrego J, Haridas D,
Mishra A, Souchek J, Chaika NV, Yu F, Sasson AR, Lazenby AJ, et al:
MUC16-mediated activation of mTOR and c-MYC reprograms pancreatic
cancer metabolism. Oncotarget. 6:19118–19131. 2015. View Article : Google Scholar : PubMed/NCBI
|
|
20
|
Victorelli S and Passos J: Telomeres and
cell senescence - size matters not. EBioMedicine. 21:14–20. 2017.
View Article : Google Scholar : PubMed/NCBI
|
|
21
|
Shay JW and Wright WE: Senescence and
immortalization: Role of telomeres and telomerase. Carcinogenesis.
26:867–874. 2005. View Article : Google Scholar : PubMed/NCBI
|
|
22
|
Meng E, Taylor B, Ray A, Shevde LA and
Rocconi RP: Targeted inhibition of telomerase activity combined
with chemotherapy demonstrates synergy in eliminating ovarian
cancer spheroid-forming cells. Gynecol Oncol. 124:598–605. 2012.
View Article : Google Scholar : PubMed/NCBI
|
|
23
|
Greider CW: Regulating telomere length
from the inside out: The replication fork model. Genes Dev.
30:1483–1491. 2016. View Article : Google Scholar : PubMed/NCBI
|
|
24
|
Koh CM, Khattar E, Leow SC, Liu CY, Muller
J, Ang WX, Li Y, Franzoso G, Li S, Guccione E and Tergaonkar V:
Telomerase regulates MYC-driven oncogenesis independent of its
reverse transcriptase activity. J Clin Invest. 125:2109–2122. 2015.
View Article : Google Scholar : PubMed/NCBI
|
|
25
|
Zhu J, Blenis J and Yuan J: Activation of
PI3K/Akt and MAPK pathways regulates Myc-mediated transcription by
phosphorylating and promoting the degradation of Mad1. Proc Natl
Acad Sci U S A. 105:6584–6589. 2008. View Article : Google Scholar : PubMed/NCBI
|
|
26
|
Zhang S, Li Y, Wu Y, Shi K, Bing L and Hao
J: Wnt/β-catenin signaling pathway upregulates c-Myc expression to
promote cell proliferation of p19 teratocarcinoma cells. Anat Rec
(Hoboken). 295:2104–2113. 2012. View Article : Google Scholar : PubMed/NCBI
|
|
27
|
Aunoble B, Sanches R, Didier E and Bignon
Y: Major oncogenes and tumor suppressor genes involved in
epithelial ovarian cancer (Review). Int J Oncol. 16:567–576.
2000.PubMed/NCBI
|
|
28
|
Vander Heiden MG, Cantley LC and Thompson
CB: Understanding the warburg effect: The metabolic requirements of
cell proliferation. Science. 324:1029–1033. 2009. View Article : Google Scholar : PubMed/NCBI
|
|
29
|
Hanahan D and Weinberg RA: Hallmarks of
cancer: The next generation. Cell. 144:646–674. 2011. View Article : Google Scholar : PubMed/NCBI
|
|
30
|
Ma Y, Wang W, Idowu MO, Oh U, Wang XY,
Temkin SM and Fang X: Ovarian cancer relies on glucose transporter
1 to fuel glycolysis and growth: Anti-tumor activity of BAY-876.
Cancers (Basel). 11:E332018. View Article : Google Scholar : PubMed/NCBI
|
|
31
|
Fang S and Fang X: Advances in glucose
metabolism research in colorectal cancer. Biomed Rep. 5:289–295.
2016. View Article : Google Scholar : PubMed/NCBI
|
|
32
|
Schroll MM, LaBonia GJ, Ludwig KR and
Hummon AB: Glucose restriction combined with autophagy inhibition
and chemotherapy in HCT 116 spheroids decreases cell clonogenicity
and viability regulated by tumor suppressor genes. J Proteome Res.
16:3009–3018. 2017. View Article : Google Scholar : PubMed/NCBI
|
|
33
|
Wardi L, Alaaeddine N, Raad I, Sarkis R,
Serhal R, Khalil C and Hilal G: Glucose restriction decreases
telomerase activity and enhances its inhibitor response on breast
cancer cells: Possible extra-telomerase role of BIBR 1532. Cancer
Cell Int. 14:602014. View Article : Google Scholar : PubMed/NCBI
|
|
34
|
Bast RC Jr, Hennessy B and Mills GB: The
biology of ovarian caner: New opportunities for translation. Nat
Rev Cancer. 9:415–428. 2009. View Article : Google Scholar : PubMed/NCBI
|
|
35
|
Gamarra-Luques CD, Hapon MB, Goyeneche AA
and Telleria CM: Resistance to cisplatin and paclitaxel does not
affect the sensitivity of human ovarian cancer cells to
antiprogestin-induced cytotoxicity. J Ovarian Res. 7:452014.
View Article : Google Scholar : PubMed/NCBI
|
|
36
|
Cawthon R: Telomere measurement by
quantitative PCR. Nucleic Acids Res. 30:e472002. View Article : Google Scholar : PubMed/NCBI
|
|
37
|
Livak KJ and Schmittgen TD: Analysis of
relative gene expression data using real-time quantitative PCR and
the 2(-Delta Delta C(T)) method. Methods. 25:402–408. 2001.
View Article : Google Scholar : PubMed/NCBI
|
|
38
|
Rao X, Huang X, Zhou Z and Lin X: An
improvement of the 2(-delta delta CT) method for quantitative
real-time polymerase chain reaction data analysis. Biostat
Bioinforma Biomath. 3:71–85. 2013.PubMed/NCBI
|
|
39
|
Zhou M, Zhao Y, Ding Y, Liu H, Liu Z,
Fodstad O, Riker AI, Kamarajugadda S, Lu J, Owen LB, et al: Warbug
effect in chemosensitivity: Targeting lactate dehydrogenase-A
re-sensitizes taxol-resistant cancer cells to taxol. Mol Cancer.
9:332010. View Article : Google Scholar : PubMed/NCBI
|
|
40
|
Glasgow C, Pacheco-Rodriguez G, Steagall
WK, Haughey ME, Julien-Williams PA, Stylianou MP, Gochuico BR and
Moss J: CA-125 in disease progression and treatment of
lymphangioleiomyomatosis. Chest. 153:339–348. 2018. View Article : Google Scholar : PubMed/NCBI
|
|
41
|
Liang C, Qin Y, Zhang B, Ji S, Shi S, Xu
W, Liu J, Xiang J, Liang D, Hu Q, et al: Oncogenic KRAS targets
MUC16/CA125 in pancreatic ductal adenocarcinoma. Mol Cancer Res.
15:201–212. 2017. View Article : Google Scholar : PubMed/NCBI
|
|
42
|
Muallem MZ, Braicu I, Nassir M, Richter R,
Sehouli J and Arsenic R: ERCC1 expression as a predictor of
resistance to platinum-based chemotherapy in primary ovarian
cancer. Anticancer Res. 34:393–399. 2014.PubMed/NCBI
|
|
43
|
Meads MB, Gatenby RA and Dalton WS:
Environment-mediated drug resistance: A major contributor to
minimal residual disease. Nat Rev Cancer. 9:665–674. 2009.
View Article : Google Scholar : PubMed/NCBI
|
|
44
|
Bapat SA, Mali AM, Koppikar CB and Kurrey
NK: Stem and progenitor-like cells contribute to the aggressive
behavior of human epithelial ovarian cancer. Cancer Res.
65:3025–3059. 2005. View Article : Google Scholar : PubMed/NCBI
|
|
45
|
Kigawa J: New strategy for overcoming
resistance to chemotherapy of ovarian cancer. Yonago Acta Med.
56:43–50. 2013.PubMed/NCBI
|
|
46
|
Zhao Y, Liu H, Liu Z, Ding Y, LeDoux SP,
Wilson GL, Voellmy R, Lin Y, Lin W, Nahta R, et al: Overcoming
trastuzumab resistance in breast cancer by targeting dysregulated
glucose metabolism. Cancer Res. 71:4585–4597. 2011. View Article : Google Scholar : PubMed/NCBI
|
|
47
|
Guo XL, Ma NN, Zhou FG, Zhang L, Bu XX,
Sun K, Song JR, Li R, Zhang BH, Wu MC and Wei LX: Up-regulation of
hTERT expression by low-dose cisplatin contributes to chemotherapy
resistance in human hepatocellular cancer cells. Oncol Rep.
22:549–556. 2009.PubMed/NCBI
|
|
48
|
Boivin M, Lane D, Piché A and Rancourt C:
CA125 (MUC16) tumor antigen selectively modulates the sensitivity
of ovarian cancer cells to genotoxic drug-induced apoptosis.
Gynecol Oncol. 115:407–413. 2009. View Article : Google Scholar : PubMed/NCBI
|
|
49
|
Bonneau C, Rouzier R, Geyl C, Cortez A,
Castela M, Lis R, Daraï E and Touboul C: Predictive markers of
chemoresistance in advanced stages epithelial ovarian carcinoma.
Gynecol Oncol. 136:112–120. 2015. View Article : Google Scholar : PubMed/NCBI
|
|
50
|
Zhang Z, Yu L, Dai G, Xia K, Liu G, Song
Q, Tao C, Gao T and Guo W: Telomerase reverse transcriptase
promotes chemoresistance by suppressing cisplatin-dependent
apoptosis in osteosarcoma cells. Sci Rep. 7:70702017. View Article : Google Scholar : PubMed/NCBI
|
|
51
|
Sotillo-Piñeiro E, Sierrasesúmaga L and
Patiño-García A: Telomerase activity and telomere length in primary
and metastatic tumors from pediatric bone cancer patients. Pediatr
Res. 55:231–235. 2004. View Article : Google Scholar : PubMed/NCBI
|
|
52
|
Tian C, Markman M, Zaino R, Ozols RF,
McGuire WP, Muggia FM, Rose PG, Spriggs D and Armstrong DK: CA-125
change following chemotherapy in prediction of treatment outcome
among advanced mucinous and clear cell epithelial ovarian cancers:
A gynecologic oncology group study. Cancer. 115:1395–1403. 2009.
View Article : Google Scholar : PubMed/NCBI
|
|
53
|
Li Y and Tergaonkar V: Noncanonical
functions of telomerase: Implications in telomerase-targeted cancer
therapies. Cancer Res. 74:1639–1644. 2014. View Article : Google Scholar : PubMed/NCBI
|
|
54
|
Sapi E, Okpokwasili NI and Rutherford T:
Detection of telomerase-positive circulating epithelial cells in
ovarian cancer patients. Cancer Detect Prev. 26:158–167. 2002.
View Article : Google Scholar : PubMed/NCBI
|
|
55
|
Maraei AA, Hatta AZ, Shiran MS and Tan GC:
Human telomerase reverse transcriptase expression in ovarian
tumors. Indian J Pathol Microbiol. 55:187–191. 2012. View Article : Google Scholar : PubMed/NCBI
|
|
56
|
Bharadwaj U, Marin-Muller C, Li M, Chen C
and Yao Q: Mesothelin confers pancreatic cancer cell resistance to
TNF-α-induced apoptosis through Akt/PI3K/NF-κB activation and
IL-6/Mcl-1 overexpression. Mol Cancer. 10:1062011. View Article : Google Scholar : PubMed/NCBI
|