Introduction
Despite improvements in diagnostic techniques, the
incidence rate of lymphoma has been increased by 75% in the past 20
years (1). Less than half of the
patients who are diagnosed with diffuse large B-cell lymphoma
(DLBCL) achieve complete remission (2). Patients with DLBCL exhibit various
clinical outcomes due to tumors possessing different histology,
morphology and clinical features (3).
Treatment for patients with DLBCL includes combinations of
radiation therapy, chemotherapy and targeted therapy. The long-term
remission rate of the disease has improved with the introduction of
rituximab; however, this treatment has poor efficacy in certain
patients (4). Therefore, there is an
increasing requirement to further understand the molecular
mechanisms underlying the disease. This would assist with survival
prediction and enable the design of improved targeted therapeutic
strategies.
DLBCL is one of the most studied diseases for
prognostic markers. Since its publication, the International
Prognostic Index (IPI) has been used to predict the prognosis of
patients with DLBCL. Immunohistochemistry has been used to classify
DLBCL into germinal center B-like (GCB) and non-GCB subgroups, with
various positive staining combinations of cluster of
differentiation 10, mutated melanoma-associated antigen 1, B-cell
lymphoma 6 and CD138 (5). Numerous
studies have confirmed that GCB subgroups improve prognosis
estimations of DLBCL (6–8). According to the 2016 World Health
Organization Classification of Tumors of Haematopoietic and
Lymphoid Tissue, Epstein-Barr virus-positive DLBCL is frequently
diagnosed in immunocompromised patients and demonstrates a poor
response to treatment (9).
Previously, a number of studies investigated MYC. Multivariate
analysis illustrated that extra copies of MYC and MYC rearrangement
in DLBCL are independent poor prognostic factors (10). Numerous studies confirmed that the
development and progression of DLBCL is associated with multiple
signaling pathways, including the Wnt, nuclear factor-κB (NF-κB),
mammalian target of rapamycin (mTOR) and B-cell receptor (BCR)
signaling pathways (11,12).
B-cell translocation gene 1 (BTG1) is a member of
the BTG/transducer of Erb (TOB) family. This family consists of six
members, BTG1, BTG2/PC3/TIS21, BTG3, BTG4/PC3B, TOB1 and TOB2,
which regulate cell cycle progression and differentiation, and
inhibit proliferation (13). The
BTG/TOB family consists of two characteristic and conserved
domains, Box A and Box B (14).
Additionally, BTG/TOB proteins are nuclear proteins that are
transported into the nucleus by nuclear localization signaling
(15). Human BTG1 is located on
chromosome 12q22 and consists of 4,704 nucleotides that encode 171
amino acids and a 19 kDa protein (16). BTG1 promotes apoptosis, stimulates
cellular differentiation, maintains cell cycle progression and
inhibits proliferation, and therefore functions as a tumor
suppressor gene (17). A previous
study identified that BTG1 expression is increased in the G0/G1
phase and decreased in the G1 phase of the cell cycle (18). Therefore, BTG1 is considered to be a
potential suppressor gene due to its effects on cell cycle
progression and proliferation (19).
BTG1 interacts with arginine N-methyltransferase 1 in vitro,
which regulates transcription and affects cytokine signaling
pathways (20). BTG1 enhances the
inhibitory function of homeobox B9-mediated transcription (21). Additionally, overexpression of BTG1
enhances apoptosis of NIH/3T3 cells (22). A recent study revealed that BTG1
serves as a tumor suppressor in B-cell precursor acute
lymphoblastic leukemia (23).
Similarly, another study demonstrated that BTG1 acts as a regulator
of B-cell differentiation, which supports a role of BTG1 as a tumor
suppressor in B-cell malignancies (24). However, a limited number of studies
have performed global network analysis for BTG1, which limits the
investigation of BTG1's role in DLBCL.
The present study investigated the association
between BTG1 expression and clinicopathological parameters in
patients with DLBCL. Subsequently, the prognostic value and
functional mechanism of BTG1 in DLBCL were further analyzed by
utilizing certain bioinformatics methods. Additionally, Oncomine
analysis was performed, which revealed that BTG1 was downregulated
in DLBCL. Furthermore, the Search Tool for the Retrieval of
Interacting Genes/Proteins (STRING) database and Cytoscape analysis
demonstrated that hub genes of BTG1-associated DLBCL interaction
networks were enriched in ‘Ribosome’, ‘Cell cycle’ and ‘B cell
receptor signaling pathway’. In conclusion, BTG1 may serve as an
independent predictor for DLBCL prognosis and as a potential
therapeutic target.
Materials and methods
Patient characteristics from the Gene
Expression Omnibus (GEO) database and statistical analysis
A gene expression profile, GSE31312 (25), was downloaded from the GEO database
(http://www.ncbi.nlm.nih.gov/geo).
GSE31312 is a human DLBCL expression profile that contains BTG1
expression data, which were sequenced using the GPL570 platform
(Affymetrix Human Genome U133 Plus 2.0 Array). GSE31312 contains
498 samples of DLBCL, of which 470 samples have clinical data.
According to GSE31312 data, the median value of BTG1 expression was
calculated and the 470 patients with BTG1 expression ≥4.34 were
placed in the high expression group and patients with BTG1
expression <4.34 were placed in the low expression group. The
association between BTG1 expression level and numerous factors,
including sex, age, Ann Arbor stage (26), Eastern Cooperative Oncology Group
(ECOG) score, subtype, IPI score, B symptoms, bulky disease,
lactate dehydrogenase (LDH) level, treatment response and survival
data, were analyzed by extraction of clinical data from GSE31312.
All analysis was performed using SPSS 19.0 software (IBM Corp.,
Armonk, NY, USA) and GraphPad Prism 5.0 software (GraphPad
Software, Inc., La Jolla, CA, USA). Associations between BTG1
expression and clinical parameters were examined with the
χ2 test. Survival analysis was performed using the
Kaplan-Meier method and differences were analyzed by log-rank test.
Univariate and multivariate Cox proportional hazards regression
analyses were performed to identify independent predictors. The
hazard ratios (HRs) and 95% confidence interval (CIs) of the
prognostic factors were calculated. P<0.05 was considered to
indicate a statistically significant difference.
Microarray data and data
processing
Expression levels of BTG1 in DLBCL were obtained
from the Oncomine database (http://www.oncomine.com/resource/main.html). The
GSE31312 (25), GSE10846 (27) and GSE87371 (28) datasets were downloaded from the GEO
database and the R2 platform (https://hgserver1.amc.nl/cgi-bin/r2/main.cgi) was
applied to identify the BTG1-associated genes. The cut-off point
was defined as: P<0.01 and PresCalls ≥1. Only BTG1-associated
genes identified in all three independent datasets were selected.
Furthermore, GEO2R (http://www.ncbi.nlm.nih.gov/geo/geo2r/) was applied to
reveal differentially-expressed genes (DEGs) in DLBCL, compared
with normal lymphocytes. The following cut-off criteria was
applied: P<0.05 and |log (fold-change) |>1. A Venn diagram
was generated to visualize the overlapping BTG1-associated genes
and DLBCL-associated DEGs. The resulting overlapping genes were
defined as BTG1-associated DLBCL genes.
Gene Ontology (GO) and Kyoto
Encyclopedia of Genes and Genomes (KEGG) pathway analysis
GO and pathway analysis were performed using the
Database for Annotation, Visualization and Integrated Discovery
(http://david.abcc.ncifcrf.gov/), and the
KEGG database (29). P<0.05
indicated a statistically significant enriched GO and pathway term
for the BTG1-associated DLBCL genes.
Establishment of a protein-protein
interaction (PPI) network and cluster selection
The STRING database (http://string-db.org) was used to predict interaction
networks of the protein products of BTG1-associated DLBCL genes. A
confidence score of ≥0.4 was set as the cut-off point. Cytoscape
3.5.1 software (Institute for Systems Biology, Seattle, WA, USA)
was used to construct the PPI networks for BTG1-associated DLBCL
genes. The hub genes were identified using the cytohubba plugin in
Cytoscape software and a degree ≥17 was set as the cut-off
criterion. Molecular Complex Detection (MCODE) v1.5 (30) was subsequently used to reveal clusters
of genes in the PPI network.
Results
Patient characteristics from the
GSE31312 dataset
Patient data downloaded from GEO database are
presented in Table I. The patients
included 199 males and 271 females, and the median age at diagnosis
was 63 years (range, 18–92 years). All patients were assessed
according to the Ann Arbor staging system (26) and patients were divided into a low
stage group (I and II; 220 patients) or high stage group (III and
IV; 250 patients). A total of 374 patients had a low ECOG score
(≤1) and 96 had a high ECOG score (>1). Information regarding
IPI score was available for 424 cases. A total of 274 patients had
a low IPI score (≤2) and 150 had a high IPI score (>3). Only 408
of the 470 cases had B symptom data, 366 cases had bulky disease
data and 426 cases had LDH level data. The 470 cases were divided
into complete response (CR), partial response (PR), progressive
disease (PD) and stable disease (SD) groups, according to their
treatment response.
 | Table I.Association between BTG1 expression
level and clinical characteristics obtained from the GSE31312
dataset. |
Table I.
Association between BTG1 expression
level and clinical characteristics obtained from the GSE31312
dataset.
| Characteristic | Case, n (%) | Low BTG1
expression, n | High BTG1
expression, n | χ2
value | P-value |
|---|
| Sex |
|
|
| 0.218 | 0.709 |
|
Male | 199 (42.3) | 138 | 133 |
|
|
|
Female | 271 (57.7) | 97 | 102 |
|
|
| Age, years |
|
|
| 0.690 | 0.460 |
|
<63 | 229 (48.7) | 110 | 119 |
|
|
|
≥63 | 241 (51.3) | 125 | 116 |
|
|
| Stage |
|
|
| 0.000 | 1.000 |
|
I/II | 220 (46.8) | 110 | 110 |
|
|
|
III/IV | 250 (53.2) | 125 | 125 |
|
|
| ECOG score |
|
|
| 0.209 | 0.732 |
|
Low | 374 (79.6) | 185 | 189 |
|
|
|
High | 96 (20.4) | 50 | 46 |
|
|
| Subtype |
|
|
| 0.034 | 0.926 |
|
Non-GCB | 222 (47.2) | 112 | 110 |
|
|
|
GCB | 248 (52.8) | 123 | 125 |
|
|
| IPI score |
|
|
| 5.320 | 0.025 |
|
Low | 274 (64.6) | 135 | 139 |
|
|
|
High | 150 (35.4) | 79 | 71 |
|
|
| B symptom |
|
|
| 0.513 | 0.526 |
| No | 276 (67.6) | 138 | 138 |
|
|
|
Yes | 132 (32.4) | 61 | 71 |
|
|
| Bulky disease |
|
|
| 0.141 | 0.724 |
| No | 268 (73.2) | 129 | 139 |
|
|
|
Yes | 98 (26.8) | 45 | 53 |
|
|
| LDH level |
|
|
| 0.071 | 0.839 |
|
Normal | 148 (34.7) | 76 | 72 |
|
|
|
High | 278 (65.3) | 139 | 139 |
|
|
| Treatment
response |
|
|
| 19.020 | <0.001 |
| CR | 354 (75.3) | 157 | 197 |
|
|
| PR | 72 (15.3) | 48 | 24 |
|
|
| PD | 24 (5.1) | 15 | 9 |
|
|
| SD | 20 (4.3) | 15 | 5 |
|
|
Associations between BTG1 expression
level and the clinical characteristics of patients with DLBCL
A total of 470 samples in the GSE31312 dataset
contained BTG1 expression data. The associations between BTG1
expression level and clinical features of patients with DLBCL were
investigated (Table I). It was
identified that the BTG1 expression level was significantly
different in treatment response (P<0.001) and IPI score
(P=0.025) groups. However, no significant difference in BTG1
expression level was observed for age, sex, stage, subtype, ECOG
score, B symptom, bulky disease or LDH level (P>0.05).
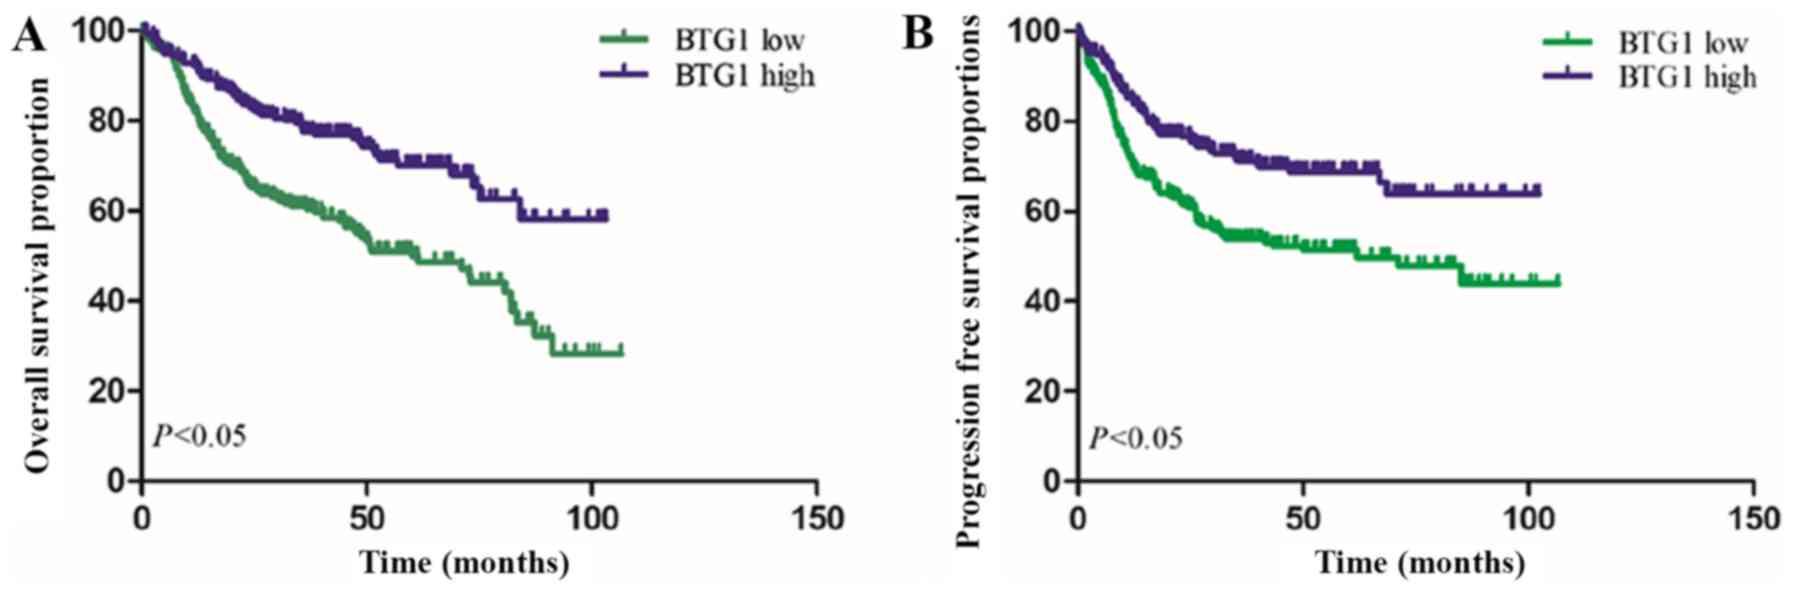
Prognostic performance of BTG1 for
DLBCL
Based on the median expression level of BTG1,
Kaplan-Meier analysis was preformed to estimate overall survival
(OS_ and progression-free survival (PFS) times. As demonstrated in
Fig. 1, Kaplan-Meier survival curves
revealed that patients with low BTG1 expression exhibited a reduced
OS time, compared with patients with high BTG1 expression
(P<0.001). Furthermore, low BTG1 expression was identified to be
associated with a reduced PFS time in patients with DLBCL
(P<0.001).
To assess whether BTG1 is an independent prognostic
factor for DLBCL, univariate and multivariate Cox regression
analysis was performed. The results revealed that age (HR, 1.742;
95% CI, 1.244–2.441; P=0.001), stage (HR, 1.594; 95% CI,
1.103–2.302; P=0.013), ECOG score (HR, 1.978; 95% CI, 1.376–2.844;
P<0.001), subtype (HR, 1.978; 95% CI, 1.376–2.844; P<0.001),
treatment response (HR, 2.612; 95% CI, 2.214–3.081; P<0.001) and
BTG1 expression (HR, 1.692; 95% CI, 1.193–2.401; P=0.003) were
independent prognostic factors for OS time. Subsequently,
multivariate Cox regression analysis was performed to determine the
independence of the prognostic power of BTG1 for PFS time. The
results demonstrated that stage (HR, 1.538; 95% CI, 1.063–2.226;
P=0.022), subtype (HR, 0.563; 95% CI, 0.406–0.782; P=0.001),
treatment response (HR, 2.220; 95% CI, 1.889–2.607; P<0.001) and
BTG1 expression (HR, 1.403; 95% CI, 1.004–1.960; P=0.047) could
predict a reduced PFS time for patients with DLBCL (Table II).
| Table II.Univariate and multivariate Cox
regression analysis for patients with diffuse large B-cell
lymphoma. |
Table II.
Univariate and multivariate Cox
regression analysis for patients with diffuse large B-cell
lymphoma.
| A, Overall
survival |
|---|
|
|---|
|
| Univariate
analysis | Multivariate
analysis |
|---|
|
|
|
|
|---|
| Variable | HR (95% CI) | P-value | HR (95% CI) | P-value |
|---|
| Sex (males vs.
females) | 1.050
(0.775–1.423) | 0.752 |
|
|
| Age (≥63 vs.
<63), years | 1.697
(1.246–2.312) | 0.752 | 1.742
(1.244–2.441) | 0.001 |
| Stage (low vs.
high) | 2.307
(1.668–3.189) | <0.001 | 1.594
(1.103–2.302) | 0.013 |
| ECOG score (low vs.
high) | 2.021
(1.450–2.818) | <0.001 | 1.978
(1.376–2.844) | <0.001 |
| Subtype (non-GCB
vs. GCB) | 0.668
(0.494–0.904) | 0.009 | 1.978
(1.376–2.844) | <0.001 |
| IPI score (low vs.
high) | 1.411
(1.026–1.940) | 0.034 |
|
|
| B symptom (no vs.
yes) | 1.105
(1.787–1.551) | 0.565 |
|
|
| LDH (normal vs.
high) | 1.120
(0.803–1.563) | 0.503 |
|
|
| Bulky disease (no
vs. yes) | 1.051
(0.732–1.509) | 0.787 |
|
|
| Treatment response
(CR+PR vs. PD+SD) | 2.605
(2.828–2.990) | <0.001 | 2.612
(2.214–3.081) | <0.001 |
| BTG1 expression
(low vs. high) | 2.066
(1.508–2.829) | <0.001 | 1.692
(1.193–2.401) | 0.003 |
|
| B, Progression
free survival |
|
|
| Univariate
analysis | Multivariate
analysis |
|
|
|
|
|
Variable | HR (95%
CI) | P-value | HR (95%
CI) | P-value |
|
| Sex (males vs.
females) | 0.864
(0.639–1.169) | 0.343 |
|
|
| Age (≥63 vs.
<63), years | 1.156
(0.855–1.563) | 0.346 |
|
|
| Stage (low vs.
high) | 2.469
(1.781–3.422) | <0.001 | 1.538
(1.063–2.226) | 0.022 |
| ECOG score (low vs.
high) | 1.678
(1.191–2.366) | 0.003 | 1.187
(0.815–1.729) | 0.371 |
| Subtype (non-GCB
vs. GCB) | 0.624
(0.461–0.846) | 0.002 | 0.563
(0.406–0.782) | 0.001 |
| IPI score (low vs.
high) | 1.545
(1.124–2.124) | 0.007 |
|
|
| B symptom (no vs.
yes) | 1.261
(0.902–1.763) | 0.125 |
|
|
| LDH (normal vs.
high) | 1.078
(0.774–1.501) | 0.659 |
|
|
| Bulky disease (no
vs. yes) | 1.175
(0.820–1.682) | 0.379 |
|
|
| Treatment response
(CR+PR vs. PD+SD) | 2.401
(2.095–2.751) | <0.001 | 2.220
(1.889–2.607) | <0.001 |
| BTG1 expression
(low vs. high) | 1.801
(1.324–2.449) | <0.001 | 1.403
(1.004–1.960) | 0.047 |
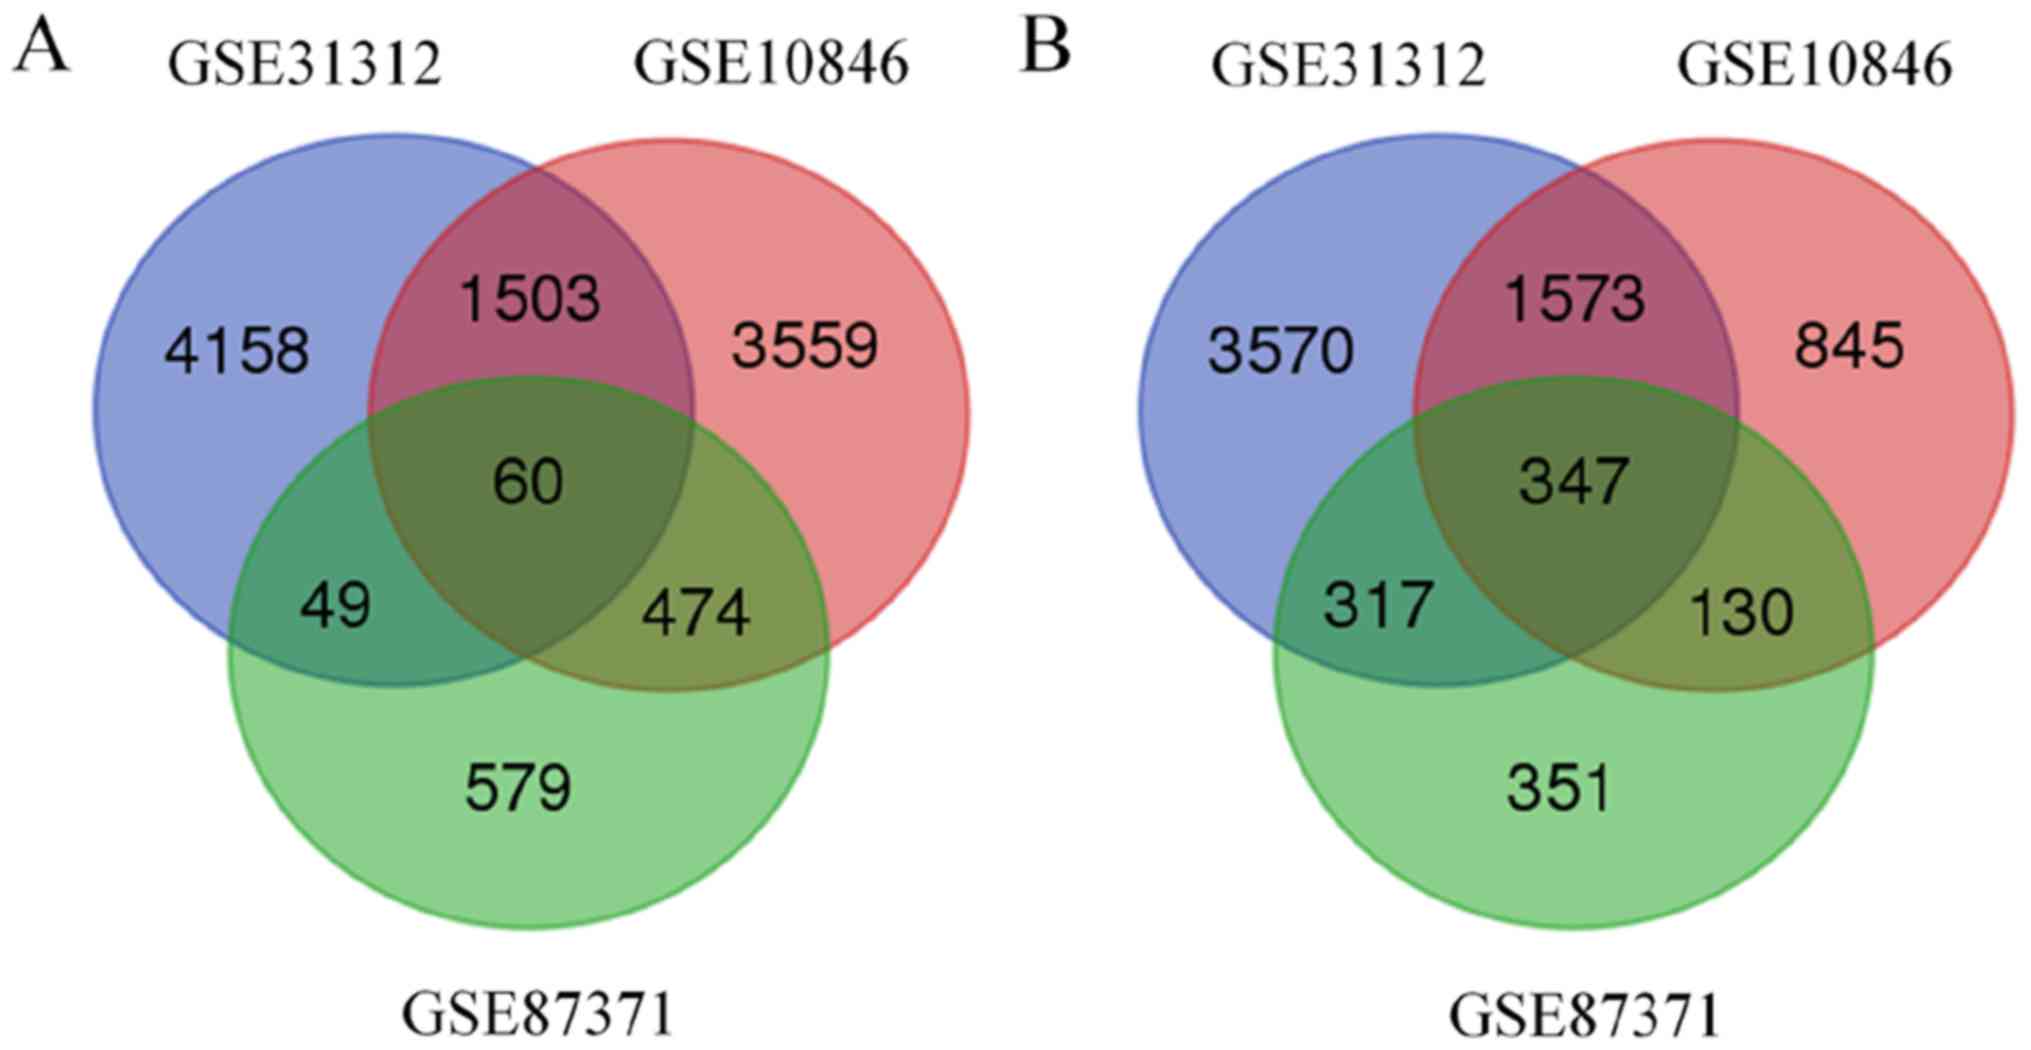
Analysis of BTG1-associated genes
BTG1-associated genes from DLBCL gene expression
profiling datasets were identified using the R2 platform and the
following criteria: P<0.01 and PresCalls ≥1. A total of 11,577,
8,491 and 2,307 genes were identified to be associated with BTG1 in
the GSE1312, GSE10846 and GSE87371 datasets, respectively.
Additionally, 407 BTG1-associated genes were identified in all
three datasets (Fig. 2). Of the 407
BTG1-associated genes, 347 were upregulated and 60 were
downregulated.
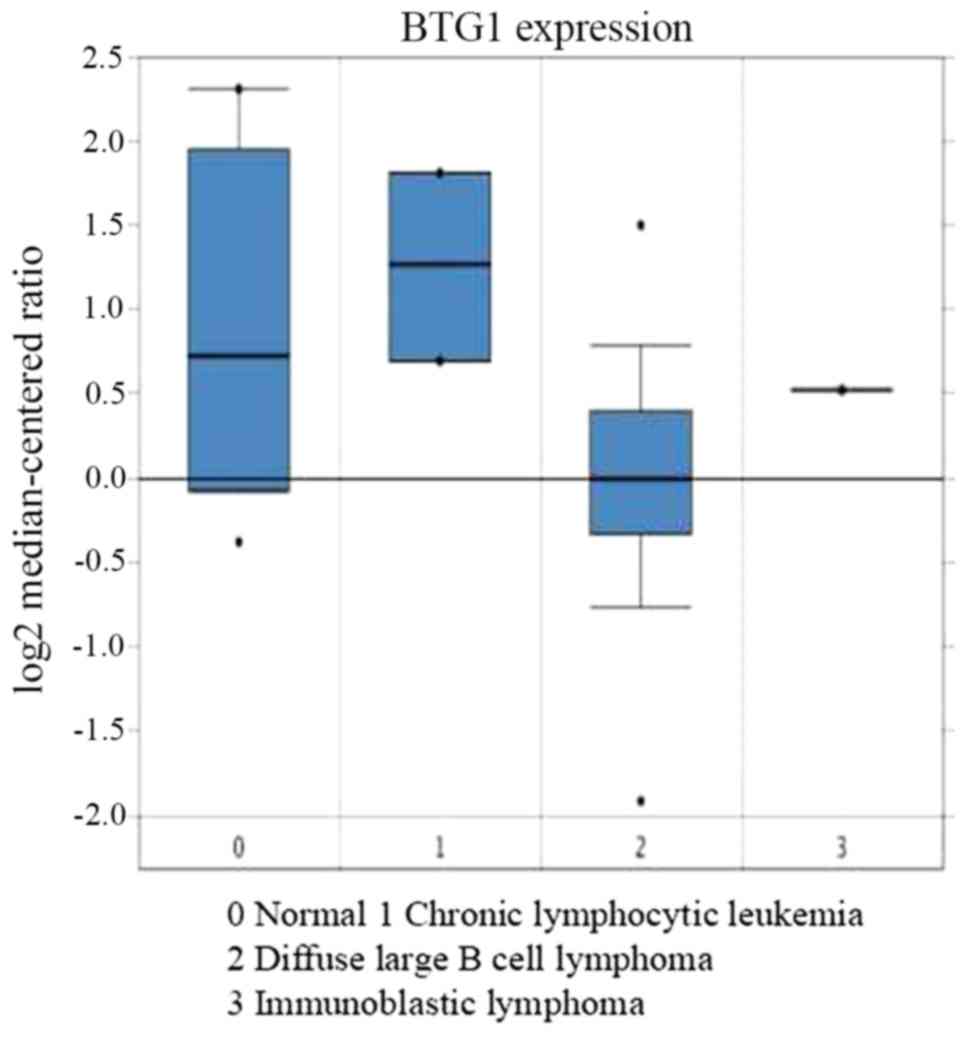
BTG1 serves a role in DLBCL
progression
The association between BTG1 expression and DLBCL
was then analyzed. Using Oncomine analysis, the expression of BTG1
was identified to be downregulated in DLBCL (31) (Fig. 3).
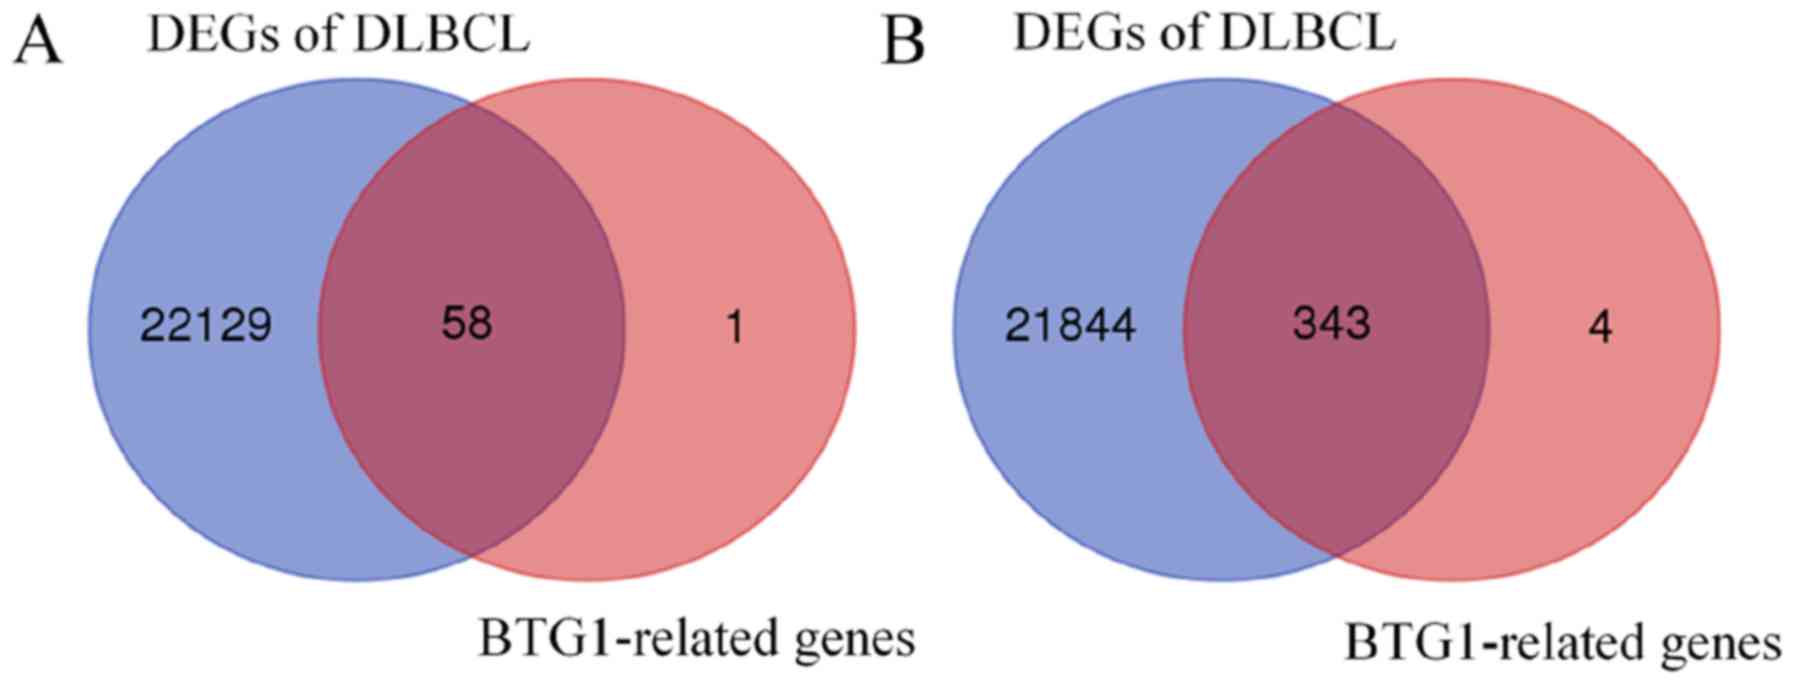
Using the GSE65720 dataset and GEO2R analysis, a total of 22,187
DEGs were identified in DLBCL compared with normal lymphocytes.
Overlapping analysis of the 407 BTG1-associated genes and the
22,187 DEGs revealed that 401 genes were BTG1-associated DLBCL
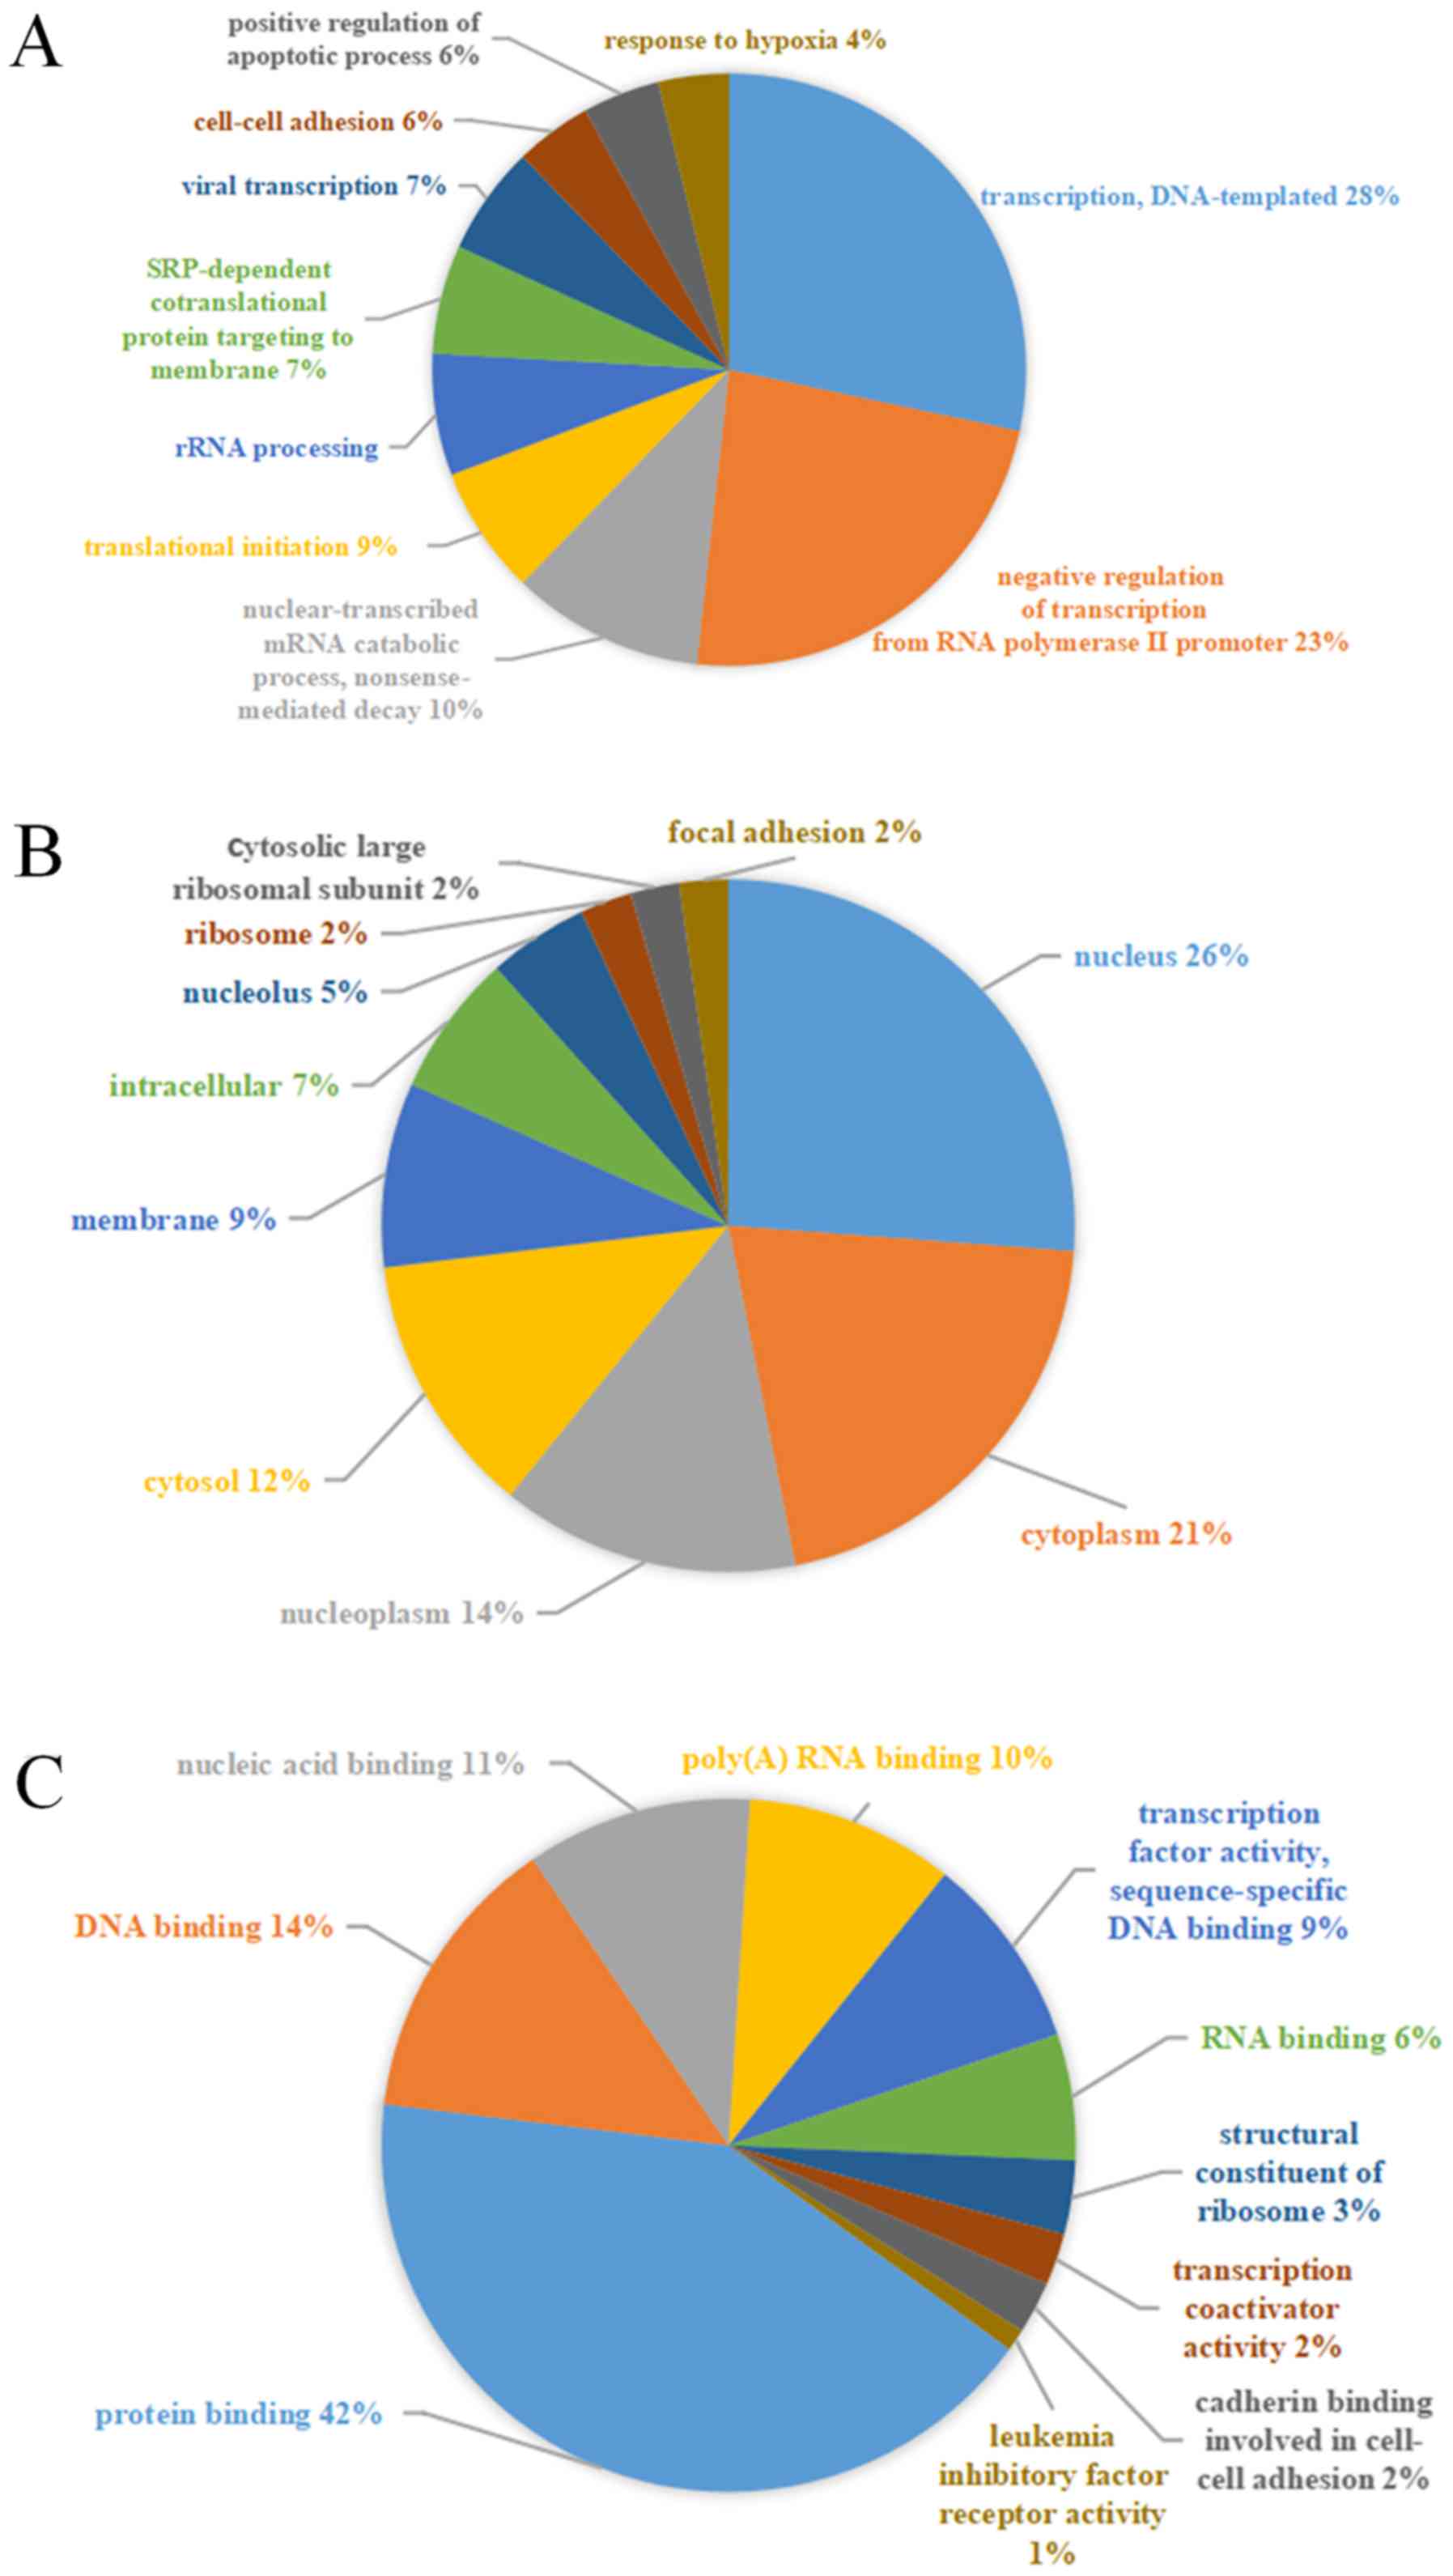
genes (Fig. 4). Subsequently, GO and
KEGG pathway analysis was performed to classify the 401 overlapping
genes. The most significantly enriched GO terms were
‘transcription’ (GO: Biological process), ‘nucleus’ (GO: Cellular
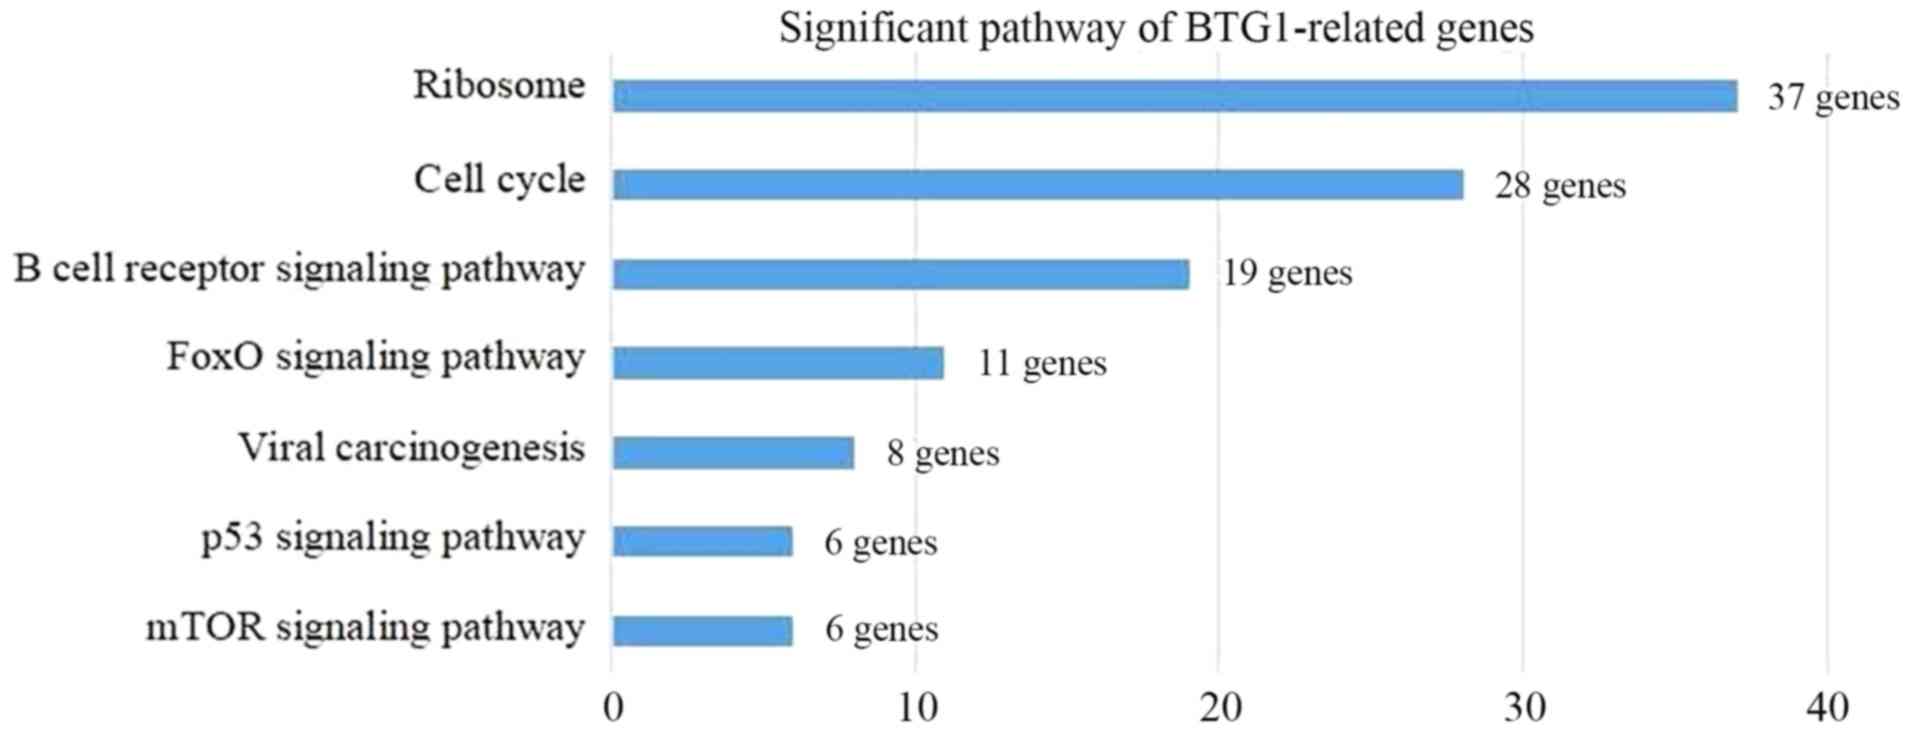
component) and ‘protein binding’ (GO: Molecular function) (Fig. 5). Additionally, KEGG pathway analysis
revealed that the BTG1-associated DLBCL genes were involved in
seven pathways, including ‘Ribosome’, ‘Cell cycle’ and ‘B cell
receptor signaling pathway’ (Fig. 6).
In summary, BTG1 may be involved in DLBCL progression.
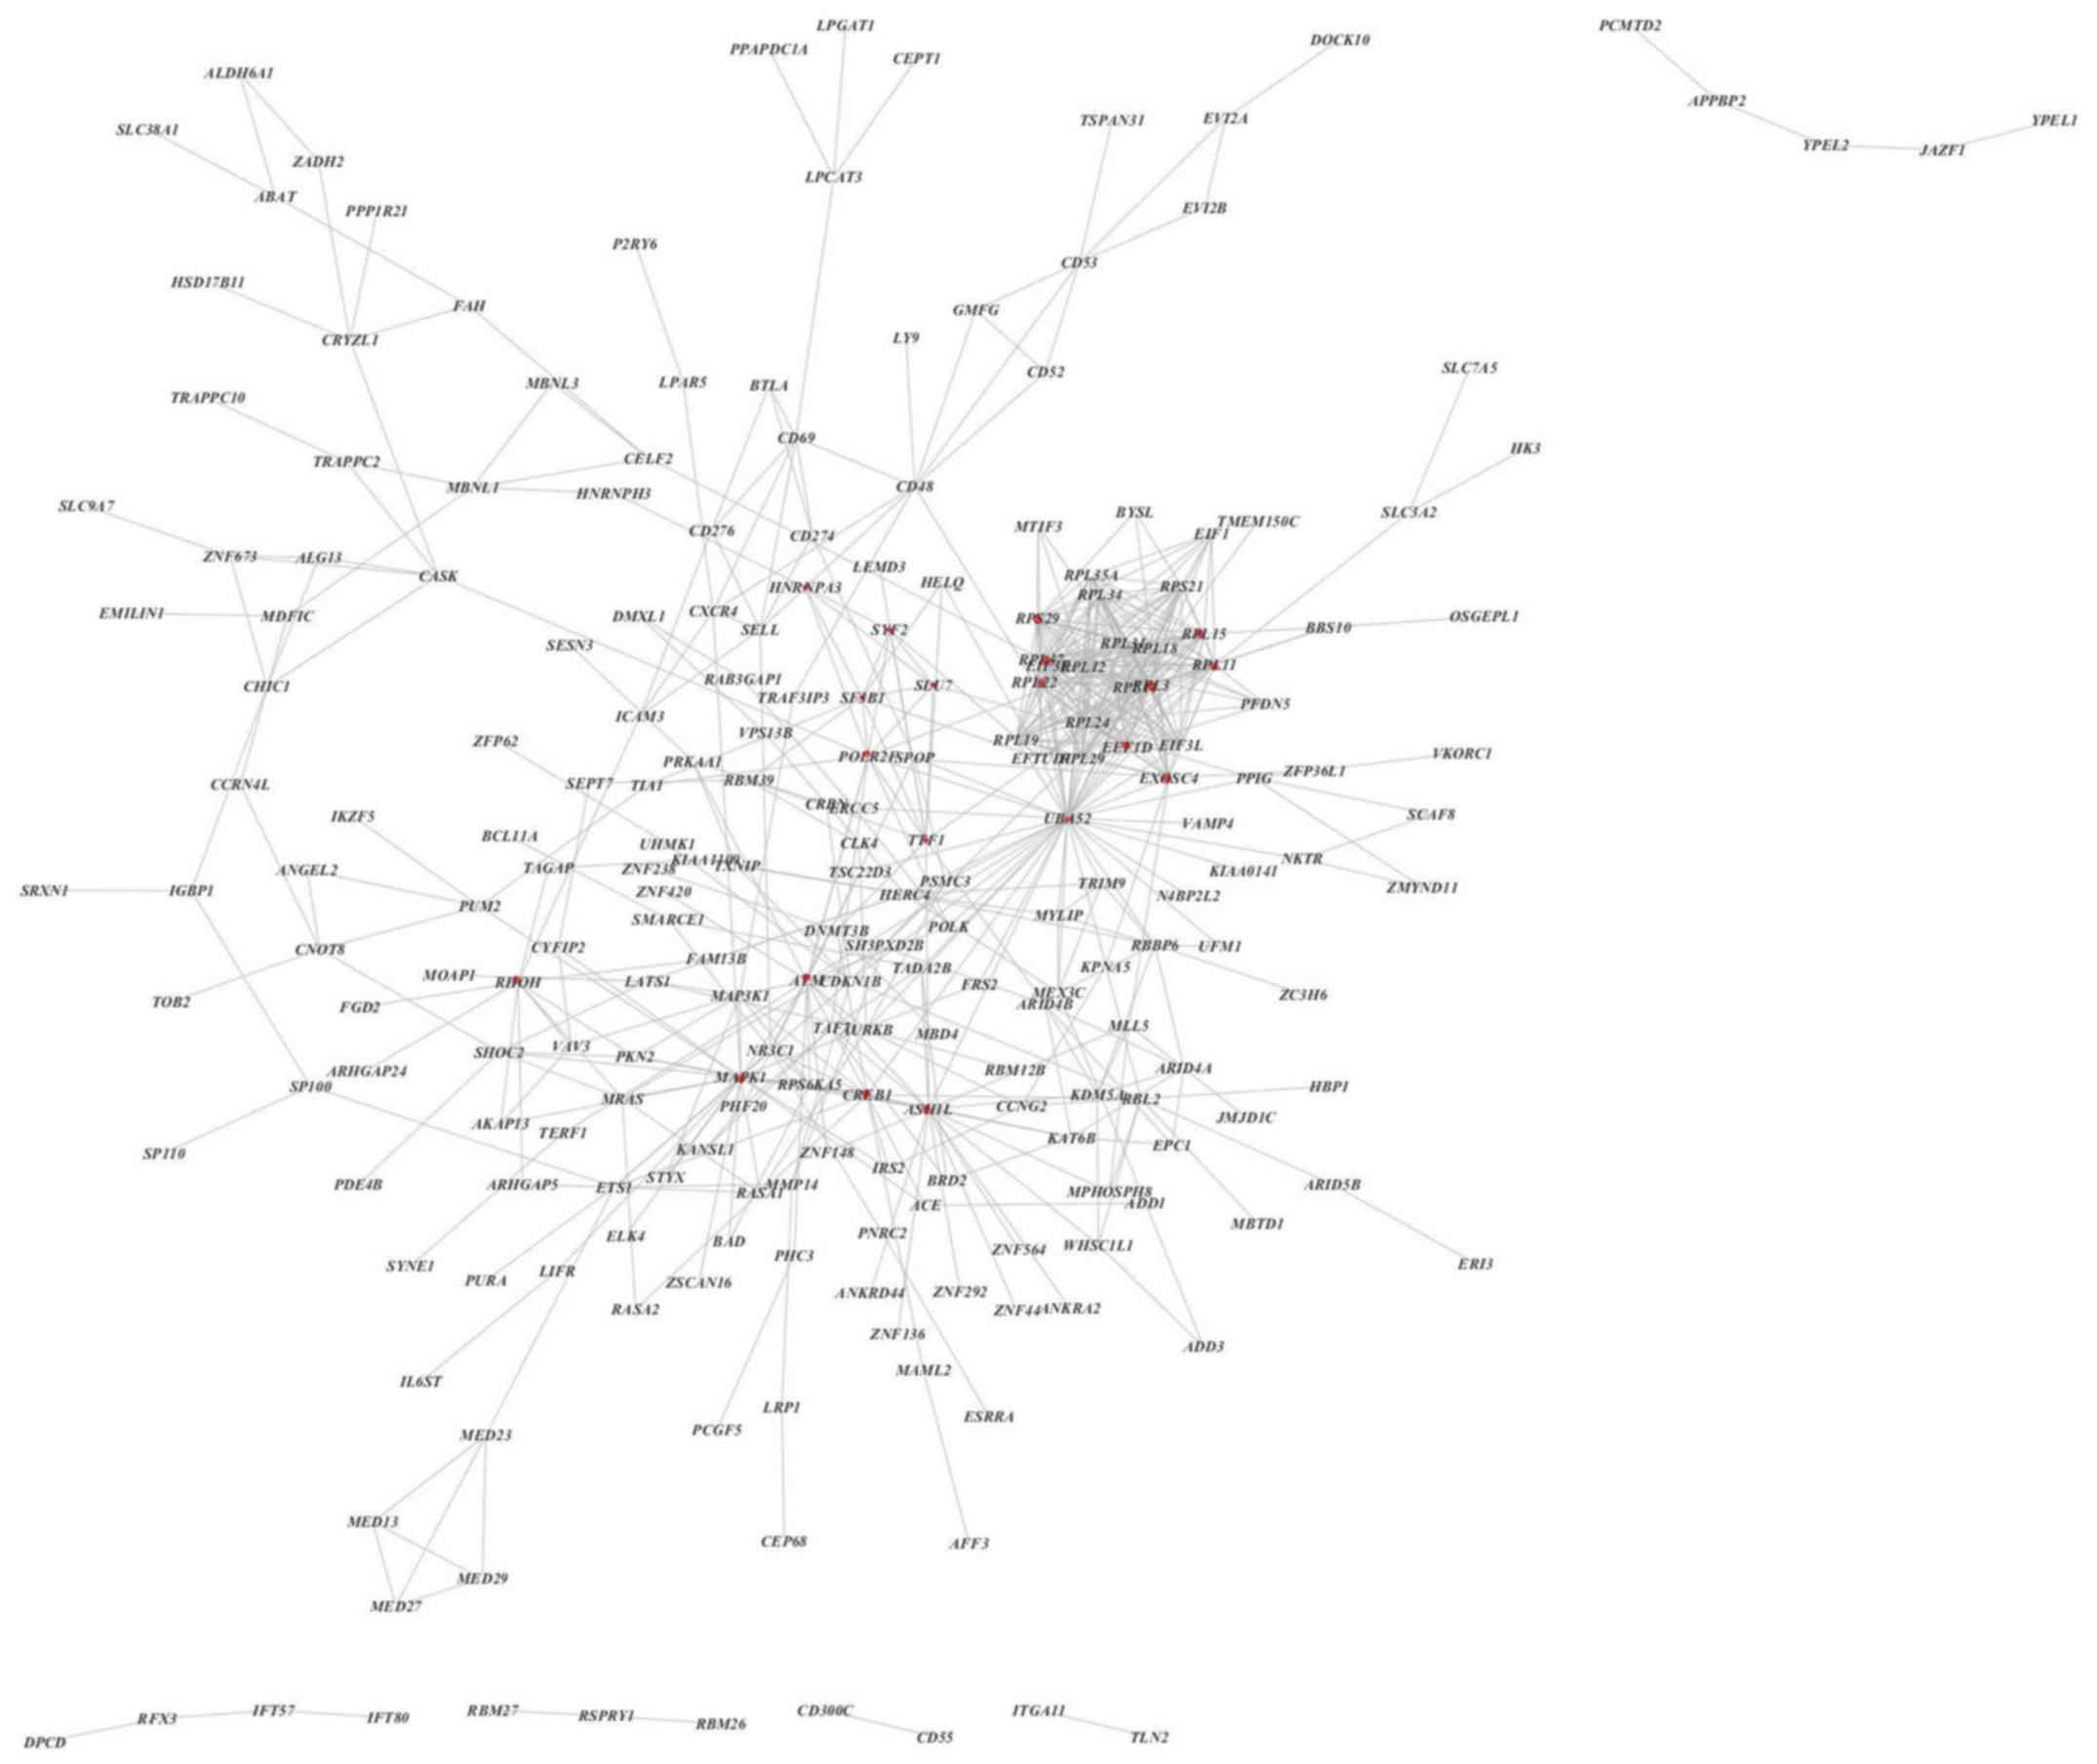
Establishment of a PPI network and
identification of hub genes
The STRING database and Cytoscape analysis were used
to predict a potential interaction network for the BTG1-associated
DLBCL genes. The PPI network was composed of 235 nodes and 601
edges, including 343 upregulated genes and 58 downregulated genes
(Fig. 7). Additionally, when a degree
≥17 was set as the cut-off point, 24 genes in the PPI network were
identified as hub genes, including ubiquitin carboxyl extension
protein 52 (UBA52), ribosomal protein (RP) L11, mitogen-activated
protein kinase 1 (MAPK1) and exosome component 4.
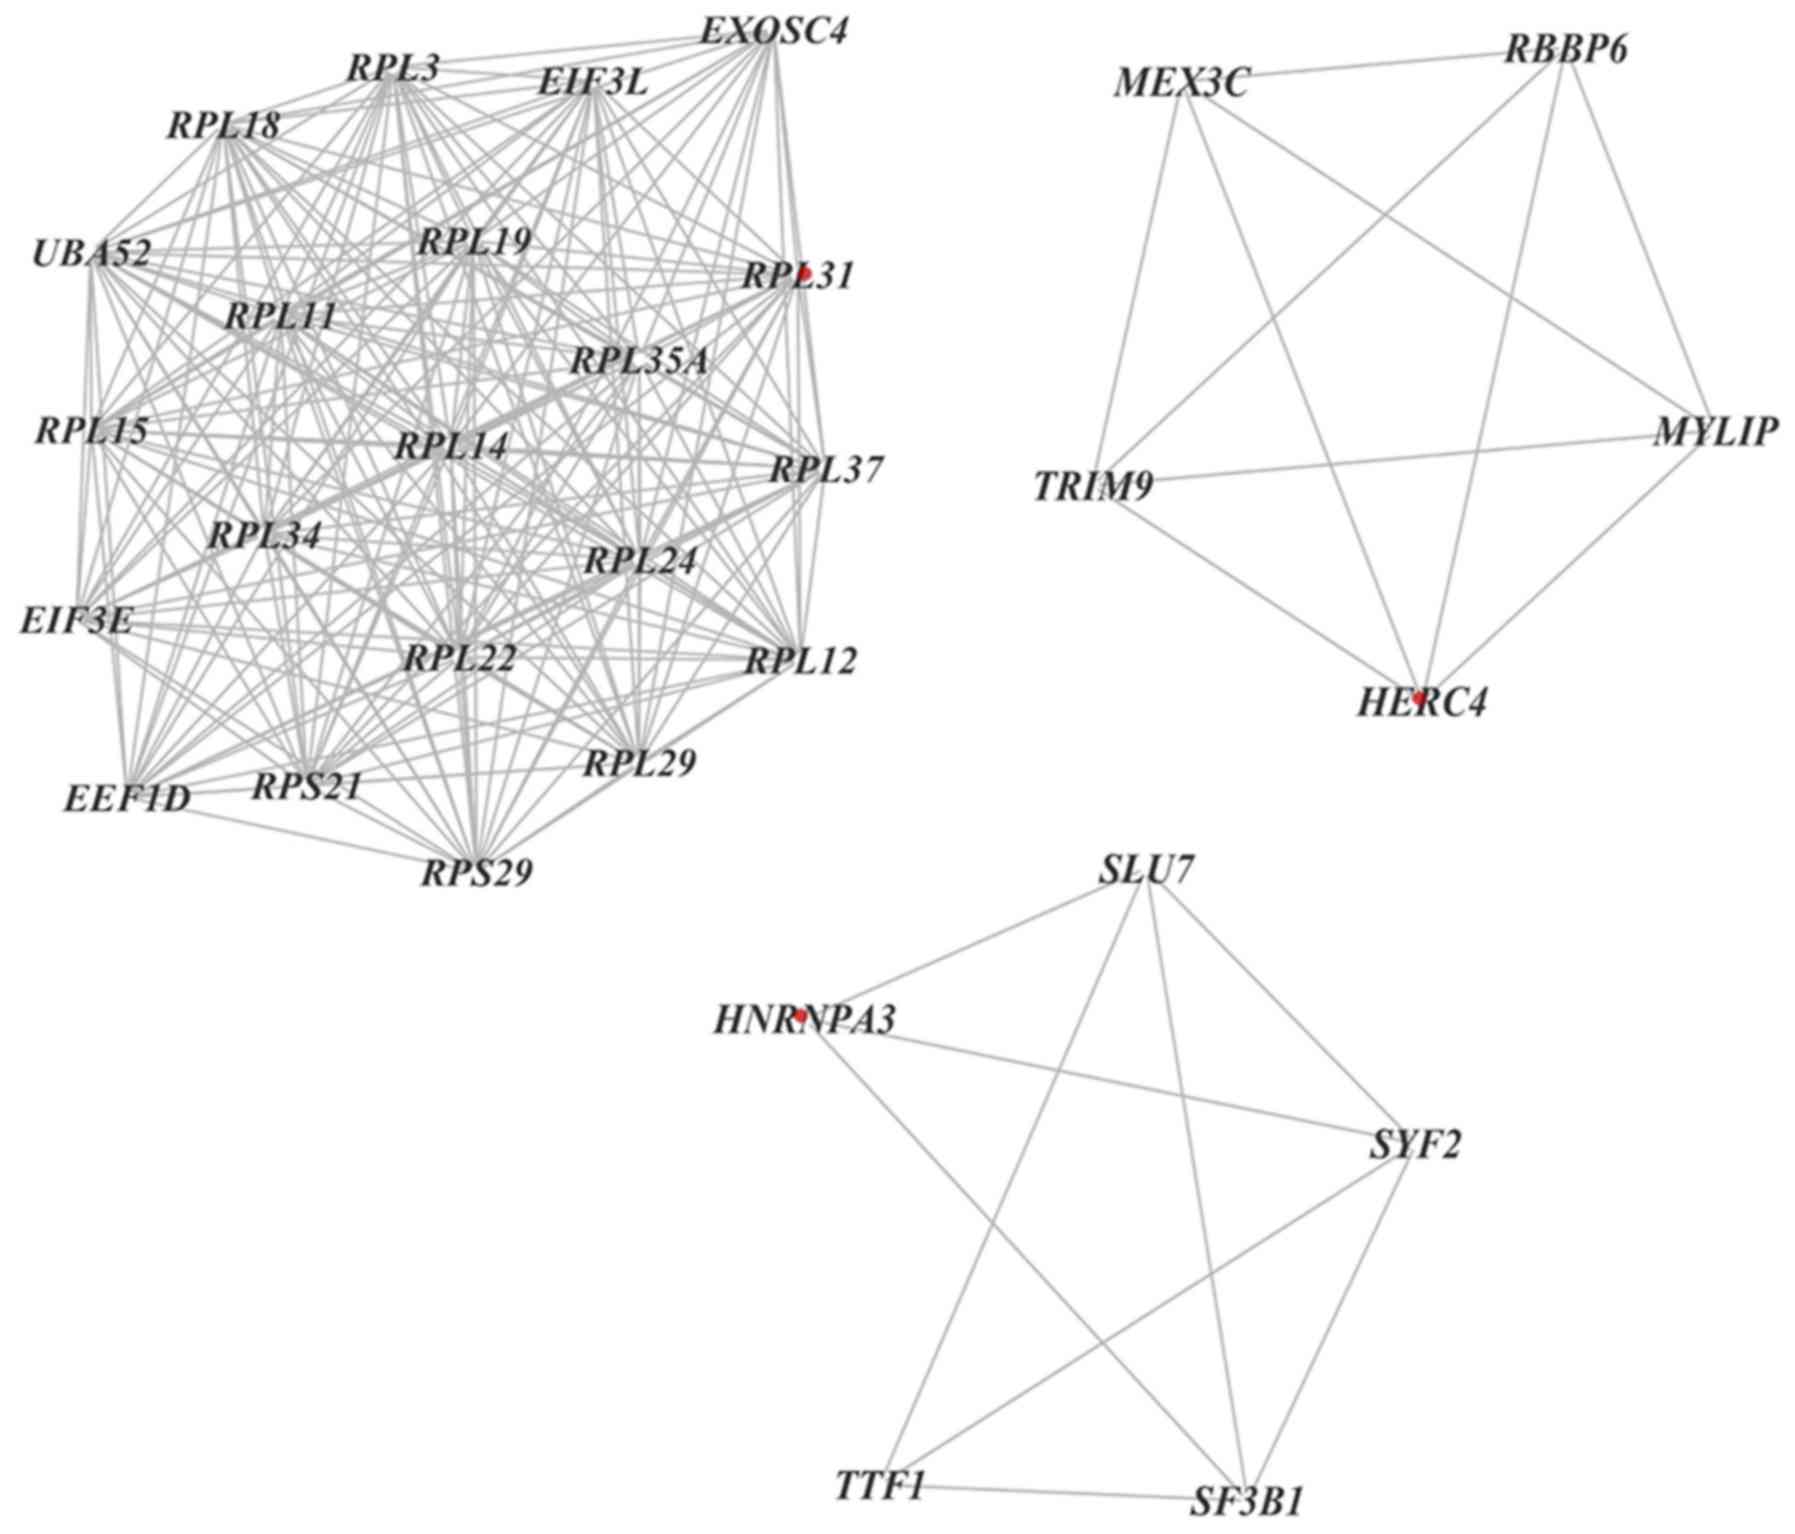
Furthermore, 11 clusters were selected from a PPI
network using MCODE, which revealed that the most significant
cluster consisted of 21 nodes and 203 edges. Additionally, MCODE
analysis demonstrated that each cluster contained one ‘seed’ gene
(32), including RPL31, hect domain
and RLD 4 and heterogeneous nuclear ribonucleoprotein A3 (Fig. 8).
Discussion
DLBCL is the most common lymphoid malignancy, with
the incidence rate of lymphoma in China reported as 643/100,000 in
2012, and is part of a heterogeneous group of fast growing
neoplasms, which exhibit an aggressive clinical course (33). Multi-agent chemotherapy has the
potential to cure ~40% of patients and combination with an
anti-CD20 monoclonal antibody has further improved the treatment
response for an additional 10–25% of patients (34). Despite improvements in therapy for
DLBCL, 30% of patients do not respond to treatment attempts
(35). The variation in prognosis for
patients with DLBCL supports investigations of prognostic factors
that can predict treatment response and the clinical course.
The BTG family serves a role in cancer, as BTG
proteins can regulate the cell cycle (36). As a member of the BTG family, BTG1 has
been identified to possess a t (q24;q22) translocation in B-cell
chronic lymphocytic leukemia and serve as a biomarker for complete
remission of acute lymphoblastic leukemia (37). Additionally, BTG1 is considered to be
a tumor suppressor gene that is typically downregulated in various
types of cancer, including colorectal, ovarian and renal cancer
(13,20,38).
However, to the best of our knowledge, the role of BTG1 in DLBCL
remains unclear. The present study performed systemic
bioinformatics analysis to investigate the mechanism and gene
network of BTG1 in DLBCL.
The present study investigated the association
between BTG1 and clinical characteristics, as well as the
diagnostic value of BTG1 for DLBCL. According to 470 samples
obtained from the GSE31312 dataset, the expression level of BTG1
was associated with treatment response and IPI score. Furthermore,
univariate and multivariate Cox regression analysis indicated that
BTG1 expression level was a prognostic factor for overall survival
and progression-free survival times. Although clinical data is
missing for 28 patients, which may have certain effects on the
results, it can be indicated that BTG1 is a protective factor in
DLBCL.
A total of 401 BTG1-associated DLBCL genes were
identified from the GSE31312, GSE10846 and GSE87371 datasets,
consisting of 343 upregulated genes and 58 downregulated genes.
These genes were enriched in seven pathways, including ‘Ribosome’,
‘Cell cycle’ and ‘B cell receptor signaling pathway’. According to
their degree in the PPI network, 24 genes were recognized as hub
genes. The hub genes were associated with ‘Ribosome’ (RPL11, RPL5,
RPS15, RPS14, RPL22 and RPL37), ‘Cell cycle’ (UBA52, ATM and Ras
homolog family member H), ‘MAPK pathway’ (MAPK1), ‘histone
modification’ (ASH1-like protein) and ‘transcription/translation’
(eukaryotic translation initiation factor 3 subunit E, eukaryotic
translation elongation factor 1 δ, transcription termination factor
1, cAMP responsive element binding protein 1 and RNA polymerase II
subunit F).
Notably, a panel of genes that encode RPs, including
RPL11, RPL3, RPS29, RPL19, RPL15 and RPL12, were identified to be
highly associated with the expression level of BTG1. Cancer cells
require large amounts of protein and increased protein synthesis,
and consequently require efficient ribosome translational machinery
(39). Therefore, a number of
carcinogens and tumor suppressors, including p53, p21 and mMRPS36,
frequently affect the growth of cancer cells by regulating ribosome
biogenesis and protein synthesis (40). Numerous RPs, including RPL11, RPL5,
RPL37, RPS15 and RPS14, have been identified to suppress tumor cell
proliferation by regulating the mouse double minute (MDM) 2
homolog/MDMX-p53 cascade (41–44). RPL11
has also been revealed to suppress c-Myc activity and promote
microRNA (miR)-24/miR-induced silencing complex-mediated c-Myc mRNA
degradation (45). Additionally,
mutations in certain RP-encoding genes, including RPL5 and RPL22,
in tumors further indicates that RPs can be regarded as tumor
suppressors (46).
A high degree of interaction was also observed
between the hub genes UBA52, MAPK1 and BTG1. Ubiquitination is an
important post-translational modification. UBA52 encodes a fusion
protein, which consists of ubiquitin at the N-terminus and RPL40 at
the C-terminus. UBA52 deficient cells exhibit inhibited protein
synthesis and cell cycle arrest (47). As an ubiquitin-coding gene, UBA52 also
serves a role in the regulation of the ribosomal protein complex
(48). The MAPK signaling cascade is
a pathway that mediates the proliferation and differentiation of
hematopoietic cells. Among the MAPKs, MAPK1 serves a role in
various mitogenic signaling pathways and participates in a
diversity of cellular programs, including cell cycle progression
and differentiation (49).
The majority of hub genes associated with BTG1 were
identified to be involved in the ribosomal, cell cycle and p53
pathways. These results were consistent with GO and KEGG analysis
of the BTG1-associated DLBCL genes. Other pathways identified by
KEGG analysis included the BCR signaling pathway, the forkhead box
O (FoxO) signaling pathway and the mTOR signaling pathway. DLBCL
activates BCR signaling to maintain malignant growth and survival,
which is mediated by NF-κB and other signals (12). The FoxO proteins are a subfamily of
the fork head transcription factor family, which exhibit important
roles in cell fate and tumor suppression (50). mTOR has been investigated for a number
of years as a central regulator of cell growth, proliferation,
survival and differentiation (51).
The mechanism of BTG1 in DLBCL may involve these aforementioned
pathways. However, potential mechanisms have not been investigated
in DLBCL in vivo or in vitro. Therefore, further
studies are required to support the results of the present
study.
In conclusion, the present study indicated that BTG1
may be an independent prognostic factor for DLBCL and may serve a
role in the progression and development of the disease. The aim of
the present study was to predict the mechanism of BTG1 in DLBCL
using bioinformatics analysis. It was identified that BTG1 may
interact with RPs, UBA52, MAPK1 and other genes to participate in
the development of DLBCL, which would involve numerous
tumor-associated signaling pathways. Future studies are required to
verify the potential regulatory network proposed in the present
study.
Acknowledgements
Not applicable.
Funding
No funding was received.
Availability of data and material
The datasets analyzed during the current study are
available from the GEO database (http://www.ncbi.nlm.nih.gov/geo). All
clinicopathological data analyzed during this study are included in
the published GEO dataset, GSE31312 (25).
Authors' contributions
WYan and WYang designed the study and conducted
bioinformatics analysis. WYan, SXL and HG performed statistical
analysis, participated in data collection and drafted the
manuscript. WYang supervised the scientific work and revising it
critically amended the manuscript. She also gave final approval of
the version to be published. All authors read and approved the
final manuscript.
Ethics approval and consent to
participate
Not applicable.
Patient consent for publication
Not applicable.
Competing interests
The authors declare that they have no competing
interests.
Glossary
Abbreviations
Abbreviations:
|
BTG1
|
B-cell translocation gene 1
|
|
DLBCL
|
diffuse large B-cell lymphoma
|
|
GEO
|
Gene Expression Omnibus
|
|
STRING
|
Search Tool for the Retrieval of
Interacting Genes/Proteins
|
|
OS
|
overall survival
|
|
PFS
|
progression-free survival
|
|
IPI
|
International Prognostic Index
|
|
GCB
|
germinal center B-like
|
|
BCR
|
B-cell receptor
|
|
HR
|
hazard ratio
|
|
GO
|
Gene Ontology
|
|
KEGG
|
Kyoto Encyclopedia of Genes and
Genomes
|
|
PPI
|
protein-protein interaction
|
|
MCODE
|
Molecular Complex Detection
|
|
CR
|
complete response
|
|
PR
|
partial response
|
|
PD
|
progressive disease
|
|
SD
|
stable disease
|
|
DEG
|
differentially-expressed gene
|
|
RP
|
ribosomal protein
|
|
mTOR
|
mammalian target of rapamycin
|
References
|
1
|
Garciaz S, Coso D, Brice P and Bouabdallah
R: Hodgkin and non-Hodgkin lymphoma of adolescents and young
adults. Bull Cancer. 103:1035–1049. 2016.(In French). View Article : Google Scholar : PubMed/NCBI
|
|
2
|
Vega GG, Avilés-Salas A, Chalapud JR,
Martinez-Paniagua M, Pelayo R, Mayani H, Hernandez-Pando R,
Martinez-Maza O, Huerta-Yepez S, Bonavida B and Vega MI: P38 MAPK
expression and activation predicts failure of response to CHOP in
patients with diffuse large B-cell lymphoma. BMC Cancer.
15:7222015. View Article : Google Scholar : PubMed/NCBI
|
|
3
|
Zhang J, Wei B, Hu H, Liu F, Tu Y, Zhao M
and Wu D: Preliminary study on decreasing the expression of FOXP3
with miR-155 to inhibit diffuse large B-cell lymphoma. Oncol Lett.
14:1711–1718. 2017. View Article : Google Scholar : PubMed/NCBI
|
|
4
|
Hu X, Zeng M, Yang SE, Liang X, Ding SS,
Guo L, Li S and Wen SJ: Efficacy of rituximab combined with CHOP
for treating patients with diffuse large B-cell lymphoma. Medicine
(Baltimore). 96:e84942017. View Article : Google Scholar : PubMed/NCBI
|
|
5
|
De Paepe P, Achten R, Verhoef G, Wlodarska
I, Stul M, Vanhentenrijk V, Praet M and De Wolf-Peeters C: Large
cleaved and immunoblastic lymphoma may represent two distinct
clinicopathologic entities within the group of diffuse large B-cell
lymphomas. J Clin Oncol. 23:7060–7068. 2005. View Article : Google Scholar : PubMed/NCBI
|
|
6
|
Tumwine LK, Agostinelli C, Campidelli C,
Othieno E, Wabinga H, Righi S, Falini B, Piccaluga PP, Byarugaba W
and Pileri SA: Immnohistochemical and other prognostic factors in B
cell non Hodgkin lymphoma patients, Kampala, Uganda. BMC Clin
Pathol. 9:112009. View Article : Google Scholar : PubMed/NCBI
|
|
7
|
Offner F, Samoilova O, Osmanov E, Eom HS,
Topp MS, Raposo J, Pavlov V, Ricci D, Chaturvedi S, Zhu E, et al:
Frontline rituximab, cyclophosphamide, doxorubicin, and prednisone
with bortezomib (VR-CAP) or vincristine (R-CHOP) for non-GCB DLBCL.
Blood. 126:1893–1901. 2015. View Article : Google Scholar : PubMed/NCBI
|
|
8
|
Leonard JP, Kolibaba KS, Reeves JA,
Tulpule A, Flinn IW, Kolevska T, Robles R, Flowers CR, Collons R,
DiBella NJ, et al: Randomized phase II study of R-CHOP with or
without bortezomib in previously untreated patients with
non-germinal center B-cell-like diffuse large B-cell lymphoma. J
Clin Oncol. 35:3538–3546. 2017. View Article : Google Scholar : PubMed/NCBI
|
|
9
|
Murthy SL, Hitchcock MA, Endicott-Yazdani
TR, Watson JT and Krause JR: Epstein-barr virus-positive diffuse
large B-cell lymphoma. Proc (Bayl Univ Med Cent). 30:443–444. 2017.
View Article : Google Scholar : PubMed/NCBI
|
|
10
|
van Krieken JH: New developments in the
pathology of malignant lymphoma: A review of the literature
published from May to August 2017. J Hematop. 10:65–73. 2017.
View Article : Google Scholar : PubMed/NCBI
|
|
11
|
Bognar MK, Vincendeau M, Erdmann T,
Seeholzer T, Grau M, Linnemann JR, Ruland J, Scheel CH, Lenz P, Ott
G, et al: Oncogenic CARMA1 couples NF-κB and β-catenin signaling in
diffuse large B-cell lymphomas. Oncogene. 35:4269–4281. 2016.
View Article : Google Scholar : PubMed/NCBI
|
|
12
|
Young RM, Shaffer AL III, Phelan JD and
Staudt LM: B cell receptor signaling in diffuse large B cell
lymphoma. Semin Hematol. 52:77–85. 2015. View Article : Google Scholar : PubMed/NCBI
|
|
13
|
Zhao Y, Gou WF, Chen S, Takano Y, Xiu YL
and Zheng HC: BTG1 expression correlates with the pathogenesis and
progression of ovarian carcinomas. Int J Mol Sci. 14:19670–19680.
2013. View Article : Google Scholar : PubMed/NCBI
|
|
14
|
Rouault JP, Rimokh R, Tessa C, Paranhos G,
Ffrench M, Duret L, Garoccio M, Germain D, Samarut J and Magaud JP:
BTG1, a member of a new family of antiproliferative genes. EMBO J.
11:1663–1670. 1992. View Article : Google Scholar : PubMed/NCBI
|
|
15
|
Mauxion F, Chen CY, Séraphin B and Shyu
AB: BTG/TOB factors impact deadenylases. Trends Biochem Sci.
34:640–647. 2009. View Article : Google Scholar : PubMed/NCBI
|
|
16
|
Busson M, Carazo A, Seyer P, Grandemange
S, Casas F, Pessemesse L, Rouault JP, Wrutniak-Cabello C and
Cabello G: Coactivation of nuclear receptors and myogenic factors
induces the major BTG1 influence on muscle differentiation.
Oncogene. 24:1698–1710. 2005. View Article : Google Scholar : PubMed/NCBI
|
|
17
|
Yin P, Song G and Jiang Z: Cisplatin
suppresses proliferation, migration and invasion of nasopharyngeal
carcinoma cells in vitro by repressing the
Wnt/β-catenin/Endothelin-1 axis via activating B cell translocation
gene 1. Cancer Chemother Pharmacol. 81:863–872. 2018. View Article : Google Scholar : PubMed/NCBI
|
|
18
|
Rouaul JP, Prévôt D, Berthet C, Birot AM,
Billaud M, Magaud JP and Corbo L: Interaction of BTG1 and
p53-regulated BTG2 gene products with mCaf1, the murine homolog of
a component of the yeast CCR4 transcriptional regulatory complex. J
Biol Chem. 273:22563–22569. 1998. View Article : Google Scholar : PubMed/NCBI
|
|
19
|
Tijchon E, van Emst L, Yuniati L, van
lngen Schenau D, Gerritsen M, van der Meer LT, Williams O,
Hoogerbrugge PM, Scheijen B and van Leeuwen FN: Tumor suppressor
BTG1 limits activation of BCL6 expression downstream of ETV6-RUNX1.
Exp Hematol. 60:57–62.e3. 2018. View Article : Google Scholar : PubMed/NCBI
|
|
20
|
Liu C, Tao T, Xu B, Lu K, Zhang L, Jiang
L, Chen S, Liu D, Zhang X, Cao N and Chen M: BTG1 potentiates
apoptosis and suppresses proliferation in renal cell carcinoma by
interacting with PRMT1. Oncol Lett. 10:619–624. 2015. View Article : Google Scholar : PubMed/NCBI
|
|
21
|
He C, Yu T, Shi Y, Ma C, Yang W, Fang L,
Sun M, Wu W, Xiao F, Guo F, et al: MicroRNA 301A promotes
intestinal inflammation and colitis-associated cancer development
by inhibiting BTG1. Gastroenterology. 152:1434–1448.e15. 2017.
View Article : Google Scholar : PubMed/NCBI
|
|
22
|
Corjay MH, Kearney MA, Mnzer DA, Diamond
SM and Stoltenborg JK: Antiproliferative gene BTG1 is highly
expressed in apoptotic cells in macrophage-rich areas of advanced
lesions in Watanabe heritable hyperlipidemic rabbit and human. Lab
Invest. 78:847–858. 1998.PubMed/NCBI
|
|
23
|
Scheijen B, Boer JM, Marke R, Tijchon E,
van lngen Schenau D, Waanders E, van Emst L, van der Meer LT,
Pieters R, Escherich G, et al: Tumor suppressors BTG1 and IKZF1
cooperate during mouse leukemia development and increase relapse
risk in B-cell precursor acute lymphoblastic leukemia patients.
Haematologica. 102:541–551. 2017. View Article : Google Scholar : PubMed/NCBI
|
|
24
|
Tijchon E, van Emst L, Yuniati L, van
lngen Schenau D, Havinga J, Rouault JP, Hoogerbrugge PM, van
Leeuwen FN and Scheijen B: Tumor suppressors BTG1 and BTG2 regulate
early mouse B-cell development. Haematologica. 101:e272–e276. 2016.
View Article : Google Scholar : PubMed/NCBI
|
|
25
|
Visco C, Li Y, Xu-Monette ZY, Miranda RN,
Green TM, Li Y, Tzankov A, Wen W, Liu WM, Kahl BS, et al:
Comprehensive gene expression profiling and immunohistochemical
studies support application of immunophenotypic algorithm for
molecular subtype classification in diffuse large B-cell lymphoma:
A report from the International DLBCL Rituximab-CHOP consortium
program study. Leukemia. 26:2103–2113. 2012. View Article : Google Scholar : PubMed/NCBI
|
|
26
|
Simon R, Durrleman S, Hoppe RT, Bonadonna
G, Bloomfield CD, Rudders RA, Cheaon BD and Berard CW: The
non-hodgkin lymphoma pthologic classification profect. Long-term
follow-up of 1153 patients with non-Hodgkin lymphomas. Ann Intern
Med. 109:939–945. 1988. View Article : Google Scholar : PubMed/NCBI
|
|
27
|
Meyer PN, Fu K, Greiner TC, Smith LM,
Delabie J, Gascoyne RD, Ott G, Rosenwald A, Braziel RM, Campo E, et
al: Immunohistochemical methods for predicting cell of origin and
survival in patients with diffuse large B-cell lymphoma treated
with rituximab. J Clin Oncol. 29:200–207. 2011. View Article : Google Scholar : PubMed/NCBI
|
|
28
|
Dubois S and Jardin F: Novel molecular
classifications of DLBCL. Nat Rev Clin Oncol. 15:474–476. 2018.
View Article : Google Scholar : PubMed/NCBI
|
|
29
|
Liao YX, Zhang ZP, Zhao J and Liu JP:
Effects of fibronectin 1 on cell proliferation, senescence and
apoptosis of human glioma cells through the PI3K/AKT signaling
pathway. Cell Physiol Biochem. 48:1382–1396. 2018. View Article : Google Scholar : PubMed/NCBI
|
|
30
|
Zang Y, Gu L, Zhang Y, Wang Y and Xue F:
Identification of key genes and pathways in uterine leiomyosarcoma
through bioinformatics analysis. Oncol Lett. 15:9361–9368.
2018.PubMed/NCBI
|
|
31
|
Rosenwald A, Wright G, Chan WC, Connors
JM, Campo E, Fisher RI, Gascoyne RD, Muller-Hermelink HK, Smeland
EB, Giltnane JM, et al: The use of molecular profiling to predict
survival after chemotherapy for diffuse large-B-cell lymphoma. N
Engl J Med. 346:1937–1947. 2002. View Article : Google Scholar : PubMed/NCBI
|
|
32
|
Pan Y, Lu L, Chen J, Zhong Y and Dai Z:
Identification of potential crucial genes and construction of
microRNA-mRNA negative regulatory network in osteosarcoma.
Hereditas. 155:212018. View Article : Google Scholar : PubMed/NCBI
|
|
33
|
Chen W, Zheng R, Zeng H and Zhang S: The
incidence and mortality of major cancers in China, 2012. Chin J
Cancer. 35:732016. View Article : Google Scholar : PubMed/NCBI
|
|
34
|
Wu J, Song Y, Su L, Xu L, Chen T, Zhao Z,
Zhang M, Li W, Hu Y, Zhang X, et al: Rituximab plus chemotherapy as
first-line treatment in Chinese patients with diffuse large B-cell
lymphoma in routine practice: A prospective, multicentre,
non-interventional study. BMC Cancer. 16:5372016. View Article : Google Scholar : PubMed/NCBI
|
|
35
|
Yamauchi T, Tasaki T, Tai K, Ikegaya S,
Takagi K, Negoro E, Kishi S, Yoshida A, Iwasaki H and Ueda T:
Prognostic effect of peripheral blood cell counts in advanced
diffuse large B-cell lymphoma treated with R-CHOP-like
chemotherapy: A single institution analysis. Oncol Lett. 9:851–856.
2015. View Article : Google Scholar : PubMed/NCBI
|
|
36
|
Huang Y, Zheng J, Tan T, Song L, Huang S,
Zhang Y, Lin L, Liu J, Zheng P, Chen X, et al: BTG1 low expression
in pancreatic ductal adenocarcinoma is associated with a poorer
prognosis. Int J Biol Markers. 33:189–194. 2018. View Article : Google Scholar : PubMed/NCBI
|
|
37
|
Rimokh R, Rouault JP, Wahbi K, Gadoux M,
Lafage M, Archimbaud E, Charrin C, Gentilhomme O, Germain D,
Samarut J, et al: A chromosome 12 coding region is juxtaposed to
the MYC protooncogene locus in a t(8;12)(q24;q22) translocation in
a case of B-cell chronic lymphocytic leukemia. Genes Chromosomes
Cancer. 3:24–36. 1991. View Article : Google Scholar : PubMed/NCBI
|
|
38
|
Zhao S, Chen SR, Yang XF, Shen DF, Takano
Y, Su RJ and Zheng HC: BTG1 might be employed as a biomarker for
carcinogenesis and a target for gene therapy in colorectal cancers.
Oncotarget. 8:7502–7520. 2017.PubMed/NCBI
|
|
39
|
Zhou X, Liao WJ, Liao JM, Liao P and Lu H:
Ribosomal proteins: Functions beyond the ribosome. J Mol Cell Biol.
7:92–104. 2015. View Article : Google Scholar : PubMed/NCBI
|
|
40
|
Chen YC, Chang MY, Shiau AL, Yo YT and Wu
CL: Mitochondrial ribosomal protein S36 delays cell cycle
progression in association with p53 modification and p21(WAF1/CIP1)
expression. J Cell Biochem. 100:981–190. 2007. View Article : Google Scholar : PubMed/NCBI
|
|
41
|
Lohrum MA, Ludwig RL, Kubbutat MH, Hanlon
M and Vousden KH: Regulation of HDM2 activity by the ribosomal
protein L11. Cancer Cell. 3:577–587. 2003. View Article : Google Scholar : PubMed/NCBI
|
|
42
|
Dai MS and Lu H: Inhibition of
MDM2-mediated p53 ubiquitination and degradation by ribosomal
protein L5. J Biol Chem. 279:44475–44482. 2004. View Article : Google Scholar : PubMed/NCBI
|
|
43
|
Daftular L, Zhu Y, Jacq X and Prives C:
Ribosomal proteins RPL37, RPS15 and RPS20 regulate the
Mdm2-p53-MdmX network. PLoS One. 8:e686672013. View Article : Google Scholar : PubMed/NCBI
|
|
44
|
Zhou X, Hao Q, Liao J, Zhang Q and Lu H:
Ribosomal protein S14 unties the MDM2-p53 loop upon ribosomal
stress. Oncogene. 32:388–396. 2013. View Article : Google Scholar : PubMed/NCBI
|
|
45
|
Challagundla KB, Sun XX, Zhang X, DeVine
T, Zhang Q, Sears RC and Dai MS: Ribosomal protein L11 recruits
miR-24/miRISC to repress c-Myc expression in response to ribosomal
stress. Mol Cell Biol. 31:4007–4021. 2011. View Article : Google Scholar : PubMed/NCBI
|
|
46
|
De Keesmaecker K, Atak ZK, Li N, Vicente
C, Patchett S, Girardi T, Gianfelici V, Geerdens E, Clappier E,
Porcu M, et al: Exome sequencing identifies mutation in CNOT3 and
ribosomal genes RPL5 and RPL10 in T-cell acute lymphoblastic
leukemia. Nat Genet. 45:186–190. 2013. View Article : Google Scholar : PubMed/NCBI
|
|
47
|
Mao J, O'Gorman C, Sutovsky M, Zigo M,
Wells KD and Sutovsky P: Ubiquitin A-52 residue ribosomal protein
fusion product 1 (Uba52) is essential for preimplantation embryo
development. Biol Open. 7(pii): bio035717. 2018.
|
|
48
|
Kobayashi M, Oshima S, Maeyashiki C, Nibe
Y, Otsubo K, Matsuzawa Y, Nemoto Y, Nagaishi T, Okamoto R, Tsuchiya
K, et al: The ubiquitin hybrid gene UBA52 regulates ubiquitination
of ribosome and sustains embryonic development. Sci Rep.
6:367802016. View Article : Google Scholar : PubMed/NCBI
|
|
49
|
Gregorj C, Ricciardi MR, Petrucci MT,
Scerpa MC, De Cave F, Fazi P, Vignetti M, Vitale A, Mancini M,
Cimino G, et al: ERK1/2 phosphorylation is an independent predictor
of complete remission in newly diagnosed adult acute lymphoblastic
leukemia. Blood. 109:5473–5476. 2007. View Article : Google Scholar : PubMed/NCBI
|
|
50
|
Farhan M, Wang H, Gaur U, Little PJ, Xu J
and Zheng W: FOXO signaling pathways as therapeutic targets in
cancer. Int J Biol Sci. 13:815–827. 2017. View Article : Google Scholar : PubMed/NCBI
|
|
51
|
Zhou H and Huang S: mTOR signaling in
cancer cell motility and tumor metastasis. Crit Rev Eukaryot Gene
Expr. 20:1–16. 2010. View Article : Google Scholar : PubMed/NCBI
|