Introduction
Hepatocellular carcinoma (HCC) is the fifth most
common tumor and the second most common cause of cancer-related
death worldwide (1). In the last
decades, with marked improvements in medical technology and
well-established screening programs for high-risk patients, the
prognosis of HCC patients has improved (2). However, although 5-year survival rates
after curative treatments like hepatectomy, radiofrequency ablation
(RFA), and liver transplantation are as high as 50–70%, only 20–40%
patients were able to receive these therapies due to their
comorbidities and/or tolerability, in addition to late diagnosis
(2,3).
Recently, proton therapy (PT) has offered promising results to
overcome these limitations (4,5). To test
whether PT is non-inferior to hepatectomy for resectable HCC, a
non-randomized controlled study of PT vs. hepatectomy for
resectable HCC started in June 2017 (Japan Clinical Oncology Group,
JCOG1315C, SPRING study).
After the primary treatment of HCC, active
surveillance is essential because the 5-year tumor recurrence rate
remains as high as over 50% after curative treatment, including PT
(5–8).
In order to enhance the sensitivity and specificity for HCC
detection, measurement of serum tumor markers, especially
alpha-fetoprotein (AFP) and protein induced by vitamin K antagonist
II (PIVKA-II, also known as des-gamma-carboxy prothrombin), is
recommended to complement imaging examination and is used as a
predictor of progression of HCC (9,10).
Increases in these biomarker levels during follow-up after primary
treatments are generally considered to indicate a failure of
treatment and tumor progression. In actual clinical settings,
however, transient increases in the biomarkers are frequently
observed despite the clinical response. This phenomenon is called
flare or surge, and may lead to misinterpretation of tumor
progression.
Several investigators have reported transient
increases in several serum tumor markers during the first few weeks
after initiation of chemotherapy in different cancers. Some
researchers correlated the flare phenomena with better prognosis
(11–13). However, to the best of our knowledge,
no study has yet focused on the transient increase in serum tumor
markers during a longer follow-up period after local therapy. In
addition, transient enlargement of HCC on diagnostic imaging is
also observed during follow-up, but this phenomenon is poorly
understood. In this study, therefore, we investigated changes in
serum AFP and PIVKA-II levels and tumor size on contrast-enhanced
magnetic resonance imaging (MRI) during a 1-year follow-up period
after PT, and analyzed factors potentially associated with this
flare phenomenon.
Materials and methods
Patients
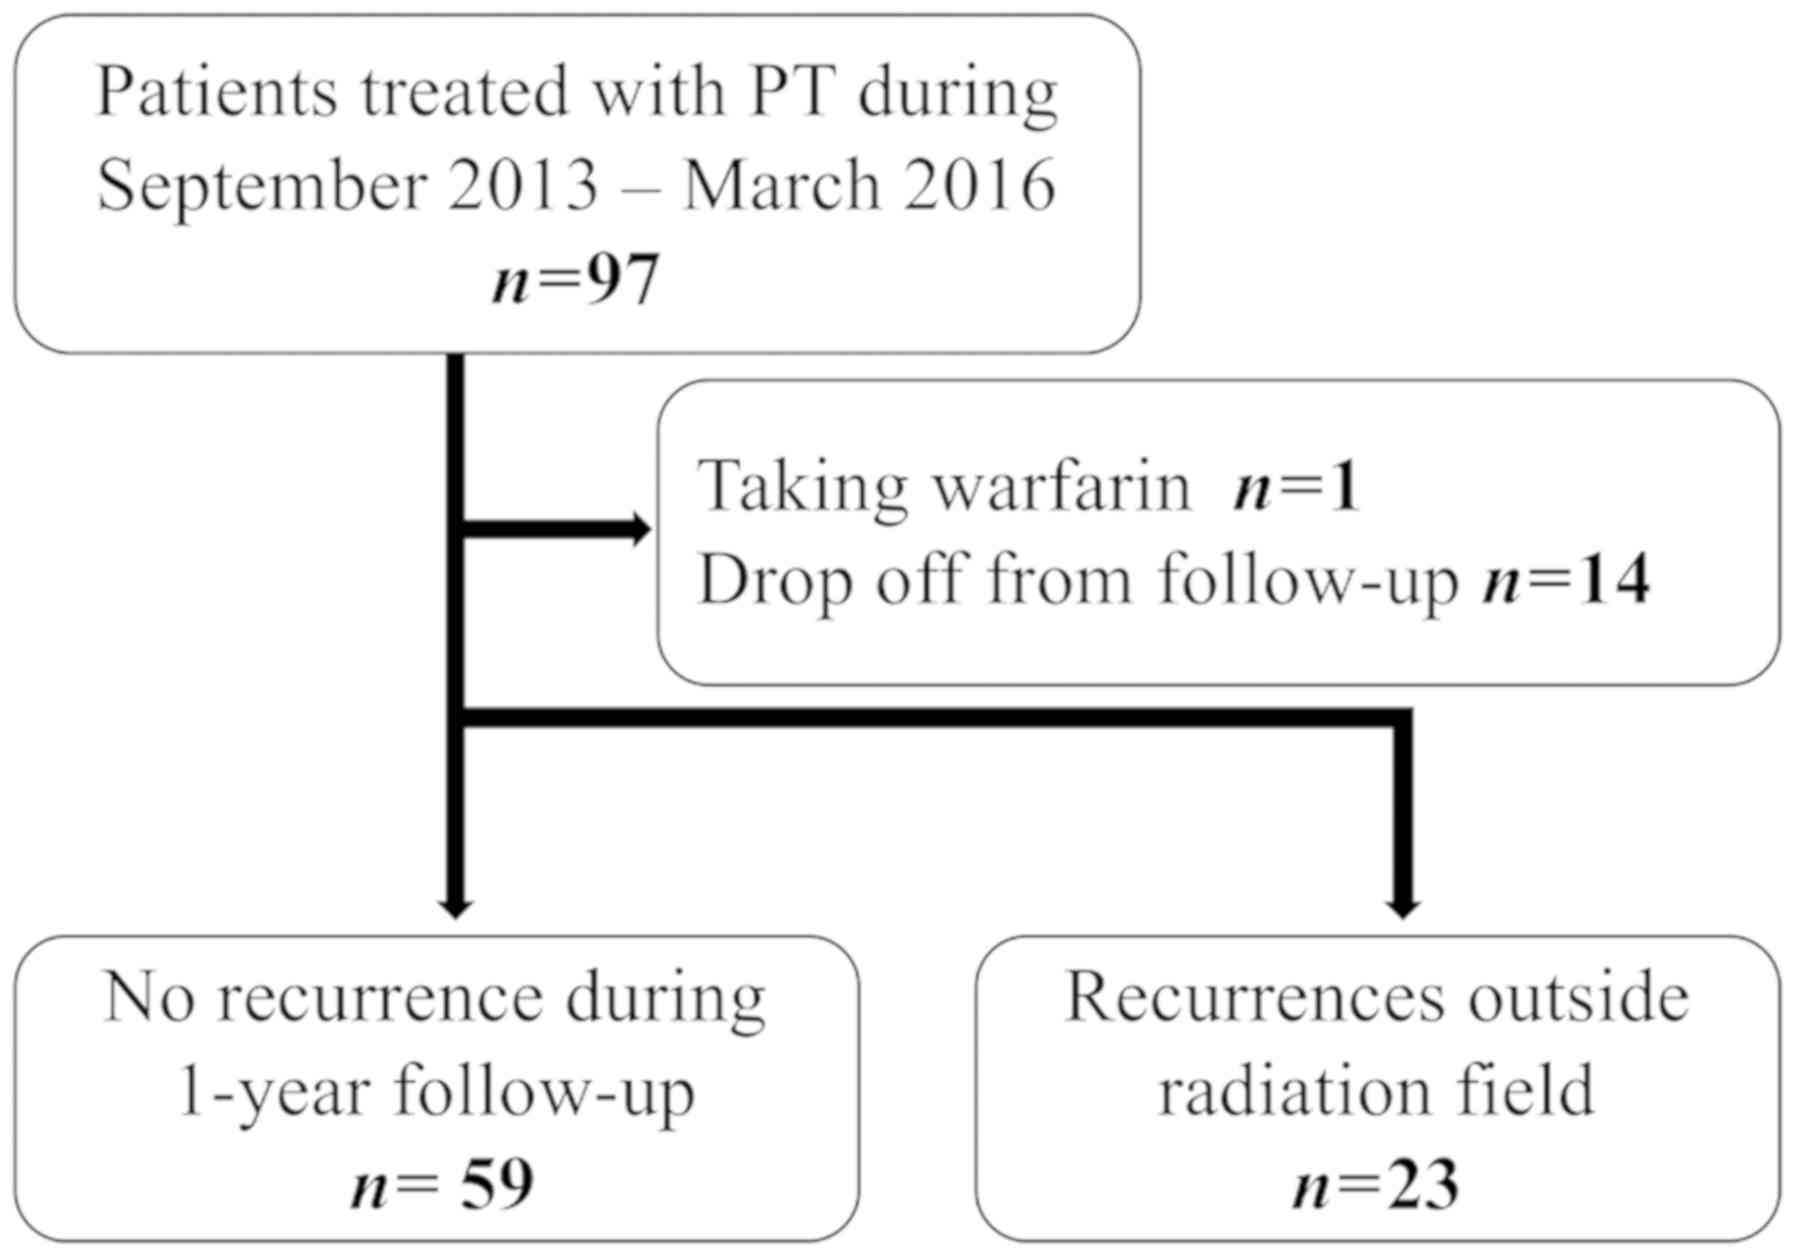
Between September 2013 and March 2016, 97 patients
with stage I/II HCC (TNM Classification of Malignant Tumours Ver.
7, the Union for International Cancer Control) were prospectively
treated with PT according to the protocols approved by the
institutional review board [no. 12-02-22 (18)]. Among them, one patient who were
taking warfarin and 14 patients who were lost to the regular
follow-up (blood tests and MRI could not be performed as scheduled)
were excluded from analysis. In addition, since it is difficult to
distinguish the transient increase in the tumor markers caused by
PT from the elevation caused by recurrence outside of the PT field,
23 patients who had an out-of-field recurrence within 12 months
after PT were analyzed separately for comparison. Thus, 59 HCC
patients were analyzed with respect to the flare phenomena in this
study (Fig. 1). Table I shows patient and treatment
characteristics. Sixteen (27%) of the 59 patients had received
previous treatments such as hepatectomy, RFA, transarterial
embolization, and transarterial chemoembolization.
 | Table I.Patient characteristics. |
Table I.
Patient characteristics.
|
| No recurrence |
|
|---|
|
|
|
|
|---|
| Variable | Total | AFP flare | PIVKA-II flare | Transient increase on
MRI | Out-of-field
recurrence |
|---|
| Number of
patients | 59 | 3 | 23 | 3 | 23 |
| Age (years) |
|
|
|
|
|
| Median
(range) | 67 (38–85) | 66 (63–74) | 67 (38–85) | 68 (65–81) | 72 (40–83) |
| Sex |
|
|
|
|
|
|
Male | 38 (64) | 1 (33) | 13 (57) | 2 (67) | 16 (70) |
|
Female | 21 (36) | 2 (67) | 10 (43) | 1 (33) | 7 (30) |
| Etiology |
|
|
|
|
|
| HCV
infected | 27 (46) | 2 (67) | 10 (43) | 1 (33) | 11 (48) |
| HBV
infected | 15 (25) | 0 (0) | 3 (13) | 1 (33) | 5 (22) |
| Non
HBV, non HCV | 17 (29) | 1 (33) | 10 (43) | 1 (33) | 7 (30) |
| Child pugh
class |
|
|
|
|
|
| A | 51 (86) | 2 (67) | 21 (91) | 3 (100) | 16 (70) |
| B | 8 (14) | 1 (33) | 2 (9) | 0 (0) | 7 (30) |
| Stage, n (%) |
|
|
|
|
|
| I | 49 (83) | 3 (100) | 18 (78) | 3 (100) | 7 (30) |
| II | 10 (17) | 0 (0) | 5 (22) | 0 (0) | 16 (70) |
| Previous
treatment |
|
|
|
|
|
|
Yes | 16 (27) | 0 (0) | 4 (17) | 1 (33) | 12 (52) |
| No | 43 (73) | 3 (100) | 19 (83) | 2 (67) | 11 (48) |
| Protocol
(GyE/fractions) |
|
|
|
|
|
|
66/10 | 46 (78) | 2 (67) | 18 (78) | 2 (67) | 15 (65) |
|
72.6/22 | 13 (22) | 1 (33) | 5 (22) | 1 (33) | 8 (35) |
| Tumor marker rise
before PT |
|
|
|
|
|
|
AFP | 23 (39) | 3 (100) | 8 (35) | 0 (0) | 11 (48) |
|
PIVKA-II | 27 (46) | 1 (33) | 16 (70) | 1 (33) | 14 (61) |
| Response at 12
months |
|
|
|
|
|
| CR | 33 (56) | 2 (67) | 10 (43) | 0 (0) | 2 (9) |
| PR | 17 (29) | 1 (33) | 8 (35) | 1 (33) | 20 (87) |
| SD | 5 (8) | 0 (0) | 4 (17) | 2 (67) | 1 (4) |
Evaluation of tumor markers
Serum levels of AFP and PIVKA-II were measured
before PT, and at 1, 3, 6, 9, and 12 months after PT. The cut-off
levels for serum AFP and PIVKA-II were 20 ng/ml or 40 mAU/ml,
respectively, at our institution. AFP and PIVKA-II flares were
defined as a >20% increase from the level at the preceding
measurement in the range above the cut-off level, followed by a
>20% drop upon subsequent measurements, according to the
criteria used in studies of the flare phenomenon after chemotherapy
(11,12). If serum elevation was observed at 12
months after PT, a drop in the serum level was confirmed
thereafter. Although consecutive rises were counted as a single
flare, inconsecutive increases were analyzed independently. For
comparison, serum elevations in AFP and PIVKA-II at the time of
recurrence were also defined by the same criteria (>20% increase
and over cut-off levels). AFP and PIVKA-II were measured by
chemiluminescence immunoassay (CLIA).
Evaluation of contrast-enhanced
magnetic resonance imaging
Gd-EOB-DTPA-enhanced dynamic MRI was performed with
2.5 mm slice thickness, and the longest diameter of the lesion was
measured on the hepatobiliary phase images. Even when a
hypointensity nodule was observed on T1- and/or T2-weighted images,
disappearance of the target lesion in the hepatobiliary phase was
regarded as a complete response (CR). When the tumor diameter was
difficult to measure, arterial, portal venous, and
diffusion-weighted images were also evaluated. The tumor diameter
was measured by two radiologists who had access to the patients'
clinical information. The inter-observer differences were less than
7% in all cases, and the two measured diameters were averaged.
Transient enlargement was defined as a >10% increase in the
longest tumor diameter between consecutive MR imaging studies,
followed by a >10% decrease upon subsequent measurements. Tumor
progression was diagnosed by consecutive enlargement at 2 follow-up
examinations over 6 months. Responses to treatment were evaluated
with dynamic MRI studies following the RECIST guidelines (14).
Proton therapy
PT was performed with PROBEAT-III (Hitachi Ltd.,
Tokyo, Japan) at Nagoya Proton Therapy Center. Details of the
system have been described previously (15,16). Our
methods of PT planning and delivery have been described in detail
previously (17,18). Prior to PT, patients underwent gold
marker implantation near or inside the tumor for target matching
and replanning. 2-mm-thick computed tomography (CT) images at the
expiration phase were taken and fused with Gd-EOB-DTPA-enhanced
dynamic MRI or contrast-enhanced CT, which were used for gross
tumor volume (GTV) contouring. In addition to the GTV, the internal
gross target volume included respiratory motions, and 3–6 mm
margins were added as an intra/interfractional margin for the
internal clinical target volume (ICTV). The planning target volume
(PTV) included ICTV and setup margins. The delivered dose of PT was
66 GyE in 10 fractions for peripheral HCC located more than 2 cm
from the porta hepatis and 72.6 GyE in 22 fractions for HCC located
within 2 cm of the porta hepatis. The ideal PTV dose constraint was
D98% (dose received by 98% of the volume of the PTV) >95%, which
was adjusted to satisfy the organs at risk (OARs) dose limit of the
liver-GTV and intestinal tract. The planning constraint for the
standard liver volume (remnant liver volume irradiated <1 GyE)
was ≥35%.
Statistical analysis
Factors associated with the PIVKA-II flare phenomena
were analyzed by univariate analysis using the Fisher's exact test
as well as multivariate analyses using logistic regression model.
Age, gender, etiology, Child Pugh class, stage, previous treatment,
protocol, tumor marker rise before PT, transient increase in AFP
and size, and response at 12 months were included as variables for
univariate analysis. Variables with a P-value less than 0.1 in the
univariate analysis (non HBV/HCV disease and PIVKA-II rise before
PT) were included in the multivariate analysis. Relationship
between the PIVKA-II or AFP flare and out-of-field recurrence was
also assessed by Fisher's exact test. Mann-Whitney U test was used
to compare the median increase rates of PIVKA-II and AFP, and times
to peak PIVKA-II/AFP levels, times to recurrence between the
flare-positive and out-of-field recurrence groups, pretreatment
levels of PIVKA-II between the groups with and without flare
phenomena, and tumor size, GTV, and PTV with and without the flare.
A P-value <0.05 was considered significant. Statistical analyses
were performed using EZR (Easy R, Saitama Medical Center, Jichi
Medical University, Saitama, Japan), which is a modified version of
R commander (version 1.6–3) (19).
Results
Pretreatment levels of AFP and PIVKA-II were
elevated in 39 and 46%, respectively, of the patients with no
recurrence and, 48 and 61%, respectively, of the patients with
out-of-field recurrence (Table I).
Among the 59 patients with no recurrence, 23 (39%) had a PIVKA-II
flare and the median time to the flare peak was 6 months (Table II). The median transient increase
rate compared with the level at preceding examinations (i. e.,
level after elevation minus level before elevation/level before
elevation) was 111% (range, 24–3740%) for PIVKA-II. On the other
hand, AFP flares were observed in 5.1%. The median time to the
flare was 1 month and the median rate of increase was 32% (range,
30–42%).
| Table II.AFP and PIVKA-II levels in groups
with/without flare phenomena and transient increase on MRI. |
Table II.
AFP and PIVKA-II levels in groups
with/without flare phenomena and transient increase on MRI.
|
|
|
| Serum level/size
before PT |
|
|
|
|---|
|
|
|
|
|
|
|
|
|---|
| Variable | Flare/transient
increase | n | Median (range) | P | Pretreatment
elevation n (%) | Time to peak
(months) Median (range) | Increase rate%
Median (range) |
|---|
| AFP | + | 3 | 72 (25–408)
ng/ml | 0.0876 | 3 (100) | 1 (1–6) | 32 (30–42) |
|
| – | 56 | 11 (1–18667)
ng/ml |
| 20 (36) | N/A |
|
| PIVKA-II | + | 23 | 72 (18–1110)
AU/ml | 0.014 | 16 (70) | 6 (1–12) | 111 (24–3740) |
|
| – | 36 | 31 (12–35600)
AU/ml |
| 11 (31) | N/A |
|
| MRI finding | + | 3 | 19 (18–38) mm | 0.77 | N/A | 1 (1–3) | 22 (14–30) |
|
| – | 56 | 22 (8–133) mm |
|
| N/A |
|
No patient developed in-field recurrence during the
12-month follow-up, whereas 23 patients in the other group
developed out-of-field recurrence (Fig.
1). Table III compares data on
AFP and PIVKA-II levels between the groups with or without
recurrence. In the 23 patients with out-of-field recurrence, the
median increase rate of PIVKA-II (203%, range 70–2773) was higher
than that in the PIVKA-II-flare-positive group (111%, range
24–3740, P=0.035). The median time to recurrence was 9 months
(range, 1–12 months) and it was longer than the time to peak AFP
level (1 month) in the AFP-flare-positive group (P=0.033). Two of
12 (17%) patients with no pretreatment AFP elevation showed AFP
elevation at recurrence, and four of 9 (44%) patients with no
pretreatment PIVKA-II elevation showed PIVKA-II elevation at
recurrence. Seven of 11 (64%) patients with pretreatment AFP
elevation showed AFP elevation at recurrence, and 11 of 14 (79%)
patients with pretreatment PIVKA-II elevation showed PIVKA-II
elevation at recurrence.
| Table III.AFP and PIVKA-II data in the
out-of-field recurrence group vs. non-recurrence group. |
Table III.
AFP and PIVKA-II data in the
out-of-field recurrence group vs. non-recurrence group.
|
|
|
| Serum level before
PT |
|
|
|
|
|---|
|
|
|
|
|
|
|
|
|
|---|
| Variable | Recurrence | n | Median (range) | P | Pretreatment
elevation n (%) | Elevation at
recurrence n (%) | Time to recurrence
(months) Median (range) | Increase rate (%)
Median (range) |
|---|
| AFP | + | 23 | 19 (2–24216)
ng/ml | 0.36 | 11 (48) | 9 (39) | 9 (1–12) | 229 (22–1192) |
|
| – | 59 | 13 (1–18667)
ng/ml |
| 23 (39) | N/A |
|
|
| PIVKA-II | + | 23 | 123 (4–8220)
AU/ml | 0.14 | 14 (61) | 15 (65) | 9 (1–12) | 203 (70–2772) |
|
| – | 59 | 35 (12–35600)
AU/ml |
| 27 (46) | N/A |
|
|
In the no-recurrence group, the median longest tumor
diameter was 22 mm (range 8–133 mm) at diagnosis. Three (5.1%)
exhibited transient enlargement. The median time to peak
enlargement was 1 month (range, 1–3 months) after PT, and the
median increase rate was 22% (range, 14–30%) (Table II). Table
IV summarizes tumor size, GTV, and irradiated liver volume
(PTV) in groups with or without the flare phenomena. Median GTV of
tumors with AFP flare tended to be greater than that without AFP
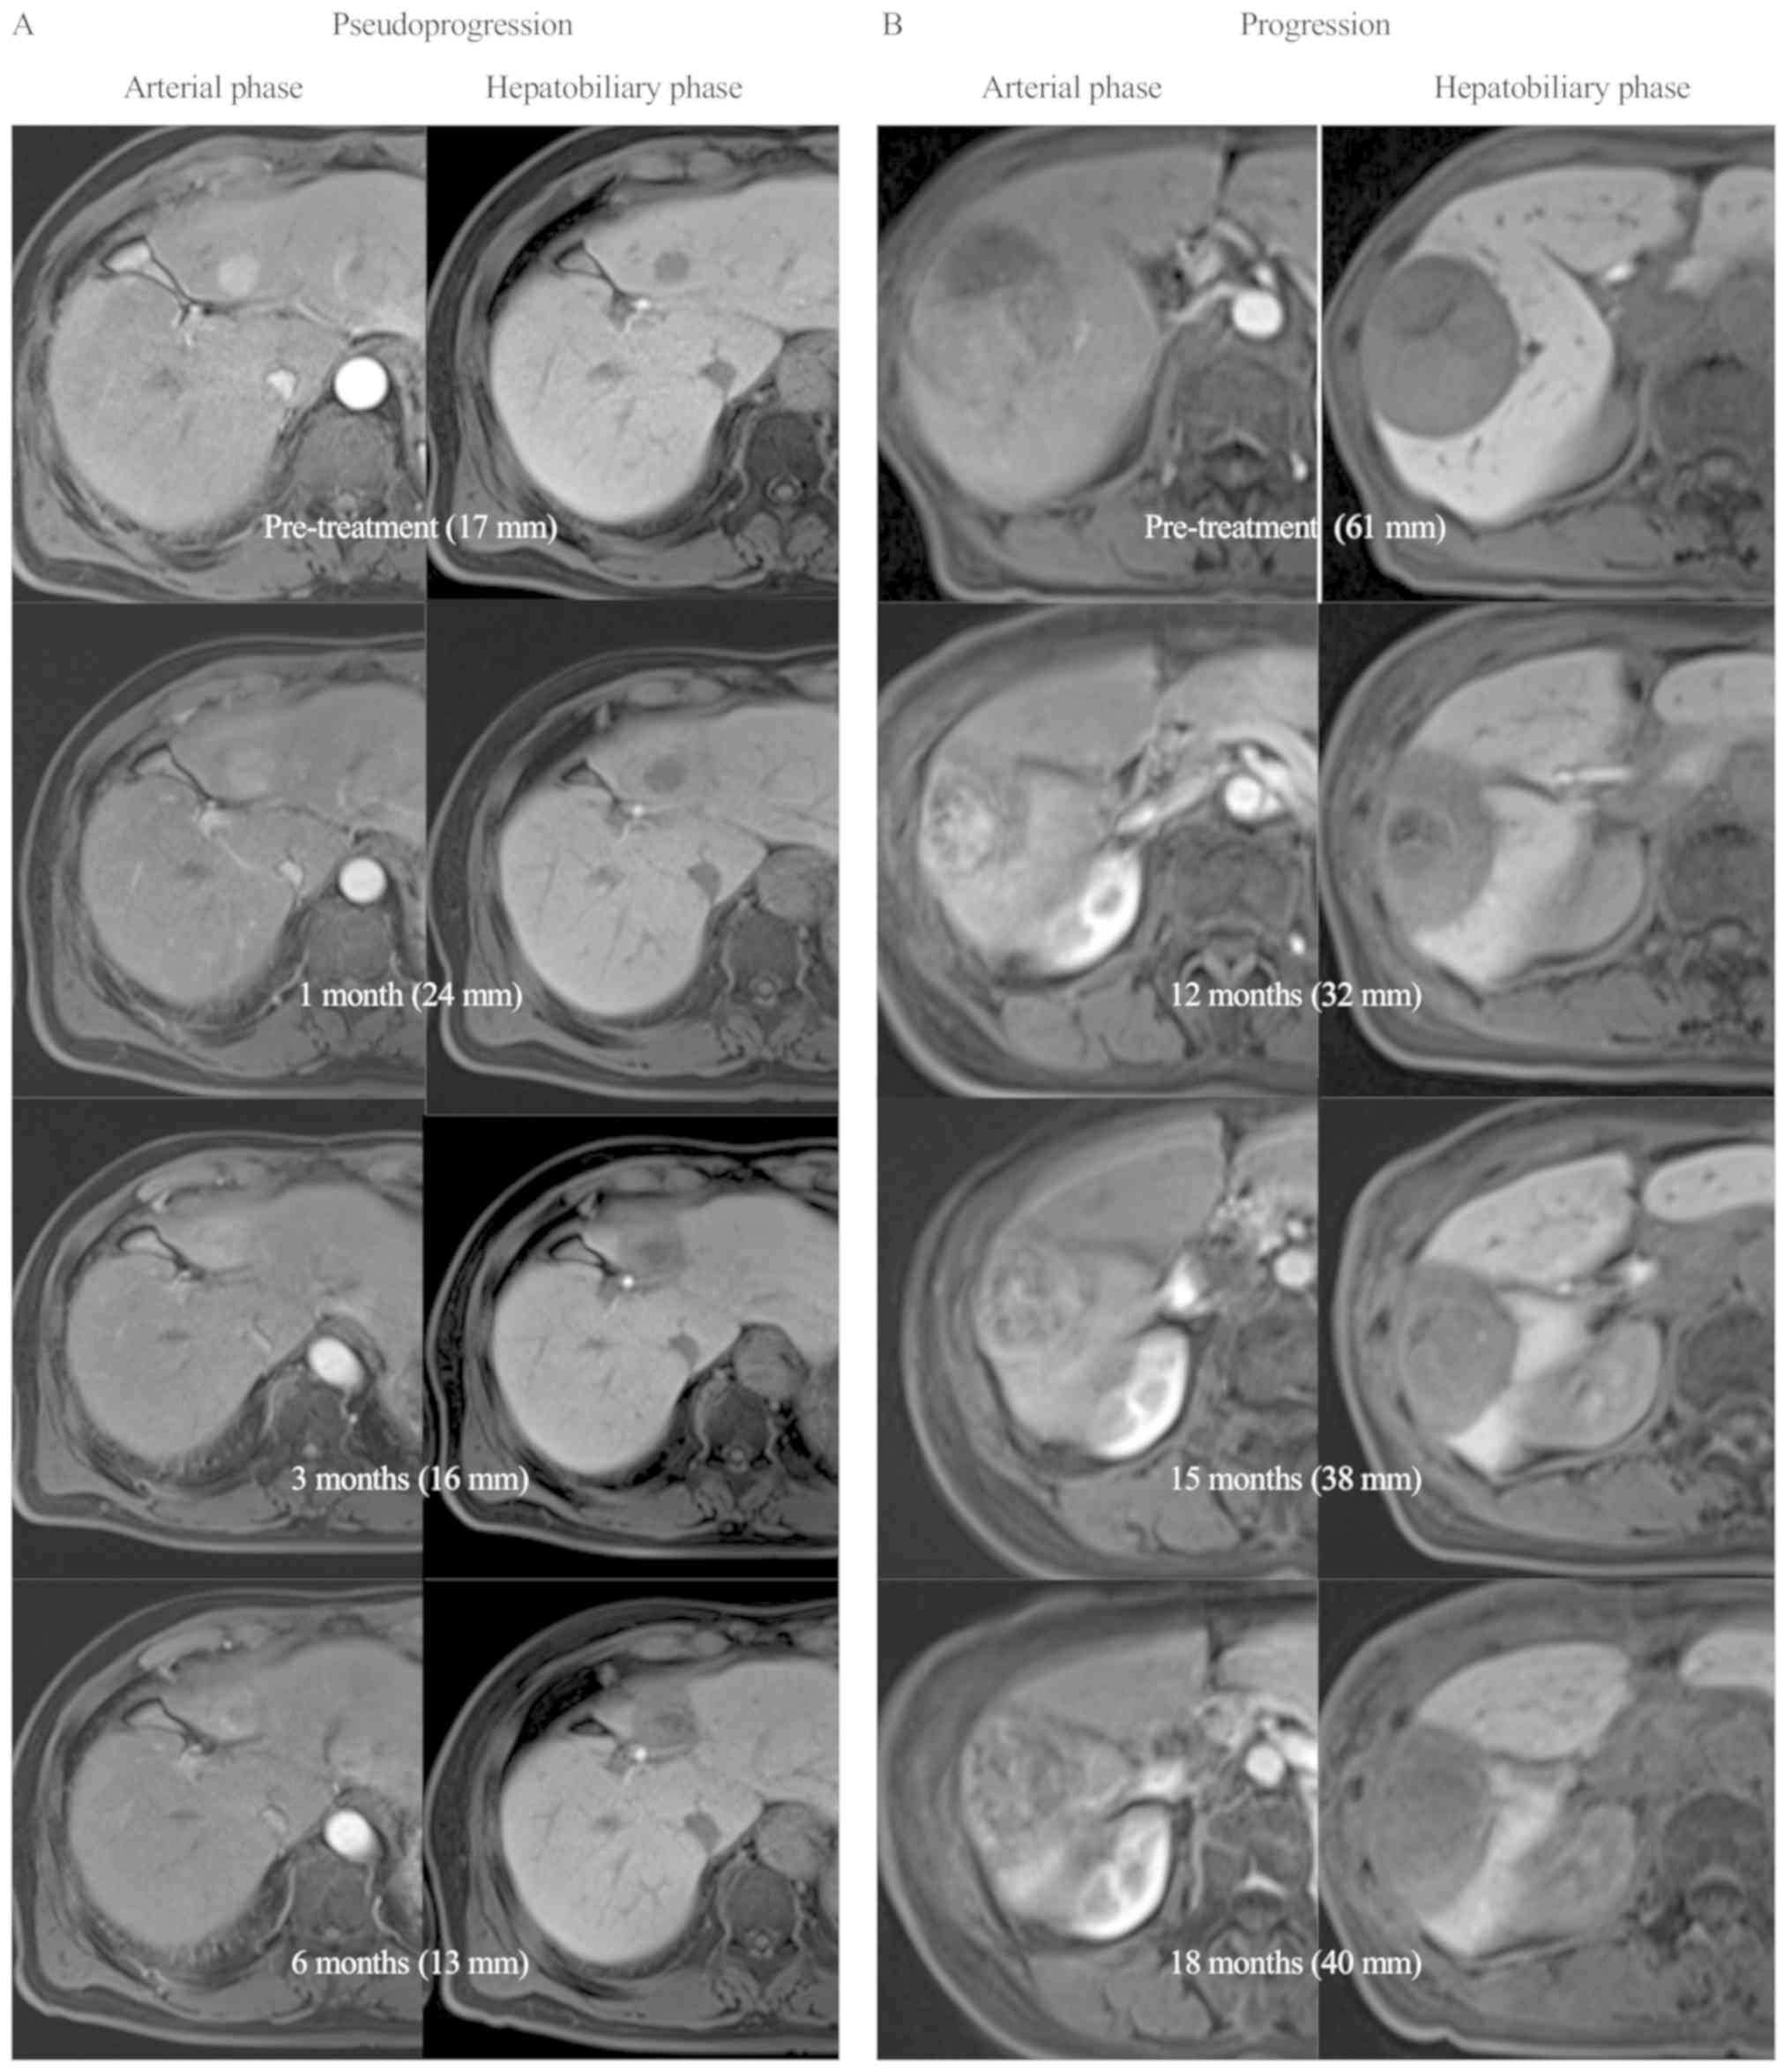
flare (P=0.094). Fig. 2A shows a
representative case of pseudoprogression in which the tumor size
enlarged at 1 month after PT but shrinked thereafter. Although
their sizes increased, contrast enhancement in the arterial phase
was weaker than the pretreatment levels. For reference, Fig. 2B shows a case with in-field recurrence
developing after the 12-month follow-up. The tumor size increased
at 15 months after PT and further at 18 months. This patient had a
PIVKA-II flare at 1 month after PT.
| Table IV.Longest diameter, gross tumor volume
(GTV), and planning target volume (PTV) in groups with or without
flare phenomena. |
Table IV.
Longest diameter, gross tumor volume
(GTV), and planning target volume (PTV) in groups with or without
flare phenomena.
|
| AFP | PIVKA-II |
|---|
|
|
|
|
|---|
| Variable | Flare + (n=3) | Flare - (n=56) | P | Flare + (n=23) | Flare - (n=36) | P |
|---|
| Longest diameter,
mm | 33 (21–36) | 22 (8–133) | 0.23 | 22 (8–109) | 22 (8–133) | 0.41 |
| Median (range) |
| GTV,
cm3 | 30 (17–36) | 10 (2–1824) | 0.09 | 12
(2–515) | 9 (2–1824) | 0.26 |
| Median
(range) |
| PTV,
cm3 | 93 (80–96) | 49 (17–2359) | 0.17 | 51
(18–855) | 50 (17–2359) | 0.52 |
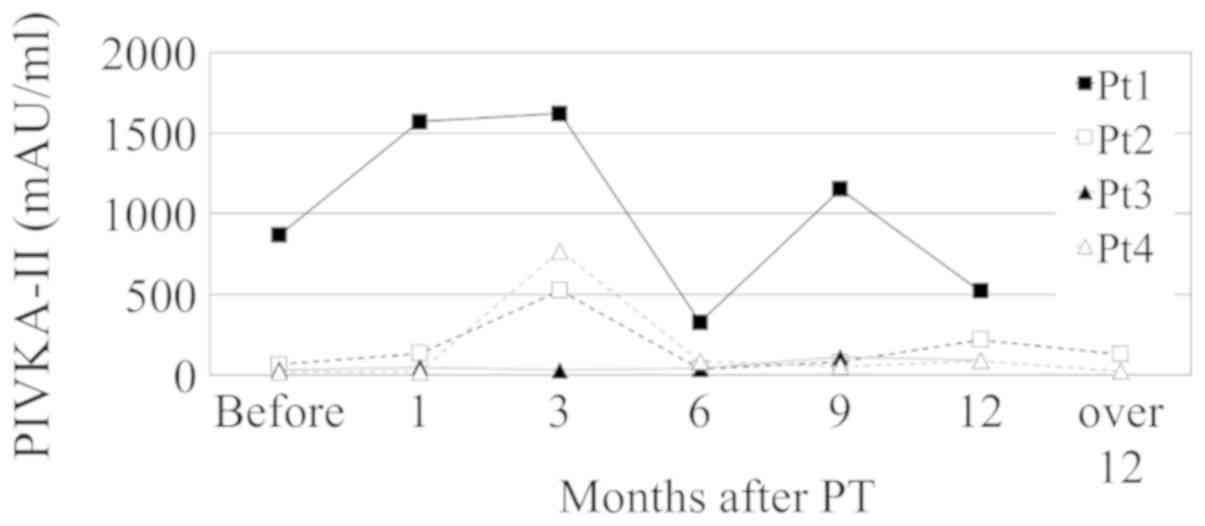
AFP and PIVKA-II flares were observed during two or
more follow-up visits in one and 8 patients, respectively. In one
patient, the transient increase of PIVKA-II lasted from 3 to 9
months, which was the longest flare duration. PIVKA-II flares were
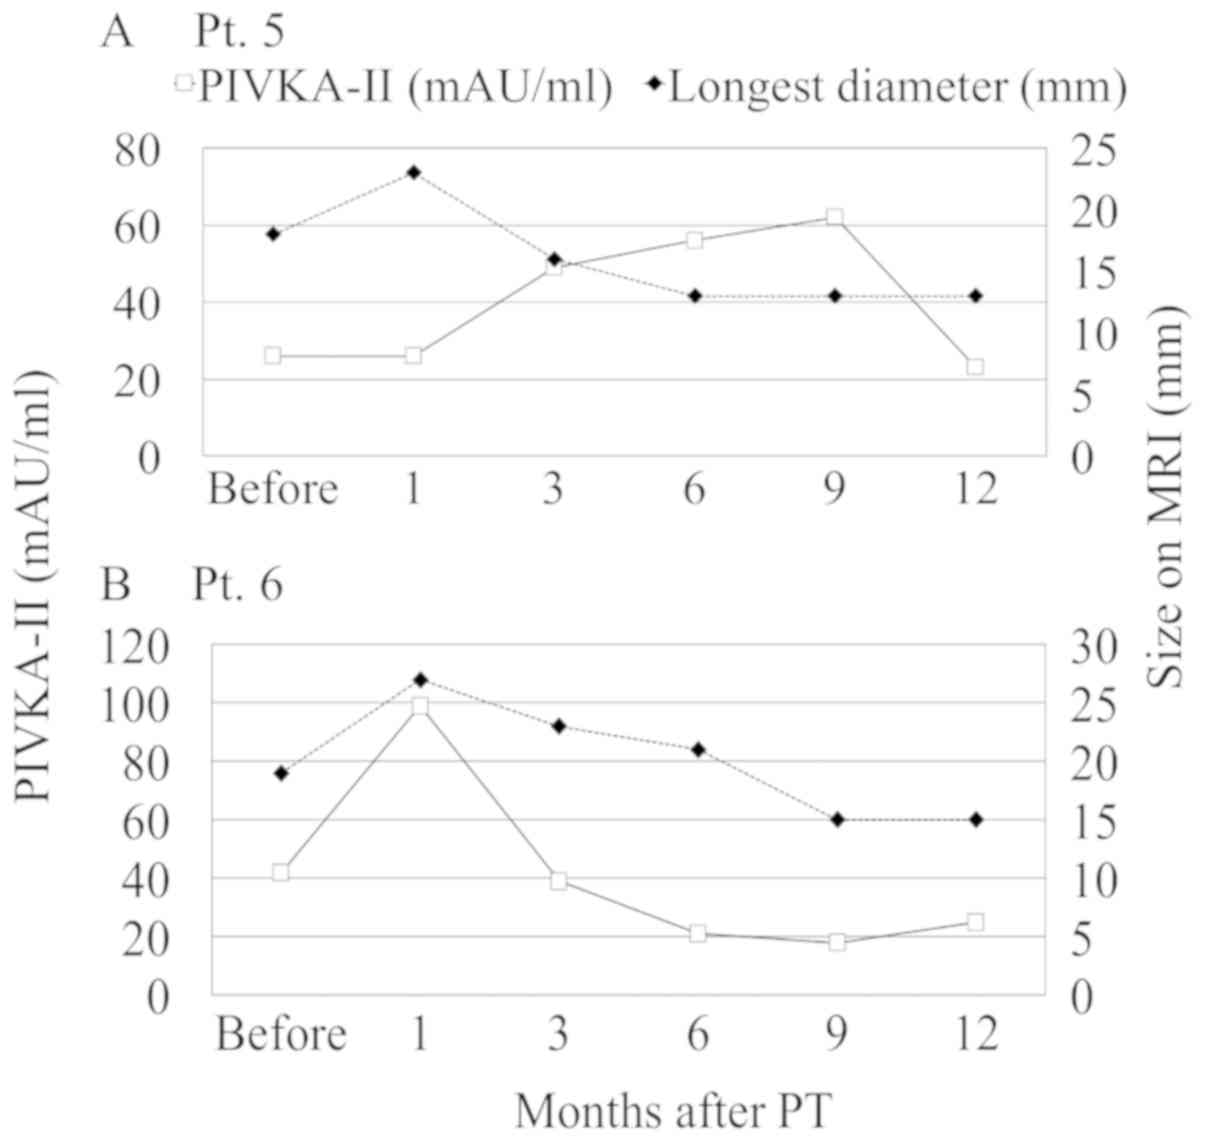
also observed twice during follow-up in four patients (Fig. 3). Both PIVKA-II flare and transient
tumor enlargement on MRI were observed in 2 patients (Fig. 4). Among them, 1 patient also had
simultaneous PIVKA-II flare and transient enlargement at 1 month
after PT (Fig. 4B).
Table V shows the
univariate and multivariate analyses used to detect factors
associated with the flare phenomenon of PIVKA-II. Age (< or
≥median, 67 years), gender, infection status of HCV and HBV,
Child-Pugh class, stage, previous treatment, PT protocol, tumor
marker elevation before PT, transient increase in AFP or size, and
response at 12 months after PT were selected as variables. In the
multivariate analysis, pretreatment elevation of PIVKA-II before PT
was associated with PIVKA-II flares (P=0.015, odds ratio 4.3, 95%
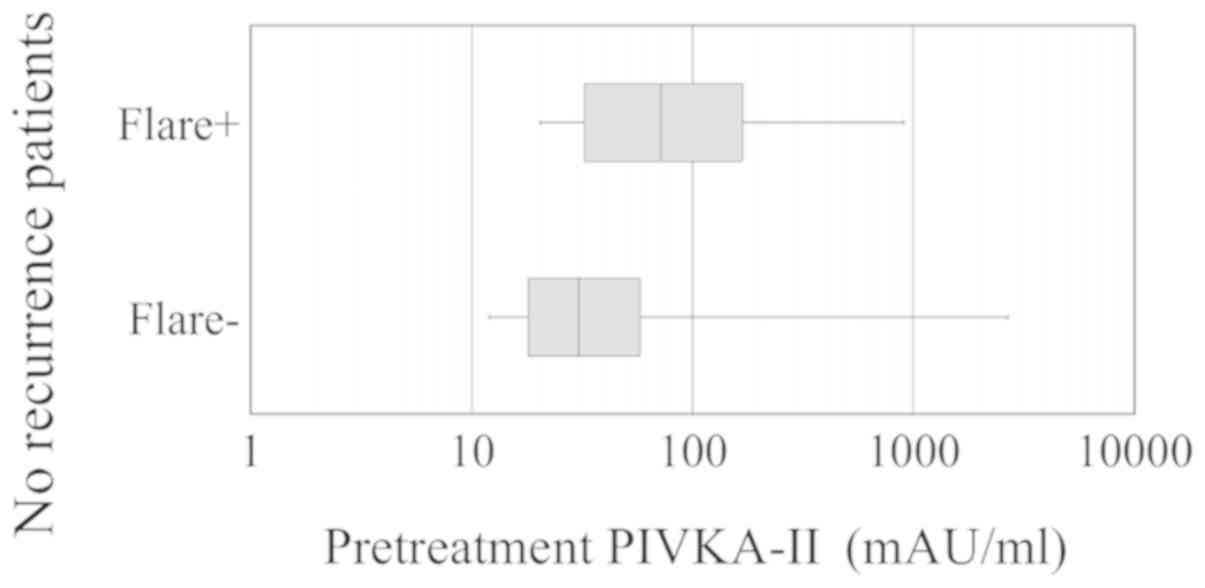
confidence interval 1.3–14.0). Fig. 5
shows pretreatment PIVKA-II serum levels in no-recurrence groups
with or without PIVKA-II flares; the PIVKA-II levels were higher in
the group with the flare than in the group without it (median, 72
and 30.5 mAU/ml, respectively; P=0.014).
| Table V.Univariate and multivariate analyses
of factors associated with flare phenomena of PIVKA-II. |
Table V.
Univariate and multivariate analyses
of factors associated with flare phenomena of PIVKA-II.
|
| P |
|---|
|
|
|
|---|
| Variables | Univariate
analysis | Multivariate
analysis |
|---|
| Age < vs. ≥ 67
years | 1 |
|
| Gender male vs.
female | 0.41 |
|
| Etiology |
|
|
| HCV
infected | 0.8 |
|
| HBV
infected | 0.13 |
|
| Non
HBV, non HCV | 0.08 | 0.24 |
| Child pugh class A
vs. B | 0.46 |
|
| Stage I vs. II | 0.49 |
|
| Previous
treatment | 0.24 |
|
| Protocol 66 vs.
72.6 GyE | 1 |
|
| Tumor marker rise
before PT |
|
|
|
AFP | 0.79 |
|
|
PIVKA-II | 0.0068 | 0.015 |
| Transient
increase |
|
|
|
AFP | 0.55 |
|
| Size on
MRI | 0.55 |
|
| Response at 12 M,
CR vs. other | 0.28 |
|
Regarding the relationship between the flare
phenomena and out-of-field recurrence, PIVKA-II flare tended to be
more often observed in the no-recurrence group (23/59=39%) than in
the out-of-field recurrence group (4/23=17%; P=0.072), but AFP
flare was not related to out-of-field recurrence (P=0.34).
Discussion
Besides imaging studies, serum levels of AFP and
PIVKA-II are good surveillance tools due to their wide utility, and
they complement image examinations to maximize early detection of
HCC (20). Recent studies suggested
that the combination of AFP and PIVKA-II improved the detection
rate of HCC, and was useful to measure treatment response and
monitor recurrence (21,22). As the combination of PIVKA-II and AFP
may increase sensitivity without decreasing specificity, the
guidelines of the Japan Society of Hepatology recommended to
measure these biomarkers during HCC surveillance (10). A recent study showed that the tumor
markers might elevate at 0.5–1.5 years before the HCC lesion
becomes obvious on diagnostic imaging (23). Furthermore, AFP and PIVKA-II elevation
may suggest micrometastases, which may result in early recurrence
within weeks or months after primary treatment (21,24).
Therefore, elevation of tumor markers within 1 year after primary
treatment requires special attention.
However, the present study indicated that transient
increases could be observed in both AFP and PIVKA-II levels during
the 12-month follow-up period after PT regardless of therapeutic
response. Compared to the out-of-field recurrence, the PIVKA-II
increase rates were considerably lower in the PIVKA-II-flare group
(P=0.035). The AFP-flare peak was observed earlier than in the
recurrence group (P=0.033), but this was not the case for PIVKA-II
(P=0.34). One case showed the transient increase lasting for more
than 6 months and in other cases, the flare phenomena were observed
twice during 12 months after PT. These observations might imply
that several mechanisms could be involved in the transient
increases. The flare phenomenon observed at early periods may be
related to tumor cell lysis, as reported for several cancers
treated by chemotherapy (11). In the
AFP-flare group, the tumor size (GTV) tended to be larger and the
flare tended to be observed at early periods; this observation
would support the hypothesis that the early flares would be caused
by HCC lysis. On the other hand, AFP elevation was also reported to
be triggered by acute hepatitis (25), and it was thought that damages to
liver cells may result in activation of hepatocyte turnover and
elevation of these tumor markers (26). In contrast, the late flare may be due
in part to focal liver parenchymal damage and/or compensatory
enlargement of unirradiated liver caused by PT (27,28).
PIVKA-II transient increases were observed through a year period
after PT and it was reported that liver cell damage triggered cell
regeneration followed by an increase of the PIVKA-II serum level
(23). Since AFP flare was not
observed in the later period, the AFP flare in this study might
have been mainly triggered by HCC lysis. Therefore, increases of
AFP level in the later period after PT may require careful
attention to recurrences.
In univariate and multivariate analyses, only
pretreatment elevation of PIVKA-II before PT was associated with
the PIVKA-II flare. It is not surprising that the flare phenomenon
more often occurs in patients with high pretreatment tumor marker
levels. In patients with a high pretreatment level, the flare
phenomenon was seen in 59% (16/27). Even in patients with a normal
pretreatment level, the phenomenon was observed in 22% (7/32). On
the other hand, PIVKA-II elevation at out-of-field recurrence was
observed in 79% (11/14) of patients with pretreatment PIVKA-II
elevation and in 44% (4/9) of patients with no pretreatment
elevation. Therefore, it seems difficult to estimate whether
post-PT elevation of PIVKA-II is the flare or recurrence from the
pretreatment level alone. Serial examinations are necessary to
distinguish between the two, but the increase rate would be of some
help, since the rate was higher in the recurrence group. In
addition, simultaneous evaluation of AFP levels should also be
helpful.
In our study, 5.1% of the patients exhibited
transient enlargement of the lesion on MRI at 1–3 months after PT.
Overall, contrast enhancement in the arterial phase was weaker than
that of the pretreatment lesion, which implies tumor necrosis and
decrease of HCC activity (29).
Although the mechanism of the transient enlargement was unclear, a
previous study indicated that radiation therapy could induce
sinusoidal congestion and hyperemia in the early phase after
irradiation (30). In that study, the
target lesion in some patients also showed transient enlargement
after radiation. PT would induce the same mechanism, which may
result in pseudoprogression of the target lesion. Moreover, as
shown in the present study, it is noteworthy that a transient
elevation in the PIVKA-II level and pseudoprogression on MRI could
be observed simultaneously in the early period after PT. In order
to predict whether tumor recurrence will indeed occur, a dynamic
imaging study should be performed to assess obvious arterial uptake
and wash-out in the delayed phase as well as treatment-induced
necrosis, which was recently proposed in modified RECIST and
RECICLE to assess treatment response of HCC (31,32).
Our study has several limitations. The study size
was relatively small and the patients had various backgrounds. In
addition, the definition of flare in our study was arbitrary.
Therefore, the conclusion might be biased by these factors.
Moreover, as the follow-up duration in this study was relatively
short, it was inconclusive whether the transient increase was
related with eventual development of HCC. Further studies are
required to ensure whether other locoregional treatments, such as
RFA, also cause transient increases in tumor markers to investigate
the mechanism of the flare phenomenon.
In summary, increases in tumor marker serum levels
as well as tumor size on imaging examination should be assessed
with extra caution to avoid misinterpretation of therapeutic
outcome. The combination of the serum biomarkers AFP and PIVKA-II
and dynamic imaging examination is essential to monitor tumor
progression after PT.
Acknowledgements
The authors would like to thank Dr Kyoji Senoo and
Dr Yoshiyuki Kuwahara at the Nagoya Proton Therapy Center for their
help in this research.
Funding
This study was supported by Grants-in-Aid for JSPS
KAKENHI (grant nos. 15K10005, 15K10006 and 16K10400).
Availability of data and materials
The datasets used and/or analyzed during the current
study are available from the corresponding author on reasonable
request.
Authors' contributions
MY, HO, YuS and JM designed the study. MY, HO, HI,
YH, SH, KN, SS, MH, YuS, YoS and JM analyzed and interpreted the
patient data regarding flare phenomena in tumor markers of HCC
following proton therapy. YuS drafted the manuscript and revised it
critically for important intellectual content. All authors read and
approved the final manuscript.
Ethics approval and consent to
participate
The protocols for this research were approved by the
institutional review board [no. 12-02-22 (18)]. Written informed consents to
participate in the present research were provided prior to PT.
Patient consent for publication
Written informed consents for the publication were
obtained from all patients in this research.
Competing interests
The authors declare that they have no competing
interests.
References
|
1
|
Ferlay J, Soerjomataram I, Dikshit R, Eser
S, Mathers C, Rebelo M, Parkin DM, Forman D and Bray F: Cancer
incidence and mortality worldwide: Sources, methods and major
patterns in GLOBOCAN 2012. Int J Cancer. 136:E359–E386. 2015.
View Article : Google Scholar : PubMed/NCBI
|
|
2
|
Osaki Y and Nishikawa H: Treatment for
hepatocellular carcinoma in Japan over the last three decades: Our
experience and published work review. Hepatol Res. 45:59–74. 2015.
View Article : Google Scholar : PubMed/NCBI
|
|
3
|
Llovet JM, Burroughs A and Bruix J:
Hepatocellular carcinoma. Lancet. 362:1907–1917. 2003. View Article : Google Scholar : PubMed/NCBI
|
|
4
|
Sakurai H, Ishikawa H and Okumura T:
Proton beam therapy in Japan: Current and future status. Jpn J Clin
Oncol. 46:885–892. 2016. View Article : Google Scholar : PubMed/NCBI
|
|
5
|
Fukuda K, Okumura T, Abei M, Fukumitsu N,
Ishige K, Mizumoto M, Hasegawa N, Numajiri H, Ohnishi K, Ishikawa
H, et al: Long-term outcomes of proton beam therapy in patients
with previously untreated hepatocellular carcinoma. Cancer Sci.
108:497–503. 2017. View Article : Google Scholar : PubMed/NCBI
|
|
6
|
Tabrizian P, Jibara G, Shrager B, Schwartz
M and Roayaie S: Recurrence of hepatocellular cancer after
resection: Patterns, treatments, and prognosis. Ann Surg.
261:947–955. 2015. View Article : Google Scholar : PubMed/NCBI
|
|
7
|
Chan AC, Chan SC, Chok KS, Cheung TT, Chiu
DW, Poon RT, Fan ST and Lo CM: Treatment strategy for recurrent
hepatocellular carcinoma: Salvage transplantation, repeated
resection, or radiofrequency ablation? Liver Transpl. 19:411–419.
2013. View
Article : Google Scholar : PubMed/NCBI
|
|
8
|
Midorikawa Y, Takayama T, Higaki T,
Nakayama H, Yamamoto M, Ariizumi S, Shimada K, Kokudo N, Tsuji S,
Tsuchiya K, et al: Early hepatocellular carcinoma as a signaling
lesion for subsequent malignancy. Jpn J Clin Oncol. 46:1102–1107.
2016. View Article : Google Scholar : PubMed/NCBI
|
|
9
|
Kudo M, Izumi N, Kokudo N, Matsui O,
Sakamoto M, Nakashima O, Kojiro M and Makuuchi M; HCC Expert Panel
Of Japan Society Of Hepatology, : Management of hepatocellular
carcinoma in Japan: Consensus-based clinical practice guidelines
proposed by the Japan society of hepatology (JSH) 2010 updated
version. Dig Dis. 29:339–364. 2011. View Article : Google Scholar : PubMed/NCBI
|
|
10
|
The Japan Society of Hepatology: Clinical
practice guidelines for hepatocellular carcinoma (2013 version).
https://www.jsh.or.jp/English/guidelines_en/Guidelines_for_hepatocellular_carcinoma_2013
|
|
11
|
Kim HJ, Lee KW, Kim YJ, Oh DY, Kim JH, Im
SA and Lee JS: Chemotherapy-induced transient CEA and CA19-9 surges
in patients with metastatic or recurrent gastric cancer. Acta
Oncol. 48:385–390. 2009. View Article : Google Scholar : PubMed/NCBI
|
|
12
|
Mundle SD, Marathe AS and Chelladurai M:
Transient therapy-related surge in serum tumor biomarkers:
Characterizing behavior and postulating its biologic role. Crit Rev
Oncol Hematol. 86:15–22. 2013. View Article : Google Scholar : PubMed/NCBI
|
|
13
|
Venniyoor A, Al Bahrani B and Rajan B: The
dilemma of serum tumor marker (STM) flares. Gulf J Oncolog.
1:63–67. 2014.PubMed/NCBI
|
|
14
|
Therasse P, Arbuck SG, Eisenhauer EA,
Wanders J, Kaplan RS, Rubinstein L, Verweij J, Van Glabbeke M, van
Oosterom AT, Christian MC and Gwyther SG: New guidelines to
evaluate the response to treatment in solid tumors. European
organization for research and treatment of cancer, national cancer
institute of the United States, national cancer institute of
canada. J Natl Cancer Inst. 92:205–216. 2000. View Article : Google Scholar : PubMed/NCBI
|
|
15
|
Iwata H, Ogino H, Hashimoto S, Yamada M,
Shibata H, Yasui K, Toshito T, Omachi C, Tatekawa K, Manabe Y, et
al: Spot scanning and passive scattering proton therapy: Relative
biological effectiveness and oxygen enhancement ratio in cultured
cells. Int J Radiat Oncol Biol Phys. 95:95–102. 2016. View Article : Google Scholar : PubMed/NCBI
|
|
16
|
Toshito T, Omachi C, Kibe Y, Sugai H,
Hayashi K, Shibata H, Yasui K, Tanaka K, Yamamoto T, Yoshida A, et
al: A proton therapy system in nagoya proton therapy center.
Australas Phys Eng Sci Med. 39:645–654. 2016. View Article : Google Scholar : PubMed/NCBI
|
|
17
|
Nakajima K, Iwata H, Ogino H, Hattori Y,
Hashimoto S, Nakanishi M, Toshito T, Umemoto Y, Iwatsuki S,
Shibamoto Y and Mizoe JE: Acute toxicity of image-guided
hypofractionated proton therapy for localized prostate cancer. Int
J Clin Oncol. 23:353–360. 2018. View Article : Google Scholar : PubMed/NCBI
|
|
18
|
Hashimoto S, Shibamoto Y, Iwata H, Ogino
H, Shibata H, Toshito T, Sugie C and Mizoe JE: Whole-pelvic
radiotherapy with spot-scanning proton beams for uterine cervical
cancer: A planning study. J Radiat Res. 57:524–532. 2016.
View Article : Google Scholar : PubMed/NCBI
|
|
19
|
Kanda Y: Investigation of the freely
available easy-to-use software ‘EZR’ for medical statistics. Bone
Marrow Transplant. 48:452–458. 2013. View Article : Google Scholar : PubMed/NCBI
|
|
20
|
Song P, Cai Y, Tang H, Li C and Huang J:
The clinical management of hepatocellular carcinoma worldwide: A
concise review and comparison of current guidelines from 2001 to,
2017. Biosci Trends. 11:389–398. 2017. View Article : Google Scholar : PubMed/NCBI
|
|
21
|
Ueno M, Hayami S, Shigekawa Y, Kawai M,
Hirono S, Okada K, Tamai H, Shingaki N, Mori Y, Ichinose M and
Yamaue H: Prognostic impact of surgery and radiofrequency ablation
on single nodular HCC ≤5 cm: Cohort study based on serum HCC
markers. J Hepatol. 63:1352–1359. 2015. View Article : Google Scholar : PubMed/NCBI
|
|
22
|
Park SJ, Jang JY, Jeong SW, Cho YK, Lee
SH, Kim SG, Cha SW, Kim YS, Cho YD, Kim HS, et al: Usefulness of
AFP, AFP-L3, and PIVKA-II, and their combinations in diagnosing
hepatocellular carcinoma. Medicine (Baltimore). 96:e58112017.
View Article : Google Scholar : PubMed/NCBI
|
|
23
|
Yu R, Tan Z, Xiang X, Dan Y and Deng G:
Effectiveness of PIVKA-II in the detection of hepatocellular
carcinoma based on real-world clinical data. BMC Cancer.
17:6082017. View Article : Google Scholar : PubMed/NCBI
|
|
24
|
Sherman M: Recurrence of hepatocellular
carcinoma. N Engl J Med. 359:2045–2047. 2008. View Article : Google Scholar : PubMed/NCBI
|
|
25
|
Bae JS, Park SJ, Park KB, Paik SY, Ryu JK,
Choi CK and Hwang TJ: Acute exacerbation of hepatitis in liver
cirrhosis with very high levels of alpha-fetoprotein but no
occurrence of hepatocellular carcinoma. Korean J Intern Med.
20:80–85. 2005. View Article : Google Scholar : PubMed/NCBI
|
|
26
|
Xing H, Yan C, Cheng L, Wang N, Dai S,
Yuan J, Lu W, Wang Z, Han J, Zheng Y and Yang T: Clinical
application of protein induced by vitamin K antagonist-II as a
biomarker in hepatocellular carcinoma. Tumour Biol. Oct
13–2016.(Epub ahead of print). View Article : Google Scholar
|
|
27
|
Takamatsu S, Yamamoto K, Maeda Y, Kawamura
M, Shibata S, Sato Y, Terashima K, Shimizu Y, Tameshige Y, Sasaki
M, et al: Evaluation of focal liver reaction after proton beam
therapy for hepatocellular carcinoma examined using Gd-EOB-DTPA
enhanced hepatic magnetic resonance imaging. PLoS One.
11:e01671552016. View Article : Google Scholar : PubMed/NCBI
|
|
28
|
Imada H, Kato H, Yasuda S, Yamada S,
Yanagi T, Hara R, Kishimoto R, Kandatsu S, Minohara S, Mizoe JE, et
al: Compensatory enlargement of the liver after treatment of
hepatocellular carcinoma with carbon ion radiotherapy-relation to
prognosis and liver function. Radiother Oncol. 96:236–242. 2010.
View Article : Google Scholar : PubMed/NCBI
|
|
29
|
Arora A and Kumar A: Treatment response
evaluation and follow-up in hepatocellular carcinoma. J Clin Exp
Hepatol. 4 Suppl 3:S126–S129. 2014. View Article : Google Scholar : PubMed/NCBI
|
|
30
|
Brook OR, Thornton E, Mendiratta-Lala M,
Mahadevan A, Raptopoulos V, Brook A, Najarian R, Sheiman R and
Siewert B: CT imaging findings after stereotactic radiotherapy for
liver tumors. Gastroenterol Res Pract. 2015:1262452015. View Article : Google Scholar : PubMed/NCBI
|
|
31
|
Lencioni R and Llovet JM: Modified RECIST
(mRECIST) assessment for hepatocellular carcinoma. Semin Liver Dis.
30:52–60. 2010. View Article : Google Scholar : PubMed/NCBI
|
|
32
|
Kudo M, Ueshima K, Kubo S, Sakamoto M,
Tanaka M, Ikai I, Furuse J, Murakami T, Kadoya M and Kokudo N;
Liver Cancer Study Group of Japan, : Response evaluation criteria
in cancer of the liver (RECICL) (2015 revised version). Hepatol
Res. 46:3–9. 2016. View Article : Google Scholar : PubMed/NCBI
|