Introduction
Hepatocellular carcinoma (HCC) is the third most
frequent cause of cancer-associated mortality worldwide (1). There is a high incidence in East and
South East Asia, which is associated with the prevalence of
hepatitis B virus in these regions (2). Surgical resection remains the principle
choice of treatment for patients with preserved liver function;
however, 60–70% of patients develop metastasis and recurrence
within 5 years of surgery or transcatheter arterial
chemoembolization (3). Although
several clinicopathological features, including poor
differentiation status, large-sized tumors and portal venous
invasion, have been demonstrated to contribute to the poor
prognosis of patients with HCC prior to surgery (4), the molecular mechanisms underlying the
development of HCC remain unknown. Thus, it is critical to uncover
the pathogenesis of HCC.
Scinderin (SCIN) is a calcium-dependent actin
filament serving and capping protein that belongs to the gesolin
superfamily (5). Previous studies
have demonstrated that SCIN regulates vesicle transport and
exocytosis in endocrine and secretory cells by organizing the
cytoskeleton (6,7). SCIN can also regulate cell
differentiation through the MAP kinases P38 and ERK1/2-mediated
signaling pathways (8,9). The dysregulation of SCIN has been
reported in several types of cancer, but these reports have not
been consistent. In lung and prostate cancer cell lines,
SCIN-knockdown was demonstrated to inhibit cell proliferation
(10,11), and SCIN was overexpressed in gastric
cancer (12). SCIN-knockdown in
gastric cell lines decreased the metastatic ability of these cells
(13). These results suggest that
SCIN may function as an oncogene. However, in megakaryoblastic
leukemia and acute myeloid leukemia, SCIN was downregulated, and
overexpression of SCIN in leukemia cell lines was demonstrated to
inhibit cell proliferation (8,14).
Furthermore, SCIN was demonstrated to be weakly expressed in head
and neck cancer, and its expression could not predict prognosis
(15). Thus, the function of SCIN in
cancer remains under debate.
The present study examined the expression pattern of
SCIN in HCC and investigated the exact function of this protein in
HCC cells. Key molecules influenced by SCIN were also detected.
Materials and methods
Patients and specimens
Fresh tumor tissue samples and paired non-cancerous
liver tissue samples of 12 patients with HCC were obtained
following hepatectomy at the Eastern Hepatobiliary Hospital
(Shanghai, China) between March 2016 and May 2016. A total of 60
paraffin-embedded HCC samples were also collected from the Eastern
Hepatobiliary Hospital, between March 2005 and August 2007.
Patients were aged between 29 and 70 years (mean age, 48 years).
There were 51 men (85%) and 9 women (15%). The key inclusion
criteria were as follows: HCC diagnosed by biopsy or by the
non-invasive criteria of the European Association for the Study of
Liver guidelines (16). The key
exclusion criteria included patients with a history of other
malignancies in the past 5 years. A tissue microarray (TMA) was
created from these samples. Western blot assays were performed in
order to confirm the specificity of SCIN staining in the fresh HCC
tissues and paired non-cancerous liver tissues, and in the SK-HEP-1
and YY-8103 cell lines. The patients had not received radiotherapy
or chemotherapy prior to surgical treatment. The clinical and
pathological data of the 60 patients with HCC were collected.
Clinical follow-up information was obtained by telephone or from
the outpatient records.
The present study was approved by the Medical Ethics
Committee of Eastern Hepatobiliary Surgery Hospital and all
patients provided written informed consent prior to the study.
Participants were recruited and experiments were conducted in the
Eastern Hepatobiliary Surgery Hospital.
Cell culture conditions
Cell culture
The HCC cell lines YY-8103, SK-HEP-1, QGY, MHCC97-H,
Huh7 and 293T were purchased from The Cell Bank of Type Culture
Collection of the Chinese Academy of Sciences. CSQT-2 was
established in our laboratory as previously described (17). The cells were maintained in DMEM
(Gibco; GE Healthcare Life Sciences) supplemented with 10% fetal
bovine serum (ExCell Bio), penicillin (100 U/ml) and streptomycin
(100 U/ml) at 37°C in a humidified 5% CO2
atmosphere.
Western blot analysis
Total protein was extracted from SK-HEP-1 and
YY-8103 cells and HCC tissue samples using RIPA buffer with
protease inhibitor (Sigma-Aldrich; Merck KGaA), and protein
concentrations were determined via the Bradford method. Proteins
(30 µg) were separated by 10% SDS-PAGE, and subsequently
transferred onto polyvinylidene difluoride membranes (EMD
Millipore). The membranes were blocked for 1 h at room temperature
with 5% non-fat milk in TBST solution, prior to incubation with the
primary antibody anti-SCIN (1:1,000; cat. no. HPA024264;
Sigma-Aldrich; Merck KGaA), anti-cyclin A1 (1:1,000; cat. no.
556600; BD Pharmingen; BD Biosciences), anti-STAT3 and anti-pSTAT3
(Tyr705) (1:1,000; cat. nos. 4904S and 9145S, respectively; Cell
Signaling Technology, Inc.) overnight at 4°C. Membranes were washed
three times with TBST, and were incubated with the horseradish
peroxidase-conjugated secondary antibodies anti-rabbit IgG and
anti-mouse IgG (1:1,000; cat. nos. 7074 and 7076, respectively;
Cell Signaling Technology, Inc.) for 1 h at room temperature.
Membranes were re-washed with TBST three times, and protein bands
were subsequently visualized using an enhanced chemiluminescence
system (cat. no. 32209, Pierce™ ECL; Thermo Fisher Scientific,
Inc.), according to the manufacturer's protocol (18). Protein expression was quantified
using ImageJ 1.8 software (National Institutes of Health), and the
number under each band was calculated as the result divided by
GAPDH.
Vector construction and
transfection
The pHAGE-EF1a- IRES-GFP vector, which was a gift
from Chenqi Xu at the Shanghai Institute of Biochemistry and Cell
Biology, CAS, was used in order to generate the overexpression
virus in 293T cells. The SCIN short hairpin (sh)-RNA plasmid was
purchased from GeneChem Biotechnology. Fluorescence-activated cell
sorting (FACS) was used in order to enrich green fluorescent
protein (GFP)-positive cells.
In order to establish stable cell lines, the
pHAGE-EF1a- IRES-GFP empty vector was used as the control for SCIN
overexpression and a plasmid containing a scrambled sequence
(5′-CCTAAGGTTAAGTCGCCCTCGCTCGAGCGAGGGCGACTTAACCTTAGG-3′; cat. no.
1864; Addgene) was used as the control for SCIN-knockdown. In order
to produce the lentivirus, 293T cells were transfected with the
aforementioned core plasmids, along with the packaging plasmids
psPAX2 and pMD2.G (cat. nos. 12260 and 12259, respectively;
Addgene) at a ratio of 12:8:4 µg and the Lipofectamine®
2000 transfection reagent (Thermo Fisher Scientific, Inc.). Viruses
were harvested at 72 h post transfection (medium was refreshed
every 24 h). Transfection of HCC cells was performed in 6-well
plates with polybrene at a final concentration of 2.5 µg/ml for 24
h. Cells were sorted for GFP signals by FACS using FACSAria
(Beckman Coulter, Inc.). Overexpression and knockdown efficacies
were demonstrated by western blot analysis.
Reverse transcription-quantitative PCR
(RT-qPCR) analysis (19)
Total RNA from tissues was extracted using
TRIzol® reagent (Invitrogen; Thermo Fisher Scientific,
Inc.), according to the manufacturer's protocol. Total RNA was
reverse transcribed to cDNA (cat. no. A3500; Promega Corporation).
qPCR was subsequently performed using the CFX96 Real-Time System
(Bio-Rad Laboratories, Inc.), and the SYBR® Green 26
Master mix (Invitrogen; Thermo Fisher Scientific, Inc.) was used in
a total reaction volume of 10 µl. The PCR procedure was as follows:
95°C for 7 min; 95°C for 5 sec, 60°C for 30 sec (data collection),
60°C for 30 sec, 40 cycles; 60–95°C (data collection), 20°C for 10
sec. The primers used were as follows: SCIN forward,
5′-CGAGGCTTCACCTACCA-3′ and reverse, 5′-CACTCTACGACCCTTCACA-3′; and
actin (reference gene) forward, 5′-GATCATTGCTCCTCCTGAGC-3′ and
reverse, 5′-ACTCCTGCTTGCTGATCCAC-3′.
Immunohistochemistry (IHC)
IHC staining was performed as previously described
(20). All sections (including TMA)
were deparaffinized with xylene at 65°C for 30 min and at room
temperature for 20 min, and rehydrated in a descending ethanol
series. Subsequently, the 10-µm sections were submerged in EDTA
antigenic retrieval buffer (pH 8.0) and microwaved in boiling water
for 20 min for antigenic retrieval. Tissue sections were incubated
with 0.3% H2O2 at room temperature for 15 min
to inhibit endogenous peroxidase activity and subsequently blocked
with 1% normal goat serum (cat. no. 5425; Cell Signaling
Technology, Inc.) at room temperature for 30 min in order to
decrease non-specific binding. Tissue sections were incubated with
rabbit polyclonal anti-SCIN antibody (1:200; cat. no. HPA024264;
Sigma-Aldrich; Merck KGaA) overnight at 4°C. Following three washes
with TBS, sections were incubated with horseradish
peroxidase-linked anti-rabbit antibody (1:200; cat. no. 7074; Cell
Signaling Technology, Inc.) for 30 min at 37°C. The slides were
subsequently stained with 3,3′-diaminobenzidine. Images were
captured at ×40 and ×200 magnification using a light microscope
(BX61; Olympus Corporation).
The stained tissue sections were scored
independently by two pathologists blinded to the clinical
parameters, and the final score was the average of the scores
recorded by the two observers. The present study used the intensity
and extent of staining in order to evaluate SCIN expression. The
staining intensity was scored as follows: 0, no staining; 1, weak
staining exhibited as light yellow; 2, moderate staining exhibited
as yellow/brown; and 3, strong staining exhibited as brown. The
extent of staining was scored according to the percentages of the
positively stained areas as follows: 0, 0; 1, 1–25; 2, 26–50; 3,
51–75; and 4, 76–100%. The product of the intensity score
multiplied by the extent score was used as the final staining
H-score (0–12) for SCIN. For the
purpose of statistical evaluation, tumors with an H-score of <6
were classified into the low SCIN expression group and those with
an H-score of ≥6 were classified into the high SCIN expression
group.
Colony formation assay
For the colony formation assay, SK-HEP-1 and YY-8103
cells were seeded into 6-well plates at a density of 1,000
cells/well and cultured for 7 days. Subsequently, the cells were
fixed with 10% methanol at room temperature for 10 min and stained
with 1% crystal violet at room temperature for 1 min. The
experiment was performed in triplicate for each group of cells.
Images were captured at ×40 and ×100 magnification using an
inverted light microscope (IX71; Olympus Corporation).
MTT assay
SK-HEP-1 and YY-8103 cells were seeded into 96-well
plates at a density of 500 cells/well. Every 24 h of the subsequent
5 days, cells were incubated with 0.2% MTT solution (cat. no.
A600799; Sangon Biotech Co. Ltd.) for 4 h at 37°C. Following the
MTT incubation, the purple formazan crystals were dissolved in 200
µl of DMSO (cat. no. A100231; Sangon Biotech Co., Ltd.) and cell
proliferation was subsequently analyzed at a wavelength of 490
nm.
Cell cycle analysis
Cell cycle progression was analyzed by flow
cytometry. SK-HEP-1 and YY-8103 cells at ~70% confluence were
washed three times with PBS and fixed with 75% ethanol at 4°C
overnight. Subsequently, the cells were stained with propidium
iodide and RNase overnight at 4°C. Samples were analyzed using the
Cell Lab Quanta Flow Cytometer (Beckman Coulter, Inc.).
Tumor formation in an animal
model
An equal number of SK-HEP-1 and YY-8103 cells
(1×10⁶ cells) were injected subcutaneously into the left
and right flanks of nine male, 5-week old, nude mice (weight,
15–17.5 g; Shanghai SLAC Laboratory Animal Co., Ltd.),
respectively. Mice were housed with free access to regular chow
diet under specific pathogen-free conditions in laboratory cages at
23±3°C at 35±5% humidity under a 12-h dark/light cycle. The
tumorigenesis procedure was recorded by measuring solid tumors in 3
dimensions with a caliper for 4 weeks. Animals were sacrificed 4
weeks after the injection. The maximum tumor volume presented was
103.68 mm3. The experiments on mice were approved by the
Ethics Committee of Eastern Hepatobiliary Surgery Hospital.
Statistical analysis
Statistical analyses were performed using SPSS
software (version 19.0; IBM Corp.). The significance of SCIN mRNA
levels was determined using Student's t-test. The χ2
test was used in order to analyze the association between SCIN
expression and clinicopathological characteristics. Survival times
were evaluated using Kaplan-Meier survival curves, and differences
in survival were analyzed using the log-rank test. The significance
of variables for survival was analyzed by multivariate survival
analysis using Cox's regression model. P<0.05 was considered to
indicate a statistically significant difference.
Results
SCIN is downregulated in human
HCC
In order to determine the expression pattern of SCIN
in HCC tissues, the present study detected mRNA expression in 48
paired HCC tissues and their normal counterparts via RT-qPCR. The
results demonstrated that SCIN was downregulated in 39 out of 48 of
the paired tissues (Fig. 1A). In
order to verify this result, the SCIN protein level was examined in
the 12 HCC tissues and the respective non-cancerous tissues. A
lower SCIN protein level was consistently observed in 10 out of the
12 paired HCC tissues (Fig. 1B).
These results prompted the assessment of the clinical outcome of
SCIN downregulation. In order to achieve this, a TMA comprised of
the 60 paired HCC tissues and respective normal counterparts was
stained using the standard IHC method. While the signal for SCIN
was considered strong in peri-tumor normal hepatocytes, less
signals were observed in the HCC tissues (Fig. 1C). The TMA was subsequently analyzed
and the signal was reflected via the H-score. The results of the
present study demonstrated that SCIN was significantly
downregulated in HCC tissues compared with normal tissues (the
average H-score for the normal tissue group was 7.4 vs. 4.2 for the
HCC group; P<0.0001; Fig. 1D).
Thus, the results of the present study suggest that SCIN is
downregulated in HCC.
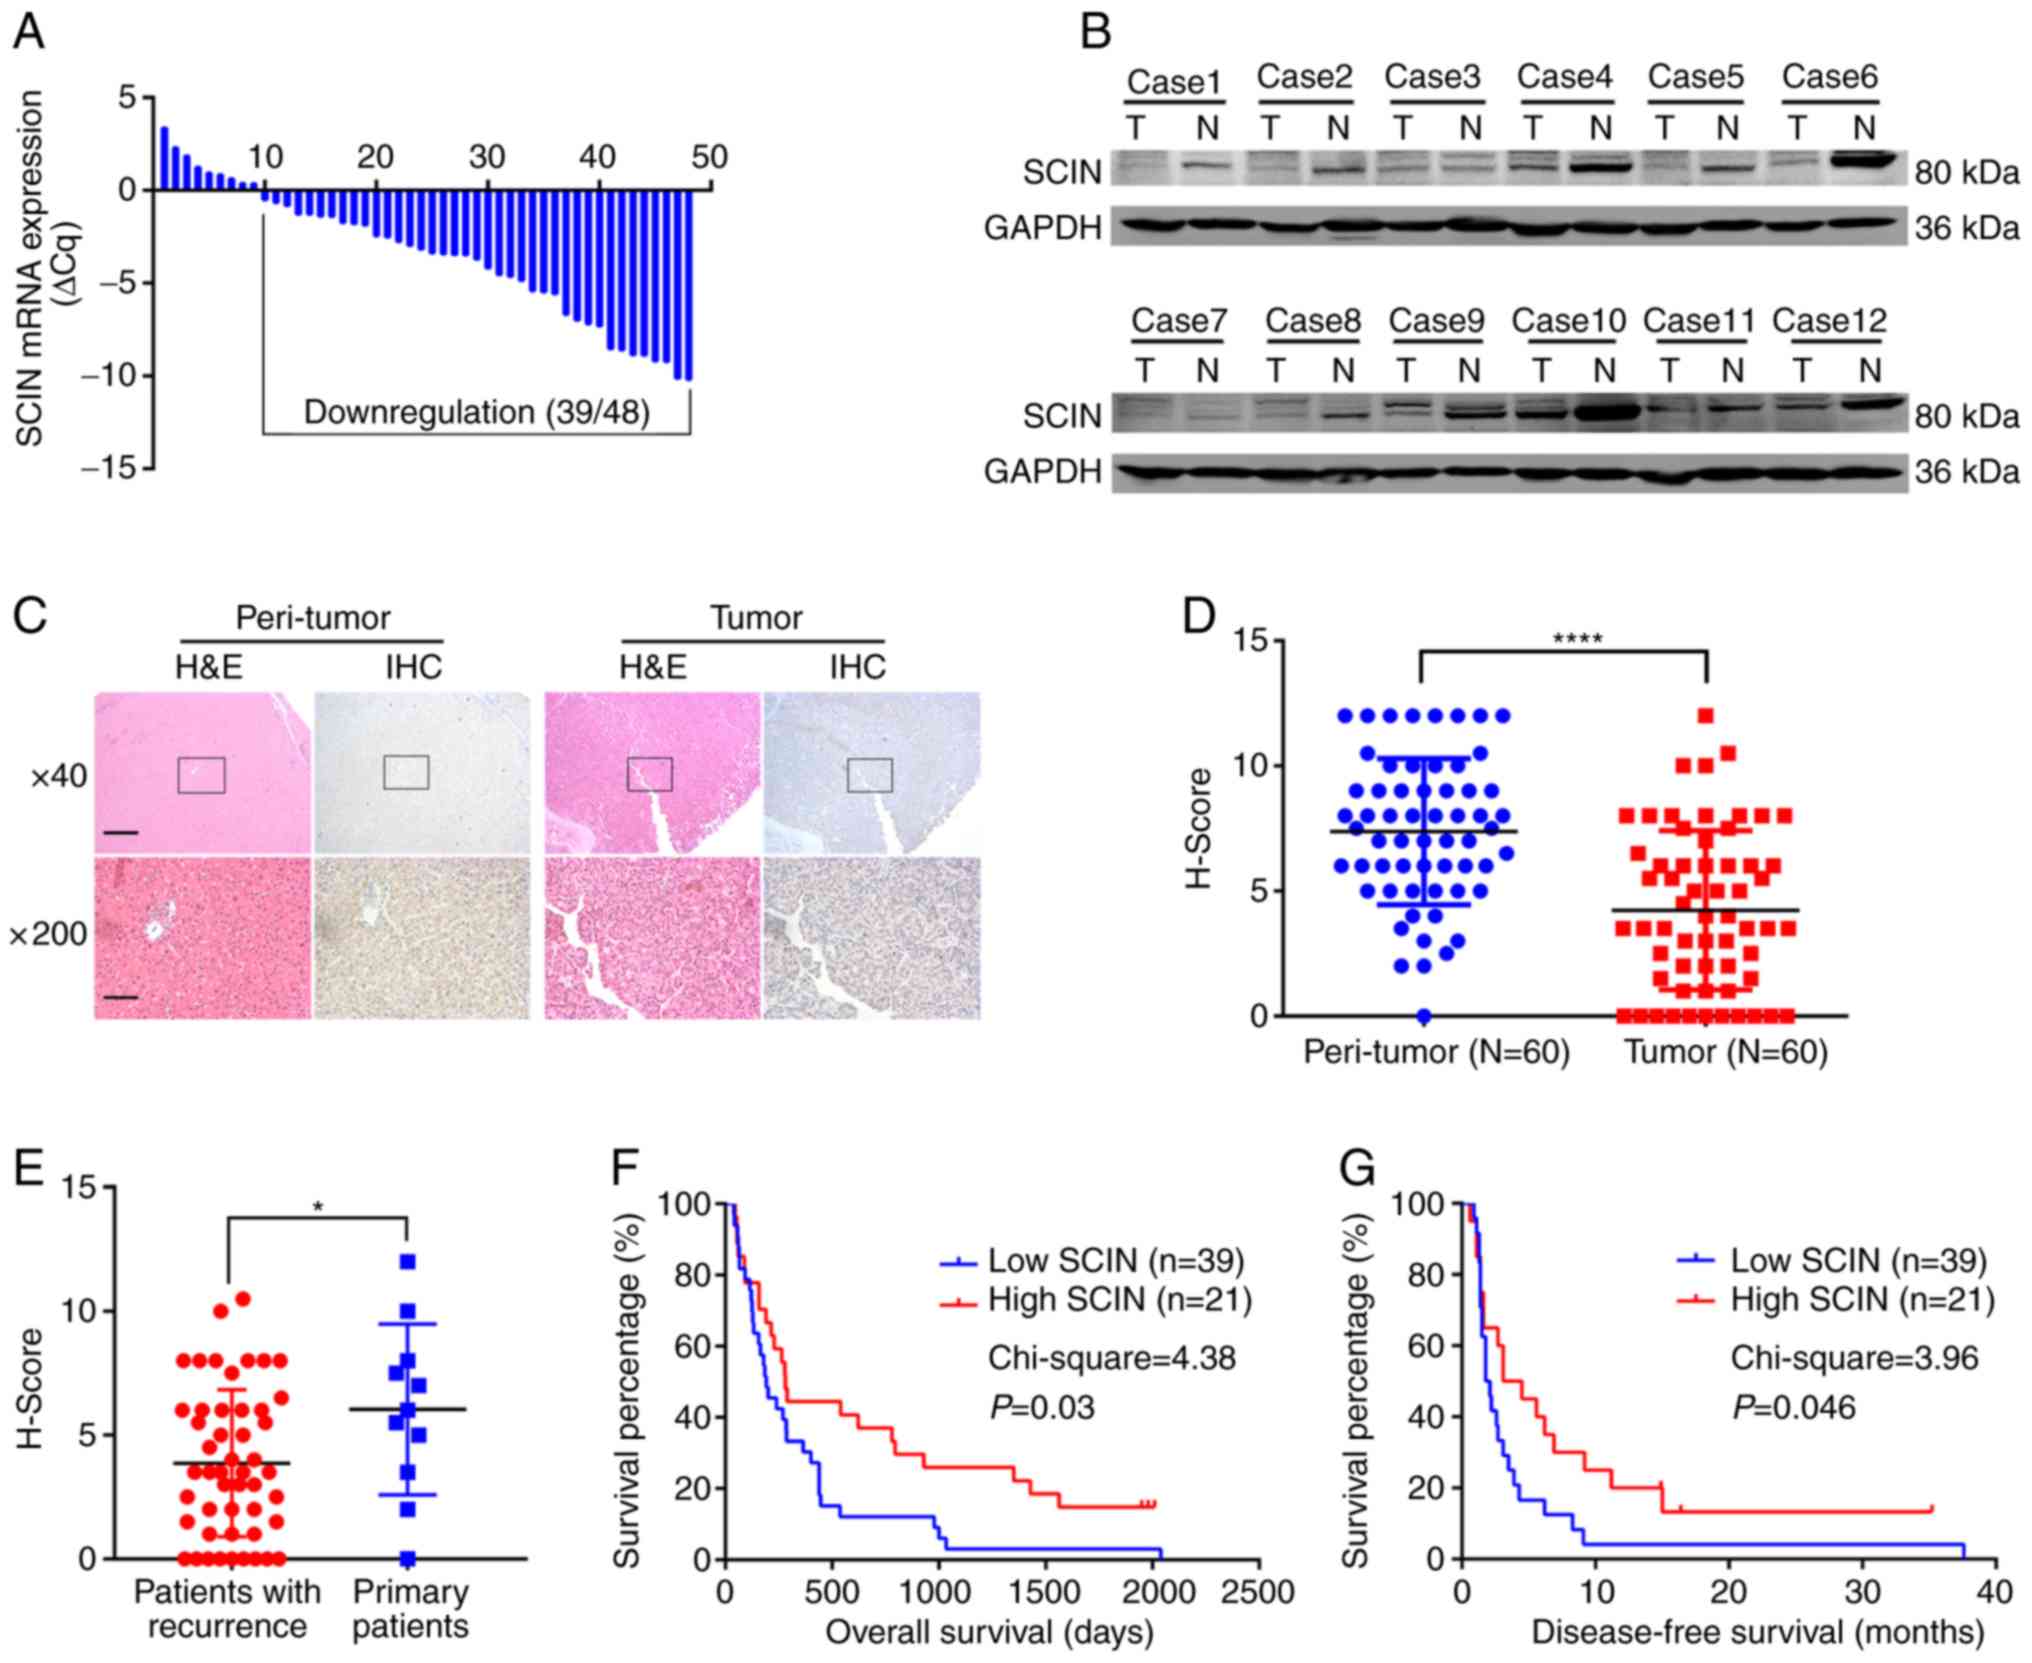 | Figure 1.SCIN is downregulated in HCC and low
expression predicts poor survival. (A) Reverse
transcription-quantitative PCR analysis of SCIN mRNA expression in
the 48 paired pancreatic ductal adenocarcinoma tumor tissues and
normal tissues. (B) Western blot analysis of SCIN protein
expression in the 12 paired HCC tissues. (C) Representative images
of H&E and IHC staining of SCIN in TMA. Magnification, ×40
(scale bar, 500 µm) and ×200 (scale bar, 100 µm). (D and E) Dot
plot H-score of SCIN indicated staining signal in TMA containing
the 60 paired HCC and normal tissues. (F) KM overall survival
analysis of patients in SCIN low expression and SCIN high
expression groups. (G) KM disease-free survival analysis of
patients in SCIN low expression and SCIN high expression groups.
*P<0.05 and ****P<0.0001. SCIN, scinderin; HCC,
hepatocellular carcinoma; H&E, hematoxylin and eosin; IHC,
immunohistochemistry; TMA, tissue microarray; KM, Kaplan-Meier; T,
tumor; N, normal. |
SCIN expression is associated with
clinicopathological features and predicts prognosis
Next, the association between SCIN expression and
clinical features was analyzed using the TMA data. Patients were
divided into two groups according to the H-score for their HCC
tissues (patients with H-scores <6 were categorized into the low
SCIN expression group, n=39; patients with H-score ≥6 were
categorized into the high SCIN expression group, n=21). The results
of the present study demonstrated that SCIN expression was
significantly associated with tumor size (Table I); however, no significant
associations were observed between SCIN expression and lymph node
(LN) metastases, cirrhosis, age or microvascular invasion (MVI).
The association between SCIN expression and the survival and
recurrence status for the 60 patients was subsequently analyzed.
The results revealed that SCIN expression was significantly
decreased in patients with recurrence compared with patients
without recurrence (Fig. 1E).
Furthermore, the low SCIN expression group demonstrated a shorter
overall survival (OS) time (χ2=4.38; P=0.03; Fig. 1F), as well as a shorter disease-free
survival (DFS) time (χ2=3.96; P=0.046; Fig. 1G) compared with the high SCIN
expression group. Detailed analysis in the present study
demonstrated that the 1- and 3-year recurrence rates of the high
SCIN expression group [57.1% (12/21) and 71.4% (15/21),
respectively] were significantly lower than those of the low SCIN
expression group [74.4% (29/39) and 84.6% (33/39), respectively].
Furthermore, the 1- and 3-year OS times of the high SCIN expression
group [66.7% (14/21) and 28.6% (6/21), respectively] were
significantly longer than those of the low SCIN expression group
[38.5% (15/39) and 10.3% (4/39), respectively; Table II]. In order to further assess
whether SCIN expression could serve as an independent risk factor
for both OS and DFS in HCC, the Cox proportional hazards model was
implemented in the present study. Factors included in this model
were as follows: Sex, age, tumor size, serum α-fetoprotein (AFP),
serum HBsAg, serum CA199, encapsulation, liver cirrhosis, tumor
number, SCIN expression, LN metastases and MVI. SCIN and MVI were
found to be associated using Cox analysis (Tables III and IV). The results indicate that SCIN
expression has the ability to serve as an independent prognostic
factor, affecting both DFS and OS in HCC. SCIN expression has a
notable association with the good prognosis of patients with HCC
and thus could serve as an independent risk factor for
survival.
 | Table I.Association between SCIN expression
and clinicopathological features of patients with hepatocellular
carcinoma. |
Table I.
Association between SCIN expression
and clinicopathological features of patients with hepatocellular
carcinoma.
|
|
| SCIN expression,
n |
|
|---|
|
|
|
|
|
|---|
| Characteristic | Patients, n | Low (n=39) | High (n=21) | P-value |
|---|
| Age, years |
|
|
| 0.679 |
|
<50 | 42 | 28 | 14 |
|
|
≥50 | 18 | 11 | 7 |
|
| Tumor size, cm |
|
|
| 0.028a |
|
<5 | 23 | 11 | 12 |
|
| ≥5 | 37 | 28 | 9 |
|
| Liver
cirrhosis |
|
|
| 0.740 |
|
Presence | 36 | 24 | 12 |
|
|
Absence | 24 | 15 | 9 |
|
| Lymph node
metastases |
|
|
| 0.717 |
|
Positive | 10 | 6 | 4 |
|
|
Negative | 50 | 33 | 17 |
|
| Microvascular
invasion |
|
|
| 0.251 |
|
Positive | 20 | 15 | 5 |
|
|
Negative | 40 | 24 | 16 |
|
| Table II.1-year and 3-year recurrence rates
and overall survival rates of patients. |
Table II.
1-year and 3-year recurrence rates
and overall survival rates of patients.
|
|
| Recurrence rates, %
(n) | Overall survival
rates, % (n) |
|---|
|
|
|
|
|
|---|
| SCIN
expression | Patients, n | 1-year | 3-year | 1-year | 3-year |
|---|
| High | 21 | 57.1% (12) | 71.4% (15) | 66.7% (14) | 28.6% (6) |
| Low | 39 | 74.4% (29) | 84.6% (33) | 38.5% (15) | 10.3% (4) |
| Table III.Cox regression analysis of OS in
patients with hepatocellular carcinoma. |
Table III.
Cox regression analysis of OS in
patients with hepatocellular carcinoma.
|
| OS |
|---|
|
|
|
|---|
|
| Univariate | Multivariate |
|---|
|
|
|
|
|---|
| Variable | HR (95% CI) | P-value | HR (95% CI) | P-value |
|---|
| Sex | 0.706
(0.274–1.821) | 0.472 |
|
|
| Age | 0.656
(0.307–1.398) | 0.275 |
|
|
| Tumor size | 1.194
(0.612–2.330) | 0.603 |
|
|
| Serum AFP | 1.328
(0.515–3.426) | 0.557 |
|
|
| Serum HBsAg | 1.911
(0.673–5.429) | 0.224 |
|
|
| Serum CA19-9 | 1.791
(0.732–4.382) | 0.202 |
|
|
| Encapsulation | 1.105
(0.530–2.303) | 0.782 |
|
|
| Liver
cirrhosis | 2.187
(1.073–4.461) | 0.031a | 1.948
(0.887–4.278) | 0.097 |
| Tumor number | 2.401
(1.021–5.647) | 0.045a | 1.298
(0.365–4.615) | 0.687 |
| SCIN | 0.424
(0.203–0.887) | 0.023a | 0.384
(0.175–0.842) | 0.017a |
| Lymph node
metastases | 3.342
(1.403–7.957) | 0.006a | 1.793
(0.492–6.539) | 0.377 |
| Microvascular
invasion | 4.357
(1.966–9.654) |
<0.001a | 2.668
(1.122–6.344) | 0.026a |
| Table IV.Cox regression analysis of DFS in
patients with hepatocellular carcinoma. |
Table IV.
Cox regression analysis of DFS in
patients with hepatocellular carcinoma.
|
| DFS |
|---|
|
|
|
|---|
|
| Univariate | Multivariate |
|---|
|
|
|
|
|---|
| Variable | HR (95% CI) | P-value | HR (95% CI) | P-value |
|---|
| Sex | 0.682
(0.304–1.533) | 0.355 |
|
|
| Age | 0.613
(0.322–1.167) | 0.136 |
|
|
| Tumor size | 1.426
(0.786–2.585) | 0.243 |
|
|
| Serum AFP | 0.792
(0.370–1.695) | 0.548 |
|
|
| Serum HBsAg | 2.221
(0.936–5.271) | 0.070 |
|
|
| Serum CA19-9 | 1.459
(0.647–3.286) | 0.362 |
|
|
| Encapsulation | 1.031
(0.561–1.896) | 0.921 |
|
|
| Liver
cirrhosis | 1.816
(1.009–3.266) | 0.046a | 1.634
(0.893–2.989) | 0.111 |
| Tumor number | 1.747
(0.879–3.473) | 0.112 |
|
|
| SCIN | 0.465
(0.251–0.862) | 0.015a | 0.484
(0.259–0.904) | 0.023a |
| Lymph node
metastases | 1.892
(0.890–4.022) | 0.098 |
|
|
| Microvascular
invasion | 2.950
(1.541–5.646) | 0.001a | 2.605
(1.339–5.071) | 0.005a |
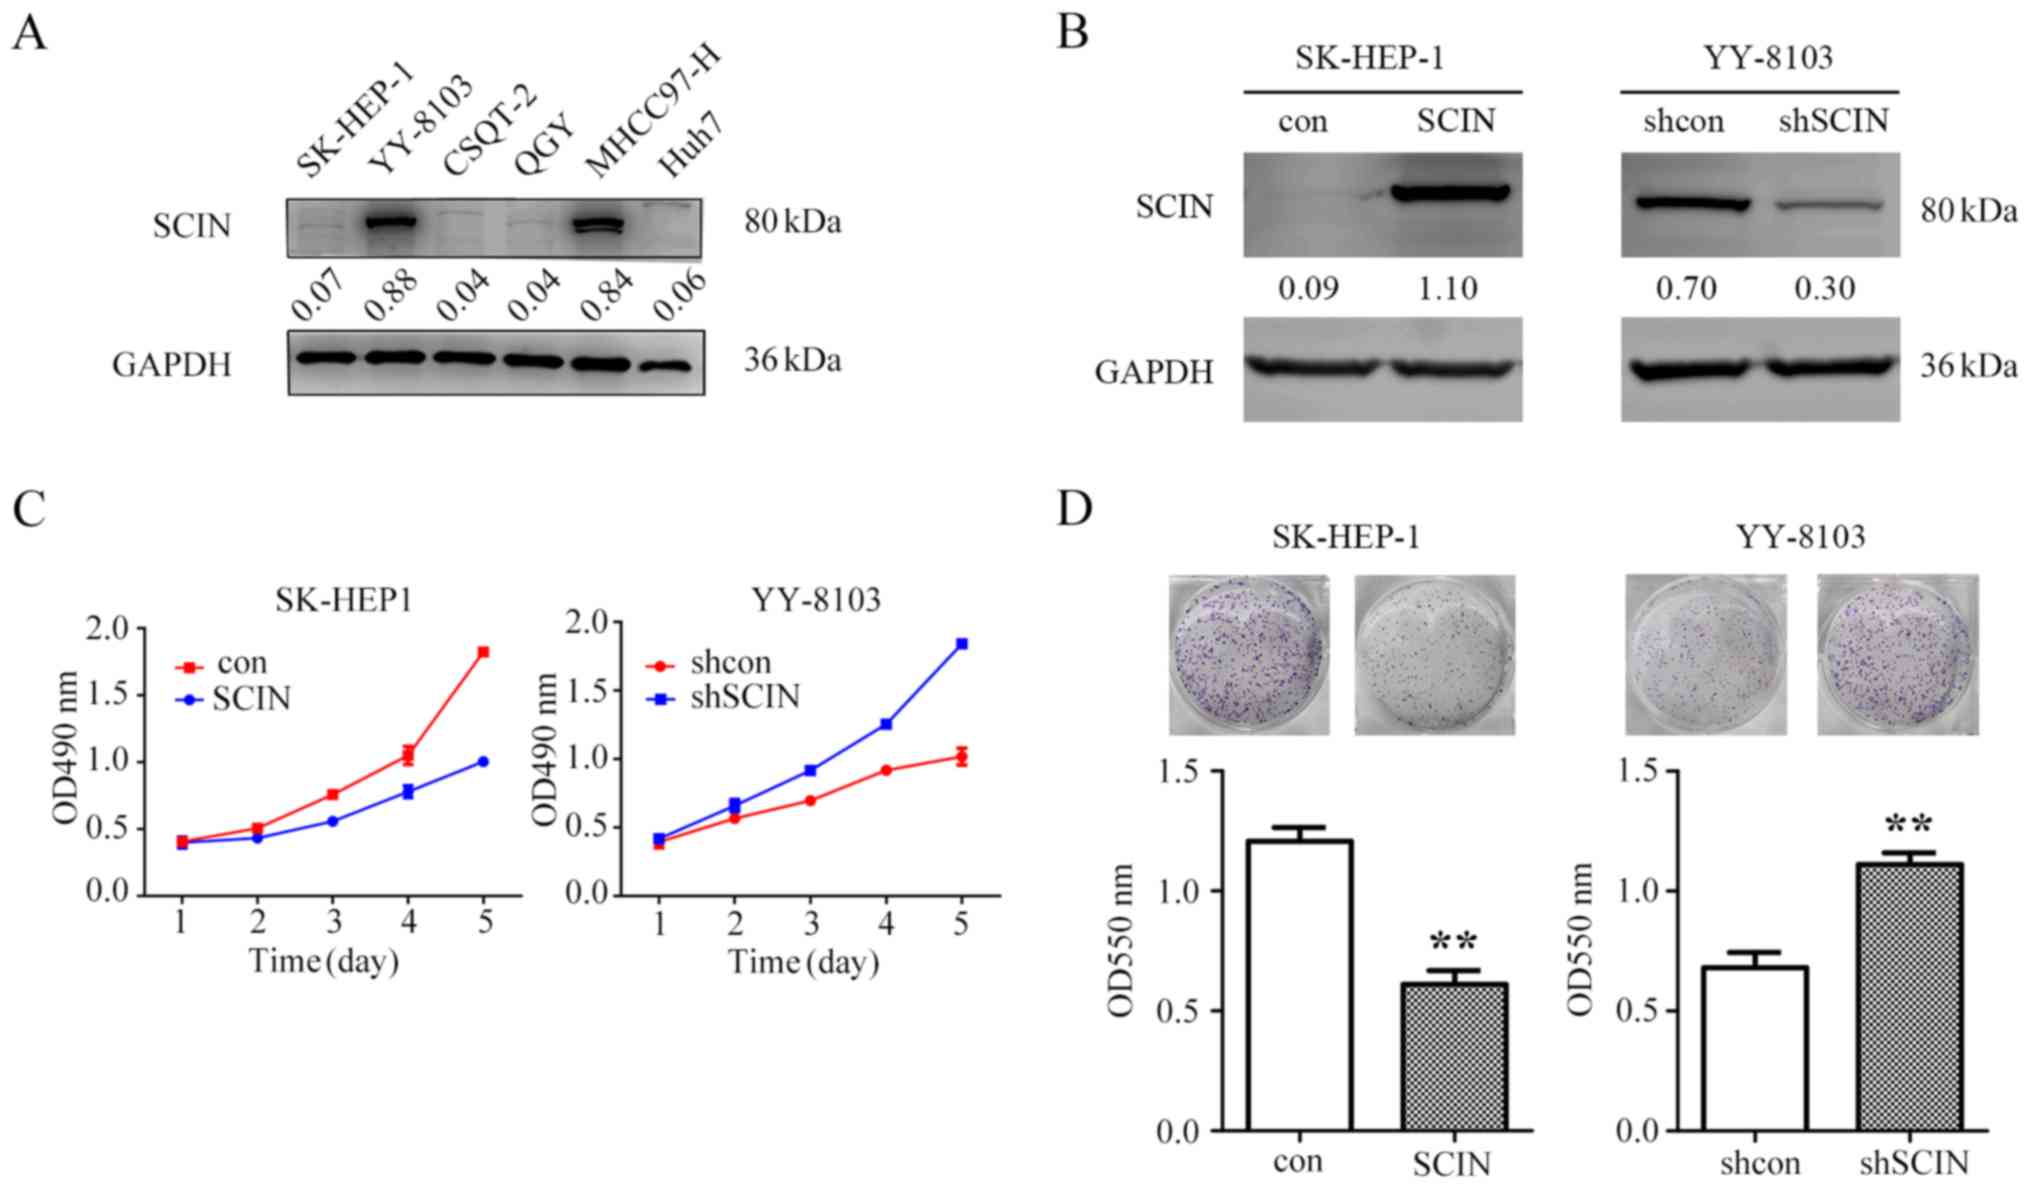
SCIN suppresses HCC cell
proliferation
The present study utilized gene manipulation
mediated by lentivirus in order to assess the function of SCIN in
HCC cells. SCIN expression in six HCC cell lines was determined
(Fig. 2A). In order to investigate
the role of SCIN in HCC cells, the present study overexpressed SCIN
in SK-HEP-1 cells, which exhibited low endogenous SCIN levels, and
knocked down SCIN expression in YY-8103 cells, which manifested
high endogenous SCIN levels (Fig.
2B). Considering that SCIN expression was inversely associated
with tumor size clinically, the present study subsequently examined
the proliferative ability of these cells via MTT assays. The
results of the present study demonstrated that while overexpression
of SCIN in SK-HEP-1 cells inhibited cell proliferation, SCIN
knockdown in YY-8103 cells promoted cell proliferation (Fig. 2C). Consistent with these results, the
present study demonstrated that while SCIN overexpression in
SK-HEP-1 cells decreased the colony-formation ability of these
cells, its inhibition increased the colony-formation ability in
YY-8103 cells (Fig. 2D). Overall,
the results of the present study suggest that SCIN suppresses HCC
cell proliferation in vitro.
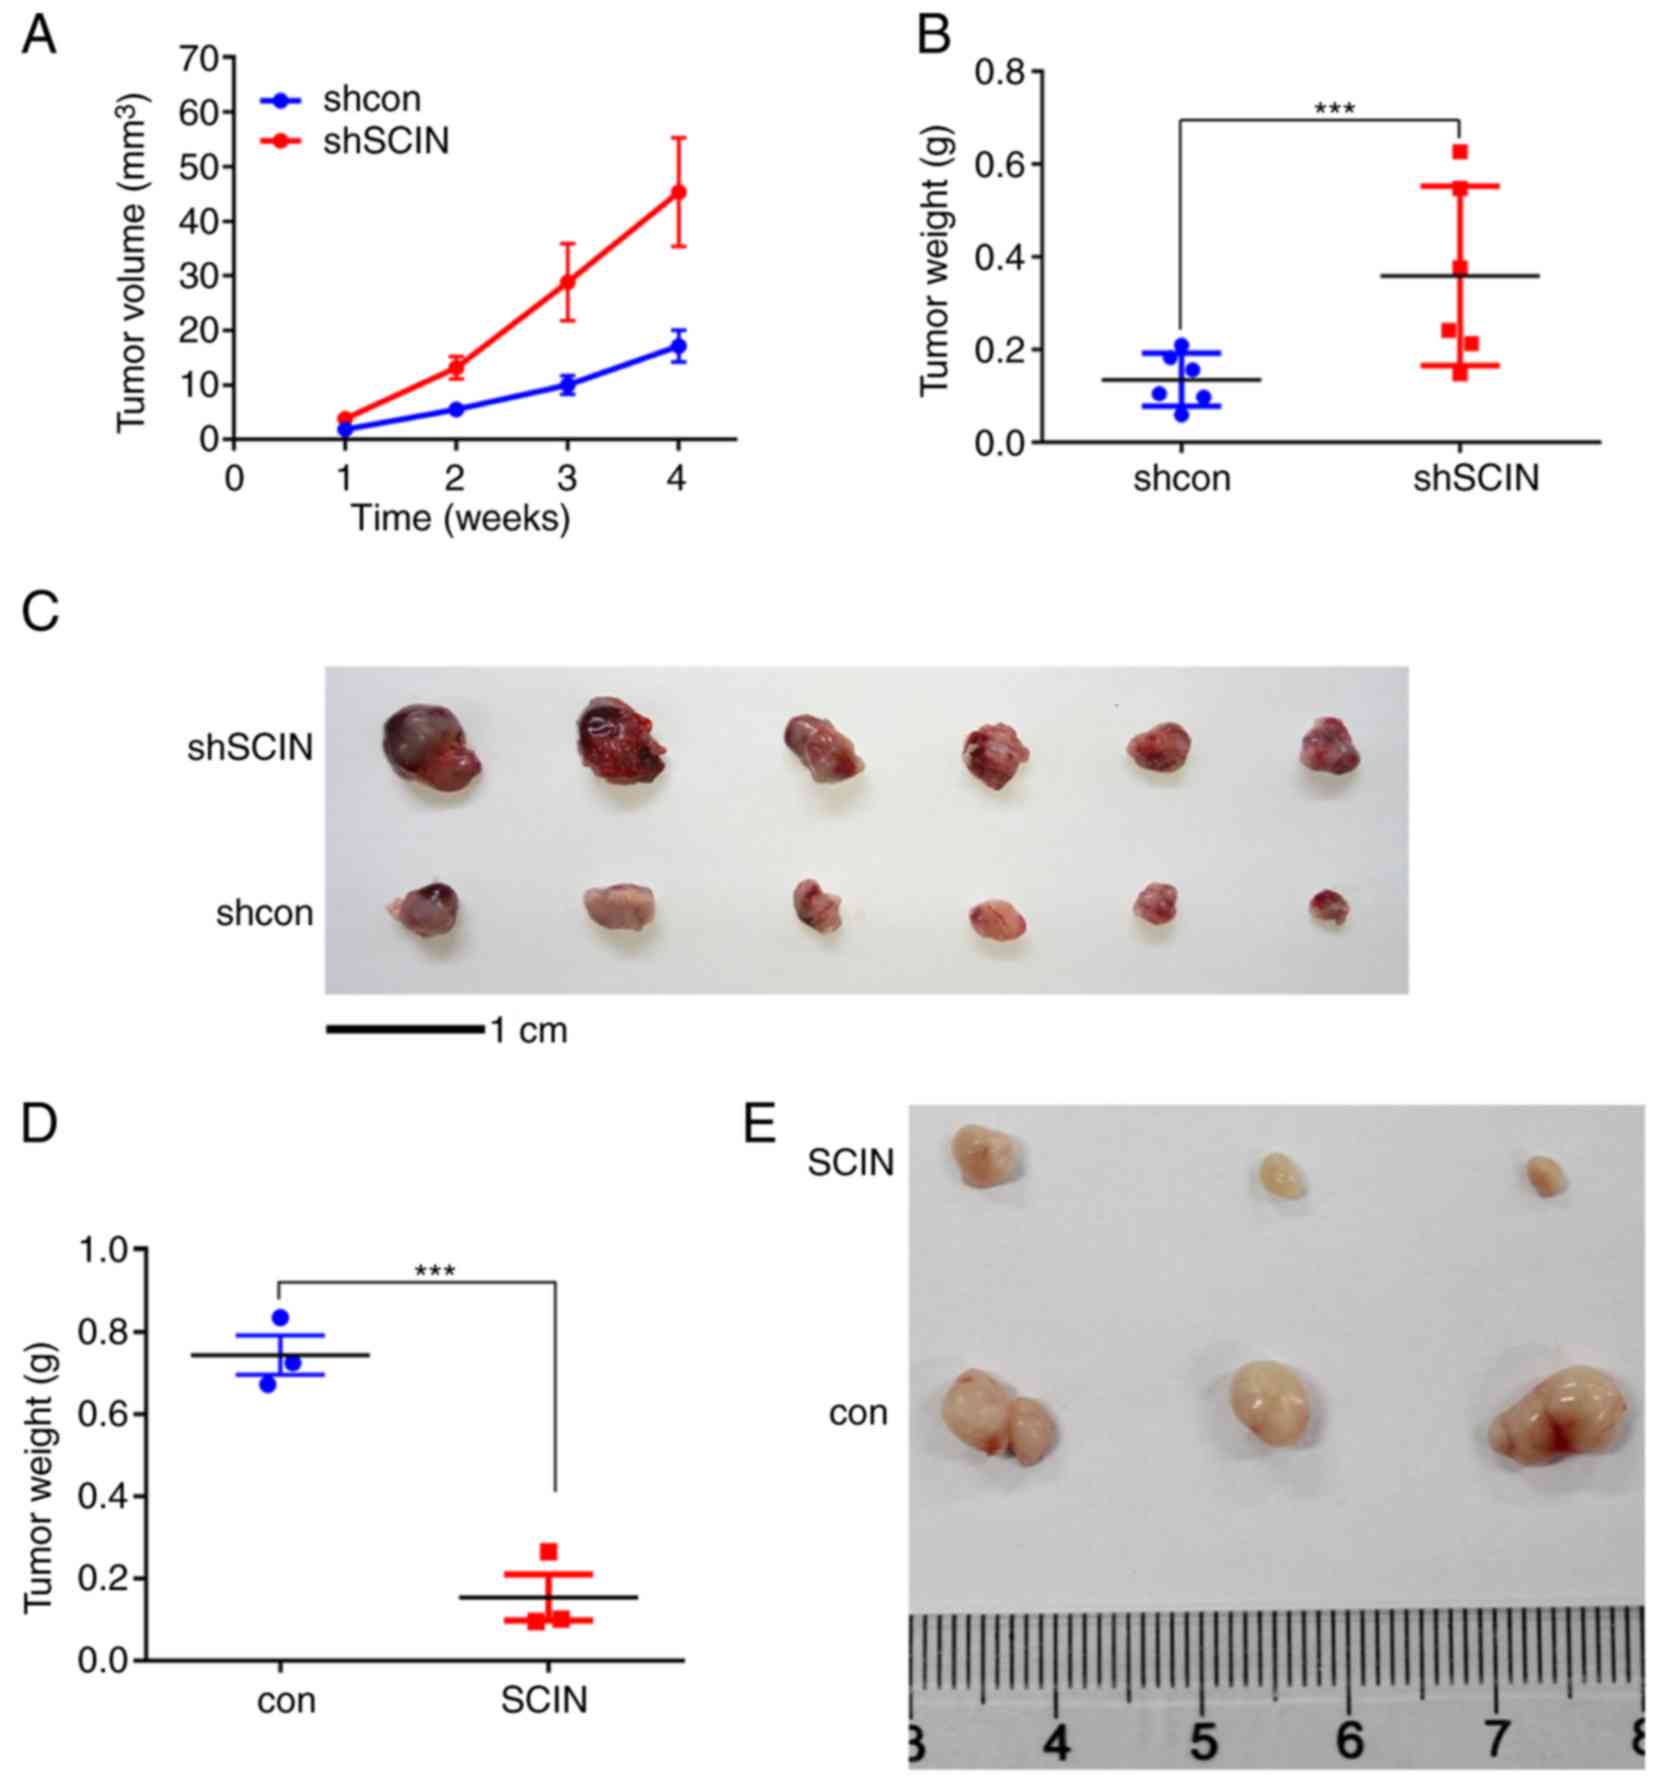
In order to further investigate the role of SCIN,
in vivo experiments were performed in the present study.
YY-8103 shSCIN and shcon cells were injected subcutaneously into
the left and right flanks of the six nude mice. SCIN-knockdown
tumors grew faster than those in the control group (Fig. 3A). After 4 weeks, the mice were
sacrificed and all the tumors were weighed. The results
demonstrated that the tumors in the shSCIN group were significantly
heavier (P<0.001; Fig. 3B) and
larger (Fig. 3C) than those in the
control group. Consistently, SCIN overexpression in SK-HEP-1 cells
inhibited the in vivo tumor formation ability (Fig. 3D and E). The tumor lengths and
volumes for all groups are presented in Table V. Overall, the results of the present
study suggest that SCIN promotes tumorigenesis in vivo.
| Table V.Volumes and lengths of each
tumor. |
Table V.
Volumes and lengths of each
tumor.
| Tumor number | Length (A), mm | Length (B), mm | aVolume, mm3 |
|---|
| YY-8103 shSCIN |
|
|
|
| 1 | 6.5 | 4.9 | 78.03 |
| 2 | 6.0 | 4.8 | 69.12 |
| 3 | 5.3 | 4.2 | 46.75 |
| 4 | 4.0 | 3.9 | 30.42 |
| 5 | 3.9 | 3.1 | 18.74 |
| 6 | 3.9 | 3.7 | 26.70 |
| YY-8103 shcon |
|
|
|
| 7 | 3.9 | 3.6 | 25.27 |
| 8 | 4.0 | 3.4 | 23.12 |
| 9 | 3.8 | 2.5 | 11.88 |
| 10 | 3.9 | 3.2 | 19.97 |
| 11 | 3.0 | 3.0 | 13.50 |
| 12 | 2.7 | 2.4 | 7.78 |
| SK-HEP-1 SCIN |
|
|
|
| 13 | 4.4 | 3.9 | 33.46 |
| 14 | 3.5 | 2.7 | 12.76 |
| 15 | 3.1 | 2.8 | 12.15 |
| SK-HEP-1 con |
|
|
|
| 16 | 7.5 | 4.9 | 90.04 |
| 17 | 6.1 | 5.3 | 85.67 |
| 18 | 9.0 | 4.8 | 103.68 |
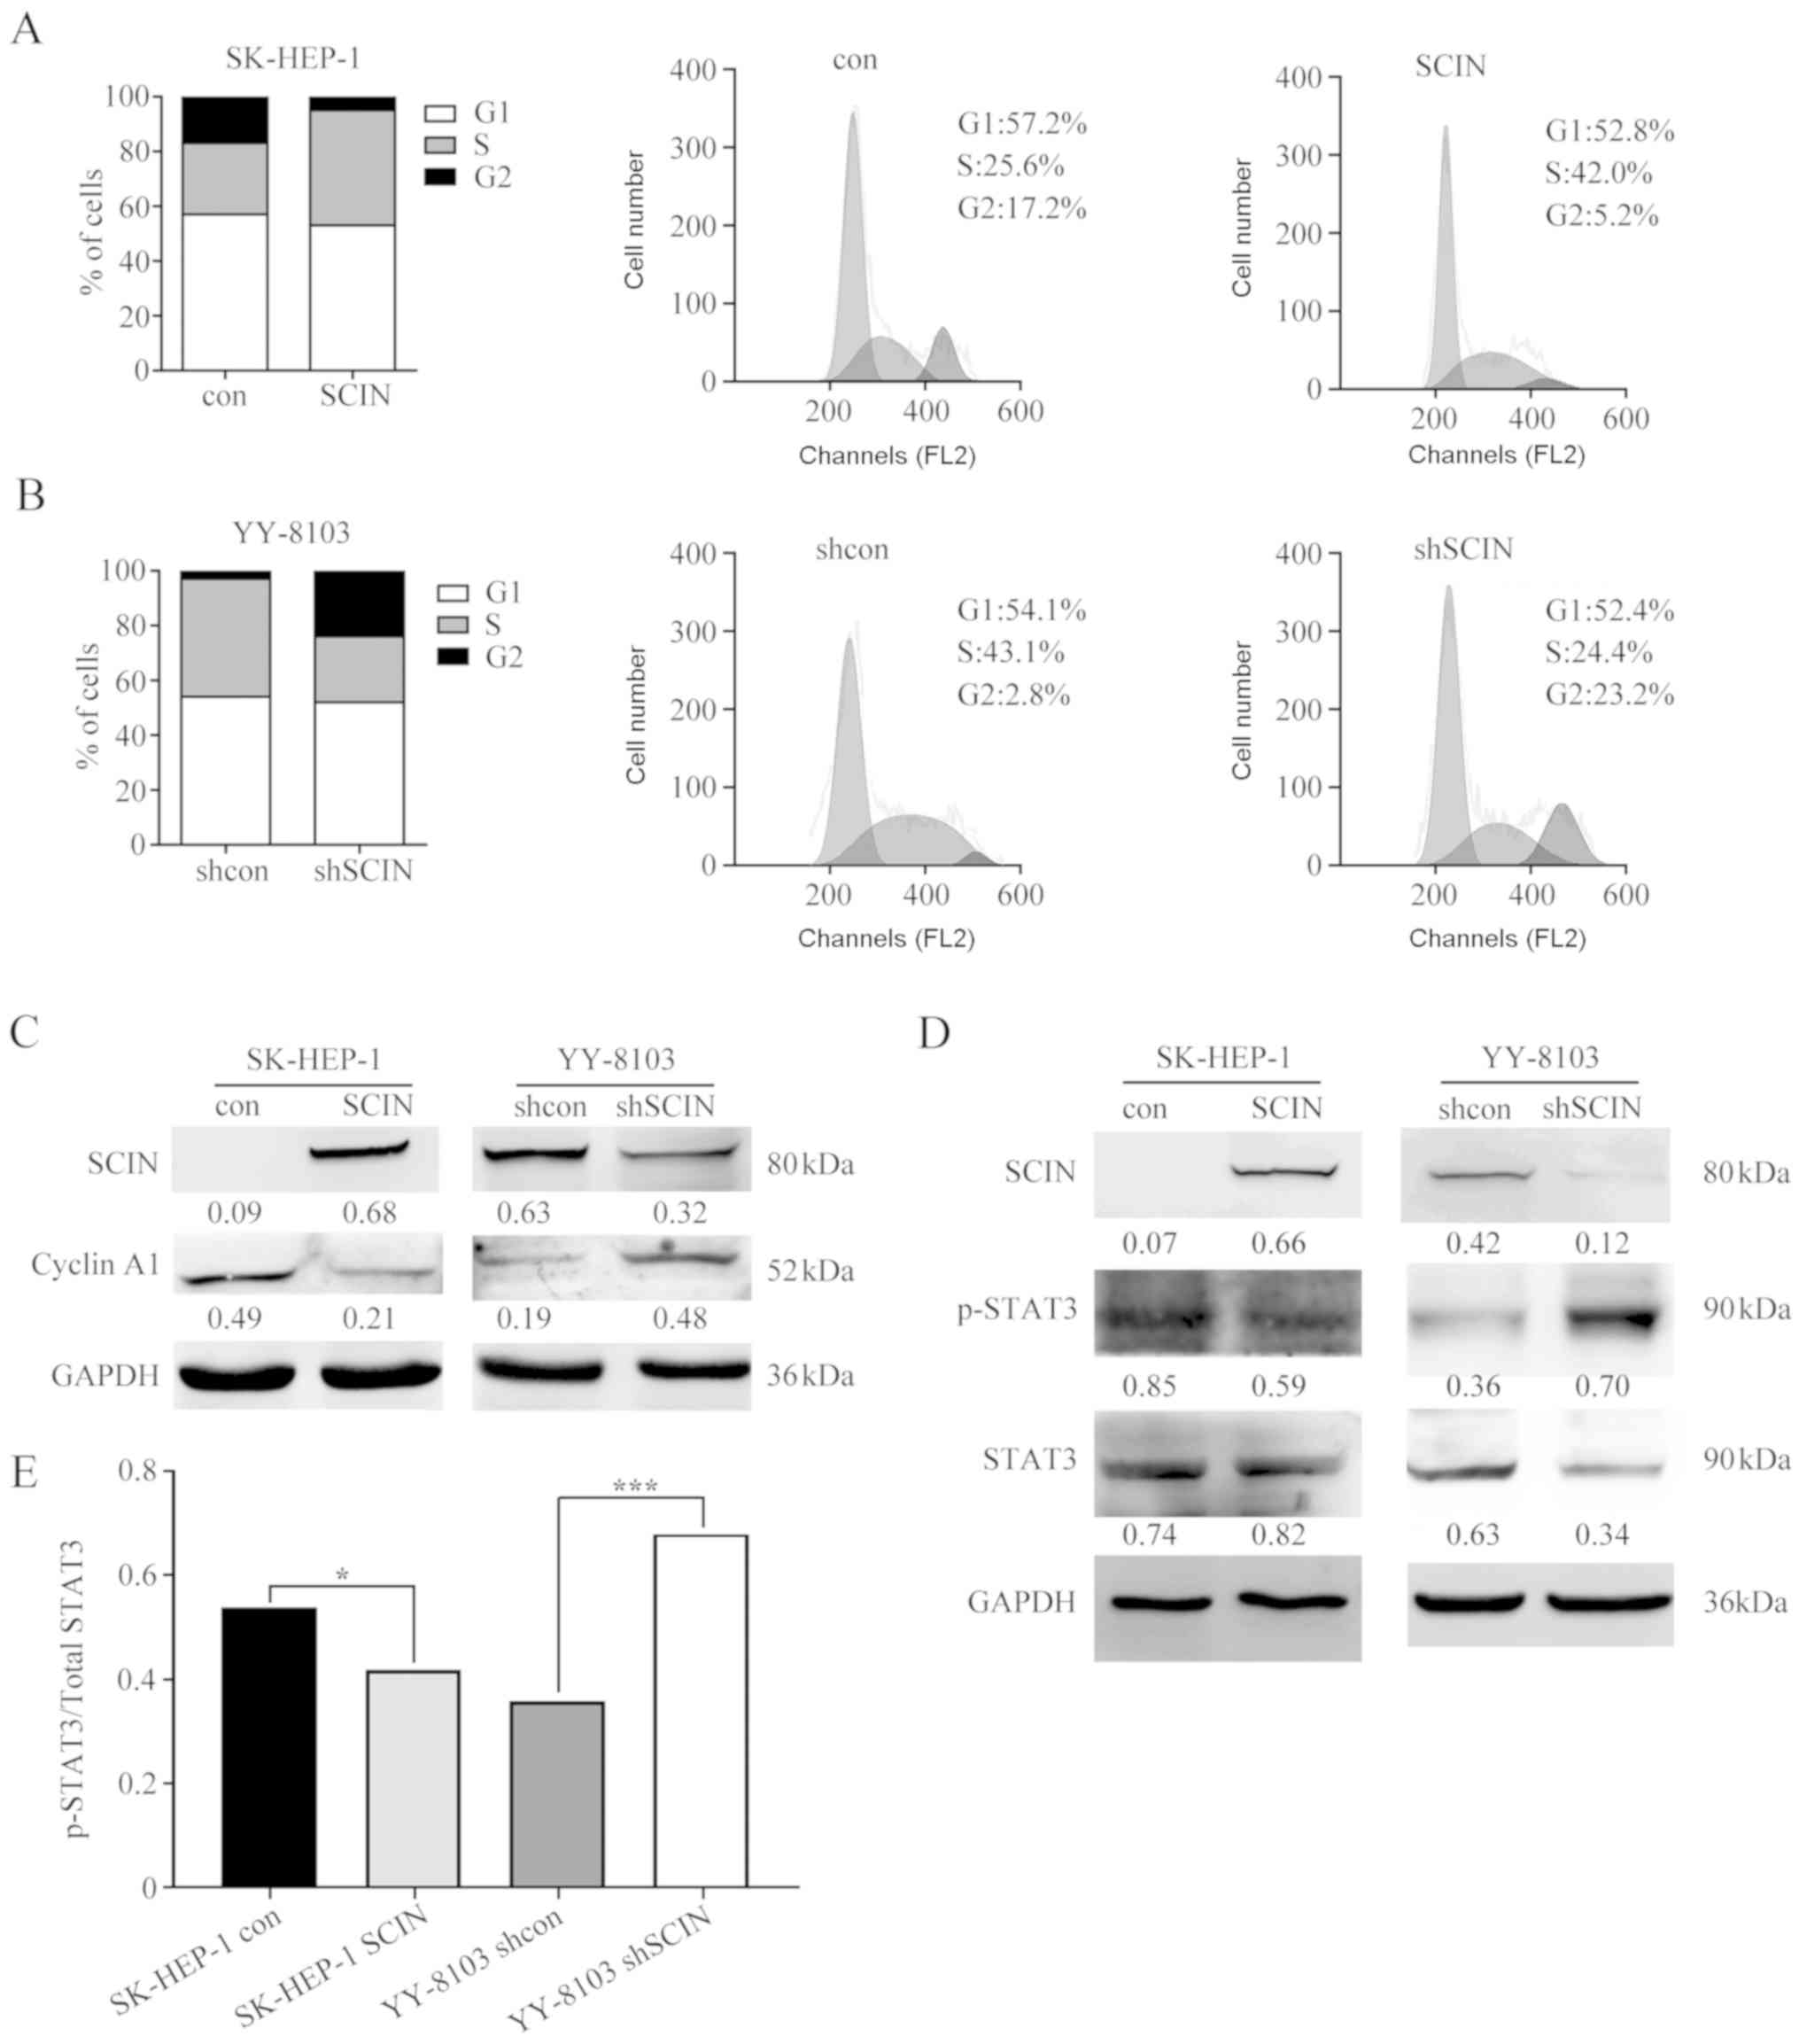
SCIN expression arrests cells in the
S/G2 phase, and downregulates pSTAT3 and cyclin A1
The present study performed FACs in order to analyze
the cell cycle distribution in SCIN-manipulated cells, to better
understand how SCIN inhibits cell proliferation. The results of the
present study demonstrated that SCIN overexpression in SK-HEP-1
cells markedly increased the number of cells in the S phase (from
25.6–42.0%) and decreased the number of cells in the G2
phase (from 17.5–5.2%) (Fig. 4A),
indicating that SCIN expression results in cell cycle arrest in the
S/G2 phase. Similarly, SCIN-knockdown in YY-8103 cells
demonstrated a decrease in the number of cells in the S phase and
an increase in the number of cells in the G2 phase
(Fig. 4B). Thus, the results of the
present study indicate that cells are arrested in the
S/G2 transition following SCIN expression.
As the cell cycle is regulated by cyclins (21), the present study examined whether the
expression of cyclins was altered following SCIN overexpression or
knockdown. The results of the present study demonstrated that while
SCIN overexpression downregulated cyclin A1, the protein level of
cyclin A1 increased following SCIN knockdown (Fig. 4C). As SCIN is associated with
F-actin, which is localized in the cell periphery (8,10), there
may be oncogenic signaling pathways influenced by SCIN, which could
regulate cyclin A1 expression. In order to investigate this, the
present study assessed changes in some oncogenic molecules and
demonstrated that the phosphorylation of signal transducer and
activator of transcription 3 (STAT3) was inversely associated with
cellular SCIN levels (Fig. 4D and
E). These observations indicate that cyclin A1 and
phospho-STAT3 are negatively regulated by SCIN.
Discussion
SCIN has been reported to possess an oncogenic role
in several types of solid tumor by promoting tumor cell
proliferation and invasion (10,12). In
certain types of leukemia, SCIN has been demonstrated to be
downregulated and its expression associated with the induction of
cell differentiation (8,14). Hasmim et al (15) demonstrated the weak expression of
SCIN in 9 out of 83 patients with head and neck cancer, indicating
that the role of SCIN may vary within different types of tumor.
This paradoxical function of SCIN in different types of cancer may
be attributed to different genetic backgrounds and distinct tumor
milieu (22). However, the present
study demonstrated that SCIN was tumor suppressive in HCC. The
results of the present study demonstrated that SCIN was
downregulated in samples derived from patients with HCC, and
notably, the low expression of SCIN in resected HCC tissues
predicted poor prognosis in postoperative patients.
SCIN expression status, combined with
clinicopathological features and other biomarkers of HCC may be
useful for the development of individualized treatment in patients
with HCC. However, further investigations in other cohorts are
required in order to verify these hypotheses. As the number of
cases in the present study was limited, the association between
SCIN expression and HCC requires further evaluation. Longer
follow-up studies are required in order to further investigate the
significance of SCIN in HCC.
HCC is one of the many types of cancer closely
associated with inflammation and infection (23). One feature of HCC development is
continuous hepatocyte death followed by inflammatory infiltration
and liver regeneration (24). The
IL6/STAT3 signaling pathway is a notable pathway involved in the
death-inflammation-regeneration process (25). Universal STAT3 activation in HCC has
previously been reported in a number of studies (26,27),
whereby patients exhibiting STAT3 activation tend to have a poor
prognosis. The present study demonstrated that SCIN could
negatively regulate the activation of STAT3, which underlined the
regulation of this molecule. Although the present study failed to
clarify the molecular mechanisms by which SCIN deregulates STAT3
activation, it was hypothesized that SCIN may modulate some aspects
of upstream receptors or Janus kinases considering that SCIN is
associated with F-actin, which in turn is closely associated with
membrane receptors in space (28,29).
Thus, further studies are required in order to demonstrate STAT3
regulation via SCIN.
The results of the present study demonstrated that
SCIN has the ability to regulate cyclin A1 protein levels in HCC
cells. In the cell cycle process, cyclin A1 is present at very low
levels during the G0 phase; it increases throughout the
progression of the cell cycle and reaches peak levels in the S
phase and during the G2/M phase (30). The results of the present study
demonstrated that SCIN has the ability to induce cell cycle arrest,
which increased the percentage of cells in the S phase and
inhibited entry into the G2 phase. This phenotype may be
explained by the influence of SCIN on cyclin A1 expression;
however, the association between SCIN and cyclin A1 may be indirect
as SCIN is not a transcription factor. Thus, some signaling
pathways may mediate cyclin A1 expression via SCIN.
Overall, the present study demonstrated that SCIN
expression was downregulated in HCC and that SCIN functioned to
suppress the proliferation of HCC cells, which may be mediated by
cyclin A1 and STAT3, suggesting that SCIN may be a tumor suppressor
gene in HCC. Furthermore, SCIN may serve as a valuable prognostic
marker, as well as a potential therapeutic target for HCC.
Acknowledgements
The authors would like to thank Dr Liu Shanrong
(Department of Clinical Laboratory, Changhai Hospital, Shanghai,
China) for providing advice on experimental ideas.
Funding
The present study was funded by The National Key
Basic Research Program 973 Project (grant no. 2015CB554000), The
Project of Shanghai Shenkang Hospital Development Center (grant no.
SHDC12015106), The Key Project of the Natural Science Foundation of
China (grant no. 81730097), The Science Fund for Creative Research
Groups (grant no. 81521091) and The Chang Jiang Scholars Program
(year 2013) of the Ministry of Education of the People's Republic
of China.
Availability of data and materials
The datasets used and/or analyzed during the current
study are available from the corresponding author on reasonable
request.
Authors' contributions
BZ, TWC and YBJ made substantial contributions to
the conception and design of the study. XBW and CDL were
responsible for the analysis and interpretation of data. DX and JJL
participated in the design of the study and experimentation, and
were involved in drafting the manuscript. SQC participated in the
experiment design and the subject establishment of this article, as
well as critically revising the manuscript approving the submitted
version. All authors read and approved the final manuscript.
Ethics approval and consent to
participate
The human and animal experiments performed in the
present study were approved by the Medical Ethics Committee of
Eastern Hepatobiliary Surgery Hospital (Shanghai, China). All
patients provided written informed consent prior to the study.
Patient consent for publication
Not applicable.
Competing interests
The authors declare that they have no competing
interests.
References
|
1
|
Siegel RL, Miller KD and Jemal A: Cancer
statistics, 2019. CA Cancer J Clin. 69:7–34. 2019. View Article : Google Scholar : PubMed/NCBI
|
|
2
|
Orcutt ST and Anaya DA: Liver resection
and surgical strategies for management of primary liver cancer.
Cancer Control. 25:10732748177446212018. View Article : Google Scholar : PubMed/NCBI
|
|
3
|
Zhang Y, Liu S, Wang X, Zhang Z, Jing X,
Zhang P and Xie Z: Prevention of local liver cancer recurrence
after surgery using multilayered cisplatin-loaded polylactide
electrospun nanofbers. Chin J Polym Sci. 32:1111–1118. 2014.
View Article : Google Scholar
|
|
4
|
Zhang XP, Chen ZH, Zhou TF, Li LQ, Chen
MS, Wen TF, Shi J, Guo WX, Wu MC, Lau WY, et al: A nomogram to
predict early postoperative recurrence of hepatocellular carcinoma
with portal vein tumour thrombus after R0 liver resection: A
large-scale, multicenter study. Eur J Surg Oncol. 45:1644–1651.
2019. View Article : Google Scholar : PubMed/NCBI
|
|
5
|
Rodríguez Del Castillo A, Vitale ML,
Tchakarov L and Trifaró JM: Human platelets contain scinderin, a
Ca(2+)-dependent actin filament-severing protein. Thromb Haemost.
67:248–251. 1992. View Article : Google Scholar : PubMed/NCBI
|
|
6
|
Dumitrescu Pene T, Rosé SD, Lejen T, Marcu
MG and Trifaró JM: Expression of various scinderin domains in
chromaffin cells indicates that this protein acts as a molecular
switch in the control of actin filament dynamics and exocytosis. J
Neurochem. 92:780–789. 2005. View Article : Google Scholar : PubMed/NCBI
|
|
7
|
Trifaro JM, Gasman S and Gutierrez LM:
Cytoskeletal control of vesicle transport and exocytosis in
chromaffin cells. Acta Physiol (Oxf). 192:165–172. 2008. View Article : Google Scholar : PubMed/NCBI
|
|
8
|
Zunino R, Li Q, Rosé SD, Romero-Benítez
MM, Lejen T, Brandan NC and Trifaró JM: Expression of scinderin in
megakaryoblastic leukemia cells induces differentiation,
maturation, and apoptosis with release of plateletlike particles
and inhibits proliferation and tumorigenesis. Blood. 98:2210–2219.
2001. View Article : Google Scholar : PubMed/NCBI
|
|
9
|
Jiang H, Wang Y, Viniegra A, Sima C,
McCulloch CA and Glogauer M: Adseverin plays a role in osteoclast
differentiation and periodontal disease-mediated bone loss. FASEB
J. 29:2281–2291. 2015. View Article : Google Scholar : PubMed/NCBI
|
|
10
|
Wang D, Sun SQ, Yu YH, Wu WZ, Yang SL and
Tan JM: Suppression of SCIN inhibits human prostate cancer cell
proliferation and induces G0/G1 phase arrest. Int J Oncol.
44:161–166. 2014. View Article : Google Scholar : PubMed/NCBI
|
|
11
|
Liu H, Shi D, Liu T, Yu Z and Zhou C:
Lentivirus-mediated silencing of SCIN inhibits proliferation of
human lung carcinoma cells. Gene. 554:32–39. 2015. View Article : Google Scholar : PubMed/NCBI
|
|
12
|
Liu JJ, Liu JY, Chen J, Wu YX, Yan P, Ji
CD, Wang YX, Xiang DF, Zhang X, Zhang P, et al: Scinderin promotes
the invasion and metastasis of gastric cancer cells and predicts
the outcome of patients. Cancer Lett. 376:110–117. 2016. View Article : Google Scholar : PubMed/NCBI
|
|
13
|
Chen XM, Guo JM, Chen P, Mao LG, Feng WY,
Le DH and Li KQ: Suppression of scinderin modulates
epithelial-mesenchymal transition markers in highly metastatic
gastric cancer cell line SGC-7901. Mol Med Rep. 10:2327–2333. 2014.
View Article : Google Scholar : PubMed/NCBI
|
|
14
|
Zhang ZH, Zhang W, Zhou JD, Zhang TJ, Ma
JC, Xu ZJ, Lian XY, Wu DH, Wen XM, Deng ZQ, et al: Decreased SCIN
expression, associated with promoter methylation, is a valuable
predictor for prognosis in acute myeloid leukemia. Mol Carcinog.
57:735–744. 2018. View
Article : Google Scholar : PubMed/NCBI
|
|
15
|
Hasmim M, Badoual C, Vielh P, Drusch F,
Marty V, Laplanche A, de Oliveira Diniz M, Roussel H, De Guillebon
E, Oudard S, et al: Expression of EPHRIN-A1, SCINDERIN and MHC
class I molecules in head and neck cancers and relationship with
the prognostic value of intratumoral CD8+ T cells. BMC
Cancer. 13:5922013. View Article : Google Scholar : PubMed/NCBI
|
|
16
|
European Association for the Study of the
Liver. Electronic address, . easloffice@easloffice.eu European
Association for the Study of the Liver: EASL clinical practice
guidelines: Management of hepatocellular carcinoma. J Hepatol.
69:182–236. 2018. View Article : Google Scholar : PubMed/NCBI
|
|
17
|
Wang T, Hu HS, Feng YX, Shi J, Li N, Guo
WX, Xue J, Xie D, Liu SR, Wu MC and Cheng SQ: Characterisation of a
novel cell line (CSQT-2) with high metastatic activity derived from
portal vein tumour thrombus of hepatocellular carcinoma. Br J
Cancer. 102:1618–1626. 2010. View Article : Google Scholar : PubMed/NCBI
|
|
18
|
Li JJ, Liu DP, Liu GT and Xie D: EphrinA5
acts as a tumor suppressor in glioma by negative regulation of
epidermal growth factor receptor. Oncogene. 28:1759–1768. 2009.
View Article : Google Scholar : PubMed/NCBI
|
|
19
|
Livak KJ and Schmittgen TD: Analysis of
relative gene expression data using real-time quantitative PCR and
the 2(-Delta Delta C(T)) method. Methods. 25:402–408. 2001.
View Article : Google Scholar : PubMed/NCBI
|
|
20
|
Deng YZ, Chen PP, Wang Y, Yin D, Koeffler
HP, Li B, Tong XJ and Xie D: Connective tissue growth factor is
overexpressed in esophageal squamous cell carcinoma and promotes
tumorigenicity through beta-catenin-T-cell factor/Lef signaling. J
Biol Chem. 282:36571–36581. 2007. View Article : Google Scholar : PubMed/NCBI
|
|
21
|
Ehedego H, Mohs A, Jansen B, Hiththetiya
K, Sicinski P, Liedtke C and Trautwein C: Loss of Cyclin E1
attenuates hepatitis and hepatocarcinogenesis in a mouse model of
chronic liver injury. Oncogene. 37:3329–3339. 2018. View Article : Google Scholar : PubMed/NCBI
|
|
22
|
Mohamed E, Al-Khami AA and Rodriguez PC:
The cellular metabolic landscape in the tumor milieu regulates the
activity of myeloid infiltrates. Cell Mol Immunol. 15:421–427.
2018. View Article : Google Scholar : PubMed/NCBI
|
|
23
|
Nguyen VT, Law MG and Dore GJ: Hepatitis
B-related hepatocellular carcinoma: Epidemiological characteristics
and disease burden. J Viral Hepat. 16:453–463. 2009. View Article : Google Scholar : PubMed/NCBI
|
|
24
|
Block TM, Mehta AS, Fimmel CJ and Jordan
R: Molecular viral oncology of hepatocellular carcinoma. Oncogene.
22:5093–5107. 2003. View Article : Google Scholar : PubMed/NCBI
|
|
25
|
Ye X, Wu H, Sheng L, Liu YX, Ye F, Wang M,
Zhou H, Su Y and Zhang XK: Oncogenic potential of truncated RXRα
during colitis-associated colorectal tumorigenesis by promoting
IL-6-STAT3 signaling. Nat Commun. 10:14632019. View Article : Google Scholar : PubMed/NCBI
|
|
26
|
He G, Yu GY, Temkin V, Ogata H, Kuntzen C,
Sakurai T, Sieghart W, Peck-Radosavljevic M, Leffert HL and Karin
M: Hepatocyte IKK beta/NF-kappa B inhibits tumor promotion and
progression by preventing oxidative stress-driven STAT3 activation.
Cancer Cell. 17:286–297. 2010. View Article : Google Scholar : PubMed/NCBI
|
|
27
|
Calvisi DF, Ladu S, Gorden A, Farina M,
Conner EA, Lee JS, Factor VM and Thorgeirsson SS: Ubiquitous
activation of Ras and Jak/Stat pathways in human HCC.
Gastroenterology. 130:1117–1128. 2006. View Article : Google Scholar : PubMed/NCBI
|
|
28
|
Yao RR, Li JH, Zhang R, Chen RX and Wang
YH: M2-polarized tumor-associated macrophages facilitated migration
and epithelial-mesenchymal transition of HCC cells via the
TLR4/STAT3 signaling pathway. World J Surg Oncol. 16:92018.
View Article : Google Scholar : PubMed/NCBI
|
|
29
|
Zakaria S, Helmy MW, Salahuddin A and
Omran G: Chemopreventive and antitumor effects of benzyl
isothiocynate on HCC models: A possible role of HGF/pAkt/STAT3 axis
and VEGF. Biomed Pharmacother. 108:65–75. 2018. View Article : Google Scholar : PubMed/NCBI
|
|
30
|
Yang R, Müller C, Huynh V, Fung YK, Yee AS
and Koeffler HP: Functions of cyclin A1 in the cell cycle and its
interactions with transcription factor E2F-1 and the Rb family of
proteins. Mol Cell Biol. 19:2400–2407. 1999. View Article : Google Scholar : PubMed/NCBI
|