Introduction
Colorectal cancer (CRC) is a serious threat to human
health; it is one of the most common malignancies and the fourth
leading cause of cancer-associated mortality worldwide (1). According to the GLOBOCAN 2018 database,
~1.8 million newly-diagnosed cases of CRC and 861,600 cases of
CRC-associated mortality were recorded worldwide, in the same year
(2). Despite advances in the
available therapeutic strategies, the clinical outcomes for CRC
remain far from satisfactory due to cancer recurrence, metastasis,
and resistance to radio- and chemotherapy (3,4).
Therefore, further investigations into the precise molecular
mechanisms that account for colorectal carcinogenesis and CRC
progression are of great significance and are urgently required;
this may provide vital clues for the identification of novel
diagnostic and therapeutic targets and monitoring disease
progression.
CRC is considered to be a highly heterogeneous
disease mainly caused by interactions between genetic alterations
and environmental factors (5).
Several genes and cellular signalling pathways, such as receptor
for activated C kinase 1 (RACK1) and long non-coding RNA breast
cancer anti-estrogen resistance 4 (lncRNA BCAR4), have been
reported to serve important roles in the occurrence and development
of CRC (6–8). For instance, the expression of RACK1
has been reported to be significantly upregulated in CRC tissues
compared with in adjacent normal tissues (6). In vitro, overexpression of RACK1
markedly promotes cellular proliferation, migration and invasion
(7). In addition, it has been
reported that lncRNA BCAR4 is closely associated with CRC
initiation and dissemination through targeting microRNA
(miR)-665/STAT3 signalling (8).
Despite these thorough and detailed studies (6–8) to
identify novel targets for CRC management, to the best of our
knowledge, a comprehensive presentation of the crucial key genes
and signalling pathways implicated in CRC is lacking.
Gene microarray profile analysis, a high-throughput
method for detection of mRNA expression in tissues, has
increasingly become a promising tool in medical oncology. By
analysing differential gene expression between tumour tissues and
normal control tissues, an improved understanding of the molecular
pathogenesis of various cancer types may be attained, facilitating
the identification of potential target genes and signalling
pathways for precision therapy (9).
In previous decades, numerous studies on gene expression profiles
in cancer have used microarray technology (10,11), but
only one study has focused on CRC (12). In addition, comparative analysis of
differentially expressed genes (DEGs) remains relatively limited
(13). Furthermore, reliable
biomarker profiles for discriminating CRC from normal tissues
require further identification. In addition, the interactions among
the DEGs identified, particularly the interaction networks and
important signalling pathways, should be elucidated.
In the present study, data were extracted from the
Gene Expression Omnibus (GEO) database. Next, the DEGs between CRC
tissues and the corresponding non-cancerous tissues were screened.
The possible functions of, and potential pathways enriched by, the
DEGs were then predicted by enrichment analysis. Furthermore,
protein-protein interaction (PPI) networks were generated, and
centrality analysis was performed to identify the crucial genes
that were potentially involved in the development of CRC. In
addition, the expression levels of the crucial genes and their
effect on the survival of patients with CRC were further evaluated
using UALCAN. Based on integrated bioinformatics analysis of gene
expression, the present study aimed to further elucidate the
molecular pathogenesis of CRC and identify reliable diagnostic and
prognostic biomarkers as well as therapeutic targets.
Materials and methods
Microarray data
The raw microarray data of the GSE15781 dataset,
contributed by Snipstad et al (14), were downloaded from the GEO database
(http://www.ncbi.nlm.nih.gov/geo/), a
public functional genomics data repository containing array- and
sequence-based data. The dataset included 10 locally advanced CRC
tissues and the corresponding non-cancerous tissues. The data were
pre-processed with Agilent GeneSpringGX software (version 11.5;
Agilent Technologies, Inc.) using the Robust Multichip Averaging
algorithm (15). The probe set IDs
were converted into the corresponding gene symbols according to the
annotation information derived from the GPL2986 platform (ABI Human
Genome Survey Microarray version 2.0) in the GEO database. In the
event of various probe sets corresponding to the same gene, the
mean expression values of those probe sets were obtained.
Identification of DEGs
Agilent GeneSpringGX software was further utilized
to screen DEGs. Significance analysis of the expression of genes
between each pair of cancerous and normal tissues was jointly
implemented by a paired t-test and fold change (FC) calculation.
The Benjamini and Hochberg method (16) was then used to calculate the adjusted
P-value. A |log2 (FC)| value of ≥1 and an adjusted
P-value of <0.05 were considered to be the cut-off criteria for
the identification of DEGs. In addition, to categorize the data
into two groups of different expression patterns, hierarchical
clustering analysis was applied in R language (version 3.5.3;
http://www.r-project.org/) using the
gplots package (version 3.0.1; http://cran.r-project.org/web/packages/gplots/).
Gene Ontology (GO) and pathway
enrichment analysis of DEGs
The Database for Annotation, Visualization and
Integrated Discovery (DAVID; version 6.8; http://david.ncifcrf.gov) is an essential online tool
used for systematically automating the processes of biological term
classification and enrichment analysis of gene clusters (17). In the present study, to categorize
the DEGs and the enriched pathways, the DAVID database was employed
to identify and visualize the GO (www.geneontology.org) terms and Kyoto Encyclopedia of
Genes and Genomes (KEGG; www.genome.jp)
pathways enriched by the DEGs. Enrichment by ≥10 genes and
P<0.05 were set as the cut-off criteria for significant
enrichment. The P-value for each enriched pathway was calculated
via -log10 transformation. P<0.05 [-log10
(P-value)>1.30] was considered to indicate statistical
significance.
Analysis of the PPI network of the
DEGs
The Search Tool for the Retrieval of Interacting
Genes and proteins (STRING) database (version 10.0; string-db.org) encompasses >9,000,000 proteins and
integrates >932,000,000 known and predicted interactions between
proteins from a large number of organisms, including Homo
sapiens (18). In the present
study, the STRING database was used to construct the predicted PPI
network of DEGs with a minimum required interaction score of 0.4.
The PPI network was then visualized using Cytoscape software
(version 3.6.0) (19). Subsequently,
CytoNCA (version 2.1.6), a Cytoscape plugin for centrality analysis
of protein interaction networks, was utilized to identify crucial
nodes (genes) in the network (20).
In the present study, the crucial genes were screened based on four
different centrality measures: i) Eigenvector centrality; ii)
degree centrality; iii) betweenness centrality; and iv) closeness
centrality. According to the centrality values of the genes in the
PPI network, the top 3 ranked genes were identified as the crucial
genes.
Association between the expression
levels of the crucial genes and the survival of patients with
CRC
UALCAN is a user-friendly, interactive web resource
allowing researchers to analyse cancer transcriptome data from The
Cancer Genome Atlas (TCGA) database (https://portal.gdc.cancer.gov/) rapidly and easily
(21). UALCAN is a vital portal for
facilitating tumour gene expression and survival analyses using
TCGA level 3 RNA-sequencing and clinical data from 31 types of
cancer (22). UALCAN is designed to
provide: i) Easy access to cancer transcriptome data available to
the public; ii) high-quality graphs depicting gene expression and
patient survival information based on gene expression; and iii)
additional information regarding the selected genes/targets using
links to databases, including GeneCards (https://www.genecards.org/), PubMed (https://www.ncbi.nlm.nih.gov/pubmed), TargetScan
(https://www.targetscan.org/) and
DrugBank (https://www.drugbank.ca/). In the
present study, UALCAN was utilized to further validate and estimate
the effect of the expression levels of the crucial genes on the
survival of patients with colon cancer by drawing Kaplan-Meier
curves and performing log-rank tests. Furthermore, the protein
expression of the crucial genes was also determined by
immunohistochemical staining analysis, which was obtained from the
Human Protein Atlas (HPA) database (www.proteinatlas.org).
Results
Identification of DEGs
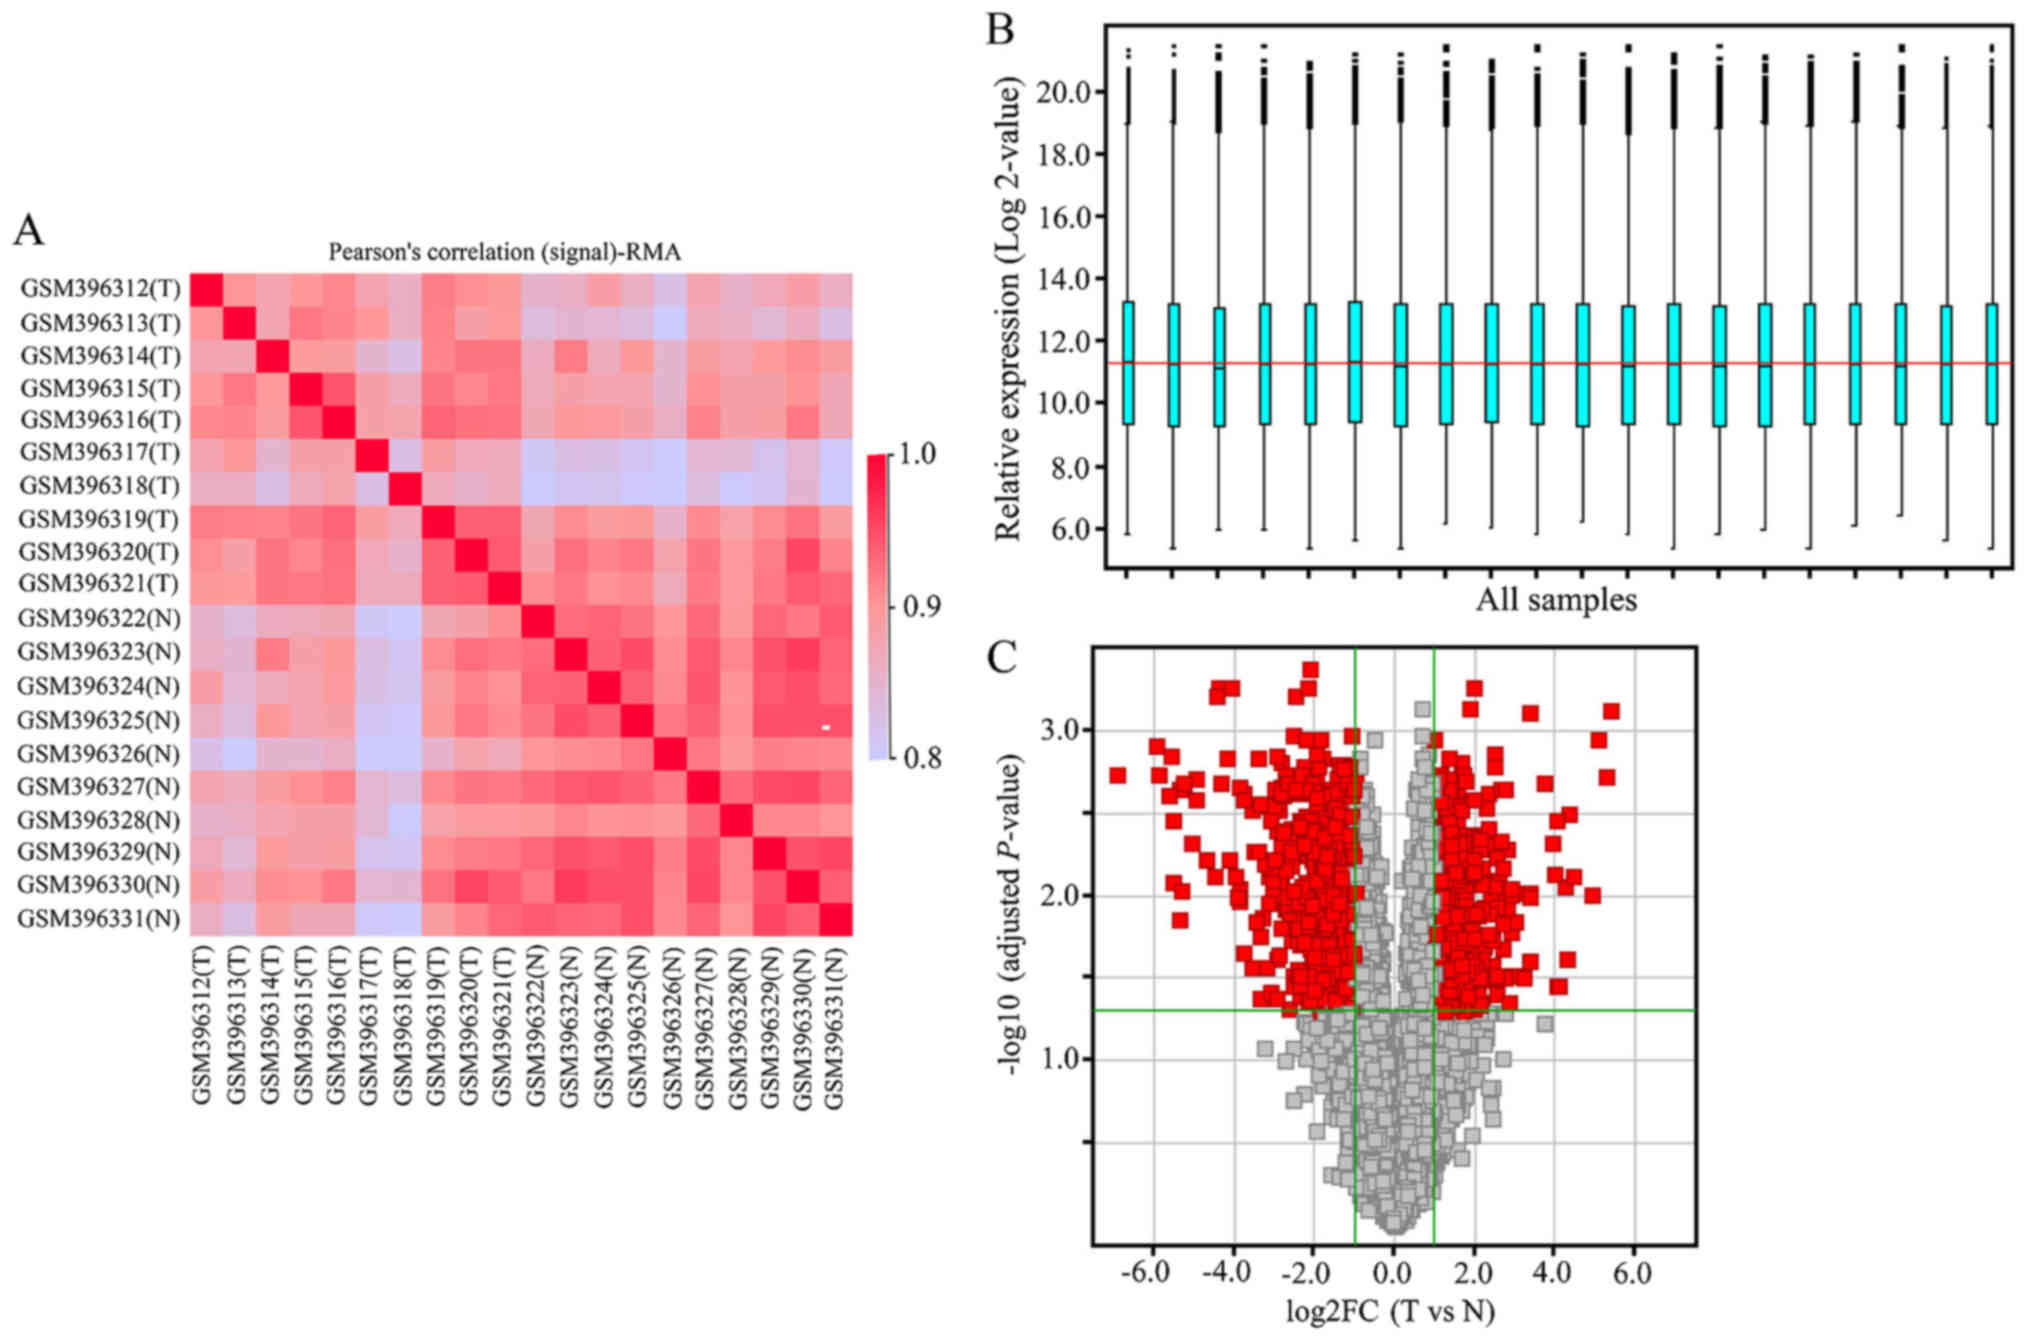
Initially, data from a total of 42 chips were
acquired from GEO dataset GSE15781. Following quality control, 20
chips that included data from 10 CRC tissues and the corresponding
matched normal tissues were selected. As shown in Fig. 1A and B, the Pearson's correlation
(signal) map and relative signal boxplot map of the pre-treated
data present the performance of normalisation. The data series from
each chip were analysed separately and information on the
expression levels of 16,227 genes was obtained using the GPL2986
platform. A total of 1,085 DEGs (tumour vs. normal tissues),
including 496 upregulated and 589 downregulated genes, were
selected based on the criteria of an adjusted P-value <0.05 and
|log2 (FC)|≥1 (Fig. 1C).
As presented in Table I, the top 10
upregulated DEGs were matrix metalloproteinase (MMP)7, defensin α
(DEFA)6, fatty acid binding protein 6, keratin 23, C-X-C motif
chemokine ligand (CXCL)8, inhibin subunit β A (INHBA), DEFA5,
transcobalamin 1, regenerating family member 3α and MMP3, and the
top 10 downregulated DEGs were aquaporin 8, carbonic anhydrase 1
(CA1)2, insulin-like 5, guanylate cyclase activator 2A, caspase
recruitment domain family member 14, solute carrier family 26
member 3, membrane spanning 4-domains A12, peptide YY, chloride
channel accessory 4 and CA4.
 | Table I.Top 10 upregulated and downregulated
genes in colorectal cancer tumor vs. normal tissues. |
Table I.
Top 10 upregulated and downregulated
genes in colorectal cancer tumor vs. normal tissues.
| Gene symbol | Log2
FC | Adjusted
P-value | Expression |
|---|
| MMP7 | 5.39 |
7.39×10⁻⁴ | Up |
| DEFA6 | 5.33 |
1.90×10⁻³ | Up |
| FABP6 | 5.25 |
1.10×10⁻³ | Up |
| KRT23 | 5.24 |
9.90×10⁻³ | Up |
| CXCL8 | 5.06 |
7.60×10⁻³ | Up |
| INHBA | 5.05 |
3.20×10⁻³ | Up |
| DEFA5 | 4.97 |
2.40×10⁻² | Up |
| TCN1 | 4.96 |
8.60×10⁻³ | Up |
| REG3A | 4.92 |
3.50×10⁻² | Up |
| MMP3 | 4.04 |
3.50×10⁻² | Up |
| AQP8 | −6.90 |
1.80×10⁻³ | Down |
| CA1 | −5.92 |
1.20×10⁻³ | Down |
| INSL5 | −5.90 |
1.80×10⁻³ | Down |
| GUCA2A | −5.61 |
2.40×10⁻³ | Down |
| CARD14 | −5.59 |
1.40×10⁻³ | Down |
| SLC26A3 | −5.54 |
3.50×10⁻³ | Down |
| MS4A12 | −5.50 |
8.10×10⁻³ | Down |
| PYY | −5.40 |
2.30×10⁻³ | Down |
| CLCA4 | −5.39 |
1.40×10⁻² | Down |
| CA4 | −5.33 |
9.30×10⁻³ | Down |
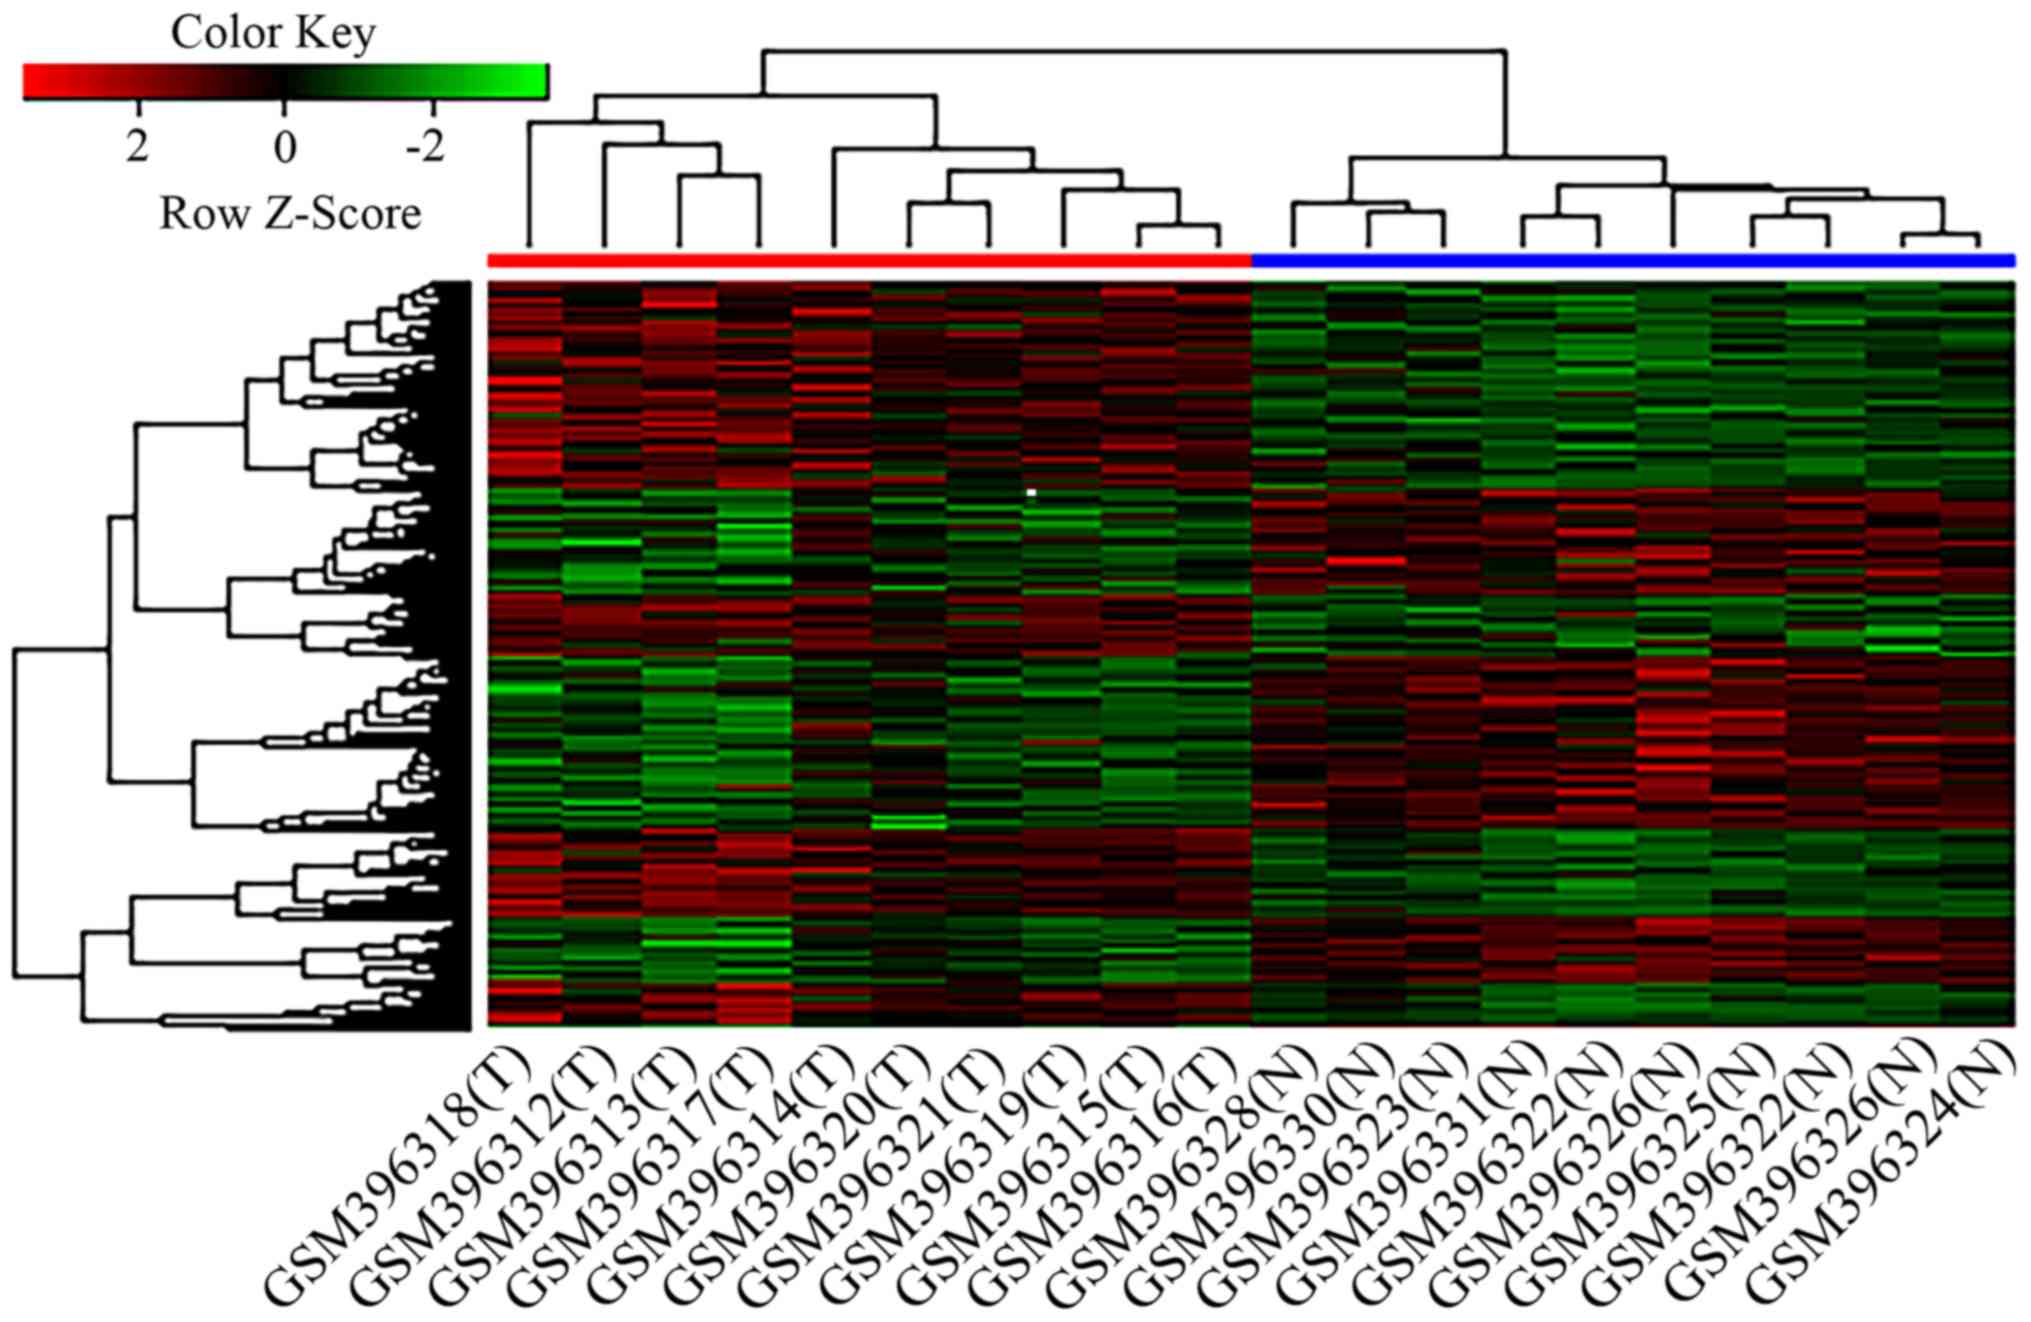
Hierarchical clustering analysis of
DEGs
Following the extraction of the expression values
for the DEGs, hierarchical clustering analysis was performed. As
presented in Fig. 2, the 20
specimens were divided into the CRC and normal groups. The heatmap
indicated that, in comparison with normal tissues, CRC tissues
exhibited more downregulated than upregulated genes. These results
indicated that the DEGs exhibited distinct expression patterns in
tumour and normal tissues.
GO term enrichment analysis of
DEGs
To investigate the function of the DEGs, GO term
enrichment analysis was performed using the online tool DAVID. The
analysis indicated that the DEGs were significantly enriched in 93
GO terms, including 54 terms in the category biological process
(BP), 12 terms in the category molecular function (MF) and 27 terms
in the category cellular component (CC) (Table SI). The top 5 BP terms were ‘mitotic
nuclear division’, ‘positive regulation of cell proliferation’,
‘one-carbon metabolic process’, ‘cell division’ and ‘immune
response’. The top 5 MF terms were ‘hormone activity’, ‘sodium
channel regulator activity’, ‘NAD binding’, ‘protein
homodimerization activity’ and ‘protein binding’. The top 5 CC
terms were ‘extracellular space’, ‘extracellular exosome’,
‘extracellular region’, ‘apical plasma membrane’ and ‘cytosol’
(Table II). In particular, the
upregulated DEGs were mainly enriched in the terms ‘nucleoplasm’
(P=6.32×10⁻¹⁷), ‘mitotic nuclear division’
(P=4.25×10⁻¹⁴) and ‘cell division’
(P=1.62×10⁻¹²) (Table
SII). The downregulated DEGs were mainly enriched in the terms
‘extracellular exosome’ (P=7.97×10⁻²⁰), ‘extracellular
space’ (P=2.62×10⁻¹³) and ‘plasma membrane’
(P=3.11×10⁻⁹) (Table
SIII).
| Table II.GO enrichment analysis of the
differentially expressed genes. |
Table II.
GO enrichment analysis of the
differentially expressed genes.
| Category | Term/gene
function | Gene counts | Percentage | P-value |
|---|
|
GOTERM_BP_DIRECT | GO:0007067~mitotic
nuclear division | 37 | 2.2 |
5.10×10⁻⁷ |
|
| GO:0008284~positive
regulation of cell proliferation | 53 | 3.2 |
7.25×10⁻⁶ |
|
|
GO:0006730~one-carbon metabolic
process | 10 | 0.6 |
3.88×10⁻⁵ |
|
| GO:0051301~cell
division | 41 | 2.5 |
4.75×10⁻⁵ |
|
| GO:0006955~immune
response | 46 | 2.8 |
6.21×10⁻⁵ |
|
GOTERM_MF_DIRECT | GO:0005179~hormone
activity | 18 | 1.1 |
2.70×10⁻⁵ |
|
| GO:0017080~sodium
channel regulator activity | 10 | 0.6 |
6.21×10⁻⁵ |
|
| GO:0051287~NAD
binding | 10 | 0.6 |
2.63×10⁻⁴ |
|
| GO:0042803~protein
homodimerization activity | 66 | 4.1 |
4.18×10⁻⁴ |
|
| GO:0005515~protein
binding | 563 | 34.8 |
5.65×10⁻⁴ |
|
GOTERM_CC_DIRECT |
GO:0005615~extracellular space | 153 | 9.5 |
1.90×10⁻¹⁶ |
|
|
GO:0070062~extracellular exosome | 248 | 15.3 |
3.86×10⁻¹³ |
|
|
GO:0005576~extracellular region | 135 | 8.3 |
4.92×10⁻⁶ |
|
| GO:0016324~apical
plasma membrane | 37 | 2.3 |
1.08×10⁻⁵ |
|
|
GO:0005829~cytosol | 241 | 14.9 |
2.92×10⁻⁵ |
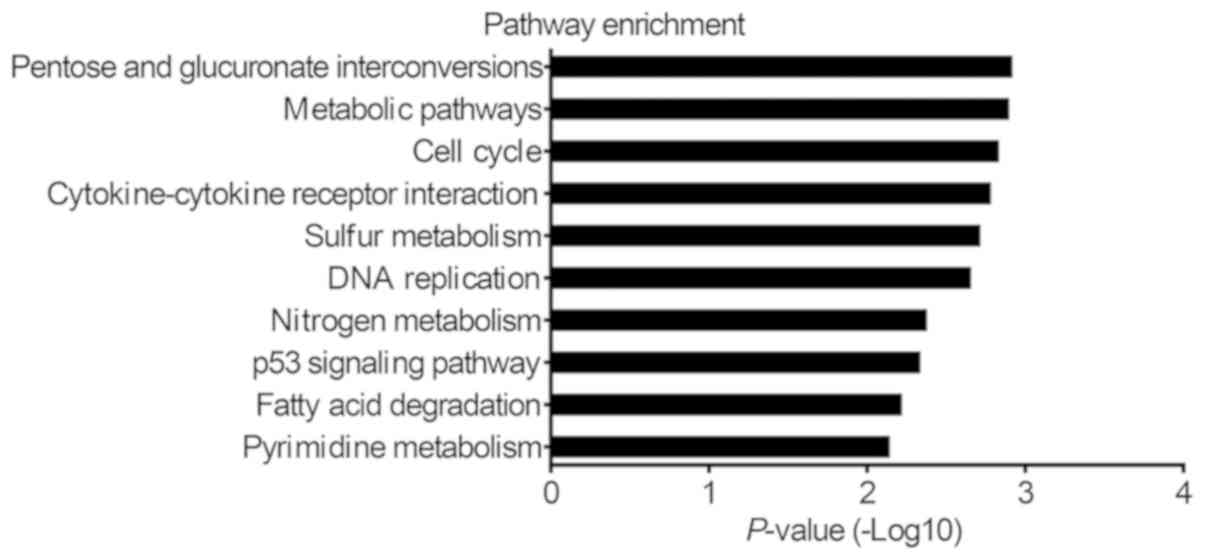
KEGG pathway enrichment analysis of
DEGs
Furthermore, KEGG pathway analysis was performed to
identify pathways in which the DEGs were involved. The results
indicated that the DEGs were significantly enriched in 43 pathways,
including 22 and 18 significantly enriched pathways for the
upregulated and downregulated genes, respectively. The top 10
enriched pathways were the ‘pentose and glucuronate
interconversion’, ‘metabolic pathways’, ‘cell cycle’,
‘cytokine-cytokine receptor interaction’, ‘sulfur metabolism’, ‘DNA
replication’, ‘nitrogen metabolism’, ‘p53 signalling pathway’,
‘fatty acid degradation’ and ‘pyrimidine metabolism’ (Fig. 3). In particular, the most significant
KEGG pathways enriched by the upregulated DEGs were ‘cell cycle’
(P=2.41×10⁻⁸), ‘p53 signaling pathway’
(P=2.71×10⁻⁵) and ‘tumour necrosis factor signaling
pathway’ (P=3.46×10⁻⁴) (Table SIV). The most significant KEGG
pathways enriched by the downregulated DEGs were ‘retinol
metabolism’ (P=5.15×10⁻⁴), ‘drug metabolism-cytochrome
P450’ (P=8.10×10⁻⁴) and ‘metabolic pathways’
(P=2.39×10⁻³) (Table
SV).
Construction of the PPI network of the
DEGs
Based on information from the STRING database, a PPI
network was constructed to identify the most momentous proteins
that may serve crucial roles in colorectal carcinogenesis and CRC
development. A total of 1,012 nodes and 8,332 edges were contained
in the PPI network (Fig. S1). Each
gene was assigned a degree representing the number of neighbouring
nodes in the network and changes in the expression of the
proteins/genes. The top 10 nodes with the highest degrees in CRC
were interleukin (IL)6, MYC, CDK1, cyclin (CCN)B1, CCNA2, DNA
topoisomerase IIα, aurora kinase A, CXCL8, BUB1 mitotic checkpoint
serine/threonine kinase and mitotic arrest deficient 2 like 1
(Table III). The high degrees of
these genes indicated that their proteins may serve crucial roles
in maintaining the whole protein interaction network. In addition,
to explore the significance of these DEGs, centrality analysis of
nodes in the PPI network was performed. The results demonstrated
that IL6, MYC, NOTCH1, INHBA, CDK1, CCNB1 and CCNA2 were crucial
genes (Table IV). As indicated in
Fig. 1C, the expression levels of
all of these crucial genes were markedly upregulated in CRC.
| Table III.Top 10 nodes with highest degrees of
interaction in colorectal cancer. |
Table III.
Top 10 nodes with highest degrees of
interaction in colorectal cancer.
| Gene | Node degree | Betweenness
centrality | Closeness
centrality | Stress
centrality | Clustering
coefficient |
|---|
| IL6 | 135 | 0.085 | 0.437 | 976,462 | 0.111 |
| MYC | 127 | 0.084 | 0.445 | 1,307,298 | 0.127 |
| CDK1 | 118 | 0.021 | 0.397 | 354,950 | 0.387 |
| CCNB1 | 111 | 0.015 | 0.397 | 301,564 | 0.427 |
| CCNA2 | 102 | 0.009 | 0.387 | 200,222 | 0.475 |
| TOP2A | 102 | 0.012 | 0.397 | 236,116 | 0.496 |
| AURKA | 101 | 0.016 | 0.393 | 246,324 | 0.476 |
| CXCL8 | 97 | 0.029 | 0.416 | 408,590 | 0.202 |
| BUB1 | 94 | 0.005 | 0.369 | 106,422 | 0.567 |
| MAD2L1 | 94 | 0.009 | 0.366 | 135,590 | 0.530 |
| Table IV.Top 3 genes ranked by the node
centrality of the protein-protein interaction network. |
Table IV.
Top 3 genes ranked by the node
centrality of the protein-protein interaction network.
|
| Degree
centrality | Betweenness
centrality | Closeness
centrality | Eigenvector
centrality |
|---|
|
|
|
|
|
|
|---|
| Rank | Gene symbol | Expression in
CRC | Gene symbol | Expression in
CRC | Gene symbol | Expression in
CRC | Gene symbol | Expression in
CRC |
|---|
| 1 | IL6 | Upregulated | MYC | Upregulated | IL6 | Upregulated | CDK1 | Upregulated |
| 2 | MYC | Upregulated | IL6 | Upregulated | MYC | Upregulated | CCNB1 | Upregulated |
| 3 | NOTCH1 | Upregulated | INHBA | Upregulated | CDK1 | Upregulated | CCNA2 | Upregulated |
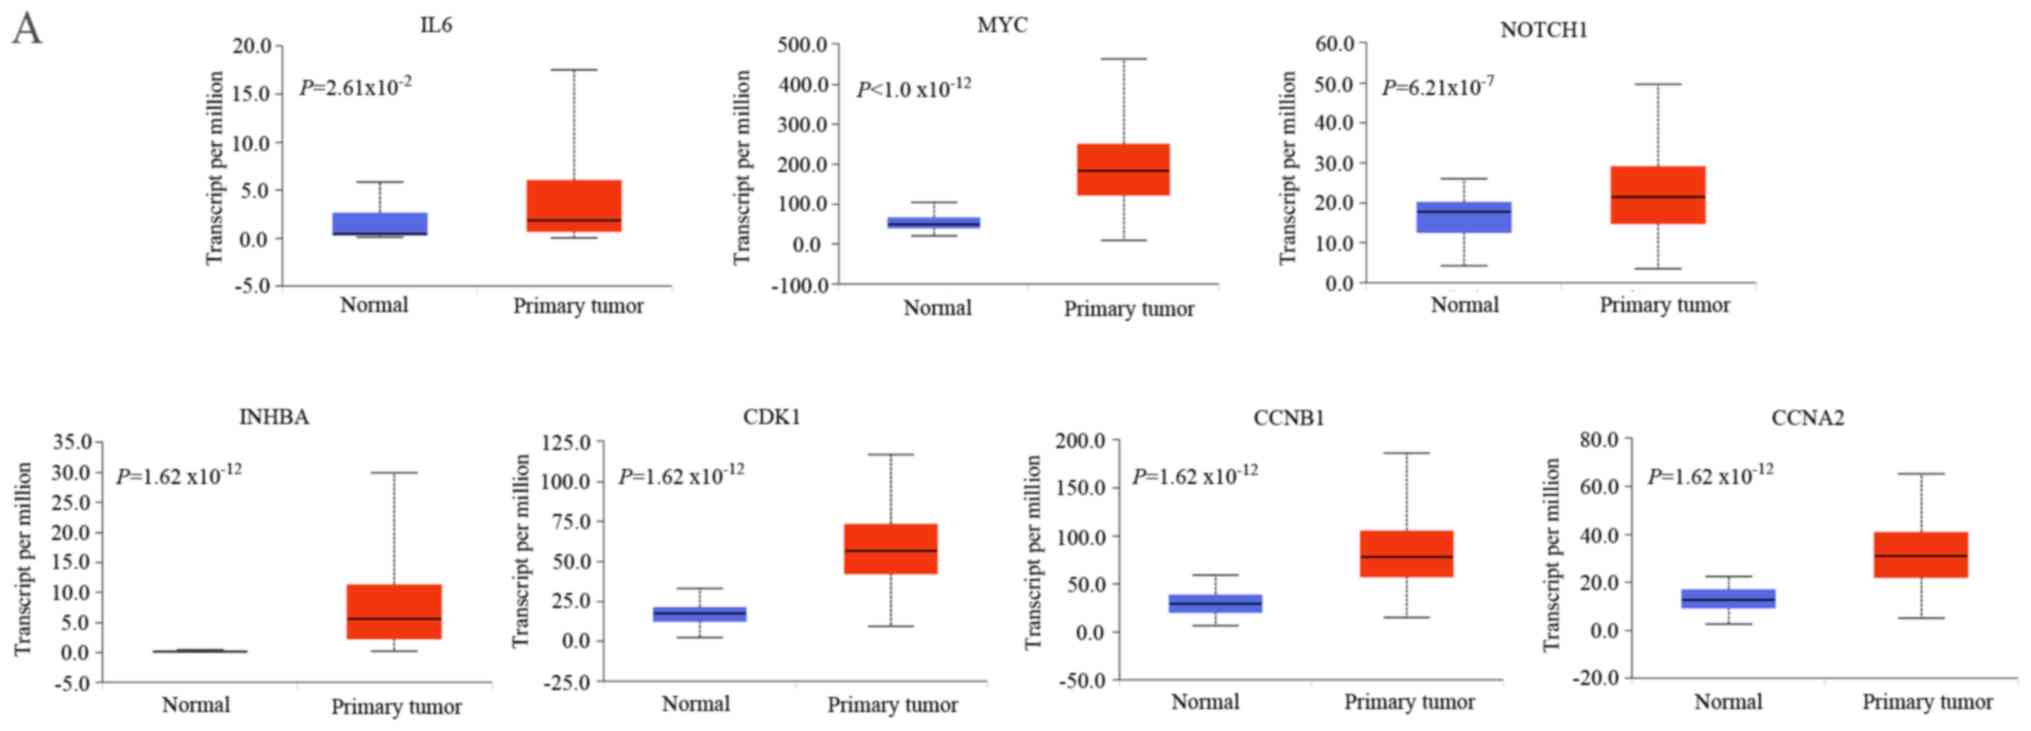
Validation of the expression levels of
the crucial genes
To validate the expression levels of the crucial
genes identified, UALCAN was employed based on TCGA data. The
results suggested that these crucial genes were also significantly
upregulated in CRC tissues, which was consistent with the
microarray results (Fig. 4A). As
presented in Fig. 4B, the protein
expression levels of the crucial genes were markedly elevated in
CRC tissues based on the HPA database, with the exception that
INHBA protein expression data has not yet been made public.
Association between the expression
levels of the crucial genes and survival
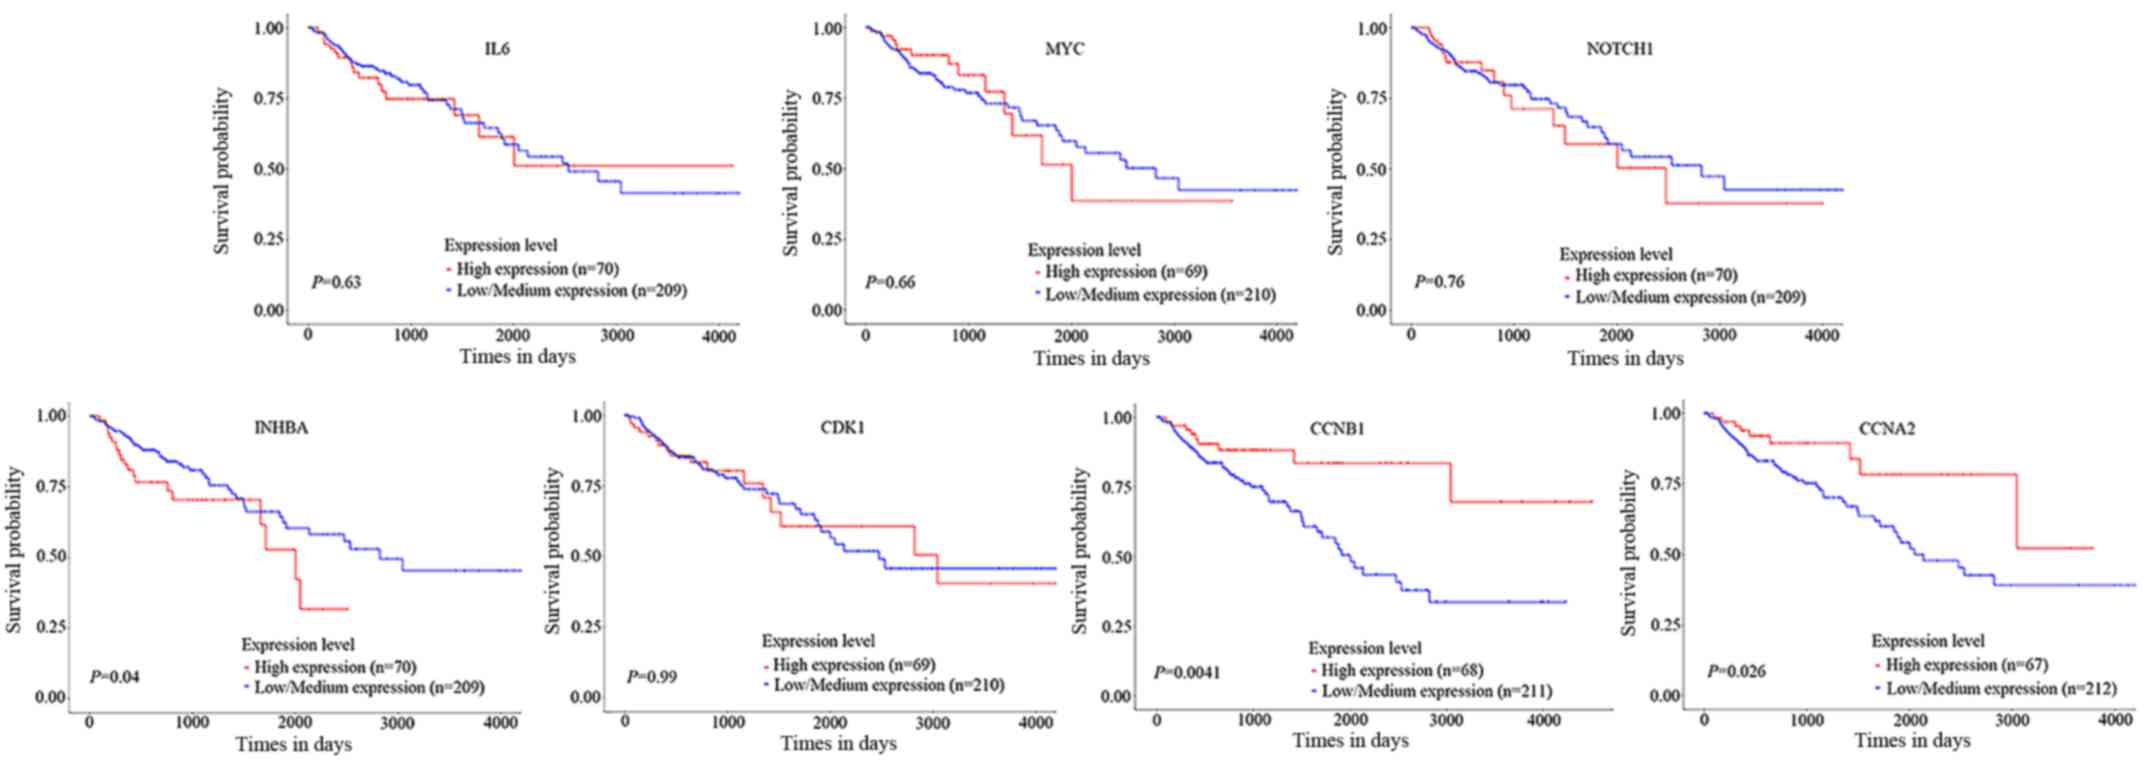
To determine the potential effect of the crucial
genes on survival, UALCAN was further used to perform survival
analyses based on TCGA data. The results indicated that elevated
expression levels of INHBA significantly decreased survival
probability of patients with CRC; however, upregulation of CCNB1
and CCNA2 expression were associated with increased survival rates
(Fig. 5).
Discussion
With an increasing incidence rate and poor
prognosis, CRC is commonly considered a devastating disease
(2). By 2030, 2.2 million new cases
and 1.1 million cases of mortality are predicted to occur, a
situation that is responsible for the rising global burden of CRC
(23). Although numerous studies
have reported that unhealthy dietary habits, environmental changes
and genetic aberrancies may be the primary causes of CRC, the
precise molecular events orchestrating CRC initiation and
progression remain elusive (24,25). In
the present study, bioinformatics methods were used to identify the
crucial genes and pathways associated with CRC. A total of 1,085
DEGs, comprising 496 upregulated and 589 downregulated genes, were
identified in CRC tissues by comparison of gene expression profiles
between 10 cancer tissues and corresponding non-cancerous tissues.
Subsequently, hierarchical clustering analysis revealed that the
DEGs exhibited distinct expression patterns between cancer and
normal tissues.
To further comprehend the biological effects of the
DEGs identified and the pathways associated with CRC that they
accumulate in, GO term and KEGG pathway enrichment analyses were
performed. The results of the GO term functional analysis indicated
that the DEGs identified were mainly involved in the following
terms: ‘Mitotic nuclear division’, ‘positive regulation of cell
proliferation’, ‘one-carbon metabolic process’, ‘cell division’,
‘immune response’, ‘hormone activity’, ‘sodium channel regulator
activity’, ‘NAD binding’, ‘protein homodimerization activity’ and
‘protein binding’. The results of the KEGG pathway analysis
indicated that the DEGs were mainly enriched in metabolism,
proliferation and and inflammatory response-related pathways,
including ‘Metabolic pathways’, ‘cell cycle’, ‘cytokine-cytokine
receptor interaction’, ‘p53 signaling pathway’ and ‘pyrimidine
metabolism’. Previous studies have demonstrated that the
dysregulation of various BP terms, including ‘cell division’ and
‘immune response’, and the activation of multiple signalling
pathway terms, including ‘metabolic pathways’, ‘cell cycle’ and
‘p53 signalling’, affect tumour development and patient survival
(26–28). However, the underlying mechanisms
through which the corresponding proteins in these signalling
cascades promote tumorigenesis remain elusive. Therefore, further
investigation of these identified BP and signalling pathway terms
may aid in elucidating the underlying mechanisms of the
carcinogenesis of CRC.
According to the node centrality of the PPI network,
the seven crucial DEGs were identified as CDK1, CCNB1, CCNA2, IL6,
MYC, INHBA and NOTCH1. Subsequently, the expression levels of these
crucial genes were further investigated based on TCGA data. The
results suggested that all crucial genes identified were
significantly upregulated in colon carcinoma, which was consistent
with the microarray results. Among these crucial genes, CDK1,
CCNB1, CCNA2, IL6 and NOTCH1 have been reported to be associated
with CRC proliferation and progression (29–33). In
particular, CDK1 is a key regulator of the G2/M
checkpoint and is considered to be a possible target for cancer
treatment (30). For instance,
Thorenoor et al (29)
indicated that CDK1 serves an important role in the regulation of
the cell cycle and apoptosis of CRC cells through the p53 pathway.
Fang et al (30) demonstrated
that CCNB1 is positively associated with the expression of
checkpoint kinase 1, and is able to be activated by CDK1 to exert
its oncogenic role in CRC cells. CCNA2, a novel oncogene, has been
reported to serve a critical role in regulating cellular growth and
apoptosis and may serve as a novel biomarker for diagnosis and
therapy in CRC (31). IL6, a
proinflammatory cytokine secreted by immune cells, may mediate
immune and CRC cell cross-talk via miR-21 and miR-29b to produce an
inflammatory microenvironment sufficient for promoting metastatic
growth (32). In addition, Miteva
et al (33) have reported
that overexpression of IL6 promotes the migration and invasion of
CRC cells, and upregulation of IL6 may be a transcriptional profile
hallmark of colorectal metastases. Lv et al (34) have revealed that MYC regulates CRC
progression, and that its overexpression enhances tumour metastasis
and chemotherapy resistance in CRC. INHBA is a member of the
transforming growth factor β superfamily. Okano et al
(35) have suggested that
overexpression of INHBA promotes cell growth and that its levels
may be a useful prognostic marker for patients with CRC. Zhang
et al (36) indicated that
overexpression of NOTCH1 promotes the migration, invasion and
proliferation of CRC cells. Furthermore, the NOTCH1 signalling
pathway has been reported to mediate the radio- and chemoresistance
of multiple tumour types (37,38). For
instance, inhibition of the NOTCH1 signalling pathway improves the
radiosensitivity of CRC cells (36),
providing a potential therapeutic target to improve the effect of
radiotherapy in patients with CRC. To explore prognostic biomarkers
for CRC, UALCAN was utilized to analyse the effect of the
expression levels of certain crucial genes identified on the
survival of patients with CRC. High expression levels of CCNB1,
CCNA2 and INHBA were indicated to be associated with poor survival
in patients with CRC.
In conclusion, the present bioinformatics study
identified crucial genes and pathways associated with CRC, which
will not only contribute to the elucidation of the pathogenesis of
CRC, but also provide potential prognostic markers and therapeutic
targets for CRC management. However, the present study is limited
partly due to the small quantity of samples and lack of
experimental confirmation. Therefore, further verification of the
expression profiles in CRC via in vivo and in vitro
experiments is required.
Supplementary Material
Supporting Data
Acknowledgements
The authors would like to thank Dr Yizhou Jiang for
providing technical support.
Funding
No funding was received.
Availability of data and materials
The datasets used and/or analyzed during the current
study are available from the corresponding author on reasonable
request.
Authors' contributions
XQL, XDL and TQ conceived and designed the study.
XQL, XDL and WC analyzed the microarray datasets and interpreted
the results. XQL, XDL and WC drafted and revised the manuscript.
All authors read and approved the final manuscript.
Ethics approval and consent to
participate
Not applicable.
Patient consent for publication
Not applicable.
Competing interests
The authors declare that they have no competing
interests.
References
|
1
|
Siegel RL, Miller KD and Jemal A: Cancer
statistics, 2019. CA Cancer J Clin. 69:7–34. 2019. View Article : Google Scholar : PubMed/NCBI
|
|
2
|
Bray F, Ferlay J, Soerjomataram I, Siegel
RL, Torre LA and Jemal A: Global cancer statistics 2018: GLOBOCAN
estimates of incidence and mortality worldwide for 36 cancers in
185 countries. CA Cancer J Clin. 68:394–424. 2018. View Article : Google Scholar : PubMed/NCBI
|
|
3
|
Al Bandar MH and Kim NK: Current status
and future perspectives on treatment of liver metastasis in
colorectal cancer (Review). Oncol Rep. 37:2553–2564. 2017.
View Article : Google Scholar : PubMed/NCBI
|
|
4
|
Kim SC, Shin YK, Kim YA, Jang SG and Ku
JL: Identification of genes inducing resistance to ionizing
radiation in human rectal cancer cell lines: Re-sensitization of
radio-resistant rectal cancer cells through down regulating NDRG1.
BMC Cancer. 18:5942018. View Article : Google Scholar : PubMed/NCBI
|
|
5
|
Andersen SE, Andersen IB, Jensen BV,
Pfeiffer P, Ota T and Larsen JS: A systematic review of
observational studies of trifluridine/tipiracil (TAS-102) for
metastatic colorectal cancer. Acta Oncol. 58:1149–1157. 2019.
View Article : Google Scholar : PubMed/NCBI
|
|
6
|
Jin S, Mu Y, Wang X, Liu Z, Wan L, Xiong
Y, Zhang Y, Zhou L and Li L: Overexpressed RACK1 is positively
correlated with malignant degree of human colorectal carcinoma. Mol
Biol Rep. 41:3393–3399. 2014. View Article : Google Scholar : PubMed/NCBI
|
|
7
|
Li XY, Hu Y, Li NS, Wan JH, Zhu Y and Lu
NH: RACK1 acts as a potential tumor promoter in colorectal cancer.
Gastroenterol Res Pract. 2019:56250262019. View Article : Google Scholar : PubMed/NCBI
|
|
8
|
Ouyang S, Zhou X, Chen Z, Wang M, Zheng X
and Xie M: LncRNA BCAR4, targeting to miR-665/STAT3 signaling,
maintains cancer stem cells stemness and promotes tumorigenicity in
colorectal cancer. Cancer Cell Int. 19:722019. View Article : Google Scholar : PubMed/NCBI
|
|
9
|
Shangguan H, Tan SY and Zhang JR:
Bioinformatics analysis of gene expression profiles in
hepatocellular carcinoma. Eur Rev Med Pharmacol Sci. 19:2054–2061.
2015.PubMed/NCBI
|
|
10
|
Kosti A, Harry Chen HI, Mohan S, Liang S,
Chen Y and Habib SL: Microarray profile of human kidney from
diabetes, renal cell carcinoma and renal cell carcinoma with
diabetes. Genes Cancer. 6:62–70. 2015.PubMed/NCBI
|
|
11
|
Christgen M, Geffers R, Kreipe H and
Lehmann U: IPH-926 lobular breast cancer cells are triple-negative
but their microarray profile uncovers a luminal subtype. Cancer
Sci. 104:1726–1730. 2013. View Article : Google Scholar : PubMed/NCBI
|
|
12
|
Yu J, Li X, Zhong C, Li D, Zhai X, Hu W,
Guo C, Yuan Y and Zheng S: High-throughput proteomics integrated
with gene microarray for discovery of colorectal cancer potential
biomarkers. Oncotarget. 7:75279–75292. 2016. View Article : Google Scholar : PubMed/NCBI
|
|
13
|
Shen X, Yue M, Meng F, Zhu J, Zhu X and
Jiang Y: Microarray analysis of differentially-expressed genes and
linker genes associated with the molecular mechanism of colorectal
cancer. Oncol Lett. 12:3250–3258. 2016. View Article : Google Scholar : PubMed/NCBI
|
|
14
|
Snipstad K, Fenton CG, Kjaeve J, Cui G,
Anderssen E and Paulssen RH: New specific molecular targets for
radio-chemotherapy of rectal cancer. Mol Oncol. 4:52–64. 2010.
View Article : Google Scholar : PubMed/NCBI
|
|
15
|
Gautier L, Cope L, Bolstad BM and Irizarry
RA: Affy-analysis of Affymetrix GeneChip data at the probe level.
Bioinformatics. 20:307–315. 2004. View Article : Google Scholar : PubMed/NCBI
|
|
16
|
Hardcastle TJ: Generalised empirical
Bayesian methods for discovery of differential data in
high-throughput biology. Bioinformatics. 32:195–202.
2016.PubMed/NCBI
|
|
17
|
Huang DW, Sherman BT, Tan Q, Kir J, Liu D,
Bryant D, Guo Y, Stephens R, Baseler MW, Lane HC and Lempicki RA:
DAVID Bioinformatics Resources: Expanded annotation database and
novel algorithms to better extract biology from large gene lists.
Nucleic Acids Res. 35:W169–W175. 2007. View Article : Google Scholar : PubMed/NCBI
|
|
18
|
Szklarczyk D, Morris JH, Cook H, Kuhn M,
Wyder S, Simonovic M, Santos A, Doncheva NT, Roth A, Bork P, et al:
The STRING database in 2017: Quality-controlled protein-protein
association networks, made broadly accessible. Nucleic Acids Res.
45:D362–D368. 2017. View Article : Google Scholar : PubMed/NCBI
|
|
19
|
Shannon P, Markiel A, Ozier O, Baliga NS,
Wang JT, Ramage D, Amin N, Schwikowski B and Ideker T: Cytoscape: A
software environment for integrated models of biomolecular
interaction networks. Genome Res. 13:2498–2504. 2003. View Article : Google Scholar : PubMed/NCBI
|
|
20
|
Tang Y, Li M, Wang J, Pan Y and Wu FX:
CytoNCA: A cytoscape plugin for centrality analysis and evaluation
of protein interaction networks. Biosystems. 127:67–72. 2015.
View Article : Google Scholar : PubMed/NCBI
|
|
21
|
Chandrashekar DS, Bashel B, Balasubramanya
SAH, Creighton CJ, Ponce-Rodriguez I, Chakravarthi BVSK and
Varambally S: UALCAN: A portal for facilitating tumor subgroup gene
expression and survival analyses. Neoplasia. 19:649–658. 2017.
View Article : Google Scholar : PubMed/NCBI
|
|
22
|
Gao X, Wang X and Zhang S: Bioinformatics
identification of crucial genes and pathways associated with
hepatocellular carcinoma. Biosci Rep. 38:BSR201814412018.
View Article : Google Scholar : PubMed/NCBI
|
|
23
|
Hassanain M, Al-Alem F, Simoneau E, Traiki
TA, Alsaif F, Alsharabi A, Al-Faris H and Al-Saleh K: Colorectal
cancer liver metastasis trends in the kingdom of Saudi Arabia.
Saudi J Gastroenterol. 22:370–374. 2016. View Article : Google Scholar : PubMed/NCBI
|
|
24
|
Katsidzira L, Ocvirk S, Wilson A, Li J,
Mahachi CB, Soni D, DeLany J, Nicholson JK, Zoetendal EG and
O'Keefe SJD: Differences in fecal gut microbiota, short-chain fatty
acids and bile acids link colorectal cancer risk to dietary changes
associated with urbanization among zimbabweans. Nutr Cancer.
71:1313–1324. 2019. View Article : Google Scholar : PubMed/NCBI
|
|
25
|
Park Y, Park SJ, Cheon JH, Kim WH and Kim
TI: Association of family history with cancer recurrence, survival,
and the incidence of colorectal adenoma in patients with colorectal
cancer. J Cancer Prev. 24:1–10. 2019. View Article : Google Scholar : PubMed/NCBI
|
|
26
|
Cordier-Bussat M, Thibert C, Sujobert P,
Genestier L, Fontaine É and Billaud M: Even the Warburg effect can
be oxidized: Metabolic cooperation and tumor development. Med Sci
(Paris). 34:701–708. 2018.(In French). View Article : Google Scholar : PubMed/NCBI
|
|
27
|
Subramanian C and Cohen MS: Over
expression of DNA damage and cell cycle dependent proteins are
associated with poor survival in patients with adrenocortical
carcinoma. Surgery. 165:202–210. 2019. View Article : Google Scholar : PubMed/NCBI
|
|
28
|
Suehiro Y, Takemoto Y, Nishimoto A, Ueno
K, Shirasawa B, Tanaka T, Kugimiya N, Suga A, Harada E and Hamano
K: Dclk1 Inhibition cancels 5-FU-induced cell-cycle arrest and
decreases cell survival in colorectal cancer. Anticancer Res.
38:6225–6230. 2018. View Article : Google Scholar : PubMed/NCBI
|
|
29
|
Thorenoor N, Faltejskova-Vychytilova P,
Hombach S, Mlcochova J, Kretz M, Svoboda M and Slaby O: Long
non-coding RNA ZFAS1 interacts with CDK1 and is involved in
p53-dependent cell cycle control and apoptosis in colorectal
cancer. Oncotarget. 7:622–637. 2016. View Article : Google Scholar : PubMed/NCBI
|
|
30
|
Fang Y, Yu H, Liang X, Xu J and Cai X:
Chk1-induced CCNB1 overexpression promotes cell proliferation and
tumor growth in human colorectal cancer. Cancer Biol Ther.
15:1268–1279. 2014. View Article : Google Scholar : PubMed/NCBI
|
|
31
|
Gan Y, Li Y, Li T, Shu G and Yin G: CCNA2
acts as a novel biomarker in regulating the growth and apoptosis of
colorectal cancer. Cancer Manag Res. 10:5113–5124. 2018. View Article : Google Scholar : PubMed/NCBI
|
|
32
|
Patel SA and Gooderham NJ: IL6 mediates
immune and colorectal cancer cell cross-talk via miR-21 and
miR-29b. Mol Cancer Res. 13:1502–1508. 2015. View Article : Google Scholar : PubMed/NCBI
|
|
33
|
Miteva LD, Stanilov NS, Cirovski GМ and
Stanilova SA: Upregulation of Treg-related genes in addition with
IL6 showed the significant role for the distant metastasis in
colorectal cancer. Cancer Microenviron. 10:69–76. 2017. View Article : Google Scholar : PubMed/NCBI
|
|
34
|
Lv Z, Wei J, You W, Wang R, Shang J, Xiong
Y, Yang H, Yang X and Fu Z: Disruption of the
c-Myc/miR-200b-3p/PRDX2 regulatory loop enhances tumor metastasis
and chemotherapeutic resistance in colorectal cancer. J Transl Med.
15:2572017. View Article : Google Scholar : PubMed/NCBI
|
|
35
|
Okano M, Yamamoto H, Ohkuma H, Kano Y, Kim
H, Nishikawa S, Konno M, Kawamoto K, Haraguchi N, Takemasa I, et
al: Significance of INHBA expression in human colorectal cancer.
Oncol Rep. 30:2903–2908. 2013. View Article : Google Scholar : PubMed/NCBI
|
|
36
|
Zhang H, Jiang H, Chen L, Liu J, Hu X and
Zhang H: Inhibition of Notch1/Hes1 signaling pathway improves
radiosensitivity of colorectal cancer cells. Eur J Pharmacol.
818:364–370. 2018. View Article : Google Scholar : PubMed/NCBI
|
|
37
|
Sajadimajd S and Yazdanparast R:
Differential behaviors of trastuzumab-sensitive and -resistant
SKBR3 cells treated with menadione reveal the involvement of
Notch1/Akt/FOXO1 signaling elements. Mol Cell Biochem. 408:89–102.
2015. View Article : Google Scholar : PubMed/NCBI
|
|
38
|
Prabakaran DS, Muthusami S, Sivaraman T,
Yu JR and Park WY: Silencing of FTS increases radiosensitivity by
blocking radiation-induced Notch1 activation and spheroid formation
in cervical cancer cells. Int J Biol Macromol. 126:1318–1325. 2019.
View Article : Google Scholar : PubMed/NCBI
|