Introduction
Currently, there is an increasing attention to
altered energy metabolism in cancer. In normal cells, adequate
oxygen usually inhibits glycolysis, allowing mitochondrial
oxidative phosphorylation to generate ATP using glycolytic pyruvate
(1). However, it is widely accepted
that cancer cells increase, but do not decrease glycolysis even in
an oxygen-sufficient environment. This notable phenomenon is well
known as Warburg hypothesis (2),
although the significance it confers to cancer cells has not been
completely understood. In support of the hypothesis, multiple
reports have shown that hexokinase II (HK2) and lactate
dehydrogenase A (LDHA), which are critical enzymes, respectively
catalyzing the initial and final steps of glycolysis, were
overexpressed in many types of cancers (3–6).
Recently, several lines of evidence have also revealed the new role
of aerobic glycolysis, by which it does not only supply ATP but
also yields biomass such as nucleotides, amino acids, or lipids
necessary for cell proliferation (7).
Besides glucose, the mammalian cells can use other
nutrients for energy production. Such alternatives include amino
acids, especially glutamine, which is the most abundant amino acid
in mammals (8). The oxidizing
pathway of glutamine, a phenomenon known as glutaminolysis, begins
with conversion of glutamine to glutamate by glutaminase (GA).
Glutaminolysis shares several steps with TCA cycle, which leads to
the recognition that glutamine is a source of energy generation
(9). For cancer-specific metabolism,
increased glutaminolysis is considered an important hallmark
(10). Clinicopathological
examination using immunohistochemistry showed that there was a
relationship between increased GA expression and the malignant
property of colorectal cancer (CRC) (11). There are two isoenzymes of GA, as
denoted by the kidney and the liver-types encoded by GLS1
and GLS2 genes, respectively (12). In previous studies, the kidney-type
of GA was indicated to play a role in facilitating tumorigenesis
(13).
Tumor budding is defined as the presence of single
malignant cells or small clusters composed of fewer than five cells
at the invasive margin of tumors (14). Numerous evidence has shown that tumor
budding is associated with adverse outcome, such as lymph node and
distant metastasis of CRC (15).
From the biological point of view, it is believed that this
morphological feature is closely related to epithelial-mesenchymal
transition (16). However, the
metabolic characteristics particularly for tumor budding at the
invasive margin remain unexplored.
In the present study, we investigated the
immunohistochemical expression of energy-associated enzymes such as
GA, LDHA, and HK2 in CRC, and we discussed the potential role of
the metabolic alterations specifically at the invasive margin
including tumor budding.
Materials and methods
Patients and tumor materials
Ninety-eight formalin-fixed and paraffin-embedded
specimens of surgically resected T3 CRC, diagnosed at the Division
of Pathology of Osaka Medical College hospital in 2013 were
evaluated. Excluded were patients receiving chemotherapy or
radiation therapy prior to surgery. Clinical data were obtained by
reviewing patients' medical records. Pathological stages were
determined according to American Joint Committee on Cancer 7th
edition criteria for tumor staging (17). The primary sites of CRC were divided
into right and left, with the splenic flexure as the dividing
point. This study was approved by the Institutional Review Board
(IRB) of Osaka Medical College (Approval no. 1571). The requirement
for the written consent used for the research was waived by the IRB
under the conditions being to use clinical data anonymously, to
publicize the use of residual tissues, and to give participants the
opportunity to opt out.
Histological and immunohistochemical
analyses
Representative hematoxylin and eosin-stained
sections were selected, and two pathologists reexamined all
histopathological classification according to WHO criteria
(18). Tumor budding was analyzed in
accordance with the international evidence-based scoring system
(19). Based on the bud count using
20× objective lens, those located principally at the invasive
margin of tumors were categorized as follows: Low, <5 buds;
intermediate, 5–9 buds; high, ≥10 buds. The invasive margin was
defined as the five most distant cell layers from the central parts
of tumors, and the tumor center was defined as the bulk of tumors
excluding the invasive margin and the surface. Immunohistochemical
staining was performed following the manufacturer's protocol
(Vector Laboratories). Briefly, sections of 4 µm thickness were cut
from the representative paraffin block. After deparaffinization,
endogenous peroxidase activity was quenched by 10 min incubation in
3% hydrogen peroxide solution. Then the sections were subjected to
antigen retrieval using heat from pressure cooker, and were
incubated with primary antibodies at room temperature for 30 min.
The primary antibodies used were as follows: GA, rabbit monoclonal
antibody (Abcam), recognizing the kidney type and encoded by
GLS1, in a dilution of 1:400; LDHA, rabbit monoclonal
antibody (Abcam) in a dilution of 1:2,000; HK2, rabbit monoclonal
antibody (Proteintech) in a dilution of 1:100. Subsequently, all
sections were kept in 3,3-diaminobenzidine as a chromogen for 5
min. As negative controls, sections were treated by omitting the
primary antibodies.
Immunohistochemical evaluation
We evaluated the immunostaining of GA protein
initially on the entire tumor areas of the representative section.
Immunoreactivity was classified using a modified method as
previously described: Grade 1, immunopositive in <25% of tumor
cells; grade 2, immunopositive in 25–50% of tumor cells; grade 3,
immunopositive in >50% of tumor cells (20). In this setting, only the proportion
of stained cells throughout the entire tumor areas was examined,
and the intensity of staining was not considered. In addition, the
superficial layers of the tumors were not examined because of vague
immunopositivity, possibly due to erosive and necrotic changes.
Grade 1 was regarded as negative and grades 2 and 3 as positive.
For LDHA and HK2, immunohistochemical evaluation was performed
similarly.
Semi-quantitative analysis of
immunostaining
Considering intratumoral heterogeneity, we next
conducted semi-quantitative analysis of immunoreactivity in the
budding-positive cases (≥5 buds). Briefly, we scanned up to 10
fields at the invasive margin to identify hotspots (with highest
tumor budding) using ×10 objective lens, and we examined
immunohistochemical reactivity in the selected hotspot using ×20
objective lens. For semi-quantification, a combination assessment
of the proportion and intensity of immunostaining was performed
(20,21). In the selected field, we determined
the proportion of zero, positive staining in <25% of tumor
cells; one, positive staining in 25–50% of tumor cells; two,
positive staining in 51–75% of tumor cells; three, positive
staining in more than 75% of tumor cells. Then we evaluated the
intensity in the same field as follows: 0, none; 1, slight; 2,
abundant; 3, strong. The product of the proportion and the
intensity defined the score (0–9).
Cell lines and cell culture
DLD-1 and WiDr human CRC cell lines were obtained
from Japanese Collection of Research Bioresources (JCRB) Cell Bank.
Both cells were authenticated by short tandem repeated sequence
profiling by JCRB, confirming that the WiDr was identical to HT-29
(22). Cells were cultured in
RPMI-1640 (Invitrogen) with 10% (v/v) heat-inactivated fetal bovine
serum (Sigma-Aldrich). The temperature and atmosphere were 37°C and
95% air with 5% CO2, respectively.
Gene silencing assay
The siRNA for GLS1 (siR-GLS1,
Silencer® Select Pre-Designed siRNA) was purchased from
Life Technologies. The siRNA ID was s5840. The sequence of sense of
siR-GLS1 was 5′-GAUUUGCUGUUCUAUACAAtt-3′ and that of antisense was
5′-UUGUAUAGAACAGCAAAUCtt-3′. Silencer Negative Control siRNA
(Invitrogen) was used as the control for nonspecific effects. CRC
cells were seeded in 6-well plates at a concentration of
0.5×10⁵ cells per well on the day before transfection.
The concentration of each siRNA was 10 nM. At 48 h after
transfection, cell viability was determined through a dye exclusion
test using trypan blue (Life Technologies).
GA Inhibition assay
BPTES (bis-2
(5-phenylacetamido-1,2,4-thiadiazol-2-yl) ethyl sulfide), an
inhibitor of GA, was purchased from Selleck Chemicals. The
concentrations of BPTES were chosen according to the information
provided by Selleck and others (23,24). To
assess cell proliferation, CRC cells were seeded in 96-well plates
at a concentration of 0.5×10⁴ cells per well on the day
before treatments. MTT
(3-(4,5-dimethylthiazol-2-yl)-2,5-diphenyltetrazolium-bromide;
Sigma-Aldrich) assay was performed according to the protocol
described previously (25). In the
assay, absorbance at 540 nm was measured using SH-1000Lab
microplate reader (Corona Electric).
Western blot analysis
At 48 h after transfection, protein samples were
extracted from the cells and western blot analysis was performed
following the protocols described previously (25,26). The
materials used for the analysis were as follows: RIPA buffer
(Thermo Fisher Scientific, Inc.), Protease Inhibitor Cocktail
(Sigma-Aldrich), DC Protein assay kit (Bio-Rad), polyacrylamide
gels (Wako Pure Chemical), PVDF membrane (Bio-Rad), and PVDF
Blocking Reagent for Can Get Signal® (TOYOBO). The
primary antibodies used were anti-GA (Abcam; EP7212), anti-LDHA
(Abcam; EP1566Y), and anti-β-actin (Sigma-Aldrich; A2228). The
secondary antibodies used were HRP-conjugated goat anti-rabbit and
horse anti-mouse IgG (Cell Signaling Technology). The immunoblots
were detected and visualized by Fusion-FX7 (Vilber Lourmat) with
LuminataTM Forte Western HRP Substrate (Millipore). β-actin was
used as an internal control.
cBioPortal data analysis
Data regarding genomic alterations of GLS1 in
patients with CRC were obtained through the cBioPortal for Cancer
Genomics website (http://www.cbioportal.org/), which we accessed on
October 27, 2019. The database of The Cancer Genome Atlas (TCGA)
PanCancer atlas studies was used for cross-cancer analysis of
mutations and copy number alterations (CNAs) of GLS1
(27–29). In addition, to enrich the number of
CRC samples, six other studies of CRC (DFCI, Genentech, MSK 2014,
CaseCCC, CPTAC-2, and MSK 2018) were chosen (30–35). All
searches were performed in accordance with the cBioPortal online
instructions.
Statistical analysis
The association between immunoexpression status of
GA and clinicopathological characteristics was analyzed using
chi-square test. Semi-quantitative scores of GA, LDHA, and HK2 were
compared with Wilcoxon rank sum test. Kaplan-Meier curves were
constructed to plot the probability of patient's overall survival,
and the differences between survival distributions were analyzed
with the log-rank test. For in vitro experiments that were
performed in triplicates in each assay, the two-sided Student's
t-test was used to determine the statistical significance of the
differences. P<0.05 was considered to indicate a statistically
significant difference.
Results
Clinicopathological data
The clinicopathological background of all 98 cases
of CRC is shown in Table I. The
patients had a median age of 70.0 years and there were 56 males
(57%) and 42 females (43%). There were 54 cases (55%) in stage II,
39 cases (40%) in stage III, and 5 cases (5%) in stage IV.
Histologic types were composed of 90 cases of usual adenocarcinoma
(92%) and 8 cases of variants including mucinous and micropapillary
(8%). The primary sites consisted of 31 cases (32%) of right colon
and 67 cases (68%) of left colon. Fifty-five cases (56%) were
positive for lymph node and/or distant metastasis. For tumor
budding, 65 cases (66%) were categorized as low and 33 cases (34%)
as intermediate to high tumor budding.
 | Table I.Association between
clinicopathological features and GA immunohistochemical status in
all cases (n=98). |
Table I.
Association between
clinicopathological features and GA immunohistochemical status in
all cases (n=98).
|
|
| GA expression |
|
|---|
|
|
|
|
|
|---|
| Variable | No. of cases
(%) | Grade 1 | Grade 2 | Grade 3 | P-value |
|---|
| Sex |
|
|
|
| 0.2529 |
|
Male | 56 (57) | 15 | 14 | 27 |
|
|
Female | 42 (43) | 8 | 17 | 17 |
|
| Age |
|
|
|
| 0.7472 |
|
<59 | 18 (18) | 3 | 6 | 9 |
|
|
≥60 | 80 (82) | 20 | 25 | 35 |
|
| BMI |
|
|
|
| 0.1574 |
|
≥25.0 | 14 (14) | 5 | 6 | 3 |
|
|
≤25.0 | 84 (86) | 18 | 25 | 41 |
|
| TNM stage |
|
|
|
| 0.4940 |
| II | 54 (55) | 15 | 14 | 25 |
|
|
III | 39 (40) | 8 | 15 | 16 |
|
| IV | 5 (5) | 0 | 2 | 3 |
|
| Histological
type |
|
|
|
| 0.0264 |
|
Usual | 90 (92) | 20 | 26 | 44 |
|
|
Variants | 8 (8) | 3 | 5 | 0 |
|
| Primary site |
|
|
|
| 0.5813 |
|
Right | 31 (32) | 9 | 8 | 14 |
|
|
Left | 67 (68) | 14 | 23 | 30 |
|
| Lymphatic
invasion |
|
|
|
| 0.7044 |
|
Absent | 9 (9) | 1 | 2 | 6 |
|
| Present
(low) | 67 (68) | 17 | 21 | 29 |
|
| Present
(high) | 22 (23) | 5 | 8 | 9 |
|
| Vascular
invasion |
|
|
|
| 0.0903 |
|
Absent | 16 (16) | 6 | 7 | 3 |
|
| Present
(low) | 65 (66) | 16 | 18 | 31 |
|
| Present
(high) | 17 (18) | 1 | 6 | 10 |
|
| Metastasis |
|
|
|
| 0.3260 |
|
Negative | 54 (55) | 15 | 14 | 25 |
|
|
Positive | 44 (45) | 8 | 17 | 19 |
|
| Tumor budding |
|
|
|
| 0.0448 |
|
Low | 65 (66) | 20 | 20 | 25 |
|
|
Intermediate/High | 33 (34) | 3 | 11 | 19 |
|
Immunoexpression of GA in the entire
areas of CRC
First, we assessed immunohistochemical expression of
GA based on whole-section examination. Seventy-five (74%) of 98
cases were positive for immunostaining of GA (grades 2 and 3). As
described in Table I, the status of
GA expression showed statistically significant association with
histological type (P=0.0264) and tumor budding (P=0.0448), but not
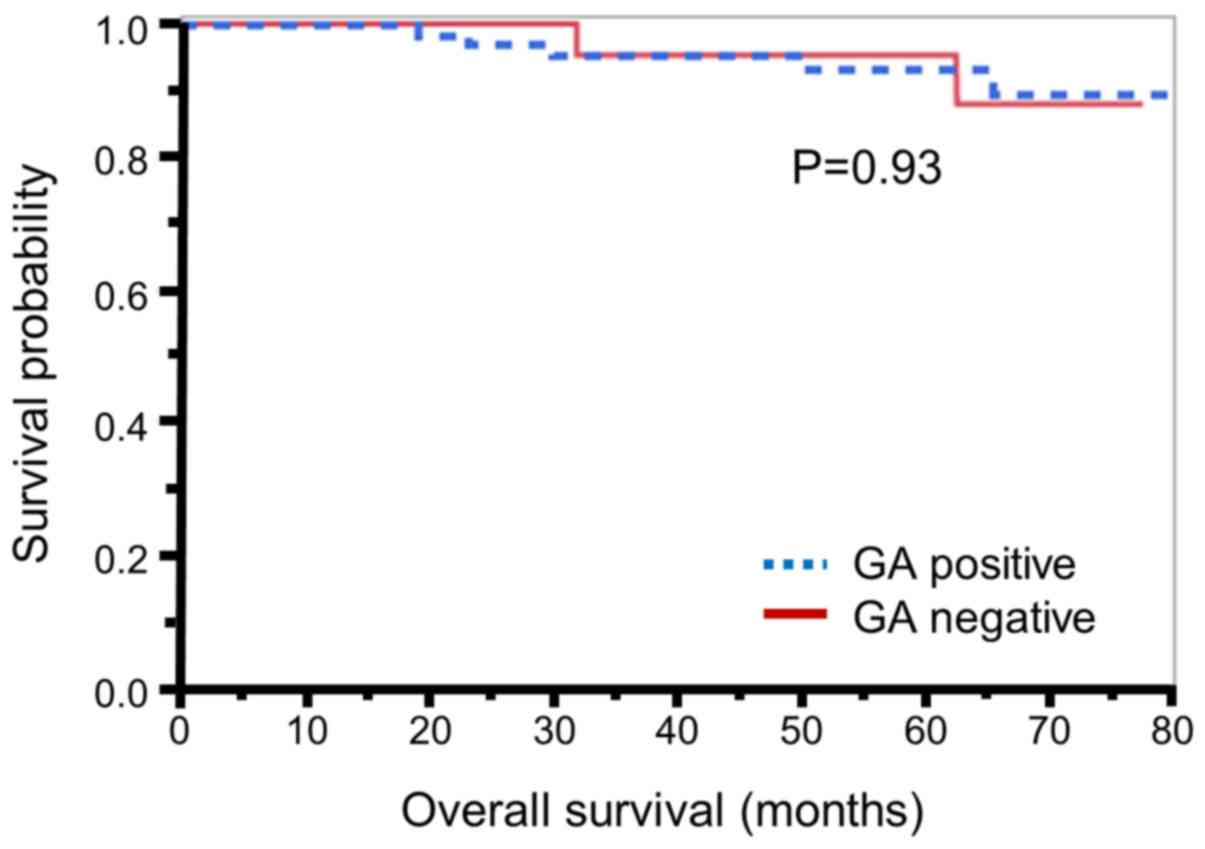
with metastasis (P=0.3260) in our patient population. In addition,
we scrutinized the relationship between GA status and patient
prognosis. Kaplan-Meier analysis (Fig.
1) revealed that there was no significant association between
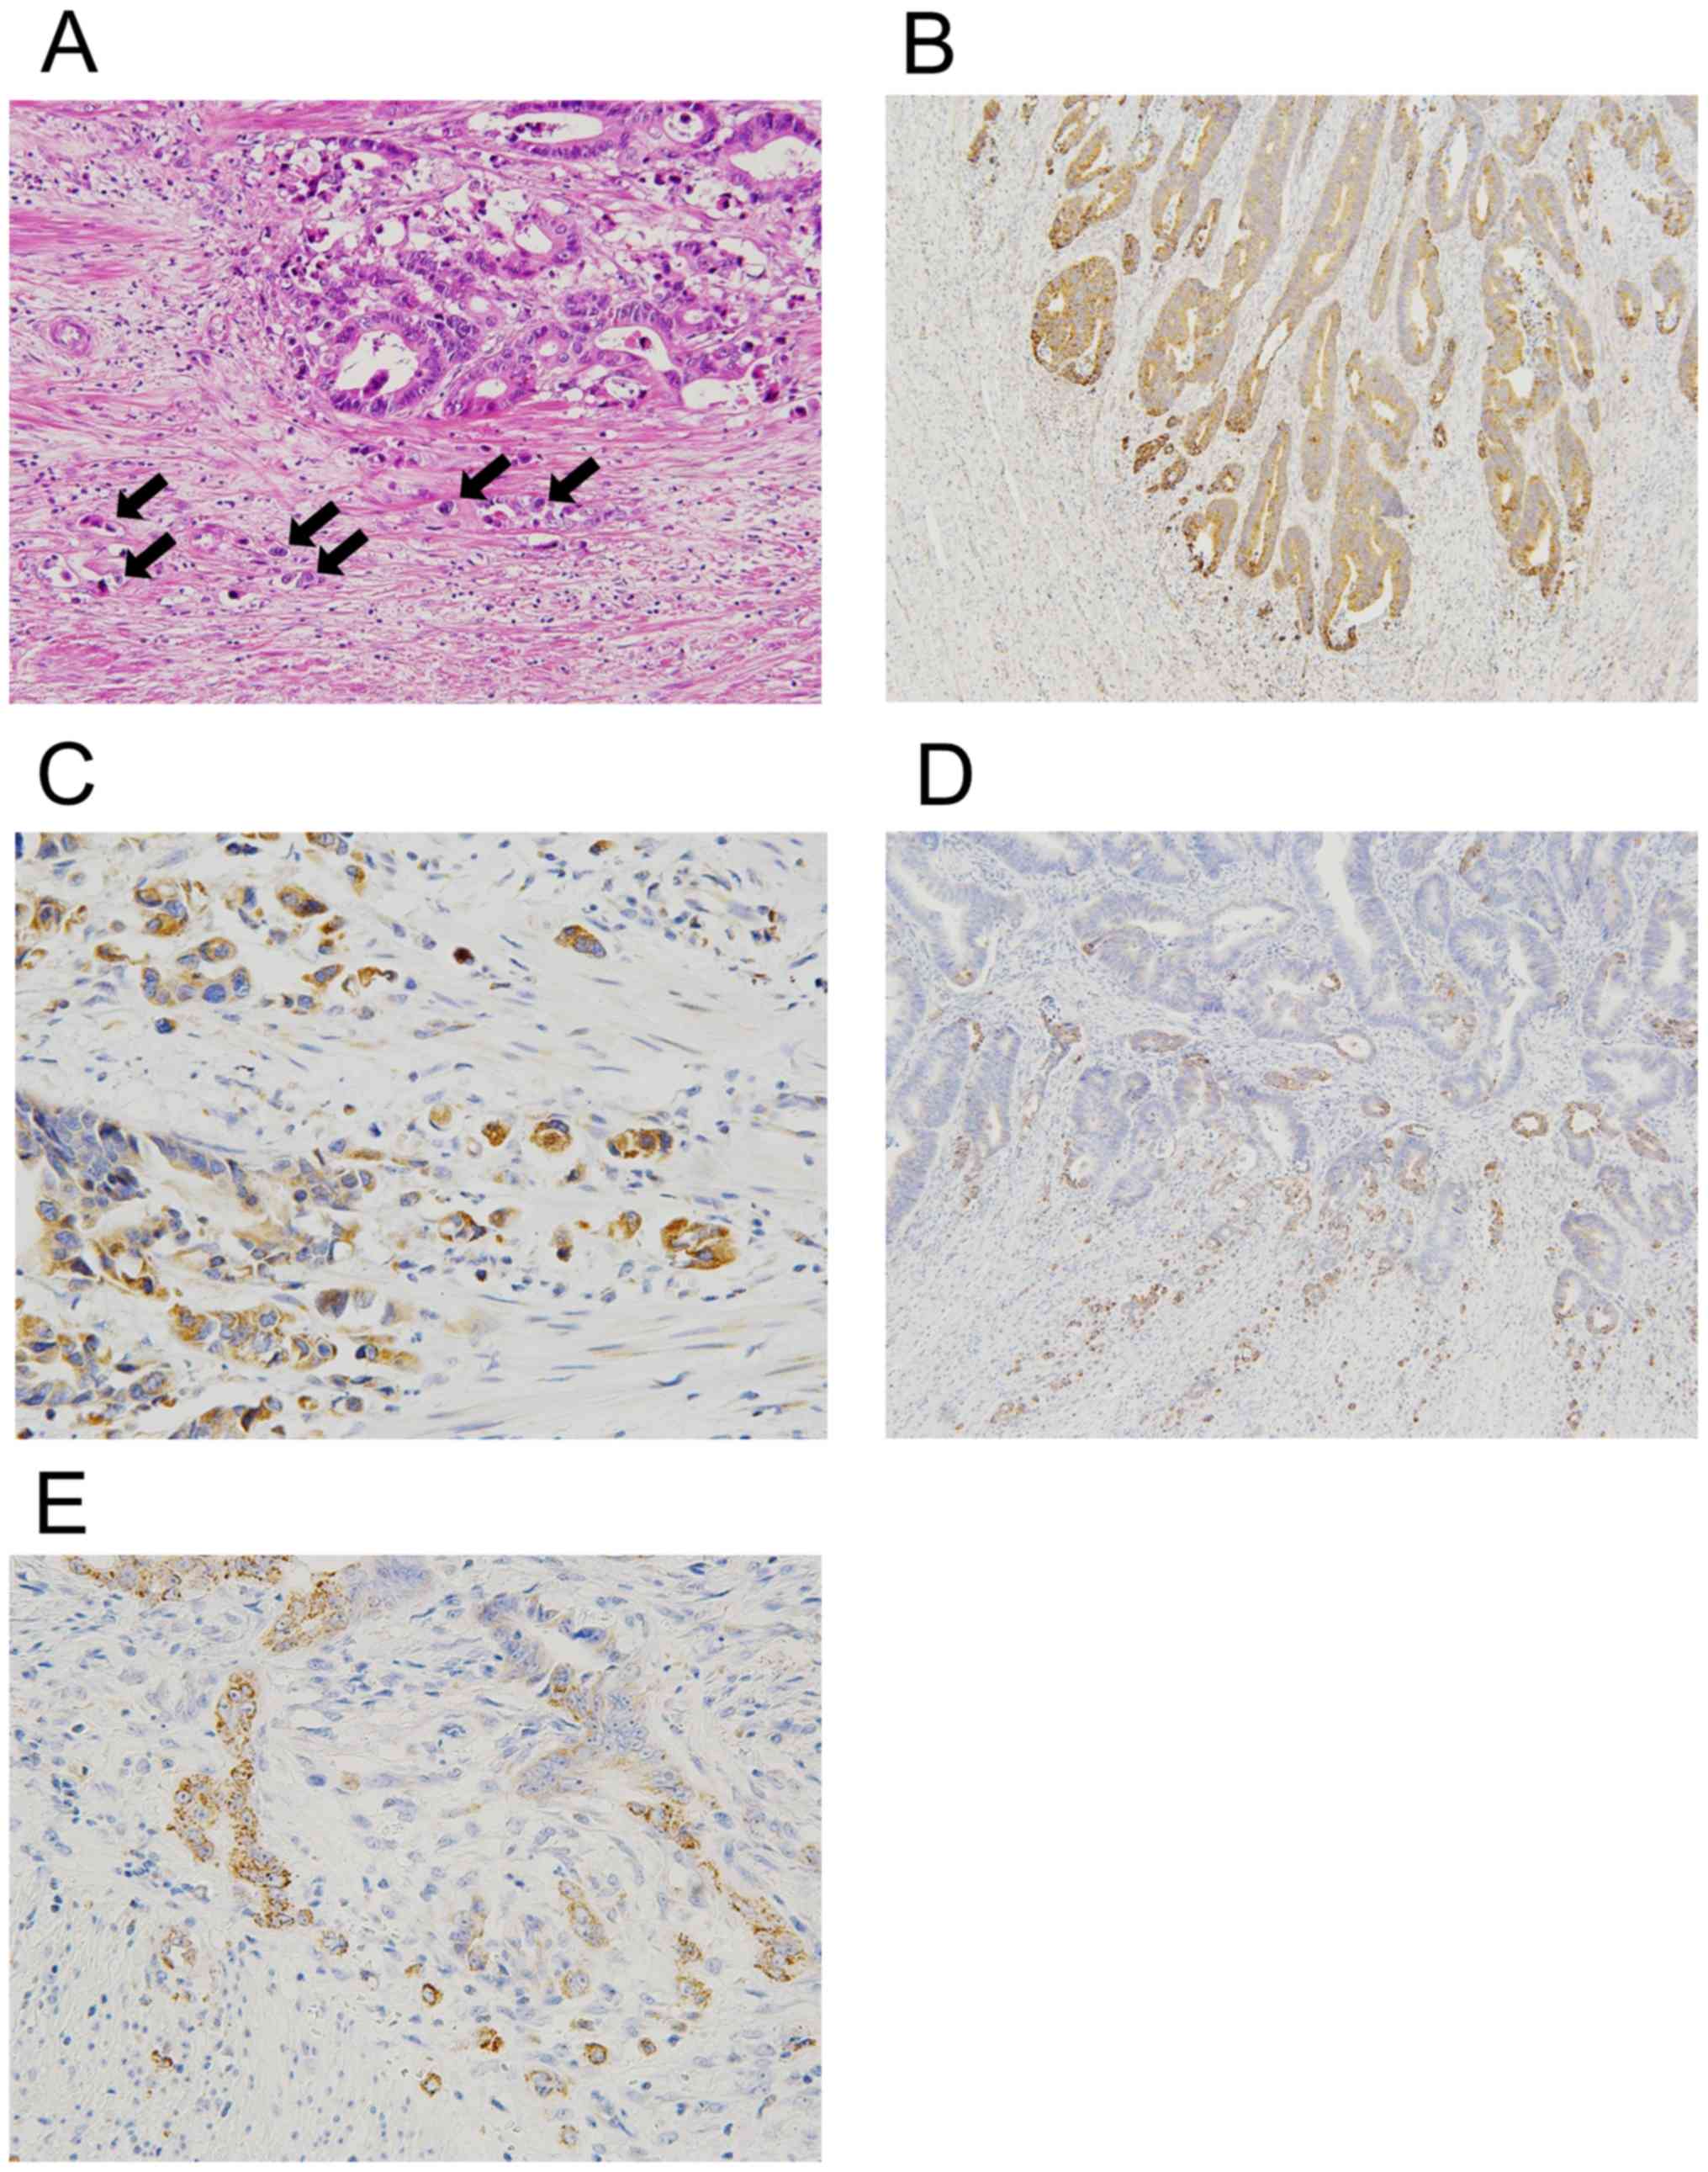
GA expression and patient prognosis (P=0.93). Next, we focused on
the distribution of GA immunopositivity in cancer tissues because
of the positive correlation between GA expression and tumor budding
(Fig. 2A). As shown in Fig. 2B and C, there was a tendency towards
enhanced immunoreactivity of GA protein at the invasive margin
along with tumor budding. This increased expression was more
conspicuous in low GA expression cases (grade 1) with intermediate
to high tumor budding (3 cases). Such cases exhibited increased
immunopositivity of GA more robustly and preferentially at the
invasive margin, containing tumor budding, despite its partial and
arbitrary expression in the center (Fig.
2D and E).
Semi-quantitative analysis of GA
expression
To elucidate the correlation between GA expression
and tumor budding, we extracted and focused on the subgroup of
intermediate to high-budding cases (n=33). In this subgroup,
immunoreactivity of GA was semi-quantitatively assessed by
comparing the invasive margin including tumor budding with the
center region (6). Consequently, the
semi-quantitative scores of GA immunoexpression were 5.8±3.0 for
the invasive margin and 3.7±2.6 for the center (Table II). Statistically, the
immunoexpression of GA at the margin was significantly higher than
that of the center (P=0.0005).
| Table II.Semiquantitative result of
immunohistochemical expression of GA, LDHA and HK2 in the margin
and center of CRC. |
Table II.
Semiquantitative result of
immunohistochemical expression of GA, LDHA and HK2 in the margin
and center of CRC.
| Score | Margin | Center | P-value |
|---|
| GA | 5.8±3.0 | 3.7±2.6 | 0.0005 |
| LDHA | 0.4±0.6 | 2.5±2.1 | <0.001 |
| HK2 | 7.5±2.8 | 7.8±2.7 | 0.0832 |
Immunoexpression of LDHA and HK2
In the subgroup of intermediate/high budding cases,
we performed additional immunohistochemistry of LDHA and HK2. In 26
of 33 cases (79%), we confirmed positive immunoreactivity for LDHA
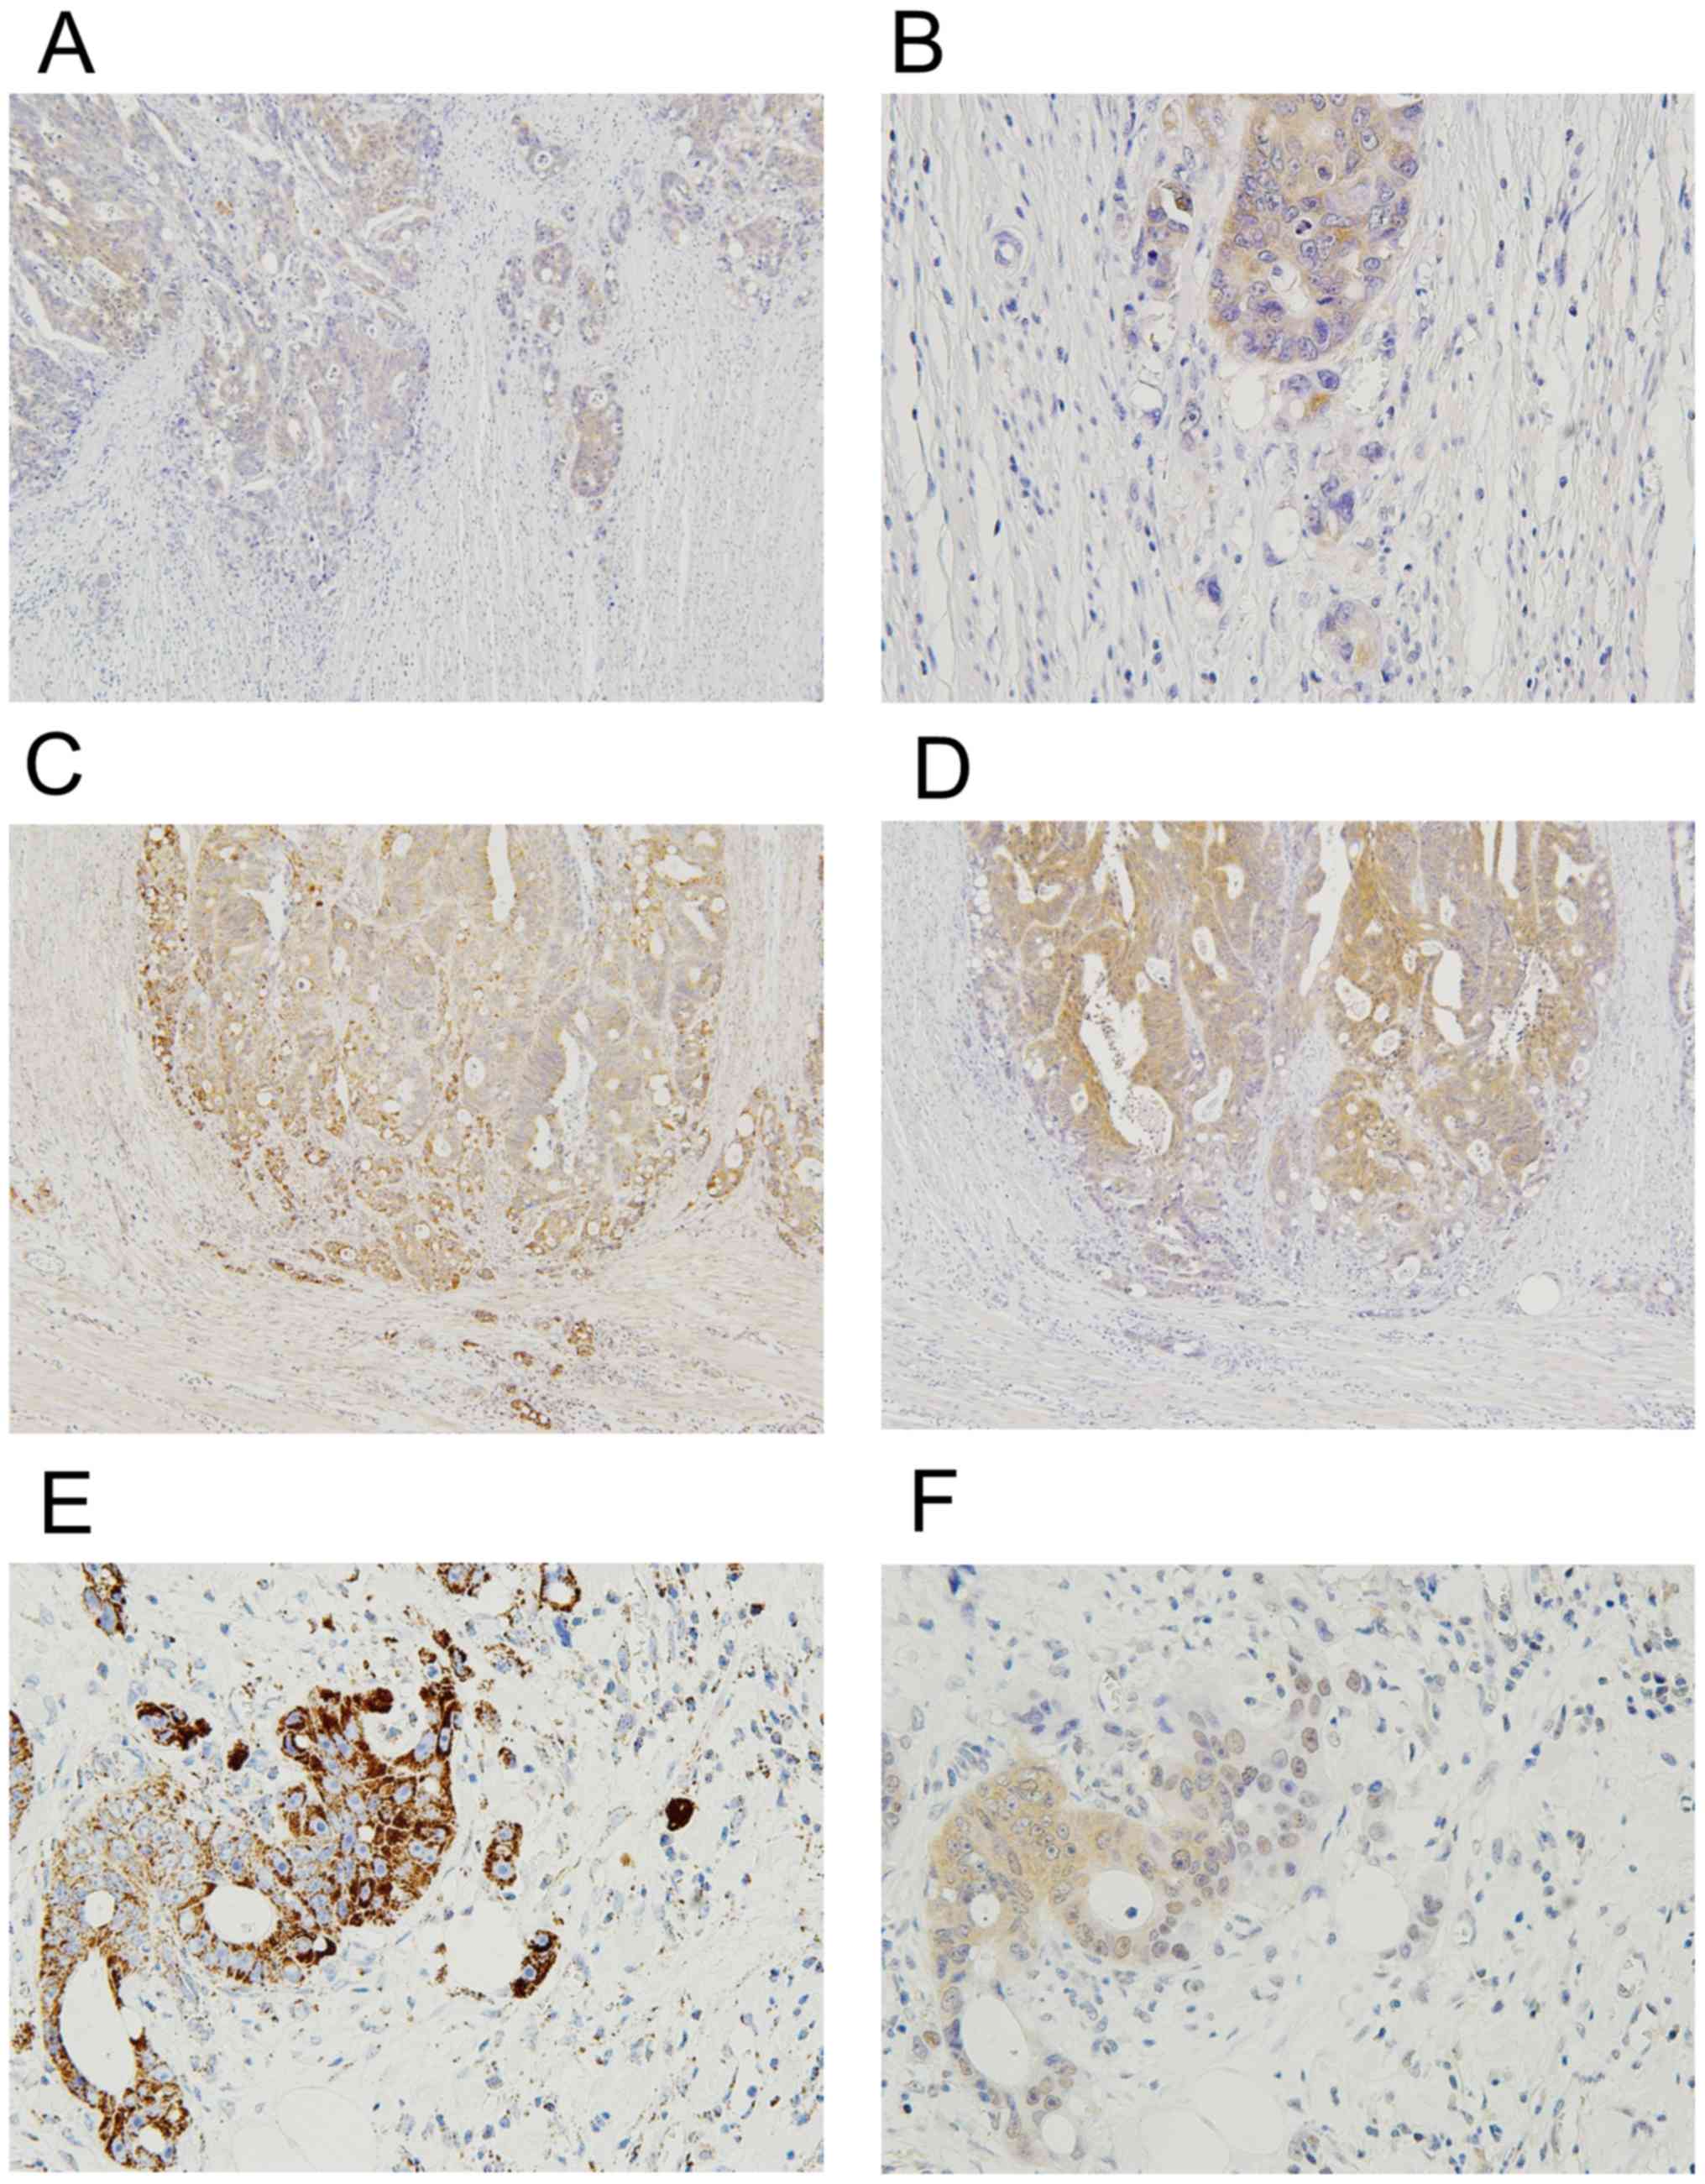
in the entire tumor areas on the sections. Notably, our
immunohistochemistry indicated that the immunoexpression of LDHA at
the invasive margin with tumor budding was likely to be weak
compared to that in the center (Fig. 3A
and B). Semi-quantitative analysis revealed that LDHA scores
were 0.4±0.6 for the invasive margin and 2.5±2.1 for the center
(Table II). Statistically, LDHA
score of the invasive margin was significantly lower than that of
the center (P<0.001). Further, we frequently observed opposite
trends for LDHA and GA expressions at the periphery of identical
cancer nests, with weaker staining for LDHA and increased staining
for GA (Fig. 3C-F). Next, we
evaluated the expression and distribution of HK2 in the same way.
Our immunohistochemistry showed positive immunoreactivity of HK2 in
32 of 33 cases (97%). However, there was no significant difference
in HK2 expression between the margin and the center (Table II).
Genomic alterations of GLS1 in a range
of cancer types and CRC databases
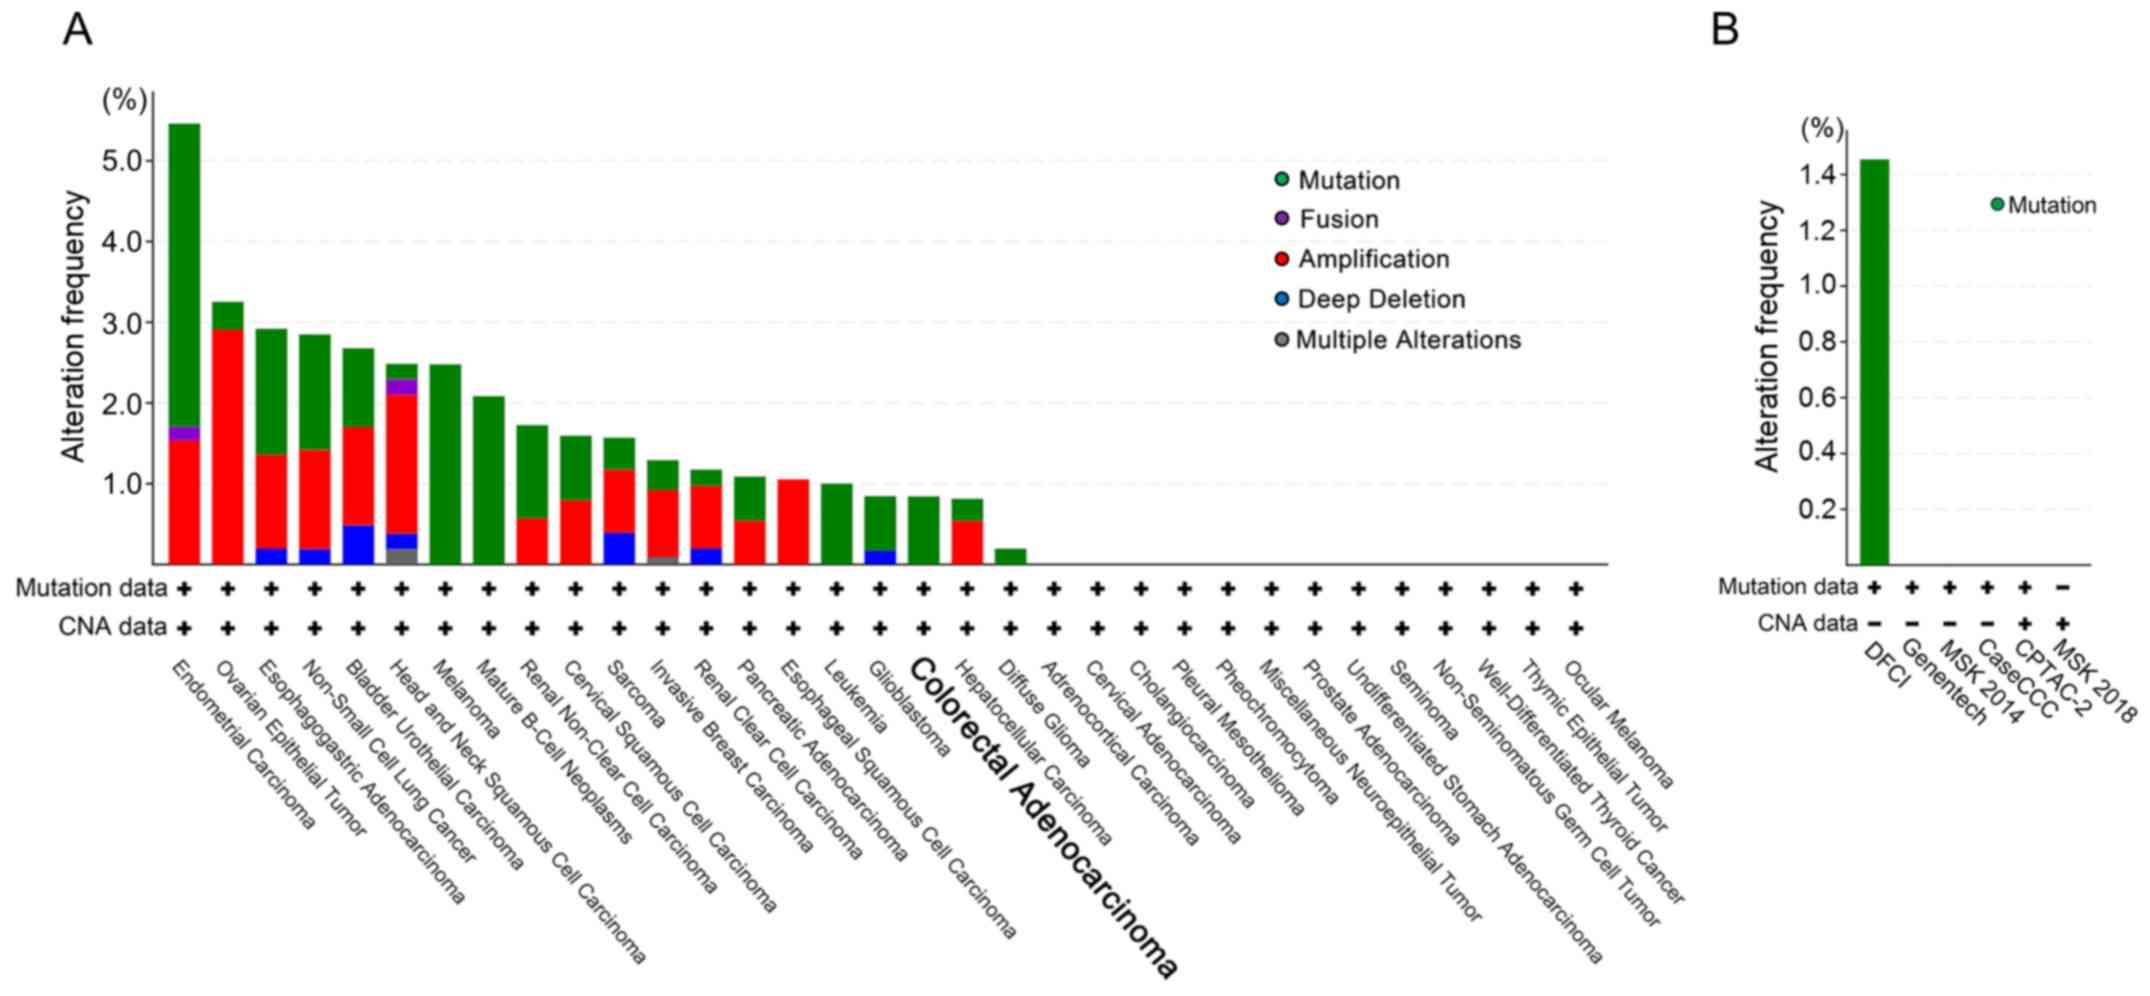
To elucidate whether the heterogeneous expressions
of the proteins were due to gene mutation or amplification, we
first examined the genomic alterations of GLS1 in the TCGA
PanCancer Atlas Studies (10967 cases in 32 studies) for
cross-cancer analysis. As shown in Fig.
4A, the overall rate of the genomic alterations was low in
various cancer types, and the rates of mutations and CNAs of
GLS1 were 0.84% (5 cases) and 0%, respectively, in 594 CRC
cases. Next, we investigated the GLS1 alterations in 6 other
CRC studies to enrich the number of samples. As shown in Fig. 4B, the ratio of GLS1 mutations
was 0.93% (9 cases) in 964 CRC cases. As for CNAs of GLS1,
no positive case was found in the CRC databases (1239 cases).
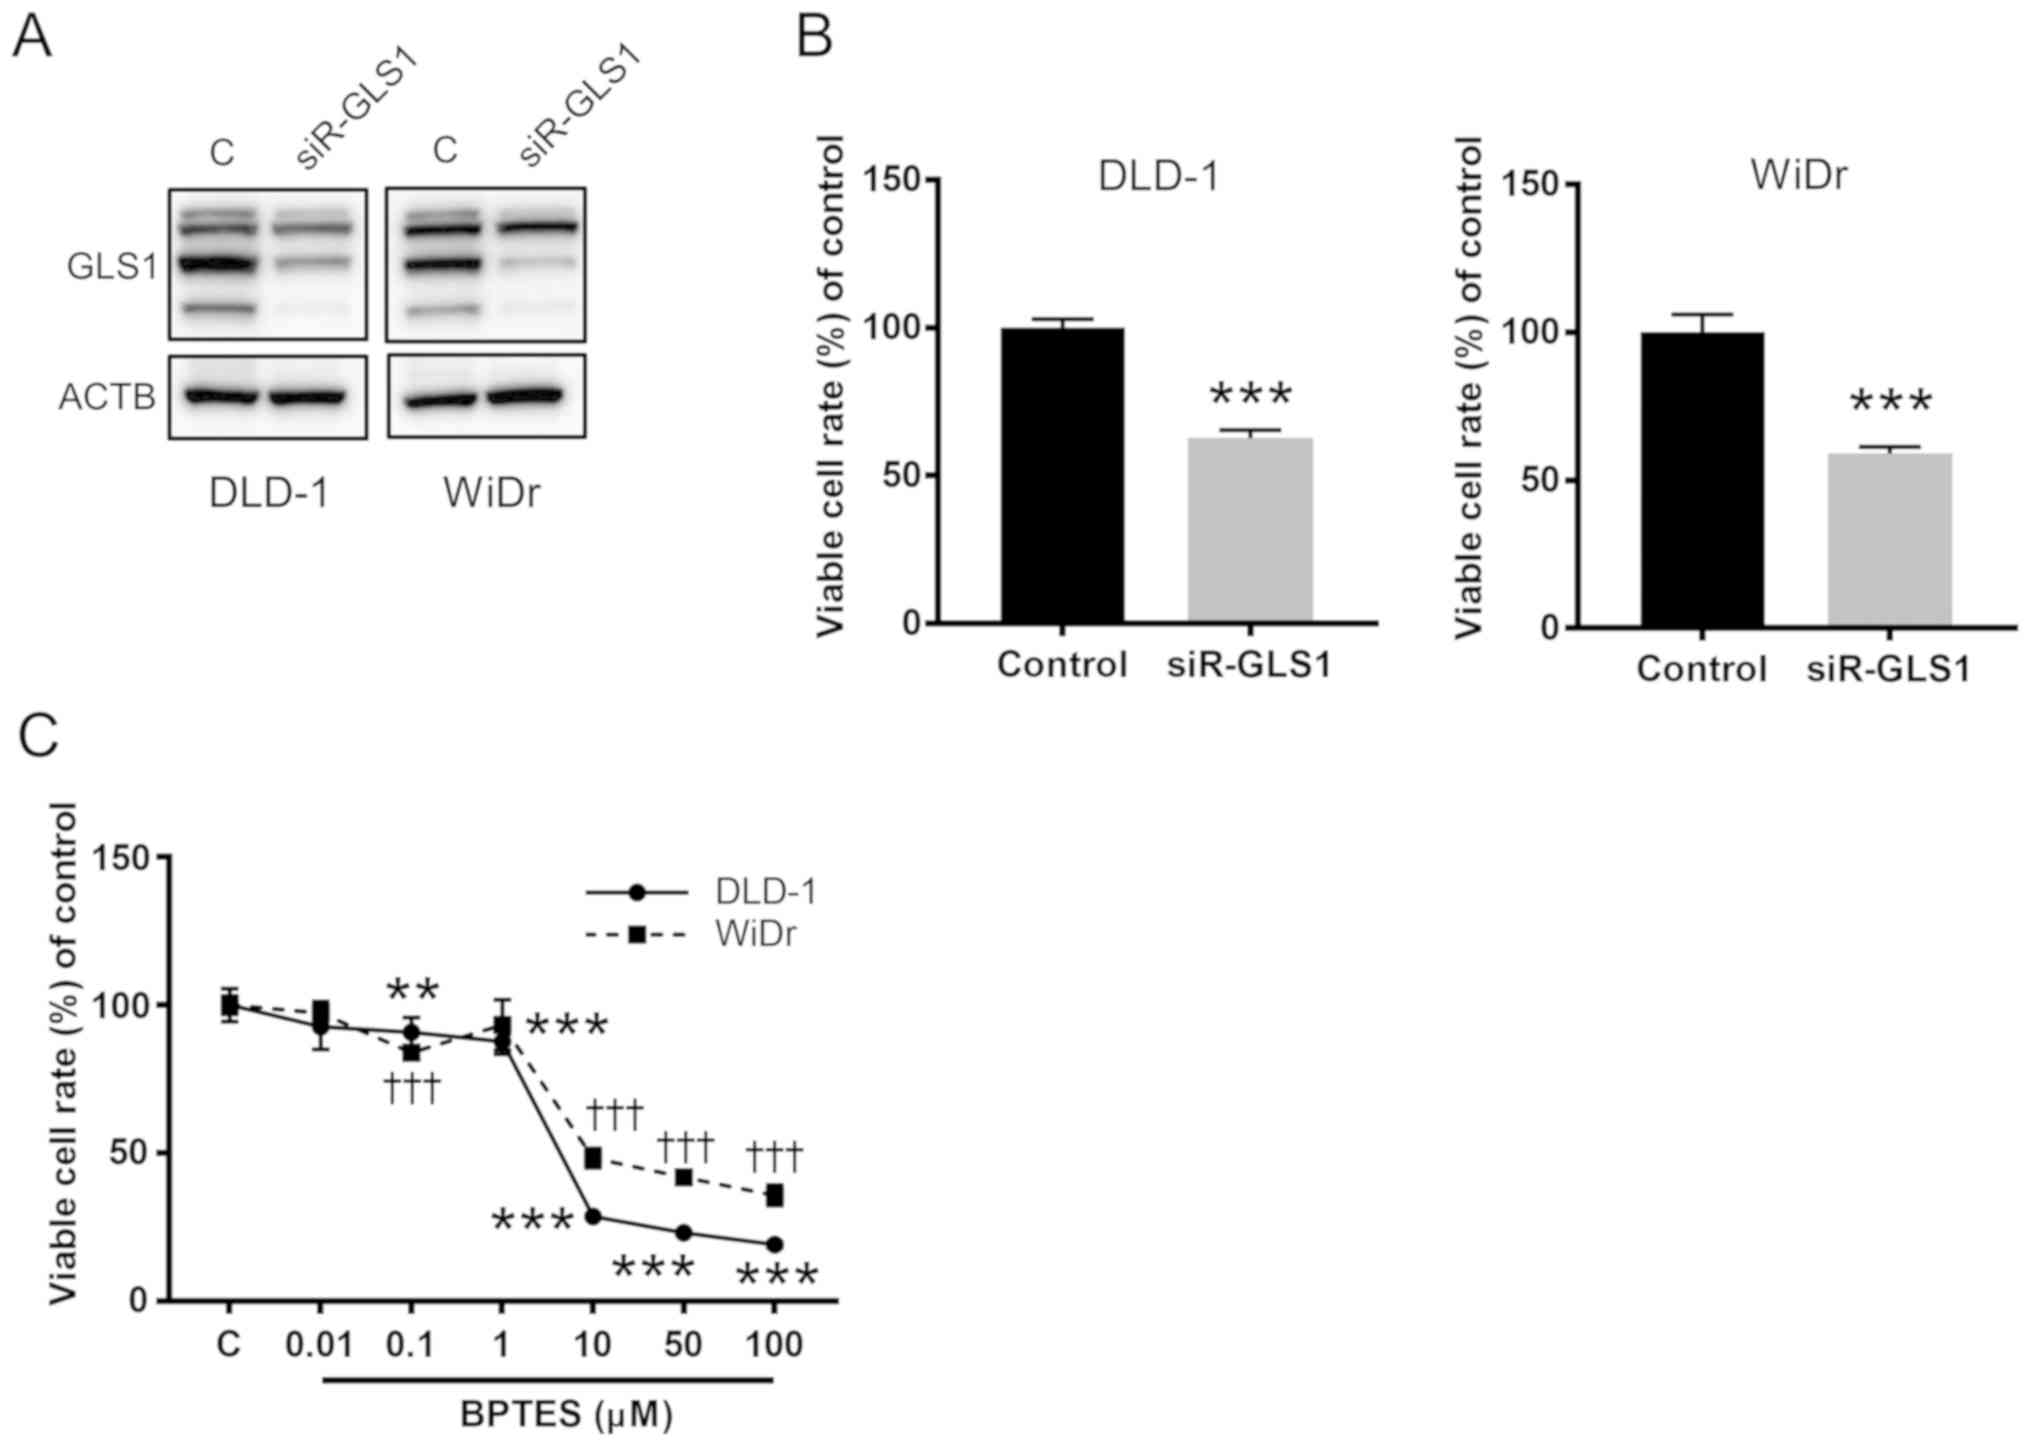
Suppression of GLS1 inhibited CRC
cells growth
Finally, we further confirmed whether GLS1
affected CRC cell growth. Gene silencing effects on GLS1 by
siRNA-GLS1 were examined in two CRC cell lines, DLD-1 and WiDr
cells (Figs. 5A and S1). As shown in Fig. 5B, knockdown of GLS1
significantly inhibited CRC cells growth. BPTES, which was known as
a GA inhibitor, also suppressed cell growth of both CRC cell lines
in a dose-dependent manner (Fig.
5C).
Discussion
Although the relationship between cancer and altered
metabolism is not new, the interest in cancer metabolism has been
rekindled, partly because of the prevalence of metabolic-based
imaging modalities, such as positron emission tomography, for
detecting cancer (1). Much attention
has been attracted to the relationship by the identification and
characterization of driver mutations in metabolic enzymes such as
isocitrate dehydrogenase in several cancers (36). To date, it is more important to
consider the metabolic trait of cancer from basic research to
clinical application, especially in the fields of genome-based
tumor diagnosis or molecular-targeted therapy. However, tumor
budding has been established as a surrogate marker for malignant
grade and prognosis in clinical practice (14,15). The
explorations involving tumor budding with epithelial-mesenchymal
transition and subsequent causation of metastasis have grown and
attracted more attention (37),
whereas those of metabolic features remain limited. Therefore, the
objective of our current study is to elucidate the tumor
budding-specific metabolism.
On the basis of the significant association between
GA protein expression and tumor budding status, we demonstrated for
the first time that GA expression is augmented more preferentially
at the invasive margin, including the tumor buds, in CRC. When
intratumoral heterogeneity was excluded, this observation is
generally in line with those in previous studies, which concluded
that the GA expression was upregulated in CRC (11). As we found mutations a small
percentage and no CNAs of GLS1 in CRC in the cBioPortal data
analysis, our commonly recognized finding could not be due to such
genomic changes in GA. Moreover, this is of great interest because
of its functional implication at the invasive margin, containing
tumor budding of CRC. At first, it is reasonable to suggest that
upregulation of GA is likely to be due to the requirement of
glutamine. This may indicate that the marginal region appears more
glutamine-addicted in CRC tissues (38). In addition, this suggests a possible
occurrence of glutamine anaplerosis at the invasive margin,
involving tumor budding (8).
Anaplerosis is the replenishing process to have a matching influx
of TCA cycle intermediates, which are consumed and lacking
(39). Glutamine is regarded as a
fundamental source (40) and
therefore, our data may imply that the marginal cells along with
tumor budding need more biomass via glutamine anaplerosis to
proliferate, invade, and metastasize. Interestingly, our in
vitro assay showed that forced suppression of GLS1 gene
expression clearly inhibited the growth of CRC cells. This
observation from our assays, though still small and insufficient,
warrants further investigation in terms of possible GA-targeted
therapy for CRC patients.
In contrast, LDHA expression exhibited the opposite
pattern in the majority of cases, with its expression increased at
the center and significantly, but unexpectedly, weaker at the
invasive margin of the tumors. LDH is a tetrameric enzyme
responsible for glycolysis and they are of two types:
Muscle/anaerobic (LDHA) and heart/aerobic (LDHB) (41). It is widely appreciated that
aberrantly high expression of LDHA, but not LDHB, is crucial for
Warburg effect and carcinogenesis (3–5). In this
perspective, unless considering intratumoral heterogeneity, our
present data are consistent with previous reports (3). As far as intratumoral heterogeneity is
concerned, this is the first demonstration in terms of spatially
heterogeneous expression of LDHA in CRC tissues, to the best of our
knowledge. At the same time, this finding raises a question of why
reduced LDHA expression occurs at the invasive margin involving
tumor budding. The reason remains unknown, but it may be simply
explained by the microenvironment of relative non-hypoxic. Since
hypoxia can lead to upregulation of LDHA (42), its downregulation may be reflected in
non-hypoxic condition of the invasive margin in comparison with the
center. Another explanation can be provided by a recent report
showing that a certain condition such as arginine deprivation
upregulated glutamine anaplerosis, as well as inhibited Warburg
effect, in argininosuccinate synthetase 1-deficient cancers
(43). To begin with, LDHA
regulation remains complex and far from being completely
understood, since numerous genes have been reported to be related
to LDHA expression and activity (44). Thus, our present finding warrants
further investigation to reveal the role and mechanism of LDHA
expression at the marginal area of CRC.
In recent years, there has been increased awareness
and scrutiny of intratumoral heterogeneity, in view of
morphological, genetic, and biological characteristics (45–47). To
detect, analyze, and interpret this, we should keep in mind that
comprehensive and comparative approaches toward cancer tissues are
required. For this purpose, there are several issues concerned
particularly about the methodology. First, high-throughput
screenings such as tissue microarray, which is familiar at present,
appear not suitable as a method for evaluating heterogeneity of
tumors histopathologically, because they assess small and partial
regions of tumor tissues sampled (48,49).
Second, the evaluation of immunohistochemistry in many published
reports has been done using the so-called ‘positive or negative’
method, in which stainability was determined in a tumor as a whole.
In such dichotomy, there should be a tendency to underestimate
heterogeneity of tumors, since the assessment occasionally misses
or omits minor portions (48,50,51).
The present study has several limitations. The
number of the samples was small because we selected only pT3 CRC
cases. Further study that includes different categories and various
histopathological subtypes is required. In addition, the in
vitro experiments in the present study were preliminary. To
account for the association between GA and LDHA expression at the
invasive margin of CRC, further investigation such as in
vitro experiments, animal model studies, or metabolic analysis
should be conducted.
In conclusion, we described herein a novel
immunohistological-based alteration in GA and LDHA expression at
the invasive margin together with tumor budding, based on
significant correlation between GA expression and tumor budding.
These results are the first step towards extending the
investigation into the mechanisms underlying this intriguing
alteration and its effect on metabolic enzymes.
Supplementary Material
Supporting Data
Acknowledgements
The authors would like to thank Ms Manami Shimoguchi
(Department of Pathology, Osaka Medical College) for assistance in
performing immunohistochemistry and data analysis.
Funding
The present study was partially supported by JSPS
KAKENHI (grant nos. JP25430136 and JP16H07344).
Availability of data and materials
The datasets used and/or analyzed during the present
study are available from the corresponding author on reasonable
request.
Authors' contributions
YH and KU designed the experiment. KoT and KeT
collected clinicopathological information from patients. YM and KH
conducted immunohistochemistry. KH and YH performed evaluation of
the immunohistochemistry slides and data analysis. KoT performed
in vitro experiments and cBioPortal data analysis. YM, KoT
and YH wrote the manuscript. All authors have read and approved the
final manuscript.
Ethics approval and consent to
participate
The present study was approved by the Institutional
Review Board of Osaka Medical College. The requirement for written
consent was waived.
Patient consent for publication
Not applicable.
Competing interests
The authors declare that they have no competing
interests.
References
|
1
|
Gatenby RA and Gillies RJ: Why do cancers
have high aerobic glycolysis? Nat Rev Cancer. 4:891–899. 2004.
View Article : Google Scholar : PubMed/NCBI
|
|
2
|
Warburg O: On the origin of cancer cells.
Science. 123:309–314. 1956. View Article : Google Scholar : PubMed/NCBI
|
|
3
|
Koukourakis MI, Giatromanolaki A, Sivridis
E, Gatter KC and Harris AL; Tumour Angiogenesis Research Group, :
Lactate dehydrogenase 5 expression in operable colorectal cancer:
Strong association with survival and activated vascular endothelial
growth factor pathway-a report of the Tumour Angiogenesis Research
Group. J Clin Oncol. 24:4301–4308. 2006. View Article : Google Scholar : PubMed/NCBI
|
|
4
|
Rong Y, Wu W, Ni X, Kuang T, Jin D, Wang D
and Lou W: Lactate dehydrogenase A is overexpressed in pancreatic
cancer and promotes the growth of pancreatic cancer cells. Tumor
Biol. 34:1523–1530. 2013. View Article : Google Scholar
|
|
5
|
Yao F, Zhao T, Zhong C, Zhu J and Zhao H:
LDHA is necessary for the tumorigenicity of esophageal squamous
cell carcinoma. Tumor Biol. 34:25–31. 2013. View Article : Google Scholar
|
|
6
|
Hamabe A, Yamamoto H, Konno M, Uemura M,
Nishimura J, Hata T, Takemasa I, Mizushima T, Nishida N, Kawamoto
K, et al: Combined evaluation of hexokinase 2 and phosphorylated
pyruvate dehydrogenase-E1α in invasive front lesions of colorectal
tumors predicts cancer metabolism and patient prognosis. Cancer
Sci. 105:1100–1108. 2014. View Article : Google Scholar : PubMed/NCBI
|
|
7
|
Vander Heiden MG, Cantley LC and Thompson
CB: Understanding the Warburg effect: The metabolic requirements of
cell proliferation. Science. 324:1029–1033. 2009. View Article : Google Scholar : PubMed/NCBI
|
|
8
|
Daye D and Wellen KE: Metabolic
reprogramming in cancer: Unraveling the role of glutamine in
tumorigenesis. Semin Cell Dev Biol. 23:362–369. 2012. View Article : Google Scholar : PubMed/NCBI
|
|
9
|
Márquez J, de la Oliva AR, Matés JM,
Segura JA and Alonso FJ: Glutaminase: A multifaceted protein not
only involved in generating glutamate. Neurochem Int. 48:465–471.
2006. View Article : Google Scholar : PubMed/NCBI
|
|
10
|
Yang L, Venneti S and Nagrath D:
Glutaminolysis: A hallmark of cancer metabolism. Annu Rev Biomed
Eng. 19:163–194. 2017. View Article : Google Scholar : PubMed/NCBI
|
|
11
|
Huang F, Zhang Q, Ma H, Lv Q and Zhang T:
Expression of glutaminase is upregulated in colorectal cancer and
of clinical significance. Int J Clin Exp Pathol. 7:1093–1100.
2014.PubMed/NCBI
|
|
12
|
Curthoys NP and Watford M: Regulation of
glutaminase activity and glutamine metabolism. Annu Rev Nutr.
15:133–159. 1995. View Article : Google Scholar : PubMed/NCBI
|
|
13
|
Van Den Heuvel APJ, Jing J, Wooster RF and
Bachman KE: Analysis of glutamine dependency in non-small cell lung
cancer: GLS1 splice variant GAC is essential for cancer cell
growth. Cancer Biol Ther. 13:1185–1194. 2012. View Article : Google Scholar : PubMed/NCBI
|
|
14
|
Ueno H, Murphy J, Jass JR, Mochizuki H and
Talbot IC: Tumour budding as an index to estimate the potential of
aggressiveness in rectal cancer. Histopathol. 40:127–132. 2002.
View Article : Google Scholar
|
|
15
|
Prall F: Tumour budding in colorectal
carcinoma. Histopathol. 50:151–162. 2007. View Article : Google Scholar
|
|
16
|
Yang J and Weinberg RA:
Epithelial-mesenchymal transition: At the crossroads of development
and tumor metastasis. Dev Cell. 14:818–829. 2008. View Article : Google Scholar : PubMed/NCBI
|
|
17
|
Edge SB and Compton CC: The American joint
committee on cancer: The 7th edition of the AJCC cancer staging
manual and the future of TNM. Ann Surg Oncol. 17:1471–1474. 2010.
View Article : Google Scholar : PubMed/NCBI
|
|
18
|
Hamilton SR, Bosman FT, Boffetta P, Ilyas
M, Morreau H, Nakamura SI, Quirke P, Riboli E and Sobin LH:
Carcinoma of the colon and rectum. WHO classification of tumours of
the digestive system. Bozman FT, Carneiro F, Hruban RH and Theise
ND: IARC Press; Lyon: pp. 134–146. 2010
|
|
19
|
Lugli A, Kirsch R, Ajioka Y, Bosman F,
Cathomas G, Dawson H, El Zimaity H, Fléjou JF, Hansen TP, Hartmann
A, et al: Recommendations for reporting tumor budding in colorectal
cancer based on the International Tumor Budding Consensus
Conference (ITBCC) 2016. Modern Pathol. 30:1299–1311. 2017.
View Article : Google Scholar
|
|
20
|
Girgis H, Masui O, White NM, Scorilas A,
Rotondo F, Seivwright A, Gabril M, Filter ER, Girgis AH, Bjarnason
GA, et al: Lactate dehydrogenase A is a potential prognostic marker
in clear cell renal cell carcinoma. Mol Cancer. 13:1012014.
View Article : Google Scholar : PubMed/NCBI
|
|
21
|
Ondruschka C, Buhtz P, Motsch C, Freigang
B, Schneider-Stock R, Roessner A and Boltze C: Prognostic value of
MMP-2, −9 and TIMP-1,-2 immunoreactive protein at the invasive
front in advanced head and neck squamous cell carcinomas. Pathol
Res Pract. 198:509–515. 2002. View Article : Google Scholar : PubMed/NCBI
|
|
22
|
Chen TR, Drabkowski D, Hay RJ, Macy M and
Peterson W Jr: WiDr is a derivative of another colon adenocarcinoma
cell line, HT-29. Cancer Genet Cytogenet. 27:125–134. 1987.
View Article : Google Scholar : PubMed/NCBI
|
|
23
|
Seltzer MJ, Bennett BD, Joshi AD, Gao P,
Thomas AG, Ferraris DV, Tsukamoto T, Rojas CJ, Slusher BS,
Rabinowitz JD, et al: Inhibition of glutaminase preferentially
slows growth of glioma cells with mutant IDH1. Cancer Res.
70:8981–8987. 2010. View Article : Google Scholar : PubMed/NCBI
|
|
24
|
Xiang Y, Stine ZE, Xia J, Lu Y, O'Connor
RS, Altman BJ, Hsieh AL, Gouw AM, Thomas AG, Gao P, et al: Targeted
inhibition of tumor-specific glutaminase diminishes cell-autonomous
tumorigenesis. J Clin Invest. 125:2293–2306. 2015. View Article : Google Scholar : PubMed/NCBI
|
|
25
|
Kawaguchi N, Tashiro K, Taniguchi K, Kawai
M, Tanaka K, Okuda J, Hayashi M and Uchiyama K: Nogo-B
(Reticulon-4B) functions as a negative regulator of the apoptotic
pathway through the interaction with c-FLIP in colorectal cancer
cells. Biochim Biophys Acta Mol Basis Dis. 1864:2600–2609. 2018.
View Article : Google Scholar : PubMed/NCBI
|
|
26
|
Kagota S, Taniguchi K, Lee SW, Ito Y,
Kuranaga Y, Hashiguchi Y, Inomata Y, Imai Y, Tanaka R, Tashiro K,
et al: Analysis of extracellular vesicles in gastric juice from
gastric cancer patients. Int J Mol Sci. 20(pii): E9532019.
View Article : Google Scholar : PubMed/NCBI
|
|
27
|
Cerami E, Gao J, Dogrusoz U, Gross BE,
Sumer SO, Aksoy BA, Jacobsen A, Byrne CJ, Heuer ML, Larsson E, et
al: The cBio cancer genomics portal: An open platform for exploring
multidimensional cancer genomics data. Cancer Discov. 2:401–404.
2012. View Article : Google Scholar : PubMed/NCBI
|
|
28
|
Gao J, Aksoy BA, Dogrusoz U, Dresdner G,
Gross B, Sumer SO, Sun Y, Jacobsen A, Sinha R, Larsson E, et al:
Integrative analysis of complex cancer genomics and clinical
profiles using the cBioPortal. Sci Signal. 6:pl12013. View Article : Google Scholar : PubMed/NCBI
|
|
29
|
Cancer Genome Atlas Network: Comprehensive
molecular characterization of human colon and rectal cancer.
Nature. 487:330–337. 2012. View Article : Google Scholar : PubMed/NCBI
|
|
30
|
Giannakis M, Mu XJ, Shukla SA, Qian ZR,
Cohen O, Nishihara R, Bahl S, Cao Y, Amin-Mansour A, Yamauchi M, et
al: Genomic correlates of immune-cell infiltrates in colorectal
carcinoma. Cell Rep. 15:857–865. 2016. View Article : Google Scholar : PubMed/NCBI
|
|
31
|
Seshagiri S, Stawiski EW, Durinck S,
Modrusan Z, Storm EE, Conboy CB, Chaudhuri S, Guan Y, Janakiraman
V, Jaiswal BS, et al: Recurrent R-spondin fusions in colon cancer.
Nature. 488:660–664. 2012. View Article : Google Scholar : PubMed/NCBI
|
|
32
|
Brannon AR, Vakiani E, Sylvester BE, Scott
SN, McDermott G, Shah RH, Kania K, Viale A, Oschwald DM, Vacic V,
et al: Comparative sequencing analysis reveals high genomic
concordance between matched primary and metastatic colorectal
cancer lesions. Genome Biol. 15:4542014. View Article : Google Scholar : PubMed/NCBI
|
|
33
|
Yaeger R, Chatila WK, Lipsyc MD, Hechtman
JF, Cercek A, Sanchez-Vega F, Jayakumaran G, Middha S, Zehir A,
Donoghue MTA, et al: Clinical sequencing defines the genomic
landscape of metastatic colorectal cancer. Cancer Cell.
33:125–133.e3. 2018. View Article : Google Scholar : PubMed/NCBI
|
|
34
|
Guda K, Veigl ML, Varadan V, Nosrati A,
Ravi L, Lutterbaugh J, Beard L, Willson JK, Sedwick WD, Wang ZJ, et
al: Novel recurrently mutated genes in African American colon
cancers. Proc Natl Acad Sci USA. 112:1149–1154. 2015. View Article : Google Scholar : PubMed/NCBI
|
|
35
|
Vasaikar S, Huang C, Wang X, Petyuk VA,
Savage SR, Wen B, Dou Y, Zhang Y, Shi Z, Arshad OA, et al:
Proteogenomic analysis of human colon cancer reveals new
therapeutic opportunities. Cell. 177:1035–1049.e19. 2019.
View Article : Google Scholar : PubMed/NCBI
|
|
36
|
Cairns RA, Harris IS and Mak TW:
Regulation of cancer cell metabolism. Nature Rev Cancer. 11:85–95.
2011. View Article : Google Scholar
|
|
37
|
Brabletz T, Hlubek F, Spaderna S,
Schmalhofer O, Hiendlmeyer E, Jung A and Kirchner T: Invasion and
metastasis in colorectal cancer: Epithelial-mesenchymal transition,
mesenchymal-epithelial transition, stem cells and beta-catenin.
Cells Tissues Organs. 179:56–65. 2005. View Article : Google Scholar : PubMed/NCBI
|
|
38
|
Reitzer LJ, Wice BM and Kennell D:
Evidence that glutamine, not sugar, is the major energy source for
cultured HeLa cells. J Biol Chem. 254:2669–2676. 1979.PubMed/NCBI
|
|
39
|
Owen OE, Kalhan SC and Hanson RW: The key
role of anaplerosis and cataplerosis for citric acid cycle
function. J Biol Chem. 277:30409–30412. 2002. View Article : Google Scholar : PubMed/NCBI
|
|
40
|
DeBerardinis RJ, Lum JJ, Hatzivassiliou G
and Thompson CB: The biology of cancer: Metabolic reprogramming
fuels cell growth and proliferation. Cell Metab. 7:11–20. 2008.
View Article : Google Scholar : PubMed/NCBI
|
|
41
|
Duka T, Collins Z, Anderson SM, Raghanti
MA, Ely JJ, Hof PR, Wildman DE, Goodman M, Grossman LI and Sherwood
CC: Divergent lactate dehydrogenase isoenzyme profile in cellular
compartments of primate forebrain structures. Mol Cell Neurosci.
82:137–142. 2017. View Article : Google Scholar : PubMed/NCBI
|
|
42
|
Langhammer S, Najjar M, Hess-Stumpp H and
Thierauch KH: LDH-A influences hypoxia-inducible factor 1α (HIF-1α)
and is critical for growth of HT29 colon carcinoma cells in vivo.
Targ Oncol. 6:155–162. 2011. View Article : Google Scholar
|
|
43
|
Kremer JC, Prudner BC, Lange SES, Bean GR,
Schultze MB, Brashears CB, Radyk MD, Redlich N, Tzeng SC, Kami K,
et al: Arginine deprivation inhibits the Warburg effect and
Upregulates glutamine anaplerosis and serine biosynthesis in
ASS1-deficient cancers. Cell Rep. 18:991–1004. 2017. View Article : Google Scholar : PubMed/NCBI
|
|
44
|
Valvona CJ, Fillmore HL, Nunn PB and
Pilkington GJ: The regulation and function of lactate dehydrogenase
A: Therapeutic potential in brain tumor. Brain Pathol. 26:3–17.
2016. View Article : Google Scholar : PubMed/NCBI
|
|
45
|
Losi L, Baisse B, Bouzourene H and
Benhattar J: Evolution of intratumoral genetic heterogeneity during
colorectal cancer progression. Carcinogenesis. 26:916–922. 2005.
View Article : Google Scholar : PubMed/NCBI
|
|
46
|
Brattain MG, Fine WD, Khaled FM, Thompson
J and Brattain DE: Heterogeneity of malignant cells from a human
colonic carcinoma. Cancer Res. 41:1751–1756. 1981.PubMed/NCBI
|
|
47
|
Hu J, Locasale JW, Bielas JH, O'sullivan
J, Sheahan K, Cantley LC, Vander Heiden MG and Vitkup D:
Heterogeneity of tumor-induced gene expression changes in the human
metabolic network. Nat Biotechnol. 31:522–529. 2013. View Article : Google Scholar : PubMed/NCBI
|
|
48
|
Nassar A, Radhakrishnan A, Cabrero IA,
Cotsonis GA and Cohen C: Intratumoral heterogeneity of
immunohistochemical marker expression in breast carcinoma: A tissue
microarray-based study. Appl Immunohistochem Mol Morphol.
18:433–441. 2010.PubMed/NCBI
|
|
49
|
Böger C, Behrens HM and Röcken C: Ki67-An
unsuitable marker of gastric cancer prognosis unmasks intratumoral
heterogeneity. J Surg Oncol. 113:46–54. 2016. View Article : Google Scholar : PubMed/NCBI
|
|
50
|
Allott EH, Geradts J, Sun X, Cohen SM,
Zirpoli GR, Khoury T, Bshara W, Chen M, Sherman ME, Palmer JR, et
al: Intratumoral heterogeneity as a source of discordance in breast
cancer biomarker classification. Breast Cancer Res. 18:682016.
View Article : Google Scholar : PubMed/NCBI
|
|
51
|
Jakobsen JN, Santoni-Rugiu E, Ravn J and
Sørensen JB: Intratumour variation of biomarker expression by
immunohistochemistry in resectable non-small cell lung cancer. Eur
J Cancer. 49:2494–2503. 2013. View Article : Google Scholar : PubMed/NCBI
|