Introduction
Hepatocellular carcinoma (HCC) is a prevalent
malignant liver disease (1). In most
cases, viral infection contributes to the development, invasion and
metastasis of HCC (2), which is a
global public health problem. In particular, chronic hepatitis B
virus (HBV) is one of the leading causes of HCC with an estimated
400 million individuals currently affected by chronic infection
worldwide (3,4). More than 50% of HCC cases arise from
chronic HBV infections (5,6). In high-prevalence areas, chronic HBV
infection is estimated to account for over 80% of HCC cases
(7). Moreover, patients with
HBV-associated HCC have notably higher rates of metastasis and
recurrence compared with those without HBV infection (8,9).
Three-quarters of the world's population live in areas where there
are high levels of HBV infection (10). However, the currently available
antiviral agents can barely eliminate chronic HBV infection
(11). HBV-associated liver diseases
cause approximately 1 million deaths per year (3), driving an intensive search for curative
treatment approaches (12). Han
et al (13) reported that WNT
family gene expression is associated with the development of
HBV-associated HCC. Tian and Ou's study (14) found that chronic HBV infection could
lead to chronic inflammation in the liver, which could cause normal
liver cells to transform into cancer cells (15). Although the correlation between
chronic HBV infection and HCC development is strong, the precise
molecular mechanisms by which HBV contributes to HCC development
are not fully understood (16).
Therefore, a clearer understanding of the molecular mechanisms of
the transformation of nontumor hepatic tissues into HCC tissues in
patients with HBV infection is required to guide the treatment of
HBV-associated HCC (17).
A large array of data could be analyzed, given the
remarkable development of high-throughput technologies for the
profiling of genome-wide methylation and expression, such as
methylation microarray and MeDip-seq, and RNA-seq, and the datasets
publicly available worldwide (18).
Potential biomarkers and signaling pathway associated with tumor
regression could be identified using bioinformatics methods.
Thus far, there are insufficient bioinformatics
studies focusing on the differentially expressed genes (DEGs)
between HCC tissues and nontumor tissues from HBV-infected patients
based on a large sample size. In the present study, data from more
datasets on the same platform were collected in order to increase
the sample size. Using a large cohort, DEGs between HCC tissues and
nontumor tissues were identified. Furthermore, Gene Ontology (GO)
functional enrichment analysis and Kyoto Encyclopedia of Genes and
Genomes (KEGG) pathway enrichment analysis of the DEGs were
performed. In addition, protein-protein interaction (PPI) networks
were constructed based on the most enriched pathways. The results
of the present study may help to identify key biomarkers for the
personalized treatment of patients with HCC and a history of HBV
infection, and provide further insights into tumor progression and
further studies on HCC.
Materials and methods
Microarray datasets for differential
expression analyses
A comprehensive search was conducted for HCC
microarray datasets, including tissue samples from HBV-infected
patients in the Gene Expression Omnibus (GEO) database of the
National Center for Biotechnology Information (http://www.ncbi.nlm.nih.gov/geo/) website. All
the data of the selected datasets [GSE17548 (19), GSE55092 (20), GSE62232 (21), GSE84044 (22) and GSE84402 (23)] were produced from the GPL570
platform. Subsequently, the raw intensity files (CEL) of the
datasets were downloaded from the GEO database. The robust
multiarray average method of the R package ‘affy’ (version 1.60.0;
http://bioconductor.org/packages/affy/) was used to
process the raw intensity files and generate a large gene
expression matrix of all the selected samples from the datasets
meeting the criteria (HBV positive liver tissue samples with status
information) for differential expression analyses (24). The matrices for each selected dataset
were also generated. In addition, we used two independent HCC
datasets, The Cancer Genome Atlas (TCGA; http://portal.gdc.cancer.gov/projects/TCGA-LIHC)
and GSE76427 (25), including HCC
patients without HBV infection to further elucidate the specificity
of the expression of target genes in HBV-associated HCC.
Analyses of DEGs
Within the large cohort, the DEGs between HCC
tissues and nontumor hepatic tissues were identified using the R
package ‘limma’ (version 3.38.3; http://bioconductor.org/packages/limma/), which is
based on unpaired t-test (26); with
the thresholds of log2-fold change >1 or <-1 and
adjusted P-value <0.05. The results of the differential
expression analyses were visualized with a volcano plot using the R
package ‘ggplot2’ (version 3.1.0; http://bioconductor.org/packages/ggplot2/). The top 50
upregulated and top 50 downregulated DEGs were represented by
heatmaps using the MeV software (version 4.9.0; http://mev.tm4.org/) in the selected datasets. The
unsupervised hierarchical clustering of the selected genes and
samples in the heatmaps was performed using an average linkage
method using Pearson's correlation.
Enrichment analysis of GO function and
KEGG pathway
GO (http://www.geneontology.org) function and KEGG
(https://www.kegg.jp/) pathways enrichment
analyses of the upregulated and downregulated DEGs were performed
using the WEB-based GEne SeT AnaLysis Toolkit (http://www.webgestalt.org/) via a significance
threshold of false discovery rate (FDR) <0.05, in order to
understand the critical biological implications of the identified
DEGs in HBV-positive HCC tissues.
PPI network analyses
To further understand the direct and indirect
associations among the DEGs, PPI networks of the upregulated and
downregulated DEGs based on the top pathways of the KEGG pathway
enrichment analysis were constructed and visualized using the
Search Tool for the Retrieval of Interacting Genes/Proteins
(https://string-db.org) database. The
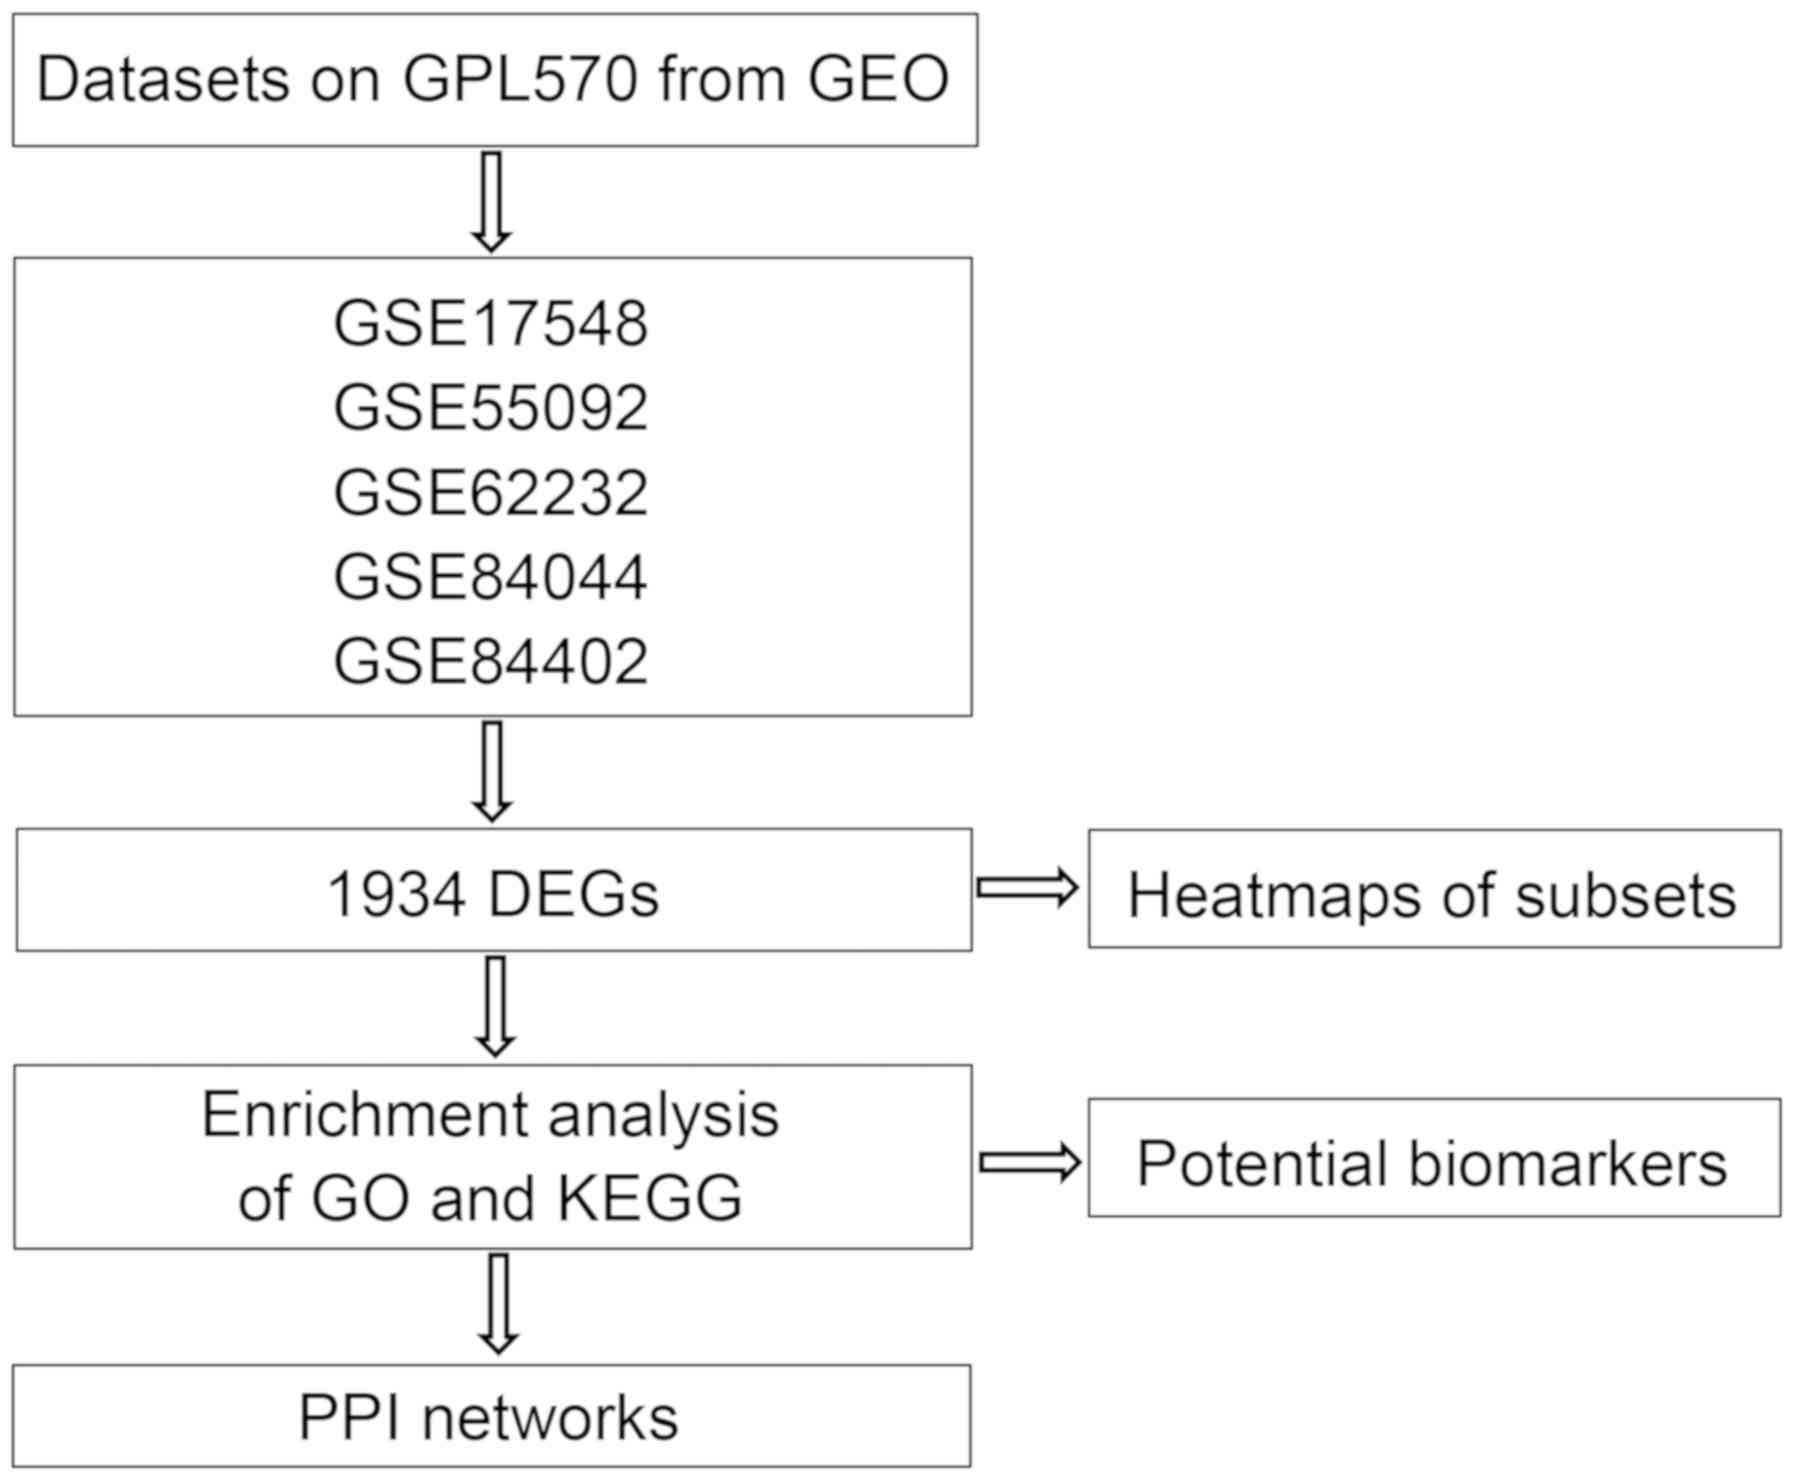
aforementioned methods are summarized in Fig. 1.
Results
Selection of microarray datasets for
differential expression analysis
From the GEO database of NCBI, five datasets
(GSE17548, GSE55092, GSE62232, GSE84044 and GSE84402) that met the
study criteria were used for differential expression analyses.
Within the five datasets, 321 HBV-positive samples with valid
hepatic tissue status were selected to generate the gene expression
matrix; 82 of which were tumor tissues, and 239 of which were
nontumor tissues (Table I). The
clinical characteristics of enrolled subjects can be found in
supplementary data (Table SI).
 | Table I.Characteristics of the datasets used
in this study. |
Table I.
Characteristics of the datasets used
in this study.
|
| Samples (n) |
|
|
|---|
|
|
|
|
|
|---|
| Dataset | HCC | Non-tumor | Tissue | Platform |
|---|
| GSE17548 | 10 | 11 | HBV hepatic
tissue | Affymetrix Human
Genome U133 Plus 2.0 Array |
| GSE55092 | 49 | 91 | HBV hepatic
tissue | Affymetrix Human
Genome U133 Plus 2.0 Array |
| GSE62232 | 10 | 0 | HBV hepatic
tissue | Affymetrix Human
Genome U133 Plus 2.0 Array |
| GSE84044 | 0 | 124 | HBV hepatic
tissue | Affymetrix Human
Genome U133 Plus 2.0 Array |
| GSE84402 | 13 | 13 | HBV hepatic
tissue | Affymetrix Human
Genome U133 Plus 2.0 Array |
DEGs in HCC tissues compared with
nontumor hepatic tissues
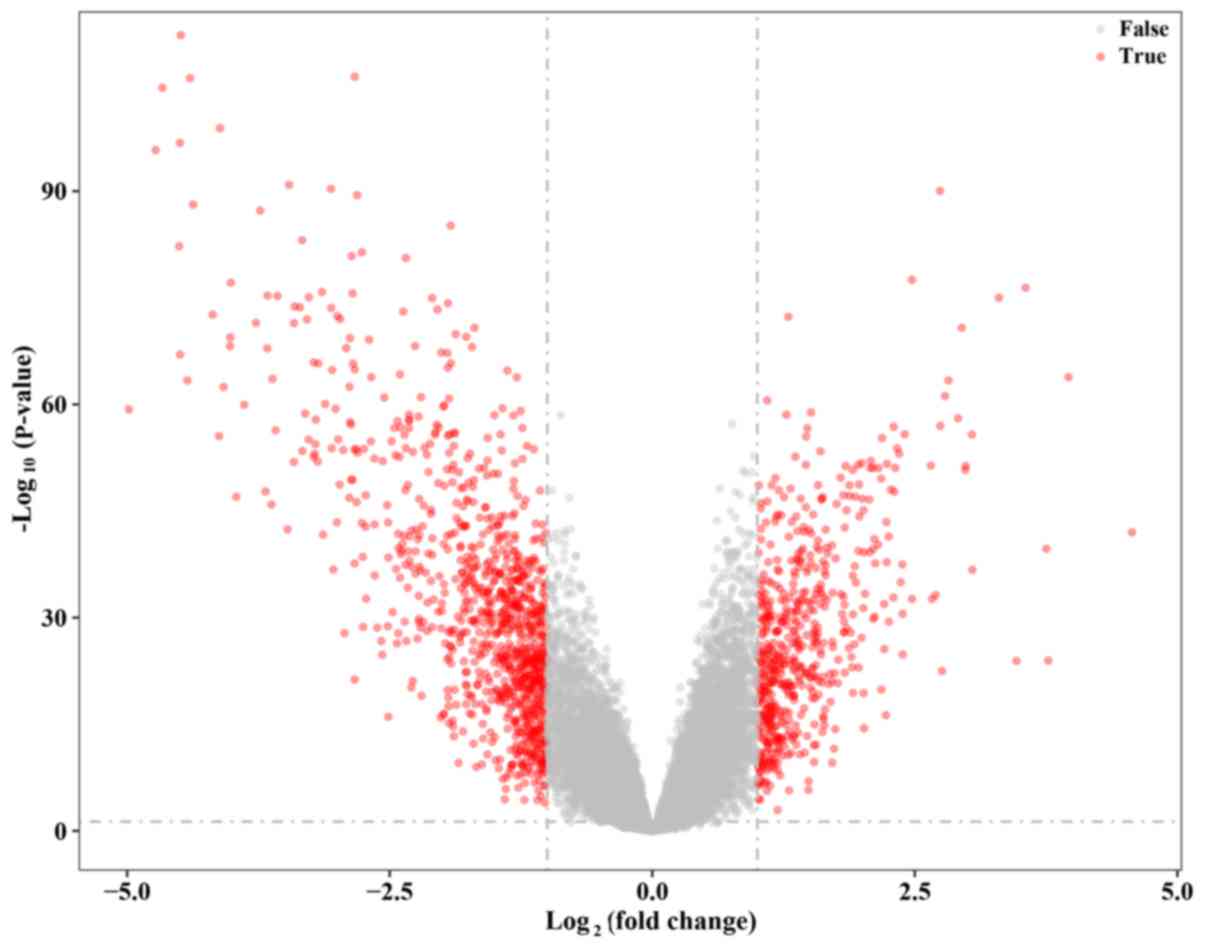
The expression values of 42,901 genes among 82 HCC
samples were compared with 239 nontumor hepatic samples from five
GEO datasets. A total of 1934 DEGs were identified with the
thresholds of fold change >1 or <-1 and adjusted P-value
<0.05, including 682 upregulated genes and 1,252 downregulated
genes. All DEGs are marked as red dots in the volcano plot
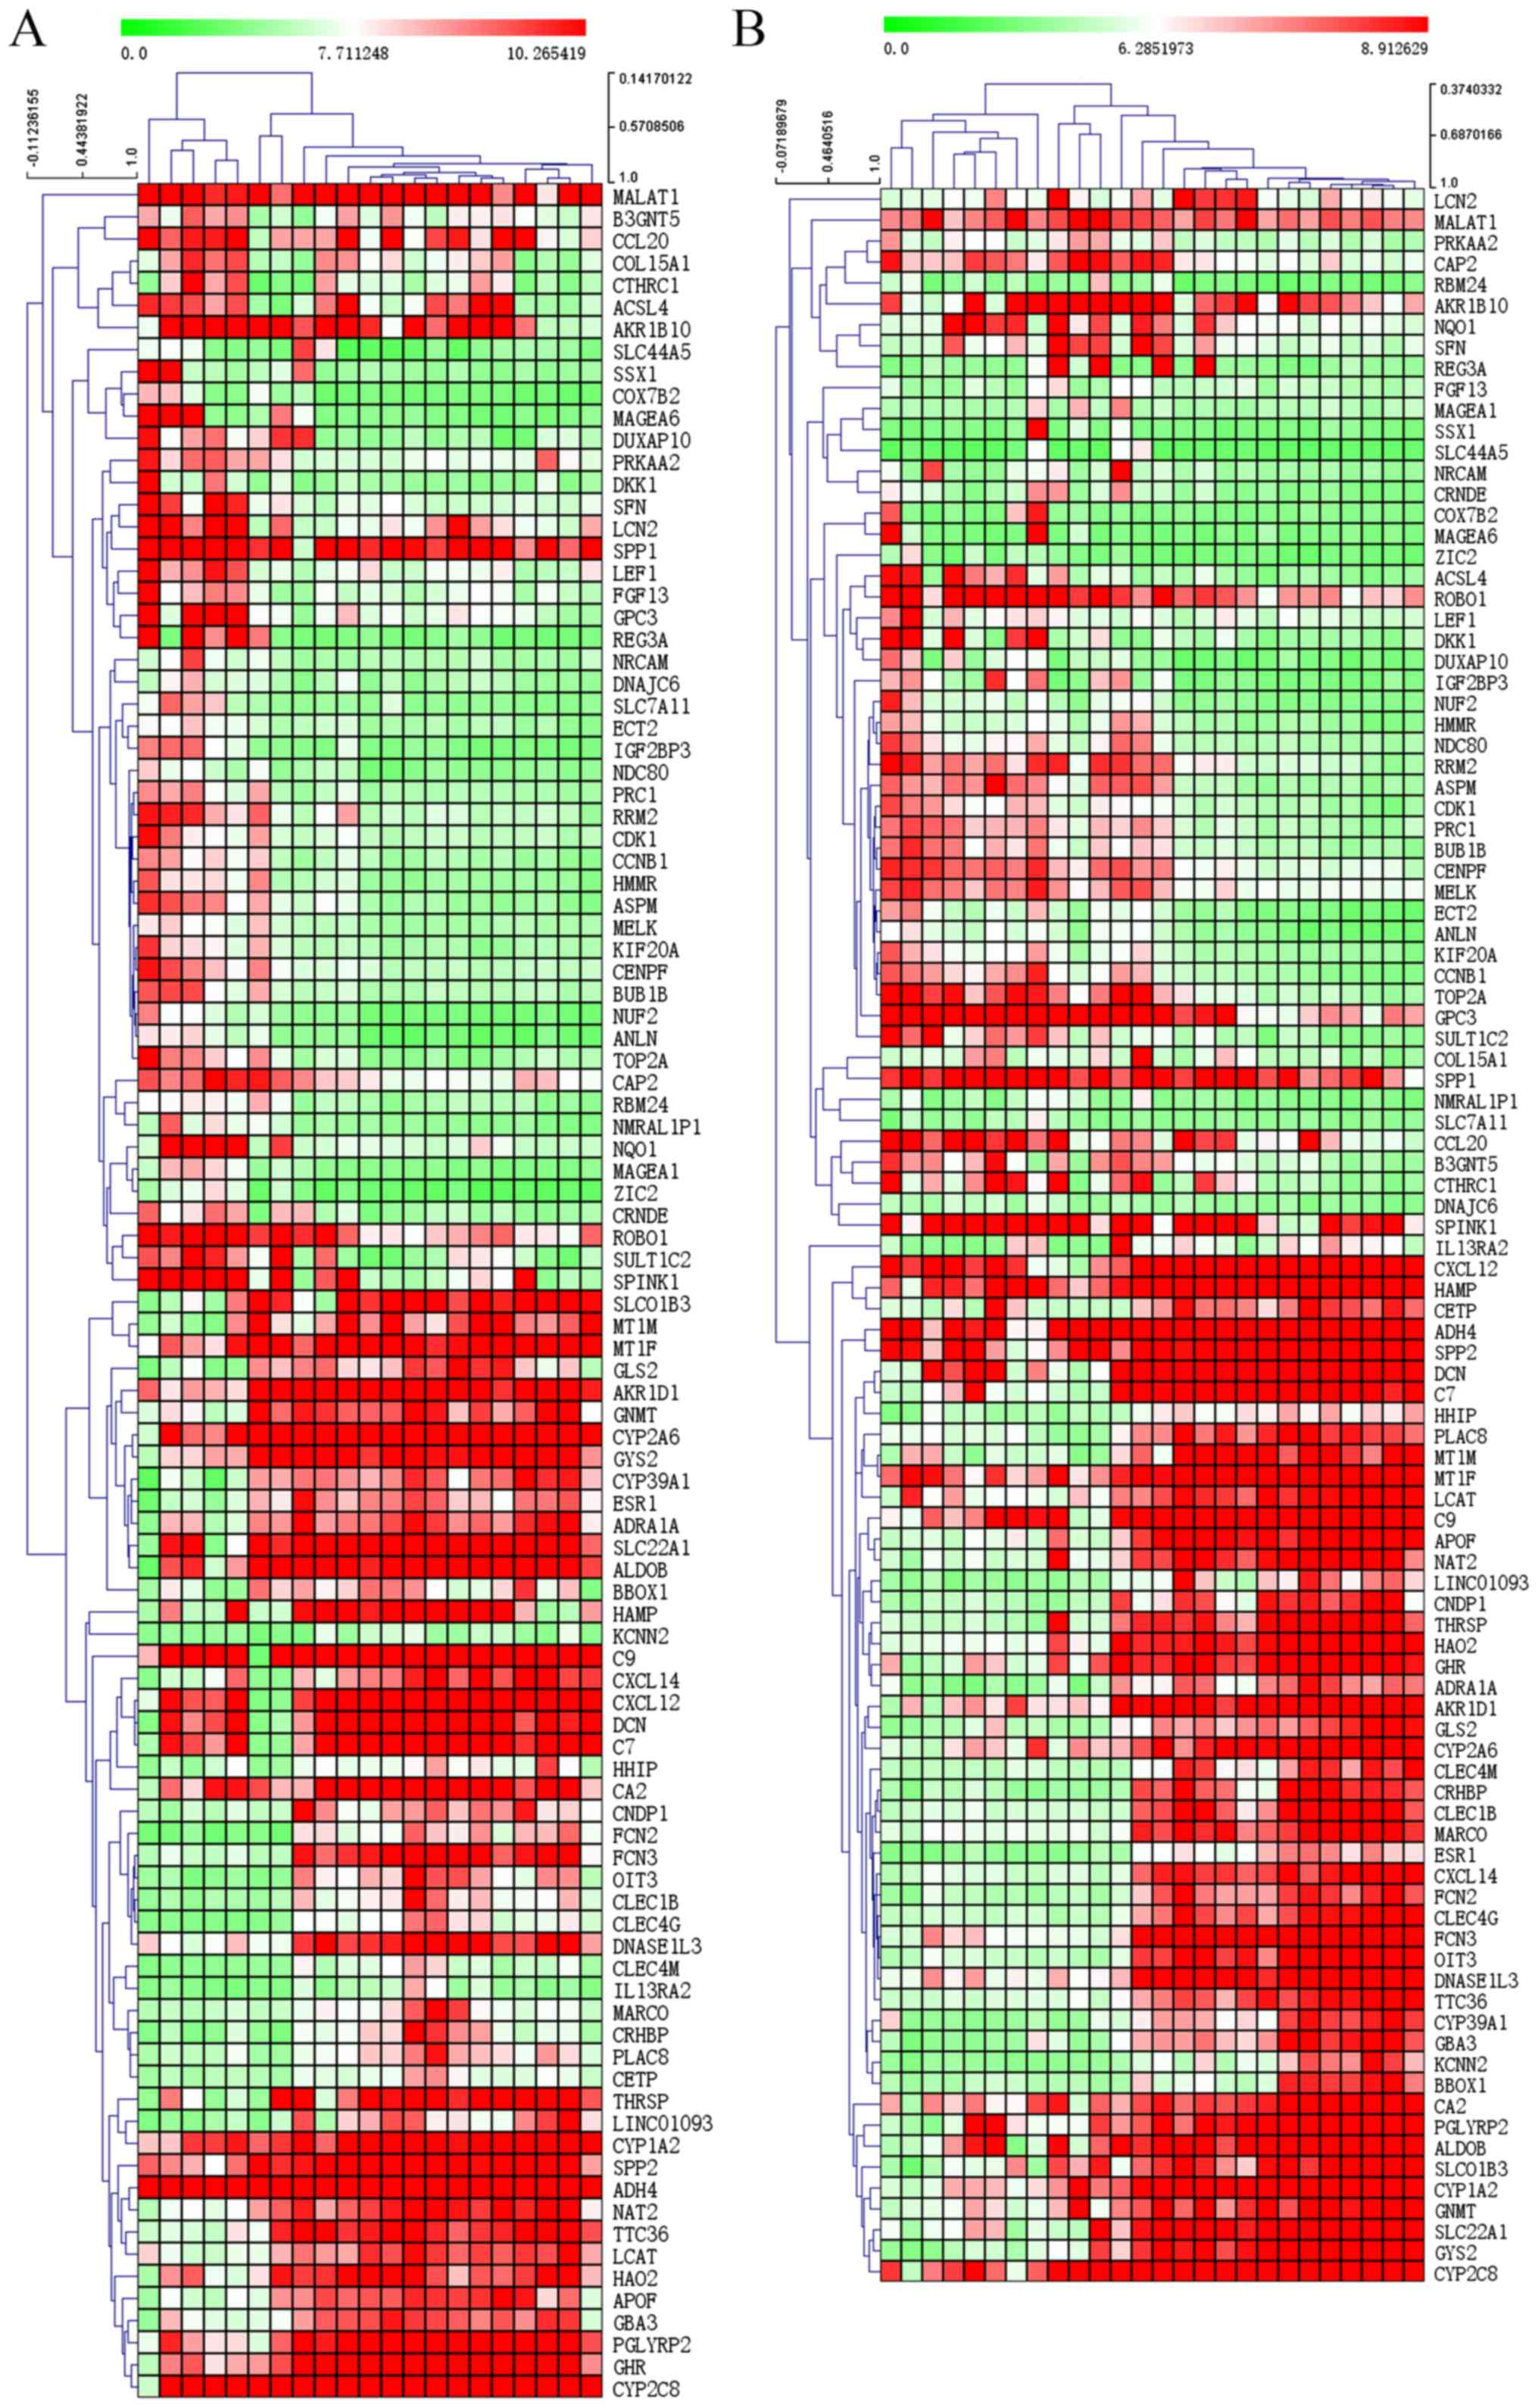
(Fig. 2). In addition, the top 50
upregulated genes and downregulated genes are listed in Tables II and III, respectively (the top 100 up- and
downregulated genes are listed in Tables SII and SIII, respectively). The heat maps of
GSE17548, GSE55092 and GSE84402 demonstrate the expression of the
top 100 DEGs (50 upregulated and 50 downregulated) in different
subsets (GSE17548 and GSE84402 in Fig.
3; GSE55092 in Fig. S1).
| Table II.Top 50 upregulated differentially
expressed genes. |
Table II.
Top 50 upregulated differentially
expressed genes.
| Probe ID | Gene | Fold change | Adjusted
P-value |
|---|
| 206239_s_at | SPINK1 | 4.567348387 |
9.90×10−43 |
| 211470_s_at | SULT1C2 | 3.963534914 |
1.47×10−64 |
| 205815_at | REG3A | 3.770039412 |
1.10×10⁻²⁴ |
| 209220_at | GPC3 | 3.752196862 |
1.99×10−40 |
| 201291_s_at | TOP2A | 3.555152759 |
3.85×10−77 |
| 206561_s_at | AKR1B10 | 3.468810343 |
1.21×10⁻²⁴ |
| 242881_x_at | DUXAP10 | 3.301086607 |
1.01×10−75 |
| 204602_at | DKK1 | 3.048004476 |
1.88×10−37 |
| 203820_s_at | IGF2BP3 | 3.043781559 |
1.76×10−56 |
| 238021_s_at | CRNDE | 2.985078406 |
4.63×10−52 |
| 209921_at | SLC7A11 | 2.980302339 |
1.66×10−51 |
| 213194_at | ROBO1 | 2.947155321 |
1.69×10−71 |
| 241418_at | NMRAL1P1 | 2.911349891 |
8.91×10−59 |
| 223642_at | ZIC2 | 2.821525207 |
4.36×10−64 |
| 222608_s_at | ANLN | 2.787055993 |
6.53×10−62 |
| 209875_s_at | SPP1 | 2.758625836 |
3.14×10⁻²³ |
| 235004_at | RBM24 | 2.743050577 |
1.06×10−57 |
| 212551_at | CAP2 | 2.739651435 |
9.30×10−91 |
| 214612_x_at | MAGEA6 | 2.698311238 |
6.80×10⁻³⁴ |
| 202422_s_at | ACSL4 | 2.663914238 |
2.38×10⁻³³ |
| 219918_s_at | ASPM | 2.652302575 |
4.07×10−52 |
| 235763_at | SLC44A5 | 2.472658451 |
2.37×10⁻³³ |
| 207828_s_at | CENPF | 2.472581020 |
2.98×10−78 |
| 214710_s_at | CCNB1 | 2.403923370 |
1.64×10−56 |
| 225681_at | CTHRC1 | 2.384346752 |
1.53×10⁻²⁵ |
| 212531_at | LCN2 | 2.383664937 |
3.04×10⁻³¹ |
| 201890_at | RRM2 | 2.381259393 |
3.31×10−38 |
| 33323_r_at | SFN | 2.365919617 |
9.97×10−36 |
| 218009_s_at | PRC1 | 2.350952594 |
8.64×10−54 |
| 204162_at | NDC80 | 2.332439517 |
1.54×10−54 |
| 219787_s_at | ECT2 | 2.313749179 |
8.57×10−52 |
| 207165_at | HMMR | 2.304640216 |
1.82×10−48 |
| 204825_at | MELK | 2.298883197 |
1.43×10−57 |
| 203477_at | COL15A1 | 2.295323078 |
1.49×10⁻³³ |
| 203213_at | CDK1 | 2.271576100 |
9.42×10−49 |
| 206626_x_at | SSX1 | 2.253448717 |
3.68×10⁻³⁰ |
| 207325_x_at | MAGEA1 | 2.252155461 |
3.97×10−42 |
| 204720_s_at | DNAJC6 | 2.236082454 |
2.40×10−52 |
| 204105_s_at | NRCAM | 2.232778933 |
1.57×10−38 |
| 227892_at | PRKAA2 | 2.229124796 |
3.47×10−44 |
| 227510_x_at | MALAT1 | 2.224576694 |
5.41×10⁻¹⁷ |
| 201468_s_at | NQO1 | 2.209490964 |
2.70×10⁻²⁶ |
| 205110_s_at | FGF13 | 2.207535230 |
1.23×10⁻³² |
| 223381_at | NUF2 | 2.186987390 |
5.66×10−56 |
| 205476_at | CCL20 | 2.181812965 |
1.34×10⁻²⁰ |
| 203755_at | BUB1B | 2.178984131 |
2.76×10−50 |
| 218755_at | KIF20A | 2.153373571 |
8.72×10−52 |
| 231265_at | COX7B2 | 2.150792051 |
5.69×10−41 |
| 221558_s_at | LEF1 | 2.122850025 |
2.29×10−38 |
| 225612_s_at | B3GNT5 | 2.117997087 |
7.16×10⁻³¹ |
| Table III.Top 50 downregulated differentially
expressed genes. |
Table III.
Top 50 downregulated differentially
expressed genes.
| Probe ID | Gene | Fold change | Adjusted
P-value |
|---|
| 220491_at | HAMP | −4.983632921 |
4.89×10−60 |
| 205866_at | FCN3 | −4.729403108 |
1.63×10−96 |
| 222484_s_at | CXCL14 | −4.664513026 |
2.76×10−105 |
| 205984_at | CRHBP | −4.504769969 |
5.41×10−83 |
| 207804_s_at | FCN2 | −4.498217224 |
1.69×10−97 |
| 207201_s_at | SLC22A1 | −4.496482306 |
9.93×10−68 |
| 220496_at | CLEC1B | −4.489579549 |
1.13×10−112 |
| 217546_at | MT1M | −4.427062929 |
4.20×10−64 |
| 230478_at | OIT3 | −4.401727477 |
1.29×10−106 |
| 1559573_at | LINC01093 | −4.372165201 |
7.87×10−89 |
| 223699_at | CNDP1 | −4.185131569 |
2.30×10−73 |
| 229476_s_at | THRSP | −4.124366630 |
2.88×10−56 |
| 1559065_a_at | CLEC4G | −4.114961753 |
1.36×10−99 |
| 206354_at | SLCO1B3 | −4.081557901 |
3.55×10−63 |
| 207102_at | AKR1D1 | −4.020716573 |
6.22×10−69 |
| 1564706_s_at | GLS2 | −4.018224948 |
3.74×10−70 |
| 207608_x_at | CYP1A2 | −4.013090089 |
7.43×10−78 |
| 206727_at | C9 | −3.961247256 |
9.82×10−48 |
| 209687_at | CXCL12 | −3.885309405 |
1.16×10−60 |
| 219014_at | PLAC8 | −3.774128748 |
3.42×10−72 |
| 207995_s_at | CLEC4M | −3.732362194 |
5.50×10−88 |
| 231678_s_at | ADH4 | −3.682472263 |
1.77×10−48 |
| 205554_s_at | DNASE1L3 | −3.666231016 |
1.29×10−68 |
| 220801_s_at | HAO2 | −3.663835833 |
4.99×10−76 |
| 211896_s_at | DCN | −3.625520940 |
1.19×10−46 |
| 220432_s_at | CYP39A1 | −3.616388369 |
2.51×10−64 |
| 220116_at | KCNN2 | −3.587327181 |
4.31×10−57 |
| 205819_at | MARCO | −3.569710716 |
5.45×10−76 |
| 202992_at | C7 | −3.473352727 |
3.89×10−43 |
| 230135_at | HHIP | −3.458281369 |
1.29×10−91 |
| 210328_at | GNMT | −3.412414732 |
1.25×10−52 |
| 213629_x_at | MT1F | −3.412271922 |
3.79×10−72 |
| 214478_at | SPP2 | −3.405396399 |
1.74×10−74 |
| 205225_at | ESR1 | −3.355285624 |
2.09×10−74 |
| 237350_at | TTC36 | −3.334397580 |
7.78×10−84 |
| 214320_x_at | CYP2A6 | −3.332114585 |
3.55×10−54 |
| 219954_s_at | GBA3 | −3.304920162 |
1.98×10−59 |
| 207262_at | APOF | −3.287687923 |
1.09×10−72 |
| 214621_at | GYS2 | −3.272101039 |
8.61×10−56 |
| 206797_at | NAT2 | −3.270355860 |
8.59×10−76 |
| 242817_at | PGLYRP2 | −3.225627679 |
2.41×10−53 |
| 205498_at | GHR | −3.223775643 |
1.20×10−66 |
| 237390_at | ADRA1A | −3.213027372 |
8.85×10−54 |
| 204704_s_at | ALDOB | −3.208187451 |
3.84×10−55 |
| 209301_at | CA2 | −3.203130234 |
1.38×10−58 |
| 206172_at | IL13RA2 | −3.185151095 |
1.11×10−52 |
| 206210_s_at | CETP | −3.179352566 |
1.73×10−66 |
| 204428_s_at | LCAT | −3.145019681 |
1.47×10−76 |
| 205363_at | BBOX1 | −3.135951206 |
2.16×10−42 |
| 208147_s_at | CYP2C8 | −3.115222728 |
8.68×10−61 |
GO functional and KEGG pathway
enrichment analyses of the upregulated and downregulated DEGs
In order to understand the biological implications
of the identified DEGs in HBV-positive HCC tissues, GO functional
and KEGG pathway enrichment analyses of the identified DEGs were
performed. The GO terms of the up- and downregulated DEGs are
presented in Fig. 4.
In the GO biological process category, upregulated
DEGs were closely associated with the ‘biological regulation’ and
‘metabolic process’ terms, whereas the downregulated DEGs were
closely associated with the ‘metabolic process’ and ‘biological
regulation’ terms.
In the GO cellular component category, upregulated
DEGs were closely associated with the ‘nucleus’ and ‘membrane’
terms, whereas the downregulated DEGs were closely associated with
the ‘membrane’ and ‘vesicle’ terms.
In the GO molecular category, upregulated DEGs were
closely associated with the ‘protein binding’ and ‘nucleic acid
binding’ terms, whereas the downregulated DEGs were closely
associated with the ‘protein binding’ and ‘ion binding’ terms.
In addition, the top 10 enriched KEGG pathway terms
of the up- and downregulated genes are provided in Tables IV and V, respectively. The upregulated DEGs were
primarily associated with the ‘cell cycle’, whereas the
downregulated DEGs were primarily associated with the ‘metabolic
pathways’.
| Table IV.Top 10 enriched KEGG pathway terms of
upregulated differentially expressed genes. |
Table IV.
Top 10 enriched KEGG pathway terms of
upregulated differentially expressed genes.
| KEGG ID | KEGG pathway | No. ofss genes | P-value |
|---|
| hsa04110 | Cell cycle | 24 |
2.51×10⁻¹⁴ |
| hsa05222 | Small cell lung
cancer | 13 |
5.70×10−07 |
| hsa05200 | Pathways in
cancer | 28 |
4.02×10−06 |
| hsa04512 | ECM-receptor
interaction | 11 |
1.42×10−05 |
| hsa04115 | p53 signaling
pathway | 10 |
1.76×10−05 |
| hsa04151 | PI3K-Akt signaling
pathwayss | 21 |
4.69×10−04 |
| hsa04510 | Focal adhesion | 15 |
4.89×10−04 |
| hsa05146 | Amoebiasis | 9 |
1.74×10−03 |
| hsa05213 | Endometrial
cancer | 6 |
2.97×10−03 |
| hsa05218 | Melanoma | 7 |
3.37×10−03 |
| Table V.Top 10 enriched KEGG pathway terms of
downregulated differentially expressed genes. |
Table V.
Top 10 enriched KEGG pathway terms of
downregulated differentially expressed genes.
| KEGG ID | KEGG pathway | No. of genes | P-value |
|---|
| hsa01100 | Metabolic
pathways | 185 | <0.01 |
| hsa04610 | Complement and
coagulation cascades | 33 | <0.01 |
| hsa05204 | Chemical
carcinogenesis | 27 |
5.49×10⁻¹² |
| hsa01200 | Carbon
metabolism | 30 |
2.04×10⁻¹⁰ |
| hsa00260 | Glycine, serine and
threonine metabolism | 17 |
5.18×10⁻¹⁰ |
| hsa00380 | Tryptophan
metabolism | 17 |
5.18×10⁻¹⁰ |
| hsa05150 | Staphylococcus
aureus infection | 20 |
6.30×10⁻¹⁰ |
| hsa00830 | Retinol
metabolism | 21 |
1.95×10−09 |
| hsa00071 | Fatty acid
degradation | 17 |
3.05×10−09 |
| hsa00250 | Alanine, aspartate
and glutamate metabolism | 15 |
4.8×10−09 |
Notably, there were six genes with
log2-fold change >2 in DEGs enriched in the ‘cell
cycle’ pathway: SFN, BUB1B, TTK, CCNB1, CDK1 and
CDC20. Differential expression analysis was performed on the
aforementioned six genes in non-HBV tissues from two independent
HCC datasets (TCGA and GSE76427) on different platforms (TCGA,
Illumina RNA Sequencing; GSE76427, Illumina HumanHT-12 V4.0
expression beadchip). None of these genes had a
log2-fold change >2 (Table VI), which demonstrates that the high
expression of these six DEGs in HBV-associated HCC is more
significant compared with non-HBV HCC.
| Table VI.Differential expression of six
differentially expressed genes in different datasets. |
Table VI.
Differential expression of six
differentially expressed genes in different datasets.
|
| Large HBV
cohort | GSE76427 | TCGA |
|---|
|
|
|
|
|
|---|
| Gene | Fold change | Adj. P-value | Fold change | Adj. P-value | Fold change | Adj. P-value |
|---|
| CCNB1 | 2.403923 |
1.64×10−56 | 0.587062 |
1.36×10⁻¹¹ | 0.607121 |
1.92×10⁻¹¹ |
| SFN | 2.365920 |
9.97×10−36 | 0.880437 |
3.36×10−03 | 0.676444 |
2.14×10−05 |
| CDK1 | 2.271576 |
9.42×10−49 | 0.802341 |
5.35×10⁻¹¹ | 0.769405 |
1.93×10⁻¹¹ |
| BUB1B | 2.178984 |
2.76×10−50 | 1.121998 |
5.27×10⁻¹² | 0.234839 |
9.11×10−07 |
| TTK | 2.066772 |
2.45×10−47 | 1.587680 |
3.34×10⁻¹³ | 0.791737 |
2.17×10⁻¹² |
| CDC20 | 2.012448 |
7.80×10−46 | 1.073711 |
8.29×10−09 | 1.712167 |
4.21×10⁻¹⁰ |
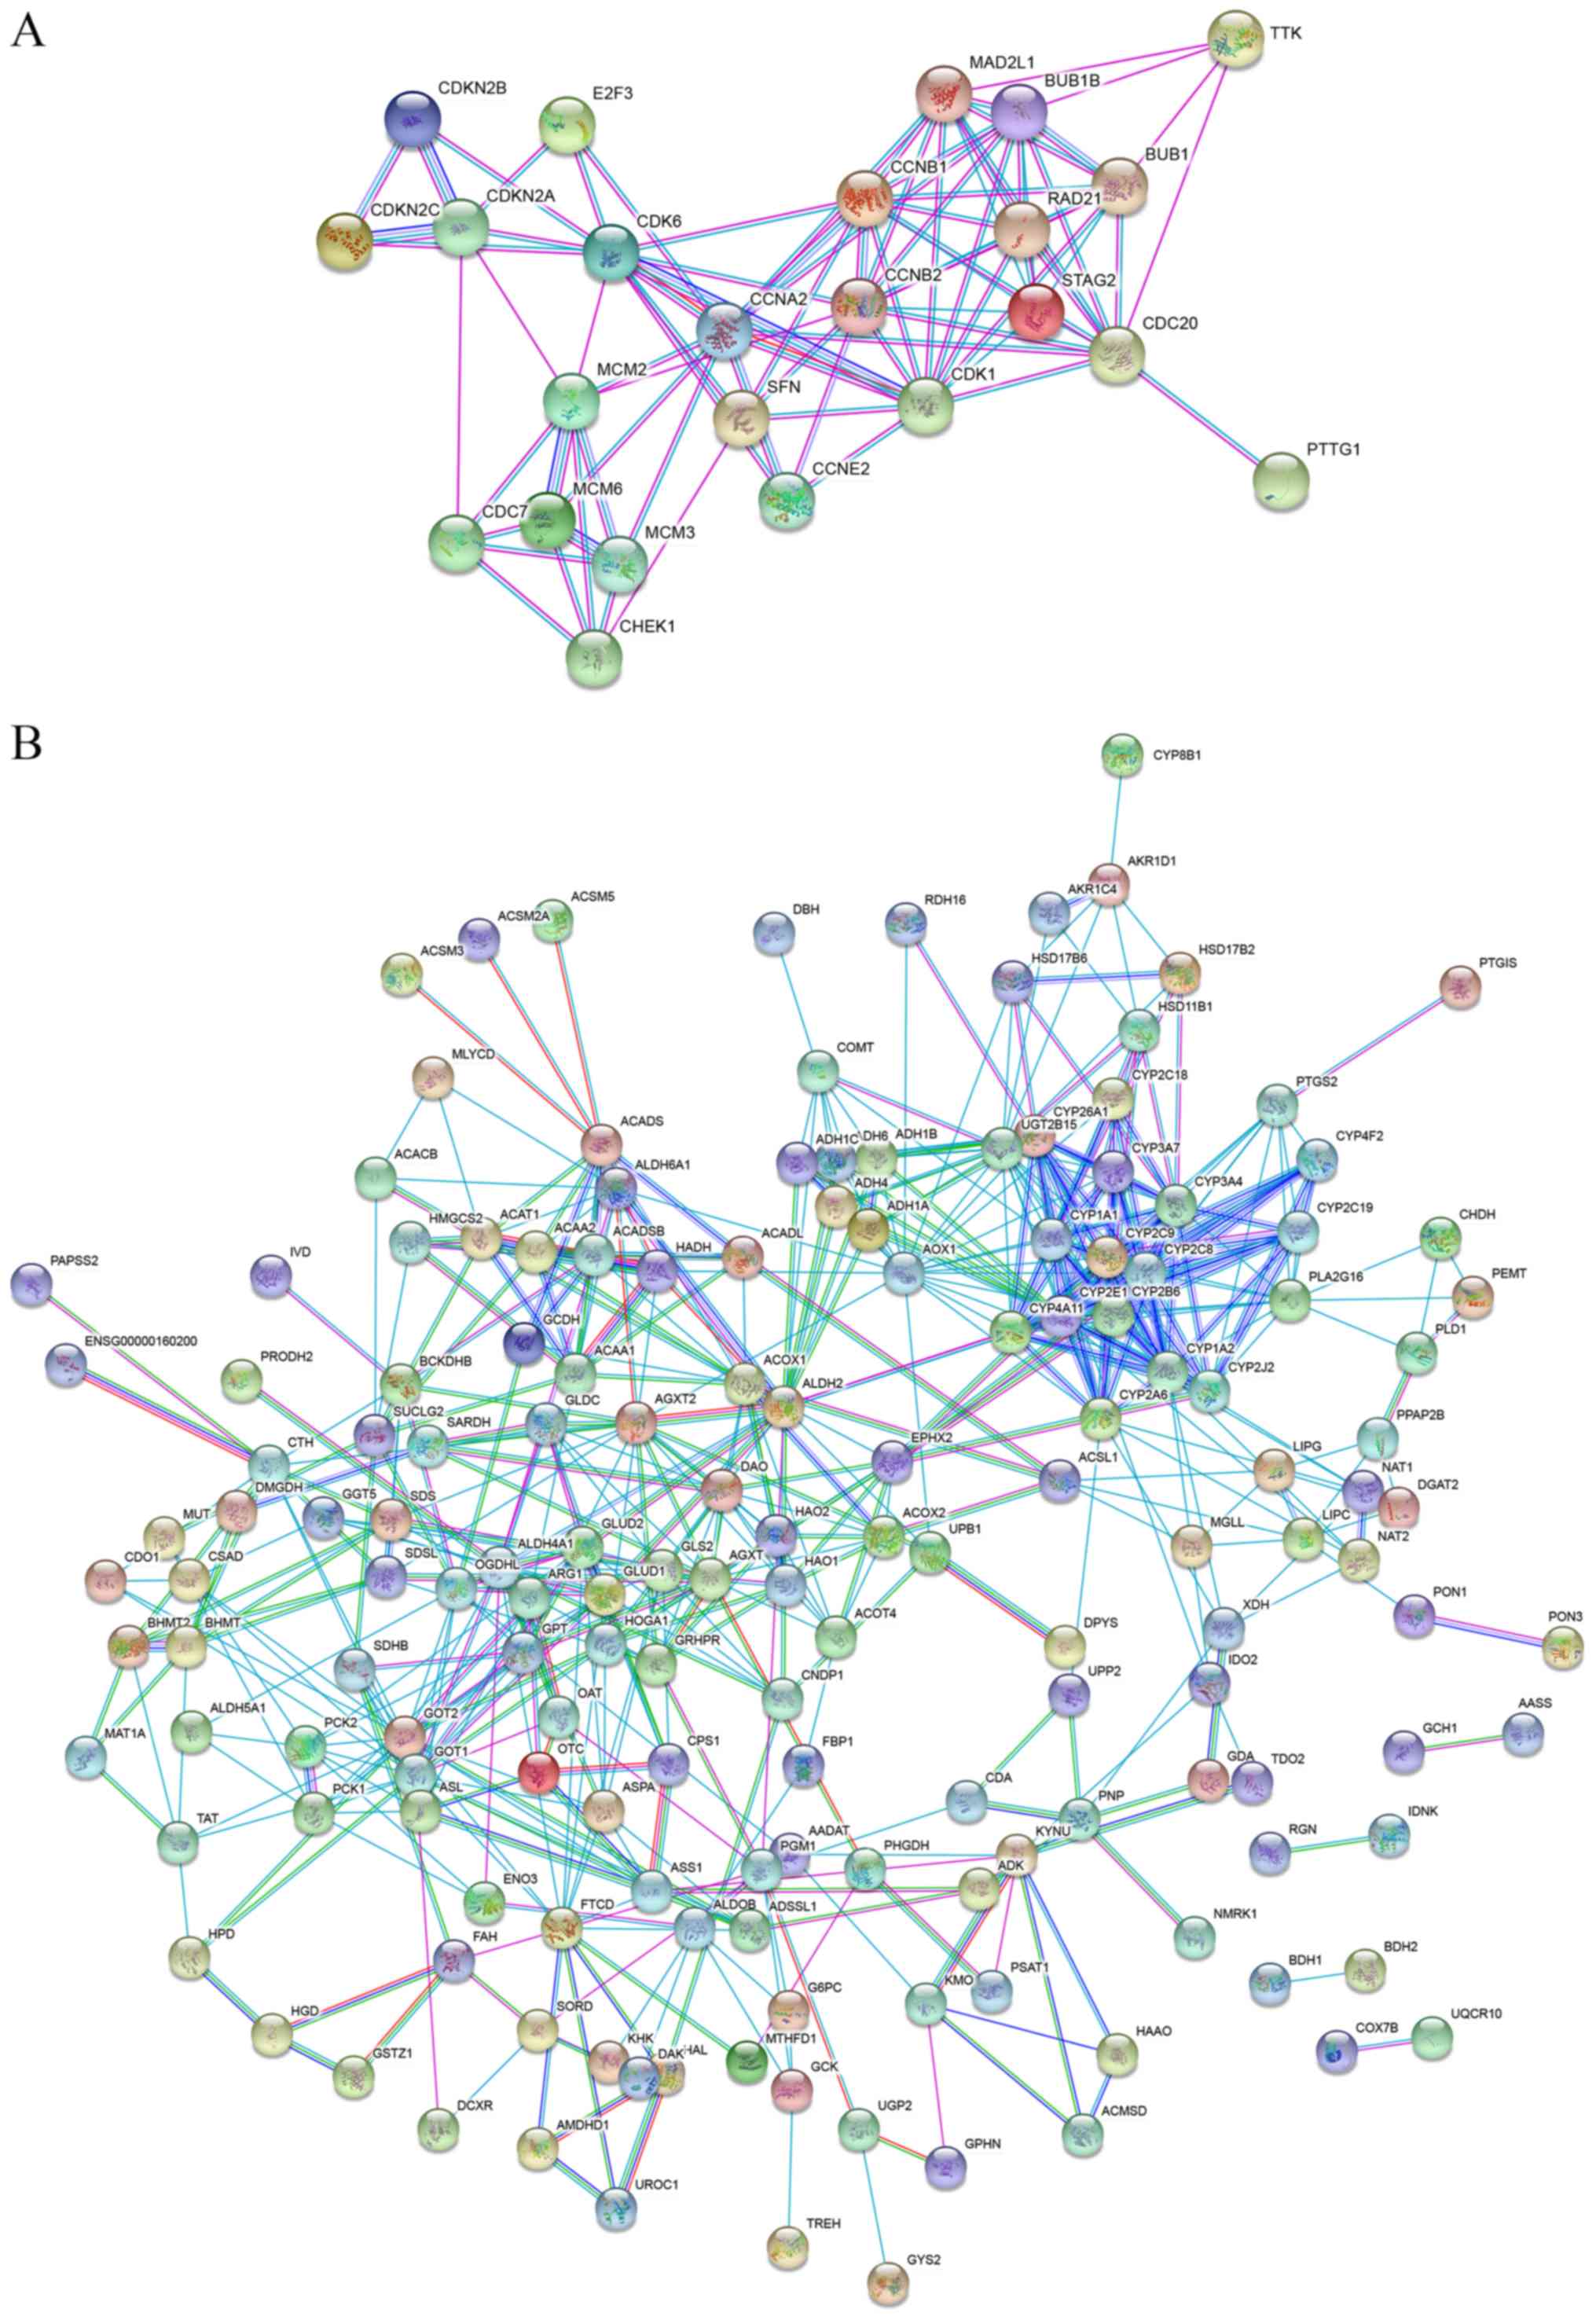
PPI network analysis of the DEGs
To further understand the biological meaning of the
DEGs identified by the top KEGG pathways at the protein level, two
PPI networks for the proteins encoded by the DEGs in the top
pathways were constructed. The PPI network of the ‘cell cycle’
consisted of 24 nodes and 85 edges, whereas the PPI network of the
‘metabolic pathways’ consisted of 184 nodes and 566 edges (Fig. 5).
Discussion
The present study specifically focused on
HBV-infected patients, which is different from the previous studies
on HCC regardless of etiology (19,27). A
total of 682 upregulated DEGs and 1,252 downregulated DEGs were
identified in HCC tissues compared with nontumor hepatic tissues in
321 HBV-positive samples. KEGG analyses demonstrated that the
upregulated DEGs were enriched in signaling pathways such as the
cell cycle, p53 signaling pathway and extracellular matrix-receptor
interaction. A previous study showed that HBV infection deregulates
the cell cycle pathway (28).
Notably, there were 6 genes with a log2-fold change
>2 among the DEGs enriched in the ‘cell cycle’ pathway: SFN,
BUB1B, TTK, CCNB1, CDK1 and CDC20.
SFN (14-3-3σ) protein is a member of the 14-3-3
superfamily (29). SFN has been
found to play a key role in various vital regulatory processes,
such as cell cycle regulation and signaling pathways (30). In a previous study, high expression
of SFN was detected in HCC tissues but not in adjacent nontumor
tissues, which indicated an association between SFN and HCC
(31). In another study, SFN
exhibited high diagnostic accuracy in the differentiation of HCC
from nontumorous hepatocytes (32).
BUB1B (encoding BUBR1) is an important component in
the SAC protein family, which has been found to be involved in
several forms of human cancer, such as lung cancer and breast
cancer (33,34). However, the contradiction of BUB1B
expression in cancer cells remains controversial. Low expression of
BUB1B is associated with the poor survival of patients with colon
adenocarcinomas and lung cancer, however overexpression of BUB1B
contributes to the progression and recurrence of gastric cancer and
bladder cancer (35). However,
several studies showed that the overexpression of BUB1B is
associated with worse prognosis in patients with HCC (36,37).
TTK, a dual-specific protein kinase participating in
the p53 pathway, has been found to be involved in several cancer
types by modulating the mitotic checkpoint (38). A previous study by Miao et al
(39), regarding HBV-associated HCC,
reported TTK as a promising prognostic marker of HCC. TTK alone can
accurately predict the recurrence rate and recurrence time. These
findings on TTK drew interest and resulted in further studies on
cancer (40–42). The results of the present study
supported the conclusion of the study by Miao et al
(39).
CCNB1 plays an integral role in regulating the
G2/M transition in the cell cycle (43). Several studies have found an elevated
expression of CCNB1 in different cancer types, such as breast
cancer (44), non-small cell
carcinoma (45) and gastric cancer
(46). In a previous study, CCNB1
was reported as an independent risk factor of recurrence in
patients with HBV-associated HCC following surgery (47). However, it is still unclear how CCNB1
contributes to oncogenesis and tumor progression.
CDK1 is required for the role of CCNB1 in the
G2/M transition and mitosis resumption (48). Cheng et al (49) conducted in vitro experiments,
which demonstrated that HBV could activate the CCNB1-CDK1 kinase in
HCC cells. In other studies, CCNB1 and CDK1 were found to be
upregulated in the HCC tissues of HBV-positive patients (50). Moreover, overexpression of these two
genes is associated with poor prognosis. CDK1 was considered
important as CCNB1, since it could affect both overall survival and
recurrence-free survival of HBV-positive patients with HCC
(51).
CDC20 functions as a regulatory protein that
interacts with several other proteins at multiple points in the
cell cycle. Chae et al (52)
demonstrated that HBV-infection could attenuate the association
between BubR1 and CDC20, thus preventing CDC20 from performing its
original function, which provided a novel view on the development
of HBV-associated HCC.
The high expression of the six DEGs was more
significant in HBV-associated HCC than in non-HBV HCC, and was
validated in two independent HCC datasets. In future studies,
clinical HCC samples should be collected in order to verify that
these genes are affected by HBV infection.
The downregulated DEGs were enriched in signaling
pathways such as ‘carbon metabolism’, ‘glycine, serine and
threonine metabolism’, ‘tryptophan metabolism’, ‘retinol
metabolism’ and ‘alanine, aspartate and glutamate metabolism’. A
previous study reported that HBV-infection could induce alterations
in metabolic signaling pathways. The consequences may alter normal
hepatocyte metabolism, thus contributing to the progression of
HBV-associated carcinogenesis (53).
In conclusion, the present study identified several
DEGs in HCC tissues compared with nontumor tissues from
HBV-infected patients, based on a large cohort. Based on the DEGs,
several key pathways were identified. The interactions of the DEGs
in the pathways were also presented by PPI networks. Some results
were consistent with previous studies (39,50).
Furthermore, the present study provides new insights into the
specific etiology of HCC and molecular mechanisms for the
transformation of nontumor hepatic tissues into HCC tissues, in
patients with a history of HBV infection. Importantly, these
results may provide several potential therapeutic targets for
targeted therapy in these patients, which could aid early diagnosis
and treatment of HCC.
Supplementary Material
Supporting Data
Acknowledgements
Not applicable.
Funding
This study was supported in part by grants from the
Natural Science Foundation of Jiangxi Province (grant no.
20181BBG78042).
Availability of data and materials
The datasets used and/or analyzed during the present
study are available from the corresponding author on reasonable
request.
Authors' contributions
XZ, LW and YY conceived and designed the study. LW
analyzed the data. XZ contributed to literature review. XZ and LW
wrote the manuscript. XZ and YY reviewed and edited the manuscript.
All authors read and approved the final manuscript.
Ethics approval and consent to
participate
Not applicable.
Patient consent for publication
Not applicable.
Competing interests
The authors declare that they have no competing
interests.
References
|
1
|
Wu CC, Wu DW, Lin YY, Lin PL and Lee H:
Hepatitis B virus X protein represses LKB1 expression to promote
tumor progression and poor postoperative outcome in hepatocellular
carcinoma. Surgery. 163:1040–1046. 2018. View Article : Google Scholar : PubMed/NCBI
|
|
2
|
Duan L, Wu R, Zhang X, Wang D, You Y,
Zhang Y, Zhou L and Chen W: HBx-induced S100A9 in NF-κB dependent
manner promotes growth and metastasis of hepatocellular carcinoma
cells. Cell Death Dis. 9:6292018. View Article : Google Scholar : PubMed/NCBI
|
|
3
|
Tsunematsu S, Suda G, Yamasaki K, Kimura
M, Izumi T, Umemura M, Ito J, Sato F, Nakai M, Sho T, et al:
Hepatitis B virus X protein impairs alpha-interferon signaling via
up-regulation of suppressor of cytokine signaling 3 and protein
phosphatase 2A. J Med Virol. 89:267–275. 2017. View Article : Google Scholar : PubMed/NCBI
|
|
4
|
Kapoor NR, Chadha R, Kumar S, Choedon T,
Reddy VS and Kumar V: The HBx gene of hepatitis B virus can
influence hepatic microenvironment via exosomes by transferring its
mRNA and protein. Virus Res. 240:166–174. 2017. View Article : Google Scholar : PubMed/NCBI
|
|
5
|
Casciano JC and Bouchard MJ: Hepatitis B
virus X protein modulates cytosolic Ca(2+) signaling in primary
human hepatocytes. Virus Res. 246:23–27. 2018. View Article : Google Scholar : PubMed/NCBI
|
|
6
|
Huang XY, Li D, Chen ZX, Huang YH, Gao WY,
Zheng BY and Wang XZ: Hepatitis B Virus X protein elevates
Parkin-mediated mitophagy through Lon Peptidase in starvation. Exp
Cell Res. 368:75–83. 2018. View Article : Google Scholar : PubMed/NCBI
|
|
7
|
Hensel KO, Cantner F, Bangert F, Wirth S
and Postberg J: Episomal HBV persistence within transcribed host
nuclear chromatin compartments involves HBx. Epigenetics Chromatin.
11:342018. View Article : Google Scholar : PubMed/NCBI
|
|
8
|
Li C, Lin C, Cong X and Jiang Y: PDK1-WNK1
signaling is affected by HBx and involved in the viability and
metastasis of hepatic cells. Oncol Lett. 15:5940–5946.
2018.PubMed/NCBI
|
|
9
|
Jin Y, Wu D, Yang W, Weng M, Li Y, Wang X,
Zhang X, Jin X and Wang T: Hepatitis B virus × protein induces
epithelial-mesenchymal transition of hepatocellular carcinoma cells
by regulating long non-coding RNA. Virol J. 14:2382017. View Article : Google Scholar : PubMed/NCBI
|
|
10
|
Xu F, Song H, Xiao Q, Li N, Zhang H, Cheng
G and Tan G: Type III interferon-induced CBFbeta inhibits HBV
replication by hijacking HBx. Cell Mol Immunol. 17:357–366. 2019.
View Article : Google Scholar
|
|
11
|
Liu Y, Yao W, Si L, Hou J, Wang J, Xu Z,
Li W, Chen J, Li R, Li P, et al: Chinese herbal extract Su-duxing
had potent inhibitory effects on both wild-type and
entecavir-resistant hepatitis B virus (HBV) in vitro and
effectively suppressed HBV replication in mouse model. Antiviral
Res. 155:39–47. 2018. View Article : Google Scholar : PubMed/NCBI
|
|
12
|
Ko C, Chakraborty A, Chou WM, Hasreiter J,
Wettengel JM, Stadler D, Bester R, Asen T, Zhang K, Wisskirchen K,
et al: Hepatitis B virus genome recycling and de novo secondary
infection events maintain stable cccDNA levels. J Hepatol.
69:1231–1241. 2018. View Article : Google Scholar : PubMed/NCBI
|
|
13
|
Han Q, Wang X, Liao X, Han C, Yu T, Yang
C, Li G, Han B, Huang K, Zhu G, et al: Diagnostic and prognostic
value of WNT family gene expression in hepatitis B virusrelated
hepatocellular carcinoma. Oncol Rep. 42:895–910. 2019.PubMed/NCBI
|
|
14
|
Tian Y and Ou JH: Genetic and epigenetic
alterations in hepatitis B virus-associated hepatocellular
carcinoma. Virol Sin. 30:85–91. 2015. View Article : Google Scholar : PubMed/NCBI
|
|
15
|
Xie X, Xu X, Sun C and Yu Z: Hepatitis B
virus X protein promotes proliferation of hepatocellular carcinoma
cells by upregulating miR-181b by targeting ING5. Biol Chem.
399:611–619. 2018. View Article : Google Scholar : PubMed/NCBI
|
|
16
|
Hamamoto H, Maemura K, Matsuo K, Taniguchi
K, Tanaka Y, Futaki S, Takeshita A, Asai A, Hayashi M, Hirose Y, et
al: Delta-like 3 is silenced by HBx via histone acetylation in
HBV-associated HCCs. Sci Rep. 8:48422018. View Article : Google Scholar : PubMed/NCBI
|
|
17
|
Tang Q, Wang Q, Zhang Q, Lin SY, Zhu Y,
Yang X and Guo AY: Gene expression, regulation of DEN and HBx
induced HCC mice models and comparisons of tumor, para-tumor and
normal tissues. BMC Cancer. 17:8622017. View Article : Google Scholar : PubMed/NCBI
|
|
18
|
He X, Zhang C, Shi C and Lu Q:
Meta-analysis of mRNA expression profiles to identify
differentially expressed genes in lung adenocarcinoma tissue from
smokers and non-smokers. Oncol Rep. 39:929–938. 2018.PubMed/NCBI
|
|
19
|
Yildiz G, Arslan-Ergul A, Bagislar S, Konu
O, Yuzugullu H, Gursoy-Yuzugullu O, Ozturk N, Ozen C, Ozdag H,
Erdal E, et al: Genome-wide transcriptional reorganization
associated with senescence-to-immortality switch during human
hepatocellular carcinogenesis. PLoS One. 8:e640162013. View Article : Google Scholar : PubMed/NCBI
|
|
20
|
Melis M, Diaz G, Kleiner DE, Zamboni F,
Kabat J, Lai J, Mogavero G, Tice A, Engle RE, Becker S, et al:
Viral expression and molecular profiling in liver tissue versus
microdissected hepatocytes in hepatitis B virus-associated
hepatocellular carcinoma. J Transl Med. 12:2302014. View Article : Google Scholar : PubMed/NCBI
|
|
21
|
Schulze K, Imbeaud S, Letouze E,
Alexandrov LB, Calderaro J, Rebouissou S, Couchy G, Meiller C,
Shinde J, Soysouvanh F, et al: Exome sequencing of hepatocellular
carcinomas identifies new mutational signatures and potential
therapeutic targets. Nat Genet. 47:505–511. 2015. View Article : Google Scholar : PubMed/NCBI
|
|
22
|
Wang M, Gong Q, Zhang J, Chen L, Zhang Z,
Lu L, Yu D, Han Y, Zhang D, Chen P, et al: Characterization of gene
expression profiles in HBV-related liver fibrosis patients and
identification of ITGBL1 as a key regulator of fibrogenesis. Sci
Rep. 7:434462017. View Article : Google Scholar : PubMed/NCBI
|
|
23
|
Wang H, Huo X, Yang XR, He J, Cheng L,
Wang N, Deng X, Jin H, Wang N, Wang C, et al: STAT3-mediated
upregulation of lncRNA HOXD-AS1 as a ceRNA facilitates liver cancer
metastasis by regulating SOX4. Mol Cancer. 16:1362017. View Article : Google Scholar : PubMed/NCBI
|
|
24
|
Irizarry RA, Hobbs B, Collin F,
Beazer-Barclay YD, Antonellis KJ, Scherf U and Speed TP:
Exploration, normalization, and summaries of high density
oligonucleotide array probe level data. Biostatistics. 4:249–264.
2003. View Article : Google Scholar : PubMed/NCBI
|
|
25
|
Grinchuk OV, Yenamandra SP, Iyer R, Singh
M, Lee HK, Lim KH, Chow PK and Kuznetsov VA: Tumor-adjacent tissue
co-expression profile analysis reveals pro-oncogenic ribosomal gene
signature for prognosis of resectable hepatocellular carcinoma. Mol
Oncol. 12:89–113. 2018. View Article : Google Scholar : PubMed/NCBI
|
|
26
|
Phipson B, Lee S, Majewski IJ, Alexander
WS and Smyth GK: Robust hyperparameter estimation protects against
hypervariable genes and improves power to detect differential
expression. Ann Appl Stat. 10:946–963. 2016. View Article : Google Scholar : PubMed/NCBI
|
|
27
|
He B, Yin J, Gong S, Gu J, Xiao J, Shi W,
Ding W and He Y: Bioinformatics analysis of key genes and pathways
for hepatocellular carcinoma transformed from cirrhosis. Medicine
(Baltimore). 96:e69382017. View Article : Google Scholar : PubMed/NCBI
|
|
28
|
Xia Y, Cheng X, Li Y, Valdez K, Chen W and
Liang TJ: Hepatitis B Virus Deregulates the Cell Cycle To Promote
Viral Replication and a Premalignant Phenotype. J Virol. 92:2018.
View Article : Google Scholar
|
|
29
|
Chen XL, Zhou L, Yang J, Shen FK, Zhao SP
and Wang YL: Hepatocellular carcinoma-associated protein markers
investigated by MALDI-TOF MS. Mol Med Rep. 3:589–596. 2010.
View Article : Google Scholar : PubMed/NCBI
|
|
30
|
Lewis AG, Flanagan J, Marsh A, Pupo GM,
Mann G, Spurdle AB, Lindeman GJ, Visvader JE, Brown MA and
Chenevix-Trench G; Kathleen Cuningham Foundation Consortium for
Research into Familial Breast Cancer, : Mutation analysis of
FANCD2, BRIP1/BACH1, LMO4 and SFN in familial breast cancer. Breast
Cancer Res. 7:R1005–1016. 2005. View
Article : Google Scholar : PubMed/NCBI
|
|
31
|
Lee IN, Chen CH, Sheu JC, Lee HS, Huang
GT, Yu CY, Lu FJ and Chow LP: Identification of human
hepatocellular carcinoma-related biomarkers by two-dimensional
difference gel electrophoresis and mass spectrometry. J Proteome
Res. 4:2062–2069. 2005. View Article : Google Scholar : PubMed/NCBI
|
|
32
|
Reis H, Putter C, Megger DA, Bracht T,
Weber F, Hoffmann AC, Bertram S, Wohlschlager J, Hagemann S,
Eisenacher M, et al: A structured proteomic approach identifies
14-3-3 sigma as a novel and reliable protein biomarker in panel
based differential diagnostics of liver tumors. Biochim Biophys
Acta. 1854:641–650. 2015. View Article : Google Scholar : PubMed/NCBI
|
|
33
|
Saeki A, Tamura S, Ito N, Kiso S, Matsuda
Y, Yabuuchi I, Kawata S and Matsuzawa Y: Frequent impairment of the
spindle assembly checkpoint in hepatocellular carcinoma. Cancer.
94:2047–2054. 2002. View Article : Google Scholar : PubMed/NCBI
|
|
34
|
Seike M, Gemma A, Hosoya Y, Hosomi Y,
Okano T, Kurimoto F, Uematsu K, Takenaka K, Yoshimura A, Shibuya M,
et al: The promoter region of the human BUBR1 gene and its
expression analysis in lung cancer. Lung Cancer. 38:229–234. 2002.
View Article : Google Scholar : PubMed/NCBI
|
|
35
|
Zhuang L, Yang Z and Meng Z: Upregulation
of BUB1B, CCNB1, CDC7, CDC20, and MCM3 in tumor tissues predicted
worse overall survival and disease-free survival in hepatocellular
carcinoma patients. Biomed Res Int. 2018:78973462018. View Article : Google Scholar : PubMed/NCBI
|
|
36
|
Liu AW, Cai J, Zhao XL, Xu AM, Fu HQ, Nian
H and Zhang SH: The clinicopathological significance of BUBR1
overexpression in hepatocellular carcinoma. J Clin Pathol.
62:1003–1008. 2009. View Article : Google Scholar : PubMed/NCBI
|
|
37
|
Sun B, Lin G, Ji D, Li S, Chi G and Jin X:
Dysfunction of sister chromatids separation promotes progression of
hepatocellular carcinoma according to analysis of gene expression
profiling. Front Physiol. 9:10192018. View Article : Google Scholar : PubMed/NCBI
|
|
38
|
Janssen A, van der Burg M, Szuhai K, Kops
GJ and Medema RH: Chromosome segregation errors as a cause of DNA
damage and structural chromosome aberrations. Science.
333:1895–1898. 2011. View Article : Google Scholar : PubMed/NCBI
|
|
39
|
Miao R, Luo H, Zhou H, Li G, Bu D, Yang X,
Zhao X, Zhang H, Liu S, Zhong Y, et al: Identification of
prognostic biomarkers in hepatitis B virus-related hepatocellular
carcinoma and stratification by integrative multi-omics analysis. J
Hepatol. 61:840–849. 2014. View Article : Google Scholar : PubMed/NCBI
|
|
40
|
Pineda-Solis K and McAlister V: Wading
through the noise of ‘multi-omics’ to identify prognostic
biomarkers in hepatocellular carcinoma. Hepatobiliary Surg Nutr.
4:293–294. 2015.PubMed/NCBI
|
|
41
|
Baffy G: Decoding multifocal
hepatocellular carcinoma: An opportune pursuit. Hepatobiliary Surg
Nutr. 4:206–210. 2015.PubMed/NCBI
|
|
42
|
Feo F and Pascale RM: Multifocal
hepatocellular carcinoma: Intrahepatic metastasis or multicentric
carcinogenesis? Ann Transl Med. 3:42015.PubMed/NCBI
|
|
43
|
Wang G, Chen H, Huang M, Wang N, Zhang J,
Zhang Y, Bai G, Fong WF, Yang M and Yao X: Methyl protodioscin
induces G2/M cell cycle arrest and apoptosis in HepG2 liver cancer
cells. Cancer Lett. 241:102–109. 2006. View Article : Google Scholar : PubMed/NCBI
|
|
44
|
Nimeus-Malmstrom E, Koliadi A, Ahlin C,
Holmqvist M, Holmberg L, Amini RM, Jirstrom K, Warnberg F,
Blomqvist C, Ferno M and Fjällskog ML: Cyclin B1 is a prognostic
proliferation marker with a high reproducibility in a
population-based lymph node negative breast cancer cohort. Int J
Cancer. 127:961–967. 2010.PubMed/NCBI
|
|
45
|
Soria JC, Jang SJ, Khuri FR, Hassan K, Liu
D, Hong WK and Mao L: Overexpression of cyclin B1 in early-stage
non-small cell lung cancer and its clinical implication. Cancer
Res. 60:4000–4004. 2000.PubMed/NCBI
|
|
46
|
Begnami MD, Fregnani JH, Nonogaki S and
Soares FA: Evaluation of cell cycle protein expression in gastric
cancer: cyclin B1 expression and its prognostic implication. Hum
Pathol. 41:1120–1127. 2010. View Article : Google Scholar : PubMed/NCBI
|
|
47
|
Weng L, Du J, Zhou Q, Cheng B, Li J, Zhang
D and Ling C: Identification of cyclin B1 and Sec62 as biomarkers
for recurrence in patients with HBV-related hepatocellular
carcinoma after surgical resection. Mol Cancer. 11:392012.
View Article : Google Scholar : PubMed/NCBI
|
|
48
|
Fang Y, Yu H, Liang X, Xu J and Cai X:
Chk1-induced CCNB1 overexpression promotes cell proliferation and
tumor growth in human colorectal cancer. Cancer Biol Ther.
15:1268–1279. 2014. View Article : Google Scholar : PubMed/NCBI
|
|
49
|
Cheng P, Li Y, Yang L, Wen Y, Shi W, Mao
Y, Chen P, Lv H, Tang Q and Wei Y: Hepatitis B virus X protein
(HBx) induces G2/M arrest and apoptosis through sustained
activation of cyclin B1-CDK1 kinase. Oncol Rep. 22:1101–1107.
2009.PubMed/NCBI
|
|
50
|
Chen QF, Xia JG, Li W, Shen LJ, Huang T
and Wu P: Examining the key genes and pathways in hepatocellular
carcinoma development from hepatitis B viruspositive cirrhosis. Mol
Med Rep. 18:4940–4950. 2018.PubMed/NCBI
|
|
51
|
Li H, Zhao X, Li C, Sheng C and Bai Z:
Integrated analysis of lncRNA-associated ceRNA network reveals
potential biomarkers for the prognosis of hepatitis B virus-related
hepatocellular carcinoma. Cancer Manag Res. 11:877–897. 2019.
View Article : Google Scholar : PubMed/NCBI
|
|
52
|
Chae S, Ji JH, Kwon SH, Lee HS, Lim JM,
Kang D, Lee CW and Cho H: HBxAPalpha/Rsf-1-mediated HBx-hBubR1
interactions regulate the mitotic spindle checkpoint and chromosome
instability. Carcinogenesis. 34:1680–1688. 2013. View Article : Google Scholar : PubMed/NCBI
|
|
53
|
Slagle BL and Bouchard MJ: Role of HBx in
hepatitis B virus persistence and its therapeutic implications.
Curr Opin Virol. 30:32–38. 2018. View Article : Google Scholar : PubMed/NCBI
|