Introduction
Hepatocellular carcinoma (HCC) is the major
histological subtype of primary liver cancer accounting for 85% of
all liver cancer cases worldwide, and it was reported to be the
most common liver malignancy in 2016 (1). HCC is one of the most aggressive types
of cancer with a high mortality rate, whereby 326,000 people died
of HCC in 2015 (2). There are
several definite risk factors for HCC, such as chronic hepatitis
B/C virus infection, nonalcoholic fatty liver diseases, aflatoxin
consumption and smoking (2). In
addition, there have been a number of identified prognostic markers
of HCC, such as alpha fetoprotein, vascular endothelial growth
factor and transforming growth factor β, in both large-scale
clinical trials and research projects. However, the early diagnosis
and effective treatment of HCC remains problematic (3).
To date, surgical resection remains the gold
standard treatment for HCC; however, postoperative recurrence and
metastasis is common (4). In
addition, a large number of patients with HCC are diagnosed at the
advanced stages, in which the tumor has already metastasized to
other organs prior to surgery (4).
Therefore, metastasis is a key challenge in the treatment of HCC.
Tumor metastasis is a malignant biological process involving
multiple factors and complex signaling pathways that depend not
only on the genetic changes of malignant tumor cells, but also on
the changes in the tumor microenvironment, such as the stroma,
blood vessels and infiltrating inflammatory cells (5). Dysfunction of gene expression in the
microenvironment surrounding a tumor serves an important role in
the metastatic behavior of tumor cells, such as adhesion of tumor
cells, degradation of the extracellular matrix, invasion of basal
tissues, homing ability to enter specific tissues, movement and
migration in the circulatory system and the promotion of the
angiogenesis (6). Therefore, the
identification of key genes which function in the tumor
microenvironment of HCC may be helpful to identify new targeted
therapeutic strategies for HCC metastasis.
In the present study, an original dataset (GSE5093)
was obtained from the NCBI-Gene Expression Omnibus database
(ncbi.nlm.nih.gov/geo/) containing 20
samples of noncancerous tissues surrounding HCC tissues from two
distinct groups of patients with HCC, including 9
metastasis-inclined microenvironment (MIM) samples, with detectable
metastases and 11 metastasis-averse microenvironment (MAM) samples,
without detectable metastases (7).
Differentially expressed genes (DEGs) were filtered in using the
Morpheus Website with a data processing standard. Gene-Spring
software (version 13.1.1; Agilent Technologies Inc.) was employed
to screen the DEGs, followed by Gene Ontology (GO) and Kyoto
Encyclopedia of Genes and Genomes (KEGG; kegg.jp) pathway
enrichment analysis. Furthermore, a protein-protein interaction
(PPI) network was established and three significant modules were
analyzed. A total of 35 HCC tissue samples were assessed to verify
the results of chip analysis. The present study aimed to
investigate the genetic molecular mechanisms underlying the
metastatic phenotype of HCC and improve the diagnosis and treatment
of metastases of primary hepatic carcinoma patients.
Materials and methods
Data collection
The gene expression profile GSE5093 was obtained
from Gene Expression Omnibus (GEO) (7). The GSE5093 dataset was based on the
GPL1262 dataset [National Cancer Institute (NCI)/Advanced
Technology Corner (ATC) Hs-UniGEM2, Advanced Technology Center
Microarray Facility (National Institutes of Health (NIH)/NCI/Cancer
Research Center (CCR)/ATC)] and contained 20 samples, including 9
MIM samples and 11 MAM samples.
Patients and specimens
The present study was approved by The Institutional
Review Board of the Second Affiliated Hospital of Chongqing Medical
University (Chongqing, China) and written informed consent was
provided by all patients according to The Declaration of Helsinki.
A total of 35 HCC specimens (from 21 men and 14 women; age range,
22–73 years; mean age, 53 years) were collected during resection of
HCC tumor at The Second Affiliated Hospital of Chongqing Medical
University (Chongqing, China) between May 2015 and November 2016.
Tissue samples included 16 noncancerous surrounding hepatic tissue
samples with MIM and 19 noncancerous surrounding hepatic tissue
samples with MAM (<5 cm away from HCC tissue). Specimens were
stored in liquid nitrogen for subsequent experimentation. The
clinicopathological features of the HCC specimens are listed in
Table SI.
Identification and analysis of
DEGs
MIM and MAM samples were divided into two groups and
GEO2R (ncbi.nlm.nih.gov/geo/geo2r/) was used to analyze the
DEGs between the two groups. The raw expression data files, which
included TXT files (Agilent platform), were used for analysis by
processing using the Morpheus Website (software.broadinstitute.org). A unpaired t-test
was used to identify the DEGs and |log fold change (FC)|≥1 and
P<0.05 were used as the cut-off criteria for statistical
significance.
Functional and pathway enrichment of
DEGs
After identifying the DEGs, GO enrichment and KEGG
pathway analyses were performed for gene annotation and functional
enrichment analysis using the online tool Database for Annotation,
Visualization and Integrated Discovery (DAVID; david.abcc.ncifcrf.gov/). The resulting GO terms
and KEGG pathways with P<0.05 were considered significantly
enriched for the obtained DEGs.
Survival analysis of the hub genes in
HCC
Kaplan-Meier survival analysis and the log-rank test
were employed to determine the association between hub genes and
HCC, using the Gene Expression Profiling Interactive Analysis
(GEPIA) database (8) and prognostic
data from The Cancer Genome Atlas (cancer.gov/tcga) database. The percentage of low and
high expression groups was set at 50%.
Constructing the PPI network of
DEGs
The Search Tool for the Retrieval of Interacting
Genes (STRING) database offers both experimental and predicted
interactive information (9). In the
present study, the STRING database was used to explore the
enrichment analysis results according to the biological process,
molecular function and cell components determined for the DEGs.
Finally, the interactions were selected, of which combined scores
of >0.7 were used to construct the PPI network using the
Molecular Complex Detection (MCODE) plugin within Cytoscape
software [version 3.7.2; (10,11)].
RNA preparation and reverse
transcription-quantitative (RT-q)PCR
Total RNA from tissue samples was extracted using
TRIzol® reagent (Takara Bio, Inc.), according to the
manufacturer's protocol. RNA was reverse transcribed into cDNA
using the PrimeScript RT reagent (Takara Bio, Inc.). The
temperature protocol for RT was as follows: 37°C for 5 min,
followed by 45°C for 42 min and 75°C for 5 min. qPCR was
subsequently performed using SYBR-Green Real-time PCR Master mix
(Beijing Transgen Biotech Co., Ltd.). The primer sequences used for
qPCR are listed in Table SII. The
following thermocycling conditions were used for qPCR: Initial
denaturation at 92°C for 15 min; 37 cycles of 95°C for 15 sec, 55°C
for 30 sec; and a final extension at 72°C for 30 sec. Relative mRNA
levels were measured using the 2−ΔΔCq method (12) and normalized to the internal
reference gene GAPDH.
Statistical analysis
All data are presented as the mean ± standard
deviation and analyzed using SPSS 20.0 software (IBM Corp.) and
GraphPad Prism 7 (GraphPad Software, Inc.). Differences between
groups were analyzed using paired Student's t-test and one-way
analysis of variance, followed by Newman-Keuls post hoc test.
P<0.05 was considered to indicate a statistically significant
difference.
Results
Identification of DEGs between MIM and
MAM samples
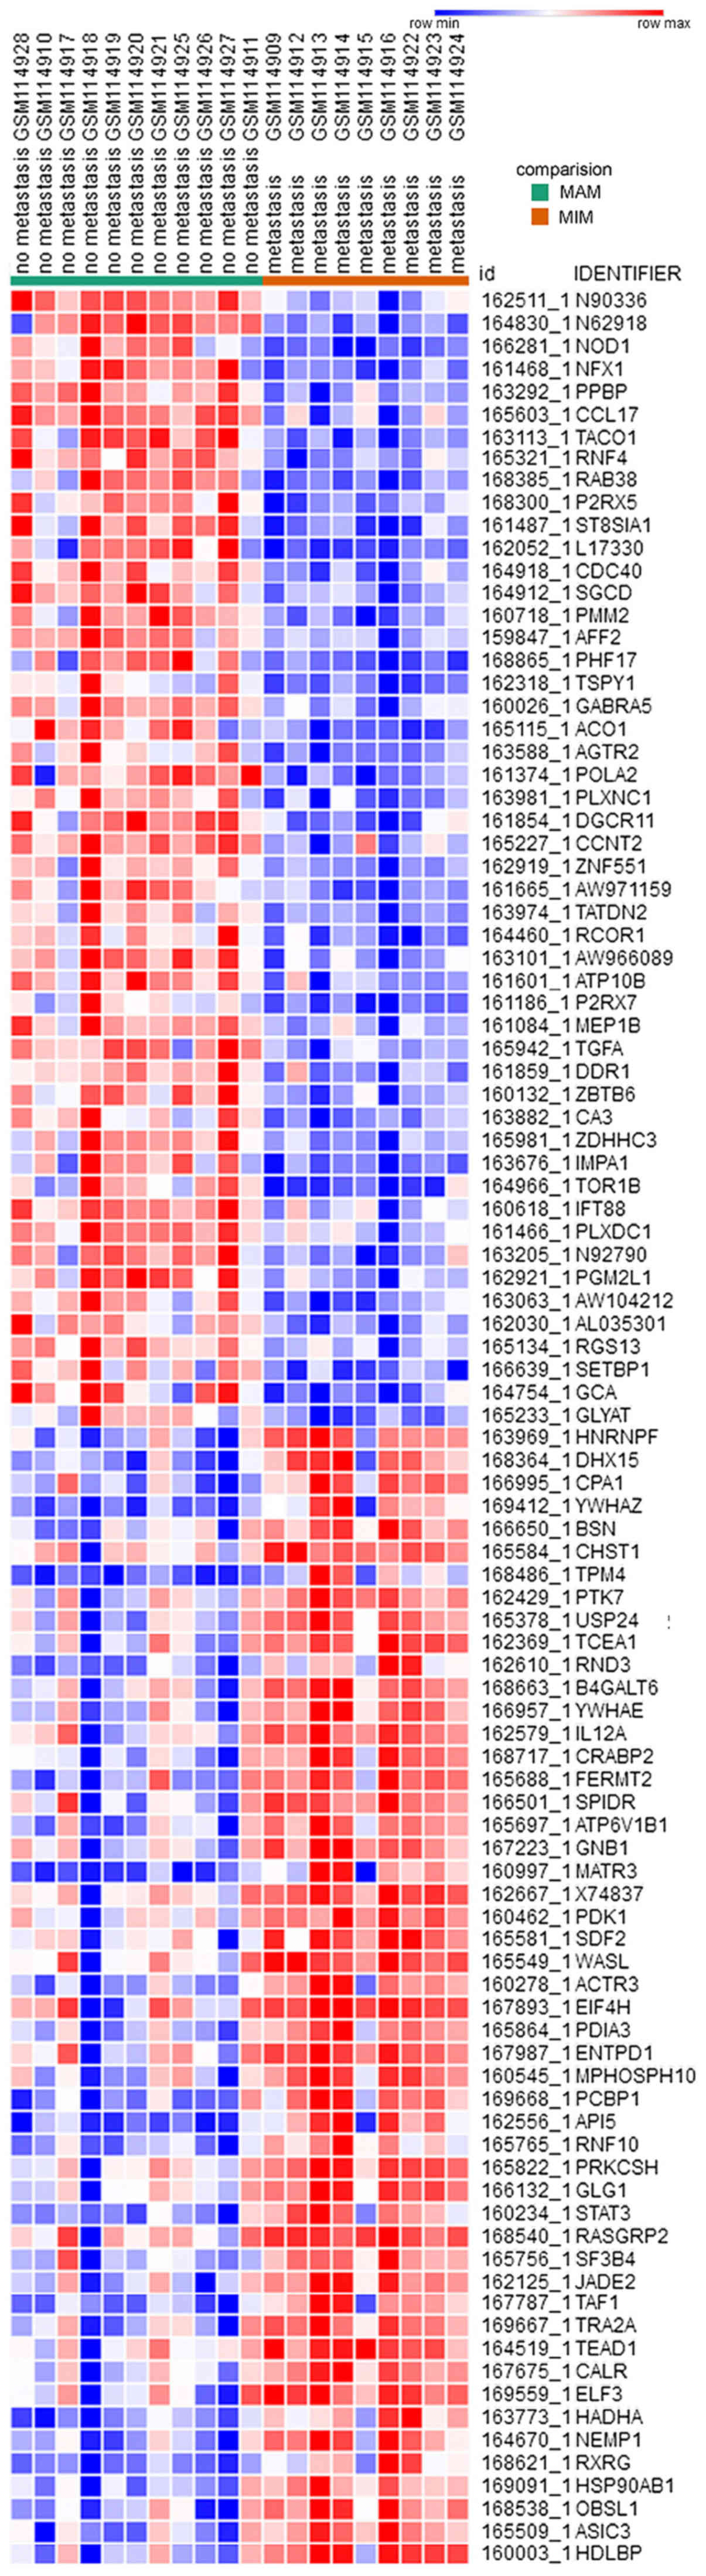
Through the analysis and processing of data in
GSE5093, a total of 1,171 DEGs were identified, which included 712
upregulated and 459 downregulated genes. The heat map of DEG
expression levels (top 50 upregulated and 50 downregulated genes)
is exhibited in (Fig. 1).
GO and pathway enrichment analyses of
DEGs
The 1,171 DEGs were selected for functional
analysis, performed using the DAVID database. GO analysis of DEGs
was carried out from three aspects, which covered molecular
function (MF), cellular component (CC) and biological process (BP).
BP analysis revealed that the upregulated DEGs were enriched in
‘cell-cell adhesion’, ‘mRNA splicing via spliceosome’ and ‘platelet
degranulation’ (Table I), whereas
the downregulated DEGs were enriched in ‘cell-cell adhesion’, ‘cell
proliferation’ and ‘positive regulation to tyrosine phosphorylation
of STAT5 protein’ (Table II). For
CC, the upregulated DEGs were enriched in the ‘extracellular
exosome and cytosol’, as well as the ‘membrane’ (Table I) and the downregulated DEGs were
enriched in ‘receptor complex’, ‘integral component of plasma
membrane’ and ‘postsynaptic density’ (Table II). In addition, the MF of
upregulated DEGs were enriched in ‘protein binding’, ‘poly(A) RNA
binding’ and ‘cadherin binding involved in cell-cell adhesion’
(Table I), whereas the downregulated
DEGs were enriched in ‘protein binding’, ‘epidermal growth factor
receptor binding’ and ‘amino acid transmembrane transfer activity’
(Table II). These results suggest
that the DEGs were associated with the biological processes of cell
migration and metastasis.
 | Table I.Gene ontology analysis of upregulated
differentially expressed genes associated with metastasis-inclined
microenvironment and metastasis-averse microenvironment. |
Table I.
Gene ontology analysis of upregulated
differentially expressed genes associated with metastasis-inclined
microenvironment and metastasis-averse microenvironment.
| Category | Term | Gene function | Gene count |
P-value |
|---|
| BP | GO:0098609 | Cell-cell
adhesion | 37 |
2.9×10⁻¹⁰ |
| BP | GO:0000398 | mRNA splicing, via
spliceosome | 28 |
3.1×10⁻⁷ |
| BP | GO:0002576 | Platelet
degranulation | 18 |
7.1×10⁻⁷ |
| BP | GO:0006457 | Protein
folding | 22 |
1.2×10⁻⁵ |
| BP | GO:0048013 | Ephrin receptor
signaling pathway | 14 |
3.8×10⁻⁵ |
| BP | GO:0043066 | Movement of cell or
subcellular component | 14 |
3.8×10⁻⁵ |
| BP | GO:0043066 | Negative regulation
of apoptotic process | 38 |
4.2×10⁻⁵ |
| BP | GO:0007165 | Signal
transduction | 75 |
5.4×10⁻⁵ |
| BP | GO:0019886 | Antigen processing
and presentation of exogenous peptide antigen via MHC class II | 14 |
7.8×10⁻⁵ |
| BP | GO:0050900 | Leukocyte
migration | 16 |
1.1×10⁻⁴ |
| CC | GO:0070062 | Extracellular
exosome | 220 |
1.1×10⁻²⁸ |
| CC | GO:0016020 | Membrane | 170 |
7.6×10⁻²¹ |
| CC | GO:0005829 | Cytosol | 218 |
1.4×10⁻¹⁸ |
| CC | GO:0005654 | Nucleoplasm | 177 |
4.2×10⁻¹³ |
| CC | GO:0005913 | Cell-cell adherens
junction | 44 |
5.2×10⁻¹³ |
| CC | GO:0031012 | Extracellular
matrix | 37 |
5.5×10⁻¹⁰ |
| CC | GO:0042470 | Melanosome | 21 |
9.2×10⁻¹⁰ |
| CC | GO:0043209 | Myelin sheath | 25 |
2.5×10⁻⁹ |
| CC | GO:0005615 | Extracellular
space | 90 |
1.1×10⁻⁷ |
| CC | GO:0030529 | Intracellular
ribonucleoprotein complex | 21 |
1.8×10⁻⁷ |
| MF | GO:0005515 | Protein
binding | 448 |
2.8×10⁻¹⁴ |
| MF | GO:0044822 | Poly(A) RNA
binding | 100 |
7.6×10⁻¹⁴ |
| MF | GO:0098641 | Cadherin binding
involved in cell-cell adhesion | 42 |
1.8×10⁻¹² |
| MF | GO:0032403 | Protein complex
binding | 23 |
2.8×10⁻⁵ |
| MF | GO:0003723 | RNA binding | 43 |
4.3×10⁻⁵ |
| MF | GO:0051287 | NAD binding | 9 |
1.1×10⁻⁴ |
| MF | GO:0051082 | Unfolded protein
binding | 15 |
1.3×10⁻⁴ |
| MF | GO:0008134 | Transcription
factor binding | 25 |
4.8×10⁻⁴ |
| MF | GO:0005524 | ATP binding | 86 |
5.9×10⁻⁴ |
| MF | GO:0019899 | Enzyme binding | 27 |
9.6×10⁻⁴ |
| Table II.Gene ontology analysis of
downregulated differentially expressed genes associated with
metastasis-inclined microenvironment and metastasis-averse
microenvironment. |
Table II.
Gene ontology analysis of
downregulated differentially expressed genes associated with
metastasis-inclined microenvironment and metastasis-averse
microenvironment.
| Category | Term | Gene function | Gene count |
P-value |
|---|
| BP | GO:0007155 | Cell adhesion | 28 | c2.8×10−5 |
| BP | GO:0008283 | Cell
proliferation | 22 | c3.0×10−4 |
| BP | GO:0042523 | Positive regulation
of tyrosine phosphorylation of Stat5 protein | 5 | c6.7×10−4 |
| BP | GO:0007165 | Signal
transduction | 47 | c9.4×10−4 |
| BP | GO:0031532 | Actin cytoskeleton
reorganization | 6 | b5.8×10−3 |
| BP | GO:0009267 | Cellular response
to starvation | 6 | b5.8×10−3 |
| BP | GO:0060749 | Mammary gland
alveolus development | 4 | b7.8×10−3 |
| BP | GO:0007169 | Transmembrane
receptor protein tyrosine kinase signaling pathway | 8 | b9.5×10−3 |
| BP | GO:0006865 | Amino acid
transport | 5 | b1.0×10−2 |
| BP | GO:0045944 | Positive regulation
of transcription from RNA polymerase II promoter | 37 | a1.1×10−2 |
| CC | GO:0043235 | Receptor
complex | 90 | c1.9×10−4 |
| CC | GO:0005887 | Integral component
of plasma membrane | 47 | c4.1×10−4 |
| CC | GO:0014069 | Postsynaptic
density | 78 | b1.3×10−3 |
| CC | GO:0045211 | Postsynaptic
membrane | 64 | b1.4×10−3 |
| CC | GO:0005829 | Cytosol | 52 | b2.1×10−3 |
| CC | GO:0005886 | Plasma
membrane | 52 | b3.6×10−3 |
| CC | GO:0009986 | Cell surface | 52 | b4.5×10−3 |
| CC | GO:0030054 | Cell junction | 15 | b5.8×10−3 |
| CC | GO:0005794 | GOlgi
apparatus | 8 | b6.7×10−3 |
| CC | GO:0005737 | Cytoplasm | 8 | b7.5×10−3 |
| MF | GO:0005515 | Protein
binding | 258 | c1.5×10−5 |
| MF | GO:0005154 | Epidermal growth
factor receptor binding | 6 | c8.6×10−4 |
| MF | GO:0015171 | Amino acid
transmembrane transporter activity | 7 | c8.6×10−4 |
| MF | GO:0005524 | ATP binding | 56 | c9.5×10−4 |
| MF | GO:0042803 | Protein
homodimerization activity | 32 | b1.5×10−3 |
| MF | GO:0004714 | Transmembrane
receptor protein tyrosine kinase activity | 6 | b2.1×10−3 |
| MF | GO:0008179 | Adenylate cyclase
binding | 3 | a1.9×10−2 |
| MF | GO:0001078 | Transcriptional
repressor activity, RNA polymerase II core promoter proximal region
sequence-specific binding | 8 | a1.9×10−2 |
| MF | GO:0005096 | Gtpase activator
activity | 14 | a2.0×10−2 |
| MF | GO:0043236 | Laminin binding
promoter | 4 | a2.2×10−2 |
KEGG pathway analysis of MIM and MAM
DEGs
To further analysis the functions of DEGs, KEGG
pathway analysis was conducted to determine the most significantly
enriched pathways of the upregulated DEGs and downregulated DEGs.
The upregulated DEGs were enriched in ‘protein processing in the
endoplasmic reticulum’, ‘antigen processing and presentation’ and
‘phagosome’ pathways (Table III).
The downregulated DEGs were enriched in the ‘arrhythmogenic right
ventricular cardiomyopathy’, ‘phosphatidylinositol signaling
system’ and ‘inositol phosphate metabolism’ pathways (Table III).
| Table III.Kyoto Encyclopedia of Genes and
Genomes pathway analysis of DEGs associated with
metastasis-inclined microenvironment and metastasis-averse
microenvironment. |
Table III.
Kyoto Encyclopedia of Genes and
Genomes pathway analysis of DEGs associated with
metastasis-inclined microenvironment and metastasis-averse
microenvironment.
| A, Upregulated
DEGs |
|---|
|
|---|
| Pathway | Name | Gene count | P-value | Genes |
|---|
| hsa04141 | Protein processing
in endoplasmic reticulum | 26 | c7.50×10−6 | HSP90AB1, SEC31A,
GANAB, PDIA3, PDIA4, PRKCSH, CALR, SEC62, DERL3, CANX, SSR1, OS9,
HSPH1,xBP1, RPN1, DNAJA1, HSPA6, HSPA5, HSPA8, SEC23A, P4HB,
BCAP31, CAPN1, SEC23B, SEL1L, UBE2E1 |
| hsa04612 | Antigen processing
and presentation | 15 | c7.23×10−5 | HSP90AB1, CIITA,
PDIA3, CD8B, LGMN, CTSS, CALR, CANX, TAPBP, HSPA6, HLA-DRB5, CTSB,
HLA-DPB1, HSPA8, HLA-DRA |
| hsa04145 | Phagosome | 22 | c9.24×10−5 | ACTB, C3, ATP6AP1,
CTSS, CALR, ATP6V1B1, ITGB1, CANX, ITGAM, ACTG1, ATP6V1A, LAMP2,
HLA-DRB5, MPO, VAMP3, HLA-DPB1, THBS1, FCGR3A, DYNC1H1, THBS2,
CD14, HLA-DRA |
| hsa03040 | Spliceosome | 20 | c1.51×10−4 | SRSF1, TRA2A,
PRPF3, DDX5, SF3A1, SF3B4, RBMX, HNRNPA1, HNRNPU, SRSF4, HNRNPK,
PLRG1, DHX38, PCBP1, USP39, HSPA6, DHX15, ACIN1, HSPA8, THOC1 |
| hsa04918 | Thyroid hormone
synthesis | 13 | c4.73×10−4 | TG, GPX2, ADCY7,
GNAQ, ATP1B2, PAX8, TPO, CREB3L1, PRKCG, PRKACB, HSPA5, PDIA4,
CANX |
| hsa04610 | Complement and
coagulation cascades | 12 | b1.50×10−3 | KNG1, C8B, C7, A2M,
FGA, C3, CFB, CD46, C6, SERPING1, C1S, C2 |
| hsa04520 | Adherens
junction | 12 | b1.91×10−3 | ACTB, ACTG1, PTPN6,
TGFBR2, CTNND1, CDH1, SMAD2, PTPN1, WASL, TCF7L2, IQGAP1, VCL |
| hsa05142 | Chagas disease
(American trypanosomiasis) | 15 | b1.98×10−3 | CFLAR, GNAI3,
GNAI2, C3, RELA, TGFBR2, MAP2K4, NFKB1, SMAD2, CALR, GNAQ, PPP2CB,
IL12A, PPP2R2B, PPP2R2A |
| hsa05110 | Vibrio cholerae
infection | 10 | b2.23×10−3 | ACTB, ACTG1,
ATP6V1A, KDELR2, ATP6AP1, PRKCG, PRKACB, PDIA4, ATP6V1B1, TJP2 |
| hsa05146 | Amoebiasis | 15 | b2.37×10−3 | IL1R1, RELA, PRKCG,
NFKB1, ITGAM, VCL, ARG1, C8B, SERPINB9, GNAQ, IL12A, PRKACB,
COL1A1, CD14, FN1 |
|
| B, Downregulated
DEGs |
|
| hsa05412 | Arrhythmogenic
right ventricular cardiomyopathy | 8 | b2.35×10−3 | ITGA8, SGCD, DSC2,
GJA1, ITGA2, CACNB4, ITGA4, CACNA1C (ARVC) |
| hsa04070 |
Phosphatidylinositol signaling system | 9 | b5.51×10−3 | PIK3CG, MTM1, DGKB,
PIK3C2G, IMPA1, PIP5K1B, ITPKB, PTEN, ITPR2 |
| hsa00562 | Inositol phosphate
metabolism | 7 | a1.33×10−2 | PIK3CG, MTM1,
PIK3C2G, IMPA1, PIP5K1B, ITPKB, PTEN |
| hsa04020 | Calcium signaling
pathway | 11 | a2.61×10−2 | P2RX7, SLC8A1,
CCKBR, ERBB4, PHKB, GRPR, ITPKB, PPP3CA, PTGFR, CACNA1C, ITPR2 |
| hsa05202 | Transcriptional
misregulation in cancer | 10 | a4.13×10−2 | MAF, CCNT2, CSF2,
HHEX, LMO2, FLT3, GZMB, SMAD1, JMJD1C, HMGA2 |
| hsa04151 | PI3K-Akt signaling
pathway | 16 | a5.39×10−2 | PHLPP1, PIK3CG,
COL4A3, PPP2R5A, TCL1A, ITGA2, FGF13, ITGA4, KIT, PTEN, COL5A2,
PRLR, ITGA8, PDGFD, GHR, IL2 |
| hsa05410 | Hypertrophic
cardiomyopathy (HCM) | 6 | a6.39×10−2 | ITGA8, SGCD, ITGA2,
CACNB4, ITGA4, CACNA1C |
| hsa04810 | Regulation of actin
cytoskeleton | 11 | a6.54×10−2 | PIK3CG, DOCK1,
ARHGEF7, DIAPH2, ITGA8, PIP5K1B, ITGA2, IQGAP2, FGF13, PDGFD,
ITGA4 |
| hsa04080 | Neuroactive
ligand-receptor interaction | 13 | a8.12×10−2 | CCKBR, NPY2R,
GABRA5, PTGFR, P2RX7, AGTR2, P2RY10, PRLR, GRPR, CHRNA5, CHRNB3,
TSHR, GHR |
| hsa05414 | Dilated
cardiomyopathy | 6 | a8.21×10−2 | ITGA8, SGCD, ITGA2,
CACNB4, ITGA4, CACNA1C |
Analysis of the PPI network with DEGs
in MIM and MAM
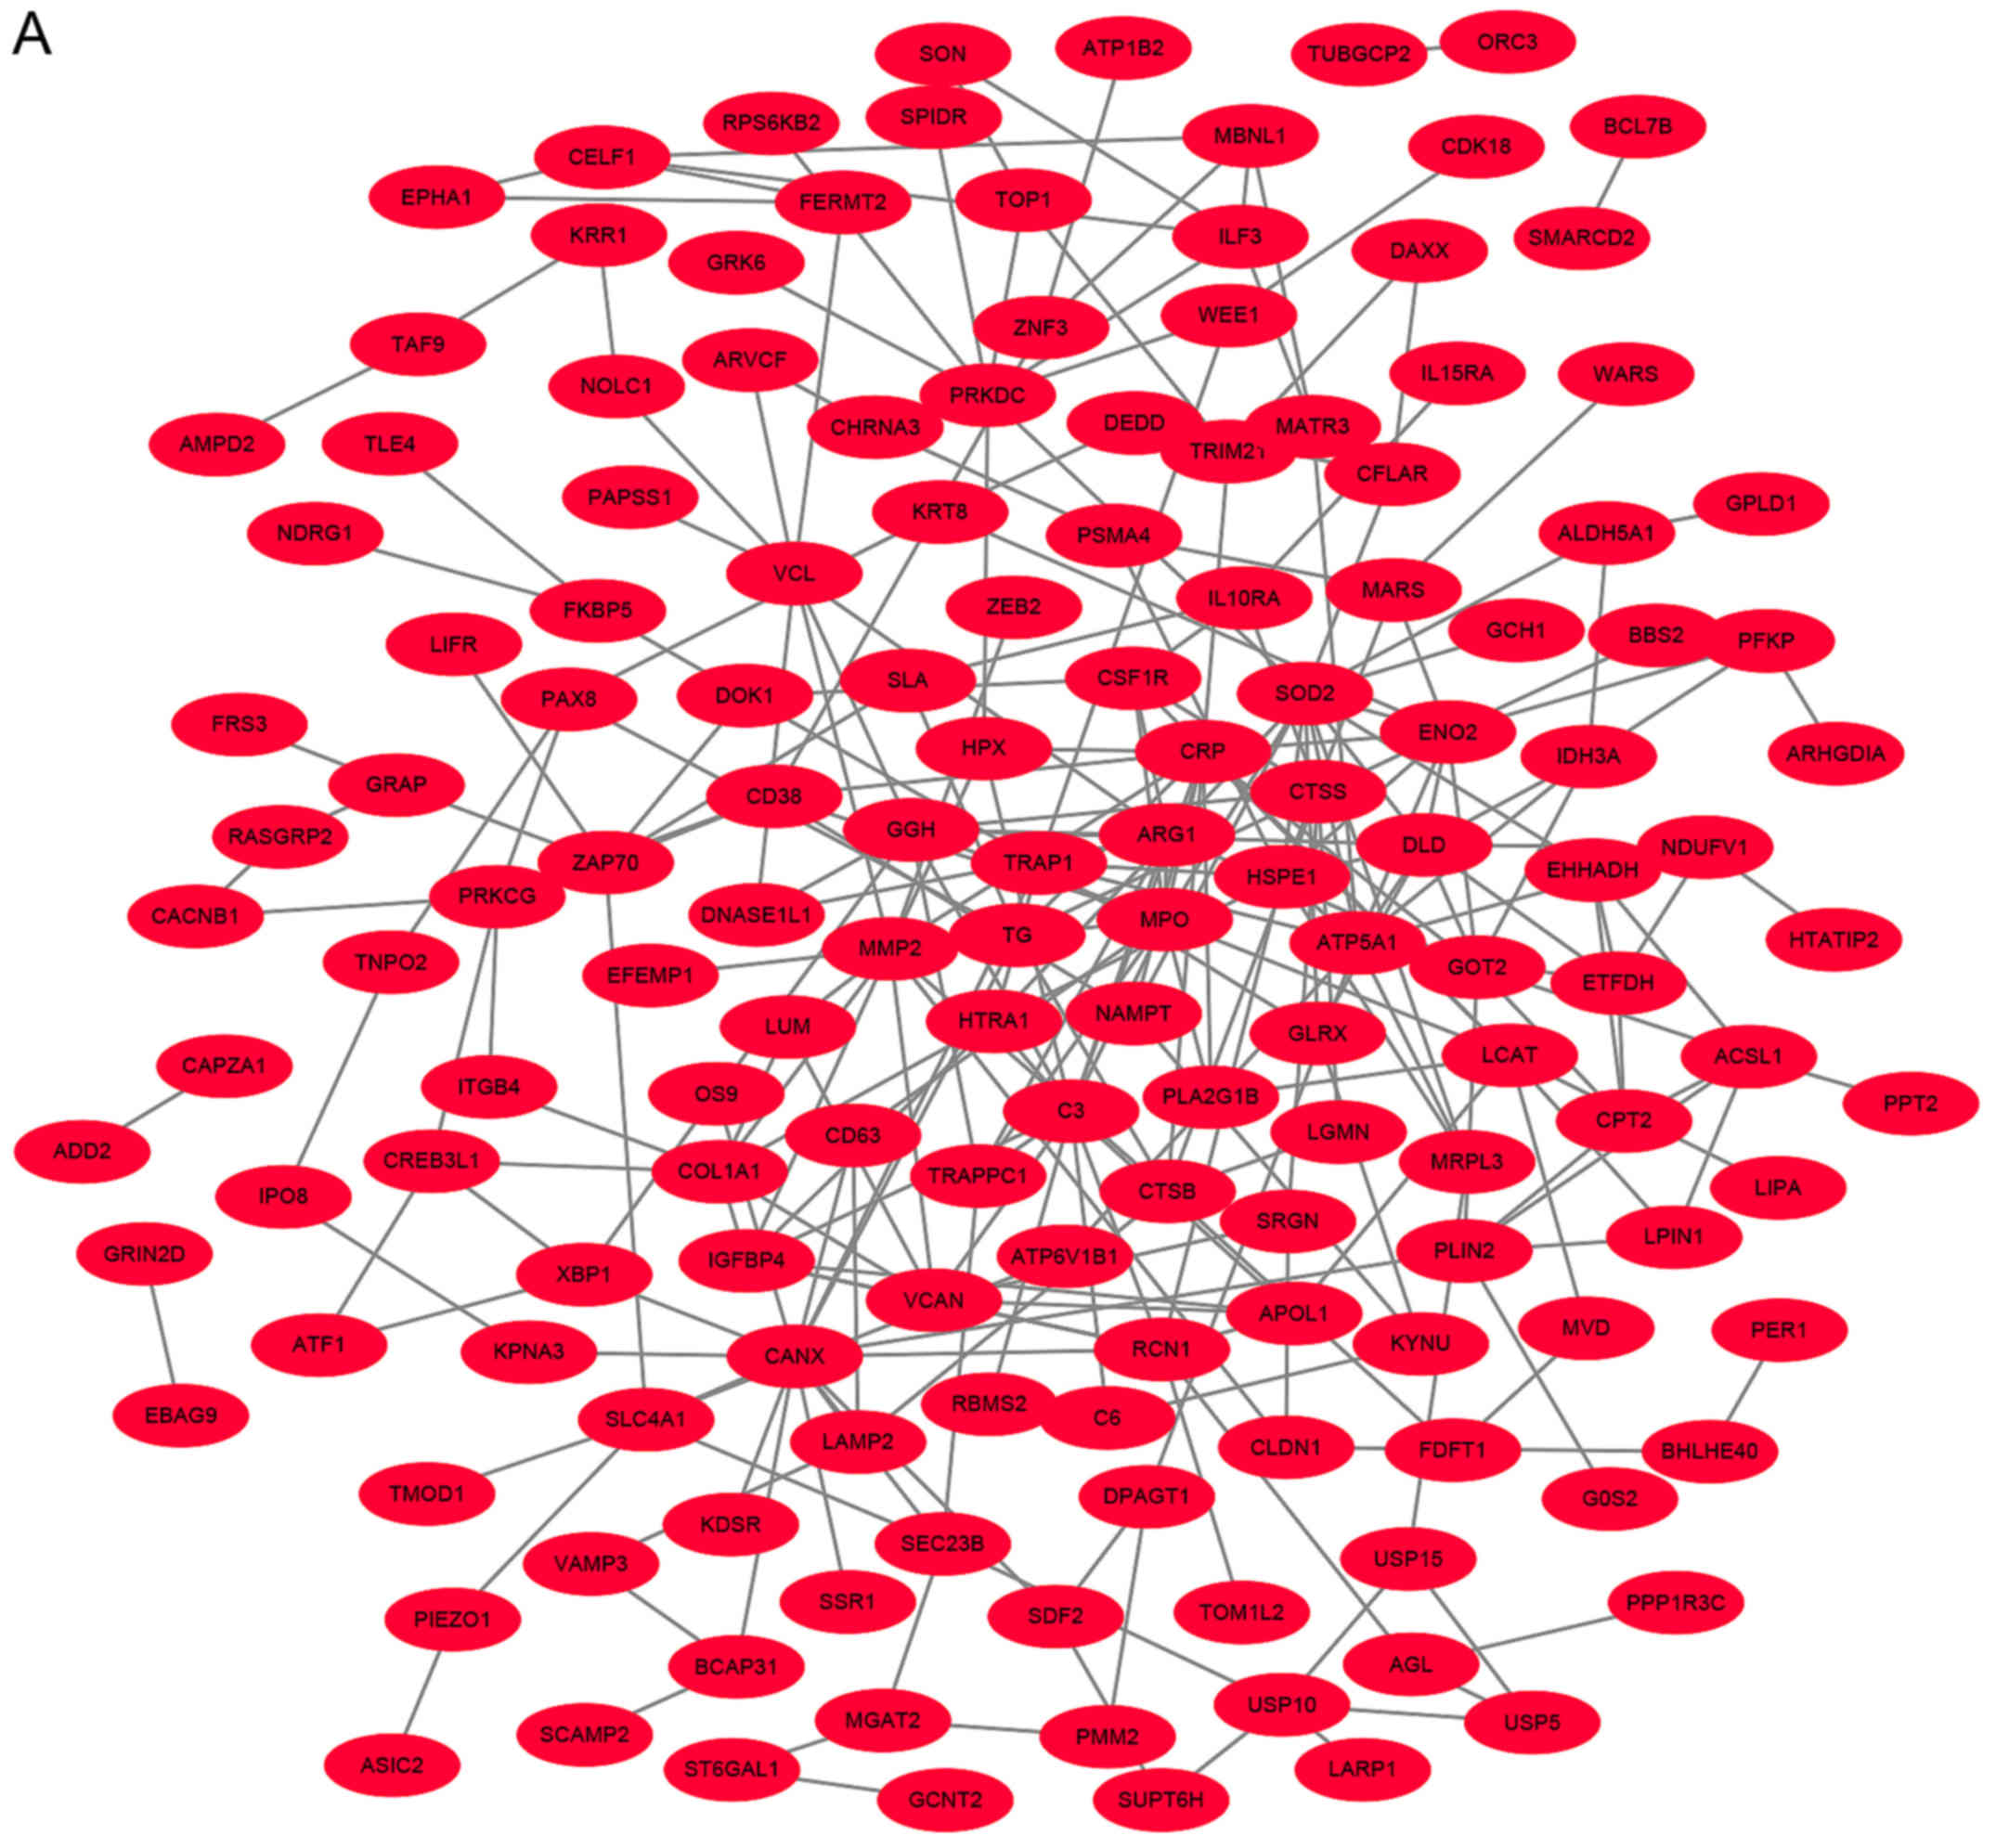
According to the information provided by the STRING,
the interaction of the DEGs and acquired hub genes of potential
diagnosis and treatment associated DEGs were analyzed. As depicted
in Figs. 2A and S1, there were 955 nodes and 7,589 edges,
of which 638 nodes represented upregulated DEGs and nodes
represented downregulated DEGs (Fig.
2B). The top 10 hub genes with the highest degrees included:
Heat shock protein family A member 8 (HSPA8); PH domain and leucine
rich repeat protein phosphatase 1 (PHLPP1);
phosphoribosylglycinamide formyltransferase (GART);
carbamoyl-phosphate synthetase 2 (CAD); actin beta (ACTB); cadherin
1 (CDH1); phosphatidylinositol-4,5-bisphosphate 3-kinase catalytic
subunit γ (PIK3CG); nuclear factor κB subunit 1 (NFκB1); signal
transducer and activator of transcription 3 (STAT3); and heat shock
protein family A (Hsp70) member 5 (HSPA5). Then, the expression of
the top 10 hub genes were verified using RT-qPCR. There were 4 hub
upregulated genes and 6 downregulated genes in MAM, compared with
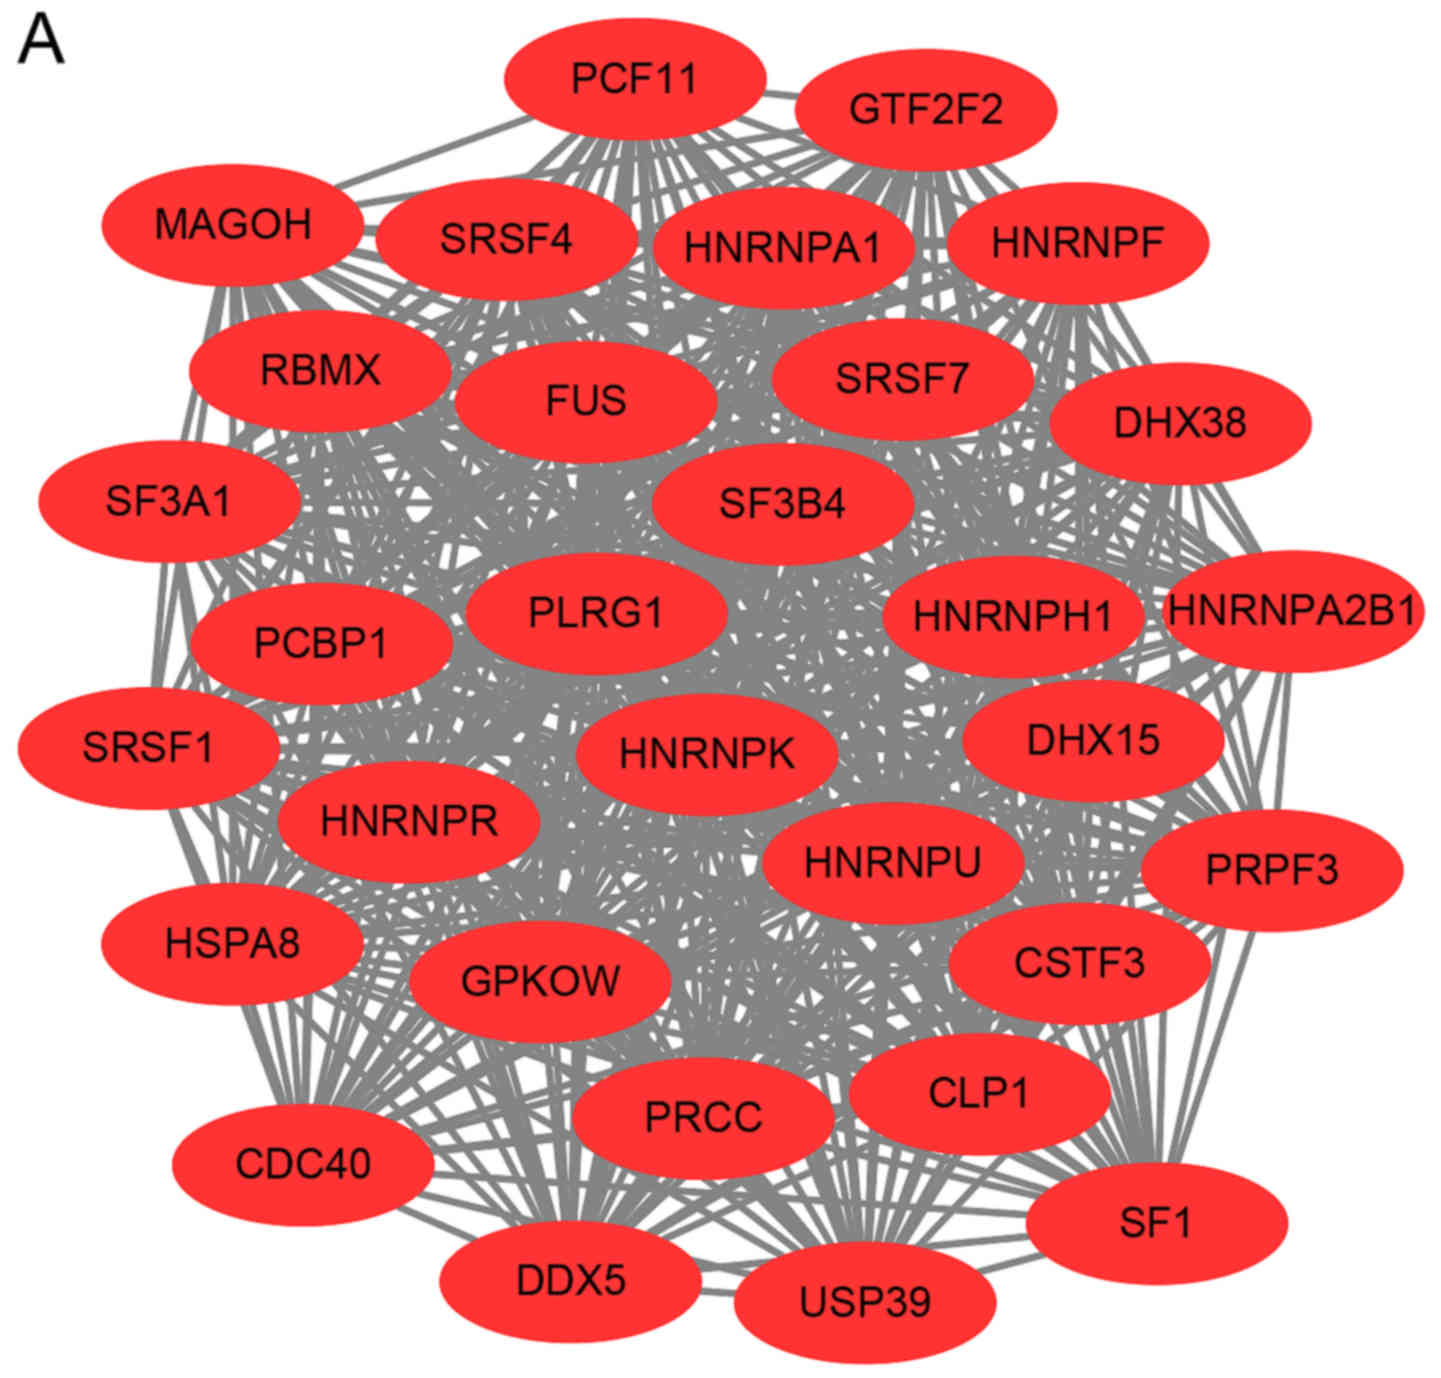
MIM samples (Fig. 3). Moreover, the
top 3 significant modules were selected from the DEG PPI network
using MCODE (Fig. 4A-C). Module 1
included 31 nodes and 458 edges, module 2 included 37 nodes and 267
edges and module 3 included 45 nodes. Furthermore, GO and KEGG
pathway analysis results were used to analyze the functional and
signal pathway enrichment of the three modules. The results showed
that module 1 was primarily associated with ‘RNA splicing’,
‘catalytic step 2 spliceosome’, ‘nucleotide binding’ and
‘spliceosome’ pathways (Table IV).
Module 2 was primarily enriched in ‘protein modification by small
protein conjugation’, ‘catalytic complex’, ‘ubiquitin-protein
transferase activity’ and ‘chemokine signaling’ pathways (Table V). Module 3 was most enriched in
‘protein folding’, ‘extracellular exosomes’, ‘protein disulfide
isomerase activity’ and ‘chemokine signaling’ pathways (Table VI). These results indicated that the
10 hub genes may function in the biological behavior processes of
cell migration and metastasis.
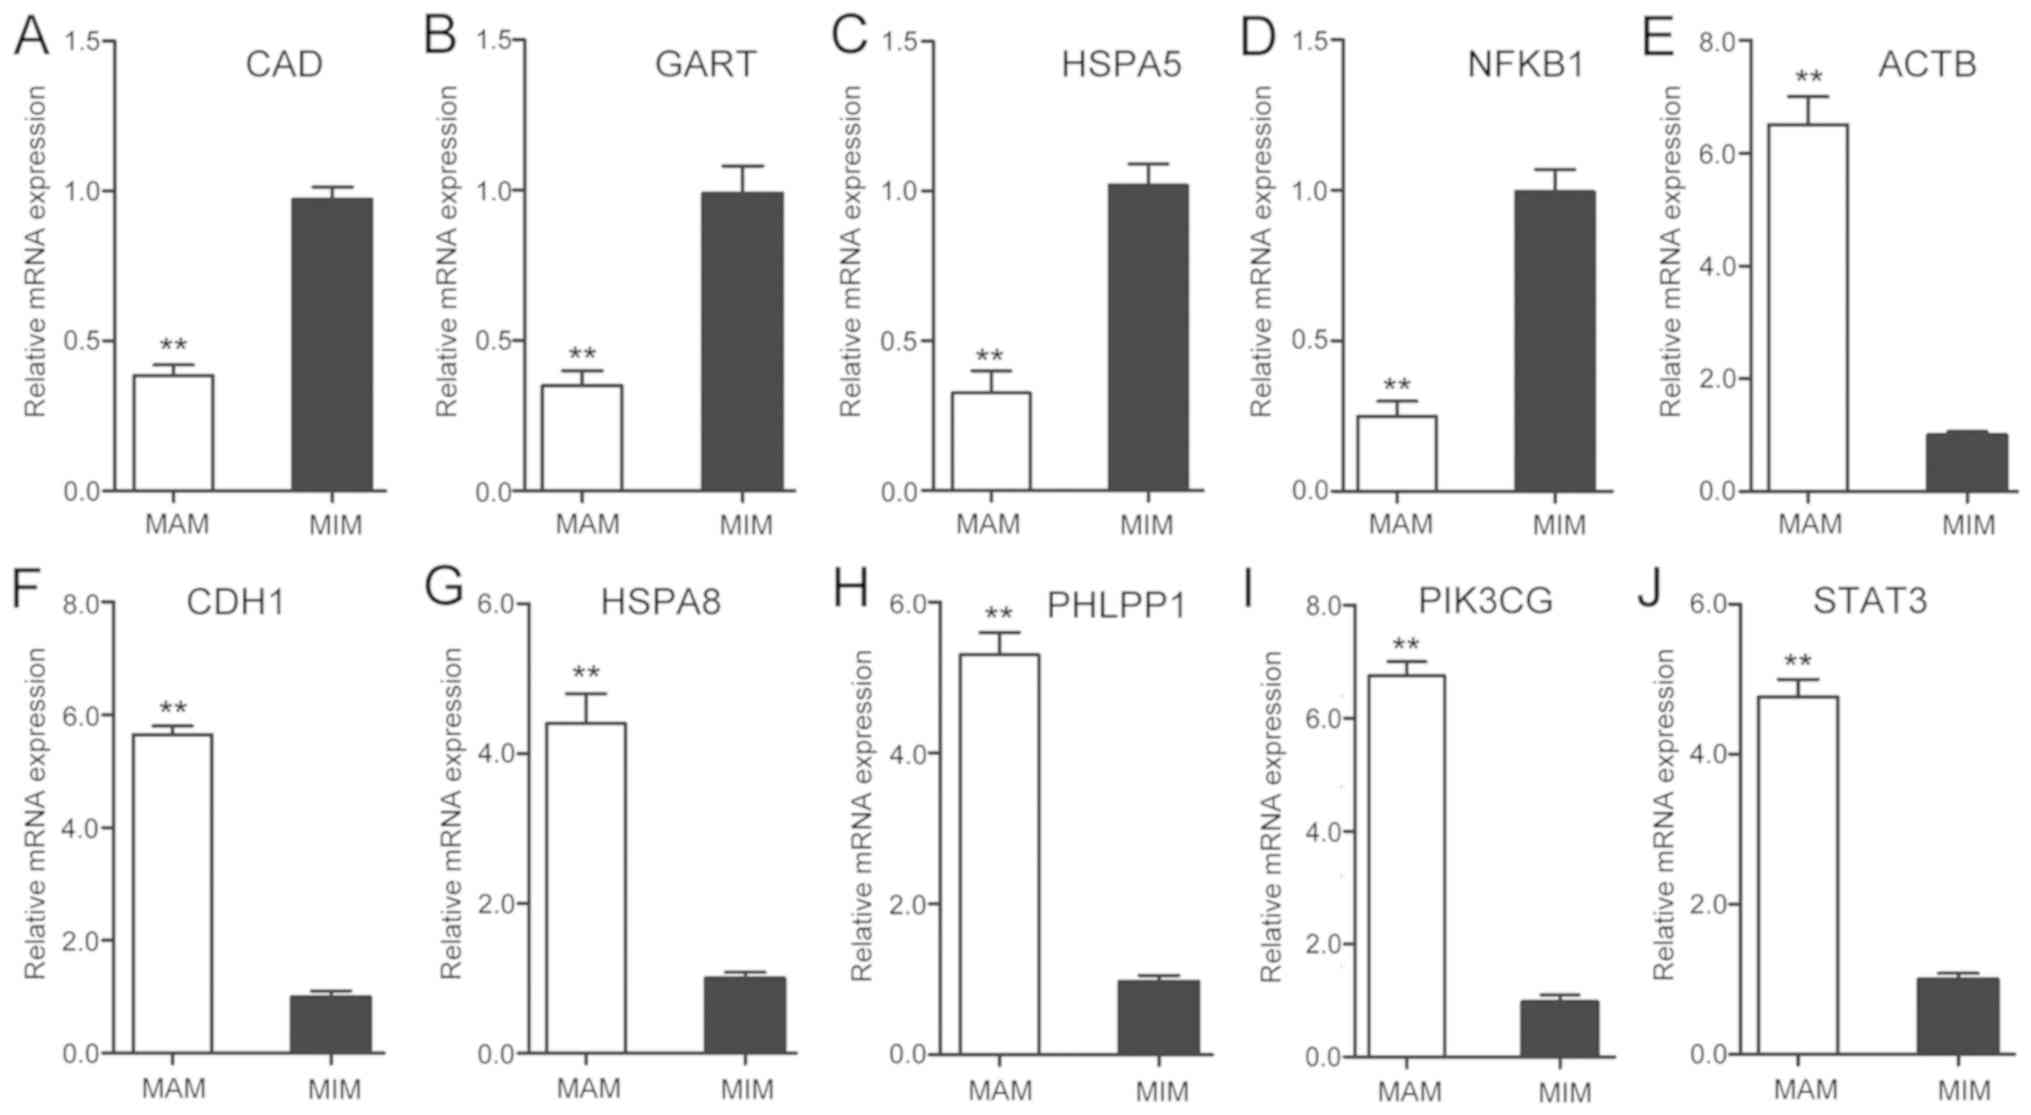 | Figure 3.Top 10 hub genes were detected by
reverse transcription-quantitative PCR. Expression of (A) CAD, (B)
GART, (C) HSPA5, (D) NFKB1, (E) ACTB, (F) CDH1, (G) HSPA8, (H)
PHLPP1, (I) PIK3GC and (J) STAT3 The data are presented as the mean
± standard deviation of 3 independent experiments. **P<0.01 MAM
vs. MIM. CAD, carbamoyl-phosphate synthetase 2; GART,
phosphoribosylglycinamide formyltransferase; HSPA5, heat shock
protein family A member 5; NFκB1, nuclear factor κB subunit 1;
ACTB, actin beta; CDH1, Cadherin 1; HSPA8, heat shock protein
family A member 8; PHLPP1, PH domain and leucine rich repeat
protein phosphatase 1; PIK3CG,
phosphatidylinositol-4,5-bisphosphate 3-kinase catalytic subunit γ;
STAT3, signal transducer and activator of transcription 3. |
| Table IV.Functional and pathway enrichment
analysis of the genes in module 1. |
Table IV.
Functional and pathway enrichment
analysis of the genes in module 1.
| Category | Term | Gene function | Gene count |
P-value |
|---|
| BP | GO:0008380 | RNA splicing | 6 | c2.27×10−9 |
| BP | GO: 0000398 | mRNA splicing, via
spliceosome | 6 | c8.01×10−7 |
| BP | GO:0006397 | mRNA
processing | 5 | c2.06×10−6 |
| BP | GO:0048025 | Negative regulation
of mRNA splicing, via spliceosome | 4 | c3.81×10−6 |
| BP | GO:0000381 | Regulation of
alternative mRNA splicing, via spliceosome | 4 | c4.06×10−5 |
| CC | GO:0071013 | Catalytic step 2
spliceosome | 3 | c6.60×10−19 |
| CC | GO:0005681 | Spliceosomal
complex | 2 | c1.58×10−10 |
| CC | GO:0030529 | Intracellular
ribonucleoprotein complex | 2 | c8.66×10−9 |
| CC | GO:0019013 | Viral
nucleocapsid | 2 | c7.85×10−8 |
| CC | GO:0005654 | Nucleoplasm | 12 | c8.50×10−6 |
| MF | GO:0000166 | Nucleotide
binding | 7 | c3.01×10−10 |
| MF | GO:0044822 | Poly(A) RNA
binding | 7 | c1.66×10−9 |
| MF | GO:0003723 | RNA binding | 6 | c1.95×10−5 |
| MF | GO:0003729 | mRNA binding | 12 | c4.65×10−5 |
| MF | GO:0003676 | Nucleic acid
binding | 7 | c8.67×10−4 |
| KEGG_PATHWAY | has:03040 | Spliceosome | 20 | c1.54×10−28 |
| KEGG_PATHWAY | has: 03015 | mRNA surveillance
pathway | 4 | b4.32×10−3 |
| KEGG_PATHWAY | has: 05168 | Herpes simplex
infection | 4 | a3.18×10−2 |
| Table V.Functional and pathway enrichment
analysis of the genes in module 2. |
Table V.
Functional and pathway enrichment
analysis of the genes in module 2.
| Category | Term | Gene function | Gene count |
P-value |
|---|
| BP | GO:0032446 | Protein
modification by small protein conjugation | 12 | b6.57×10−9 |
| BP | GO:0070647 | Protein
modification by small protein conjugation or removal | 12 | b5.38×10−8 |
| BP | GO:0007186 | G-protein coupled
receptor signaling pathway | 11 | b2.93×10−7 |
| BP | GO:0016567 | Protein
ubiquitination | 10 | b5.90×10−7 |
| BP | GO:0007193 | Adenylate
cyclase-inhibiting G-protein coupled receptor signaling
pathway | 5 | b6.02×10−6 |
| CC | GO:1902494 | Catalytic
complex | 11 | b9.45×10−6 |
| CC | GO:0000151 | Ubiquitin ligase
complex | 7 | b1.07×10−5 |
| CC | GO:0098552 | Side of
membrane | 5 | b2.94×10−4 |
| CC | GO:1990234 | Transferase
complex | 6 | b3.96×10−4 |
| CC | GO:0000152 | Nuclear ubiquitin
ligase complex | 3 | a1.53×10−3 |
| MF | GO:0004842 | Ubiquitin-protein
transferase activity | 8 | b3.79×10−6 |
| MF | GO:0001664 | G-protein coupled
receptor binding | 6 | b4.47×10−6 |
| MF | GO:0019787 | Ubiquitin-like
protein transferase activity | 8 | b5.20×10−6 |
| MF | GO:0008528 | G-protein coupled
peptide receptor activity | 5 | b1.42×10−4 |
| MF | GO:0001653 | Peptide receptor
activity | 5 | b1.52×10−4 |
| KEGG_PATHWAY | has: 04062 | Chemokine signaling
pathway | 11 | b4.43×10−10 |
| KEGG_PATHWAY | has: 04120 | Ubiquitin mediated
proteolysis | 6 | b1.26×10−4 |
| KEGG_PATHWAY | has: 04914 |
Progesterone-mediated oocyte
maturation | 5 | b2.19×10−4 |
| Table VI.Functional and pathway enrichment
analysis of the genes in module 3. |
Table VI.
Functional and pathway enrichment
analysis of the genes in module 3.
| Category | Term | Gene function | Gene count |
P-value |
|---|
| BP | GO:0006457 | Protein
folding | 8 | b1.45×10−7 |
| BP | GO:0045454 | Cell redox
homeostasis | 5 | b3.19×10−5 |
| BP | GO:0044710 | Single-organism
metabolic process | 19 | b4.36×10−5 |
| BP | GO:0006091 | Generation of
precursor metabolites and energy | 6 | b3.46×10−4 |
| BP | GO:0090066 | Regulation of
anatomical structure size | 7 | b3.49×10−4 |
| CC | GO:0070062 | Extracellular
exosome | 23 | b1.72×10−8 |
| CC | GO:0072562 | Blood
microparticle | 5 | b7.56×10−5 |
| CC | GO:0005577 | Fibrinogen
complex | 3 | b1.64×10−4 |
| CC | GO:0043209 | Myelin sheath | 5 | b5.65×10−4 |
| CC | GO:0005829 | Cytosol | 9 | a2.90×10−3 |
| MF | GO:0003756 | Protein disulfide
isomerase activity | 3 | a1.07×10−3 |
| MF | GO:0005524 | ATP binding | 11 | a1.31×10−3 |
| MF | GO:0004070 | Aspartate
carbamoyltransferase activity | 2 | a5.77×10−3 |
| MF | GO:0004088 |
Carbamoyl-phosphatesynthase
(glutamine-hydrolyzing) activity | 2 | a5.77×10−3 |
| MF | GO:0004087 | Carbon
metabolism | 2 | a5.77×10−3 |
| KEGG_PATHWAY | has: 01200 | Chemokine signaling
pathway | 5 | a1.23×10−3 |
| KEGG_PATHWAY | has: 04144 | Endocytosis | 6 | a2.89×10−3 |
| KEGG_PATHWAY | has: 05100 | Bacterial invasion
of epithelial cells | 4 | a4.33×10−3 |
The Kaplan-Meier plot of hub genes in
MIM and MAM
Through GEPIA prediction of the association between
the 10 hub genes and HCC patient prognosis, it was observed that
expression of CAD [Hazard Ratio (HR), 1.9; P<0.001], GART (HR,
1.8; P=0.018), HSPA5 (HR, 1.5; P=0.016), ACTB (HR, 1.6; P=0.0074),
CDH1 (HR, 0.66; P=0.018) and HSPA8 (HR, 1.6; P=0.011) were
associated with poor overall survival in patients with HCC
(Fig. 5).
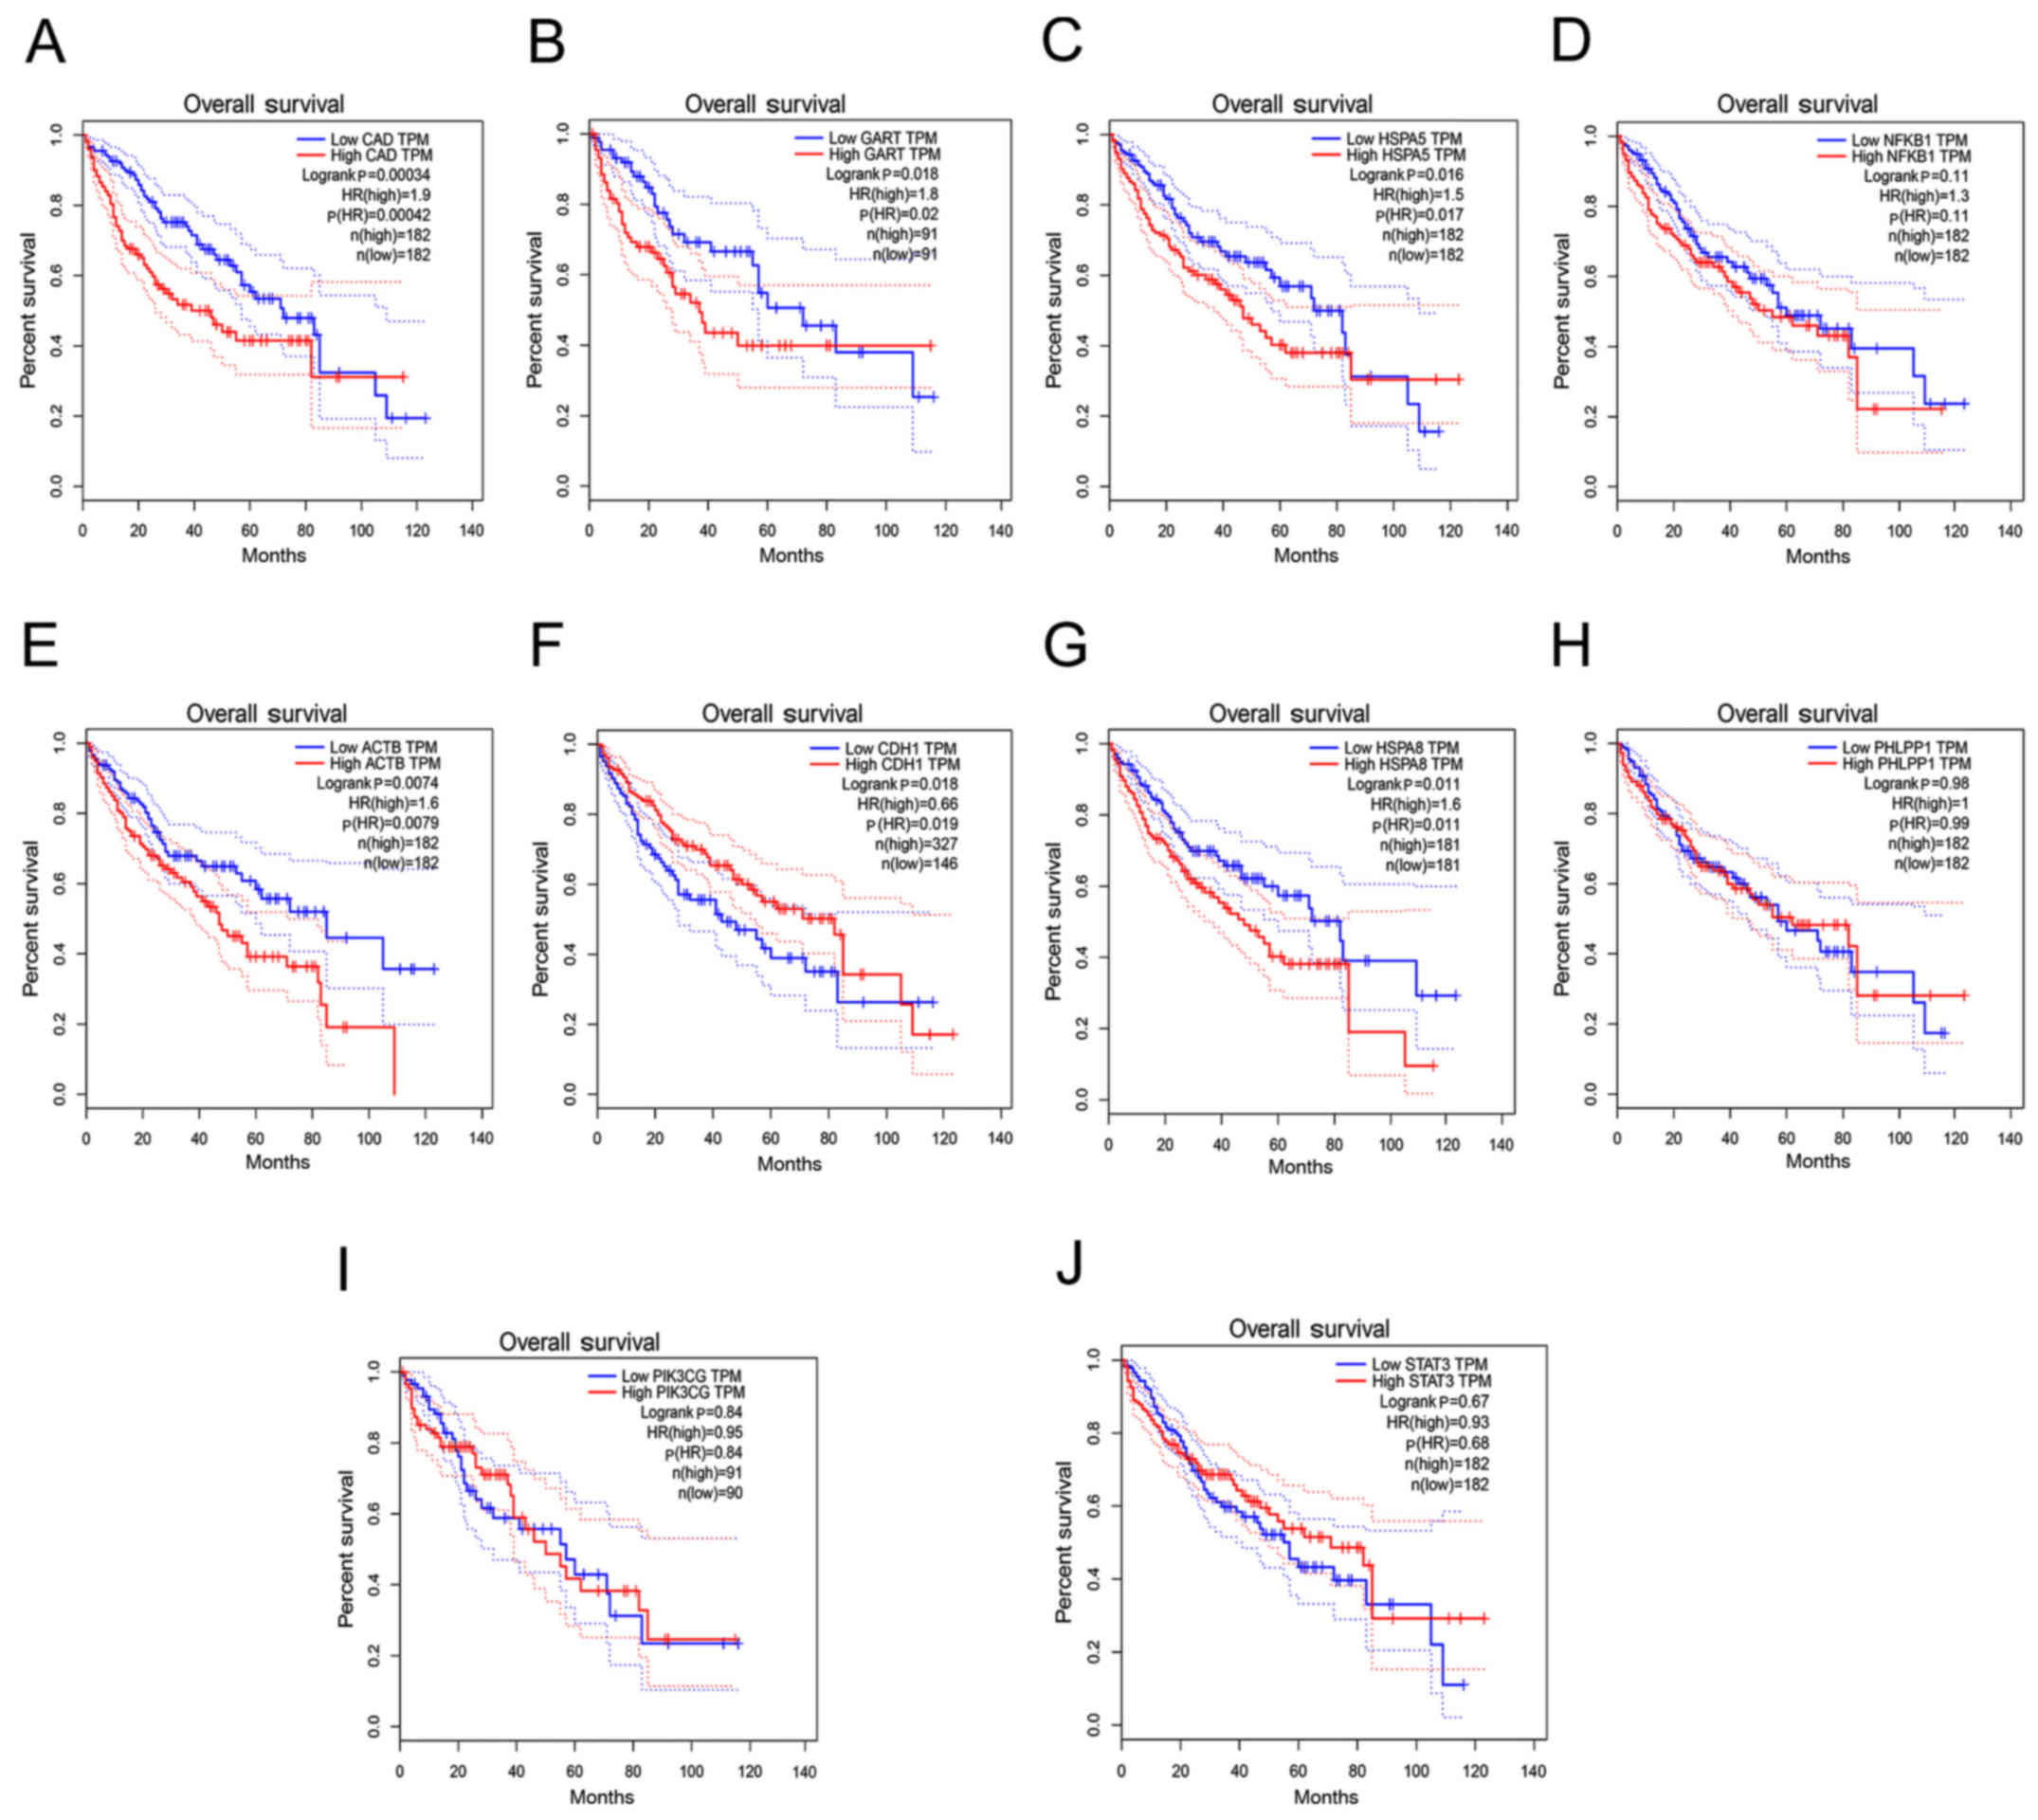 | Figure 5.Prognostic value of hub genes in
patients with HCC. Kaplan-Meier analysis of OS time un patients
with HCC with high and low expression levels of: (A) CAD, (B) GART,
(C) HSPA5, (D) NFκB1, (E) ACTB, (F) CDH1, (G) HSPA8, (H) PHLPP1,
(I) PIK3CG and (J) STAT3. The red dotted line above the red curve
and the red dotted line below represent the high (50%) and low
cutoff (50%) on the survival curve. The blue dotted line above the
blue curve and the blue dotted line below represent high (50%) and
low cutoff (50%) on the survival curve. HCC, hepatocellular
carcinoma; OS, overall survival; CAD, carbamoyl-phosphate
synthetase 2; GART, phosphoribosylglycinamide formyltransferase;
HSPA5, heat shock protein family A member 5; NFκB1, nuclear factor
κB subunit 1; ACTB, actin beta; CDH1, cadherin 1; HSPA8, heat shock
protein family A member 8; PHLPP1, PH domain and leucine rich
repeat protein phosphatase 1; PIK3CG,
phosphatidylinositol-4,5-bisphosphate 3-kinase catalytic subunit γ;
STAT3, signal transducer and activator of transcription 3; HR,
hazard ratio; TPM, transcripts per million. |
Discussion
HCC is the most common malignant tumor with high
morbidity and mortality, and was reported to be one of the major
causes of cancer-associated mortalities worldwide, in 2002
(13). Patients with HCC are often
diagnosed with extrahepatic metastasis, which poses a great
challenge to the diagnosis and treatment of HCC (14). Currently, high-throughput gene chip
technology can be used to explore the occurrence and development of
diseases from the whole genome or transcriptome level, which has
been widely used in gene expression analysis and biomarker
discovery for a variety of illnesses (14). In order to further understand the
molecular mechanisms underlying the recurrence and metastasis of
HCC, the GSE5093 Biochip dataset on the metastatic microenvironment
of HCC was obtained from the GEO database. This was used to perform
a systematic and bioinformatics analysis, including enrichment
analysis of differences in gene expression and protein-protein
interaction.
In the present study, a total of 1,171 DEGs were
identified, of which 712 were upregulated and 459 were
downregulated. GO term functional analysis demonstrated that the
upregulated genes were primarily involved in ‘cell-cell adhesion’,
‘extracellular exosome’ and ‘cadherin binding’, while downregulated
DEGs were involved in ‘cell-cell adhesion’, ‘integral component of
plasma membrane’ and ‘epidermal growth factor receptor binding’.
The tumor cells leave the primary site, invade the extracellular
matrix, adhere to macromolecular protein components in the basement
membrane, degrade the basement membrane and the extracellular
matrix, and move through the extracellular matrix to invade the
surrounding tissues (15). Once in
the circulation system, tumor cells evade the surveillance of the
immune system. When passing through the vessel wall to the
secondary site, tumor cells adhere to the secondary site,
proliferate and eventually metastasize (16,17).
Cell adhesion, receptor complex, integral component of plasma
membrane, postsynaptic density and epidermal growth factor receptor
binding are key auxiliary components (18–20).
Cell adhesion molecules suppress the adhesive function of tumor
cells and glycoproteins located on the cell surface (21). Moreover, KEGG pathway analysis
indicated that the upregulated DEGs influenced ‘protein processing
in endoplasmic reticulum’, ‘antigen processing and presentation’
and ‘phagosome’; the downregulated DEGs were associated with
‘arrhythmogenic right ventricular cardiomyopathy’,
‘phosphatidylinositol signaling system’ and ‘inositol phosphate
metabolism’. Tumor metastasis involves detachment from the primary
site of the tumor, entrance into the surrounding stroma and the
circulation or lymphatic system, adhesion to endothelial cell
walls, extravasation and invasion through vascular proliferation
for the formation a novel metastatic lesion (22,23). GO
and KEGG analyses suggested that the aforementioned DEGs may
influence signaling pathways associated with tumor cell metastasis.
The identified DEGs may provide novel research directions and
targets for the treatment of HCC metastasis.
Based on the established PPI network with DEGs, the
following top 10 hub genes were identified: HSPA8, PHLPP1, GART,
CAD, ACTB, CDH1, PIK3CG, NFκB1, STAT3 and HSPA5. HSPA8 is a member
of the heat shock proteins family, which influences molecular
signal transduction, apoptosis and protein regulation (24). HSPA8 is located in the cytoplasm and
lysosomes and is involved in mediating cell autophagy by binding to
the substrate protein and transporting it into the lysosomal cavity
(25,26). Novel research has shown that the
Hsp70 protein may inhibit apoptosis by regulating the
caspase-dependent pathway (27).
Moreover, tumor vaccines against HSP70S have been successfully
completed in animal models and clinical trials are underway
(27).
PHLPP1 is an important regulator of Akt
serine-threonine kinases and conventional/novel protein kinase C
isoforms (28). PHLPP1 can inhibit
growth factor-induced signal transduction pathways in cancer cells,
so it may be used as a growth inhibitor in several types of cancer
(28). In the human breast cancer
cell line 21T, AK294 phosphorylation was inhibited by LY294002, and
the expression of PHLPP1 in two metastatic cell lines (MT1 and MT2)
was much lower compared with early breast cancer cells (29). PHLPP1 can negatively regulate the
activity of AKT and its downstream kinase by phosphorylating the
hydrophobic group of AKT at the Serine473 site. This resulted in
inhibition of the PI3K/AKT signaling pathway, and the activation of
various cancer promoting signaling pathways, including
amplification or gain-of-function mutations in upstream receptor
protein tyrosine kinases (RPTKs), activating mutations in PI3K and
Akt and loss-of-function mutations in the regulatory phosphatase
PTEN, which affect differentiation and proliferation of cancer
cells and apoptosis in breast cancer cells (29). Therefore, it is hypothesized that
PHLPP1 is associated with tumor metastasis.
Trifunctional purine biosynthetic protein
adenosine-3 is an enzyme that is encoded by the GART gene (30). GART participates in several aspects
of energy metabolism, including as a ATP binding source, metal ion
binding source and phosphoribosylamine-glycine ligase activity
source (30,31). CAD is a fusion gene that encodes
three enzymes involved in pyrimidine biosynthesis;
carbamoyl-phosphate synthetase 2 and aspartate transcarbamylase
fused with dihydroorotase (31). CAD
is a key enzyme the regulates multiple biological processes in the
first three steps of pyrimidine biosynthesis (32). These three genes serve a role in the
synthesis and metabolism of nucleic acids and proteins in cells,
and their synthesized products provide essential substances and
energy for cell proliferation (32).
Actin is a major constituent of the muscular
contractile apparatus and ACTB is one of six different actin
isoforms that have been identified in humans (33). ACTB binds RNA-binding protein Sam68
and participates in the regulation of the synaptic formation of
dendritic spines (34). ACTB
supports the muscular cytoskeleton during the formation of novel
tumor cells following tumor cell proliferation and metastasis.
Thus, ACTB is considered to be associated with cell proliferation
and metastasis (34).
CDH1, also known as epithelial cadherin
(E-cadherin), is a protein encoded by the CDH1 gene (35). Mutations in CDH1 are closely
associated with liver, colorectal and gastric cancer. Moreover, a
functional deficit of CDH1 promotes the proliferation and
invasiveness of tumor cells, and promotes the malignant development
of tumors (35). E-cadherin is a
member of the cadherin family and downregulation of E-cadherin
reduces cell-cell adhesion, which results in cells that are more
susceptible to migration (36). This
change can easily result in cancer cells passing through the cell
basement membrane and invading surrounding tissues (36). A previous study demonstrated that
E-cadherin is an important protein that regulates cell-cell
adhesion. On the cell membrane, E-cadherin binds to β-catenin via
its cytoplasmic tail, allowing epithelial cells to bind tightly
together. Knockdown of E-cadherin expression results in β-catenin
release into the cytoplasm and translocation into the nucleus, and
this process can result in the expression of epithelial mesenchymal
transition (EMT)-inducible transcription factors. Therefore,
E-cadherin is an important gene that regulates EMT (37).
The PIK3CG subunit λ isoform is an enzyme encoded by
the PIK3CG gene (38). Several
studies have demonstrated that the function of PIK3CG is to
regulate the transmission of extracellular signals, including
E-cadherin-mediated cell-cell adhesion, which serves an important
role in maintaining the structural and functional integrity of the
epithelium (39,40).
The NFκB1 gene is a cellular transcription factor
and encodes the NF-κB p105 subunit protein. The expression of NF-κB
is activated via various stimuli, such as cytokines, oxidative free
radicals and bacterial or viral products (41). Activated NF-κB is transported to the
nucleus to participate in the transcription and synthesis of
various proteins and signaling molecules, regulating various cell
behaviors (41). It has been
revealed that osteopontin can regulate the expression of MTI-MMP
via the NF-κB signaling pathway and promote the migration of cancer
cells and invasion into the extracellular matrix (42). A previous study confirmed that
several adhesion molecules, such as ICAM-1, VCAM-1 and ELAM-1, are
regulated by NF-κB, which serves an important role in tumor
metastasis (43).
STAT3, which contains SH2 and SH3 domains, binds to
specific phosphotyrosine-containing peptides. When STAT3 is
activated by phosphorylation, it serves as a transcriptional
activator, in either its homodimeric or heterodimeric form
(44). Phosphorylated STAT3 binds a
specific site in the target gene promoter sequence and promotes
transcription of the gene (44).
Dysregulation of this pathway in tumors leads to increased
angiogenesis surrounding the tumor, promotes blood supply to the
tumor, increases tumor survival and promotes malignant development.
It has been demonstrated that tissue-specific inactivation of STAT3
in the lungs of mice is associated with the occurrence and
progression of lung adenocarcinoma, which reduced the survival
rate. Notably, decreased expression of STAT3 promotes the
expression of NF-κB in the cytoplasm, thus regulating NF-κB-induced
IL-8 expression (45). This process
promotes IL-8-mediated tumor invasion, angiogenesis and progression
(45).
Binding immunoglobulin protein, also known as HSPA5,
is a protein that is encoded by the HSPA5 gene (46). A large number of studies have
revealed the high expression of HSPA5 in all malignant tumors
(47,48). Therefore, inhibiting HSPA5 gene
expression may be used as an adjuvant therapy for cancer. In
addition, reducing the large amount of HSPA5 produced during the
stress response can increase the apoptosis of tumor cells and
inhibit tumor growth (49).
In addition, tumor metastasis is a complex
multi-step process, whereby tumor cells not only interact with each
other and host cells, but also with extracellular matrix components
(50). Certain characteristics, such
as adhesion, metastasis, migration, skeleton assembly, signal
transduction and proliferation are associated with tumor metastasis
(50,51). Migration is considered a key factor
in the process of tumor cell metastasis (51). Previous studies have demonstrated
that RNA splicing, protein modification by small protein
conjugation, catalytic complex, ubiquitin-protein transferase
activity, chemokine signaling pathways, protein folding,
extracellular exosomes, protein disulfide isomerase activity and
chemokine signaling pathways are also involved in the process of
tumor cell migration and metastasis, such as the expansion of the
cell front, the formation of new adhesion sites and the release of
the original adhesion sites in the tail of the cell (52–56).
A study reported that miR-26b-5p exerts metastatic
properties and maintains epithelial cell adhesion molecule + cancer
stem cells via HSPA8 in HCC (57).
Moreover, a study investigating the role of PHLPP1 in HCC reported
that miR-190 influences EMT by regulating the expression of PHLPP1,
thus affecting the malignant biological behavior of HCC cells
(58). Isobaric tags for relative
and absolute quantification analysis of clinical samples of HCC
indicated that ACTB serves an important role in the initiation
stage of HCC (59). Long non-coding
RNA ATRERNA1 promotes the metastasis and invasiveness of HCC cells
by recruiting EHMT2 and/or ehmt2/snai1 complexes to inhibit CDH1
(60). Loss of NFκB1 promotes the
occurrence of age-related chronic liver disease (CLD) which is
characterized by steatosis, neutrophil proliferation, fibrosis,
telomere damage of hepatocytes and HCC (61). The results of the present study
demonstrated that STAT3 is one of the hub genes. Phosphorylated
RPN2 activates the signal transducer and activator of STAT3 and is
also responsible for the RPN2-stimulated elevated expression of
MMP-9 and for invading HCC cells (62).
In the current study, biological function and signal
pathway enrichment analysis revealed that the genes in module 1, 2
and 3 were primarily enriched in ‘RNA splicing’, ‘G-protein coupled
receptor signaling pathway’ and ‘protein ubiquitination’. Studies
have demonstrated that these signaling pathways are required for
cell survival and metabolism and serve an important role in tumor
recurrence and metastasis (63–65).
Therefore, it is hypothesized that these molecular pathways may
provide novel insight and potential targets for the diagnosis and
treatment of HCC.
In conclusion, 1,171 DEGs were identified (including
712 upregulated and 459 downregulated genes, 1,033 nodes, 7,589
edges and 10 hub genes) via gene profile dataset and integrated
bioinformatics analysis in noncancerous surrounding hepatic
tissues. The 10 hub genes were significantly enriched in several
signaling pathways which serve an important role in tumor
metastasis. According to the present research and analysis, CAD,
GART, HSPA5, ACTB, CDH1 and HSPA8 may have potential as targets for
the diagnosis and treatment of metastatic HCC. The present study
may provide a scientific basis for the investigation of these genes
in HCC in the future.
Supplementary Material
Supporting Data
Acknowledgements
Not applicable.
Funding
The present study was supported by The Foundation of
Scientific Research of Sichuan Medical Association (grant. no.
S16007), The Sichuan Health Planning Commission Key Project
Foundation (grant. no. 17ZD008), The Sichuan Science and Technology
Project (grant. no. 2018JY0276) and The Chengdu Science and
Technology Bureau Technology Innovation Project (grant. no.
2018-YF05-01228-SN).
Availability of data and materials
The datasets generated and/or analyzed during the
present study are available in the [NCBI] repository, [https://www.ncbi.nlm.nih.gov/geo].
Authors' contributions
YL and HW performed the experiments, analyzed the
data and drafted the manuscript. YW, HW, MD and CL conceptualized
the study design and critically revised the manuscript. YL, MD, CL
and HW wrote the manuscript. All authors read and approved the
final manuscript.
Ethics approval and consent to
participate
The present study was approved by The Institutional
Review Board of the Second Affiliated Hospital of Chongqing Medical
University (Chongqing, China) and written informed consent was
provided by all patients according to the Declaration of
Helsinki.
Patient consent for publication
Not applicable.
Competing interests
The authors declare that they have no competing
interests.
References
|
1
|
Siegel RL, Miller KD and Jemal A: Cancer
statistics, 2016. CA Cancer J Clin. 66:7–30. 2016. View Article : Google Scholar : PubMed/NCBI
|
|
2
|
Chen WQ, Zheng RS, Baade PD, Zhang S, Zeng
H, Bray F, Jemal A, Yu XQ and He J: Cancer statistics in China,
2015. CA Cancer J Clin. 66:115–132. 2016. View Article : Google Scholar : PubMed/NCBI
|
|
3
|
Greten TF, Wang XW and Korangy F: Current
concepts of immune based treatments for patients with HCC: From
basic science to novel treatment approaches. Gut. 64:842–848. 2015.
View Article : Google Scholar : PubMed/NCBI
|
|
4
|
Pang RW, Joh JW, Johnson PJ, Monden M,
Pawlik TM and Poon RT: Biology of hepatocellular carcinoma. Ann
Surg Oncol. 15:962–971. 2008. View Article : Google Scholar : PubMed/NCBI
|
|
5
|
Ye QH, Qin LX, Forgues M, He P, Kim JW,
Peng AC, Simon R, Li Y, Robles AI, Chen Y, et al: Predicting
hepatitis B virus-positive metastatic hepatocellular carcinomas
using gene expression profiling and supervised machine learning.
Nat Med. 9:416–423. 2003. View
Article : Google Scholar : PubMed/NCBI
|
|
6
|
Iizuka N, Oka M, Yamada-Okabe H, Nishida
M, Maeda Y, Mori N, Takao T, Tamesa T, Tangoku A, Tabuchi H, et al:
Oligonucleotide microarray for prediction of early intrahepatic
recurrence of hepatocellular carcinoma after curative resection.
Lancet. 361:923–929. 2003. View Article : Google Scholar : PubMed/NCBI
|
|
7
|
Budhu A, Forgues M, Ye QH, Jia HL, He P,
Zanetti KA, Kammula US, Chen Y, Qin LX, Tang ZY and Wang XW:
Prediction of venous metastases, recurrence, and prognosis in
hepatocellular carcinoma based on a unique immune response
signature of the liver microenvironment. Cancer Cell. 10:99–111.
2006. View Article : Google Scholar : PubMed/NCBI
|
|
8
|
Tang Z, Li C, Kang B, Gao G, Li C and
Zhang Z: GEPIA: A web server for cancer and normal gene expression
profiling and interactive analyses. Nucleic Acids Res. 45((W1)):
W98–W102. 2017. View Article : Google Scholar : PubMed/NCBI
|
|
9
|
Szklarczyk D, Gable AL, Lyon D, Junge A,
Wyder S, Huerta-Cepas J, Simonovic M, Doncheva NT, Morris JH, Bork
P, et al: STRING v11: Protein-protein association networks with
increased coverage, supporting functional discovery in genome-wide
experimental datasets. Nucleic Acids Res. 47:D607–D613. 2019.
View Article : Google Scholar : PubMed/NCBI
|
|
10
|
Shannon P, Markiel A, Ozier O, Baliga NS,
Wang JT, Ramage D, Amin N, Schwikowski B and Ideker T: Cytoscape: A
software environment for integrated models of biomolecular
interaction networks. Genome Res. 13:2498–2504. 2003. View Article : Google Scholar : PubMed/NCBI
|
|
11
|
Bader GD and Hogue CW: An automated method
for finding molecular complexes in large protein interaction
networks. BMC Bioinformatics. 4:22003. View Article : Google Scholar : PubMed/NCBI
|
|
12
|
Livak KJ and Schmittgen TD: Analysis of
relative gene expression data using real-time quantitative PCR and
the 2(-Delta Delta C(T)) method. Methods. 25:402–408. 2001.
View Article : Google Scholar : PubMed/NCBI
|
|
13
|
Thorgeirsson SS and Grisham JW: Molecular
pathogenesis of human hepatocellular carcinoma. Nat Genet.
31:339–346. 2002. View Article : Google Scholar : PubMed/NCBI
|
|
14
|
Fan W and Ye G: Microarray analysis for
the identification of specific proteins and functional modules
involved in the process of hepatocellular carcinoma originating
from cirrhotic liver. Mol Med Rep. 17:5619–5626. 2018.PubMed/NCBI
|
|
15
|
Gulubova MV: Expression of cell adhesion
molecules, their ligands and tumour necrosis factor alpha in the
liver of patients with metastatic gastrointestinal carcinomas.
Histochem J. 34:67–77. 2002. View Article : Google Scholar : PubMed/NCBI
|
|
16
|
Ploverini P: Cellular adhesion molecules;
newly identified mediators of angiogenesis. Am J Pathol.
148:1023–1029. 1996.PubMed/NCBI
|
|
17
|
McGrogan D and Bookstein R: Tumor
suppressor genes in prostate cancer. Semin Cancer Biol. 8:11–19.
1997. View Article : Google Scholar : PubMed/NCBI
|
|
18
|
Folkman J: Tumor angiogenesis: Therapeutic
implications. N Engl J Med. 285:1182–1186. 1971. View Article : Google Scholar : PubMed/NCBI
|
|
19
|
Folkman J: What is the evidence that
tumors are angiogenesis dependent? J Natl Cancer Inst. 82:4–6.
1990. View Article : Google Scholar : PubMed/NCBI
|
|
20
|
Akiyama SK, Larjava H and Yamada KM:
Differences in the biosynthesis and localization of the fibronectin
receptor in normal and transformed cultured human cells. Cancer
Res. 50:1601–1607. 1990.PubMed/NCBI
|
|
21
|
Koop S, Schmidt EE, MacDonald IC, Morris
VL, Khokha R, Grattan M, Leone J, Chambers AF and Groom AC:
Independence of metastatic ability and extravasation: Metastatic
ras-transformed and control fibroblasts extravasate equally well.
Proc Natl Acad Sci USA. 93:11080–11084. 1996. View Article : Google Scholar : PubMed/NCBI
|
|
22
|
Klein CA: Cancer. The metastasis cascade.
Science. 321:1785–1787. 2008. View Article : Google Scholar : PubMed/NCBI
|
|
23
|
Chiang AC and Massagué J: Molecular basis
of metastasis. N Engl J Med. 359:2814–2823. 2008. View Article : Google Scholar : PubMed/NCBI
|
|
24
|
O'Donnell JP, Marsh HM, Sondermann H and
Sevier CS: Disrupted hydrogen-bond network and impaired ATPase
activity in an Hsc70 cysteine mutant. Biochemistry. 57:1073–1086.
2018. View Article : Google Scholar : PubMed/NCBI
|
|
25
|
Mayer MP and Bukau B: Hsp70 chaperones:
Cellular functions and molecular mechanism. Cell Mol Life Sci.
62:670–684. 2005. View Article : Google Scholar : PubMed/NCBI
|
|
26
|
Xie W, Zhang L, Jiao H, Guan L, Zha J, Li
X, Wu M, Wang Z, Han J and You H: Chaperone-mediated autophagy
prevents apoptosis by degrading BBC3/PUMA. Autophagy. 11:1623–1635.
2015. View Article : Google Scholar : PubMed/NCBI
|
|
27
|
Majeski AE and Dice JF: Mechanisms of
chaperone-mediated autophagy. Int J Biochem Cell Biol.
36:2435–2444. 2004. View Article : Google Scholar : PubMed/NCBI
|
|
28
|
Wang X, Wang Q, Lin H, Li S, Sun L and
Yang Y: HSP72 and gp96 in gastroenterological cancers. Clin Chim
Acta. 417:73–79. 2013. View Article : Google Scholar : PubMed/NCBI
|
|
29
|
Brognard J and Newton AC: PHLiPPing the
switch on Akt and protein kinase C signaling. Trends Endocrinol
Metab. 19:223–230. 2008. View Article : Google Scholar : PubMed/NCBI
|
|
30
|
Qiao M, Iglehart JD and Pardee AB:
Metastatic potential of 21T human breast cancer cells depends on
Akt/protein kinase B activation. Cancer Res. 67:5293–5299. 2007.
View Article : Google Scholar : PubMed/NCBI
|
|
31
|
Hattori M, Fujiyama A, Taylor TD, Watanabe
H, Yada T, Park HS, Toyoda A, Ishii K, Totoki Y, Choi DK, et al:
The DNA sequence of human chromosome 21. Nature. 405:311–319. 2000.
View Article : Google Scholar : PubMed/NCBI
|
|
32
|
Banerjee D and Nandagopal K: Potential
interaction between the GARS-AIRS-GART Gene and CP2/LBP-1c/LSF
transcription factor in down syndrome-related Alzheimer disease.
Cell Mol Neurobiol. 27:1117–1126. 2007. View Article : Google Scholar : PubMed/NCBI
|
|
33
|
Ng BG, Wolfe LA, Ichikawa M, Markello T,
He M, Tifft CJ, Gahl WA and Freeze HH: Biallelic mutations in CAD,
impair de novo pyrimidine biosynthesis and decrease glycosylation
precursors. Hum Mol Genet. 24:3050–3057. 2015. View Article : Google Scholar : PubMed/NCBI
|
|
34
|
Gunning PW, Ghoshdastider U, Whitaker S,
Popp D and Robinson RC: The evolution of compositionally and
functionally distinct actin filaments. J Cell Sci. 128:2009–2019.
2015. View Article : Google Scholar : PubMed/NCBI
|
|
35
|
Guo C, Liu S, Wang J, Sun MZ and Greenaway
FT: ACTB in cancer. Clin Chim Acta. 417:39–44. 2013. View Article : Google Scholar : PubMed/NCBI
|
|
36
|
Cappell SD, Chung M, Jaimovich A, Spencer
SL and Meyer T: Irreversible APC (Cdh1) inactivation underlies the
point of no return for cell-cycle entry. Cell. 166:167–180. 2016.
View Article : Google Scholar : PubMed/NCBI
|
|
37
|
Beavon IR: The E-cadherin-catenin complex
in tumour metastasis: Structure, function and regulation. Eur J
Cancer. 36:1607–1620. 2000. View Article : Google Scholar : PubMed/NCBI
|
|
38
|
Polyak K and Weinberg RA: Transitions
between epithelial and mesenchymal states: Acquisition of malignant
and stem cell traits. Nat Rev Cancer. 9:265–273. 2009. View Article : Google Scholar : PubMed/NCBI
|
|
39
|
Alloatti G, Montrucchio G, Lembo G and
Hirsch E: Phosphoinositide 3-kinase gamma: Kinase-dependent and
-independent activities in cardiovascular function and disease.
Biochem Soc Trans. 32:383–386. 2004. View Article : Google Scholar : PubMed/NCBI
|
|
40
|
Rubio I, Wittig U, Meyer C, Heinze R,
Kadereit D, Waldmann H, Downward J and Wetzker R: Farnesylation of
Ras is important for the interaction with phosphoinositide 3-kinase
gamma. Eur J Biochem. 266:70–82. 1999. View Article : Google Scholar : PubMed/NCBI
|
|
41
|
Uehara M, McGrath MM, Ohori S, Solhjou Z,
Banouni N, Routray S, Evans C, DiNitto JP, Elkhal A, Turka LA, et
al: Regulation of T cell alloimmunity by PI3Kγ and PI3Kδ. Nat
Commun. 8:9512017. View Article : Google Scholar : PubMed/NCBI
|
|
42
|
Concetti J and Wilson CL: NFKB1 and
cancer: Friend or foe? Cells. 7:E1332018. View Article : Google Scholar : PubMed/NCBI
|
|
43
|
Philip S, Bulbule A and Kundu GC: Matrix
metalloproteinase-2: Mechanism and regulation of NF-κB-mediated
activation and its role in cell motility and ECM-invasion.
Glycoconj J. 21:429–441. 2004. View Article : Google Scholar : PubMed/NCBI
|
|
44
|
Bharti AC and Aggarwal BB: Nuclear
factor-kappa B and cancer: Its role in prevention and therapy.
Biochem Pharmacol. 64:883–888. 2002. View Article : Google Scholar : PubMed/NCBI
|
|
45
|
Wang Y, Shen Y, Wang S, Shen Q and Zhou X:
The role of STAT3 in leading the crosstalk between human cancers
and the immune system. Cancer Lett. 415:117–128. 2018. View Article : Google Scholar : PubMed/NCBI
|
|
46
|
Caetano MS, Hassane M, Van HT, Bugarin E,
Cumpian AM, McDowell CL, Cavazos CG, Zhang H, Deng S, Diao L, et
al: Sex specific function of epithelial STAT3 signaling in
pathogenesis of K-ras mutant lung cancer. Nat Commun. 9:45892018.
View Article : Google Scholar : PubMed/NCBI
|
|
47
|
Wang J, Lee J, Liem D and Ping P: HSPA5
gene encoding Hsp70 chaperone BiP in the endoplasmic reticulum.
Gene. 618:14–23. 2017. View Article : Google Scholar : PubMed/NCBI
|
|
48
|
Arap MA, Lahdenranta J, Mintz PJ, Hajitou
A, Sarkis AS, Arap W and Pasqualini R: Cell surface expression of
the stress response chaperone GRP78 enables tumor targeting by
circulating ligands. Cancer Cell. 6:275–284. 2004. View Article : Google Scholar : PubMed/NCBI
|
|
49
|
Shuda M, Kondoh N, Imazeki N, Tanaka K,
Okada T, Mori K, Hada A, Arai M, Wakatsuki T, Matsubara O, et al:
Activation of the ATF6, XBP1 and grp78 genes in human
hepatocellular carcinoma: A possible involvement of the ER stress
pathway in hepatocarcinogenesis. J Hepatol. 38:605–614. 2003.
View Article : Google Scholar : PubMed/NCBI
|
|
50
|
Um E, Oh JM, Granick S and Cho YK: Cell
migration in microengineered tumor environments. Lab Chip.
17:4171–4185. 2017. View Article : Google Scholar : PubMed/NCBI
|
|
51
|
Condeelis J and Pollard JW: Macrophages:
Obligate partners for tumor cell migration, invasion, and
metastasis. Cell. 124:263–266. 2006. View Article : Google Scholar : PubMed/NCBI
|
|
52
|
Yang Y, Zheng H, Zhan Y and Fan S: An
emerging tumor invasion mechanism about the collective cell
migration. Am J Transl Res. 11:5301–5312. 2019.PubMed/NCBI
|
|
53
|
Denisenko TV, Gorbunova AS and Zhivotovsky
B: Mitochondrial involvement in migration, invasion and metastasis.
Front Cell Dev Biol. 7:3552019. View Article : Google Scholar : PubMed/NCBI
|
|
54
|
Li X, Miao Y, Pal DS and Devreotes PN:
Excitable networks controlling cell migration during development
and disease. Semin Cell Dev Biol. Dec 10–2019.(Epub ahead of
print). doi: 10.1016/j.semcdb.2019.11.001.
|
|
55
|
Mishra AK, Campanale JP, Mondo JA and
Montell DJ: Cell interactions in collective cell migration.
Development. 146:dev1720562019. View Article : Google Scholar : PubMed/NCBI
|
|
56
|
Greenlee JD and King MR: Engineered
fluidic systems to understand lymphatic cancer metastasis.
Biomicrofluidics. 14:0115022020. View Article : Google Scholar : PubMed/NCBI
|
|
57
|
Misra UK, Payne S and Pizzo SV: The
monomeric receptor binding domain of tetrameric; α2-macroglobulin
binds to cell surface GRP78 triggering equivalent; activation of
signaling cascades. Biochemistry. 52:4014–4025. 2013. View Article : Google Scholar : PubMed/NCBI
|
|
58
|
Khosla R, Hemati H, Rastogi A, Ramakrishna
G, Sarin SK and Trehanpati N: MiR-26b-5p helps in EpCAM+cancer stem
cells maintenance via HSC71/HSPA8 and augments malignant features
in HCC. Liver Int. 39:1692–1703. 2019. View Article : Google Scholar : PubMed/NCBI
|
|
59
|
Xiong Y, Wu S, Yu H, Wu J, Wang Y, Li H,
Huang H and Zhang H: MiR-190 promotes HCC proliferation and
metastasis by targeting PHLPP1. Exp Cell Res. 371:185–195. 2018.
View Article : Google Scholar : PubMed/NCBI
|
|
60
|
Goh WW, Lee YH, Ramdzan ZM, Chung MC, Wong
L and Sergot MJ: A network-based maximum link approach towards MS
identifies potentially important roles for undetected ARRB1/2 and
ACTB in liver cancer progression. Int J Bioinform Res Appl.
8:155–170. 2012. View Article : Google Scholar : PubMed/NCBI
|
|
61
|
Song W, Gu Y, Lu S, Wu H, Cheng Z, Hu J,
Qian Y, Zheng Y and Fan H: LncRNA TRERNA1 facilitates
hepatocellular carcinoma metastasis by dimethylating H3K9 in the
CDH1 promoter region via the recruitment of the EHMT2/SNAI1
complex. Cell Prolif. 52:e126212019. View Article : Google Scholar : PubMed/NCBI
|
|
62
|
Wilson CL, Jurk D, Fullard N, Banks P,
Page A, Luli S, Elsharkawy AM, Gieling RG, Chakraborty JB, Fox C,
et al: NFκB1 is a suppressor of neutrophil-driven hepatocellular
carcinoma. Nat Commun. 6:68182015. View Article : Google Scholar : PubMed/NCBI
|
|
63
|
Black DL: Mechanisms of alternative
pre-messenger RNA splicing. Annu Rev Biochem. 72:291–336. 2003.
View Article : Google Scholar : PubMed/NCBI
|
|
64
|
King N, Hittinger CT and Carroll SB:
Evolution of key cell signaling and adhesion protein families
predates animal origins. Science. 301:361–363. 2003. View Article : Google Scholar : PubMed/NCBI
|
|
65
|
Mukhopadhyay D and Riezman H:
Proteasome-independent functions of ubiquitin in endocytosis and
signaling. Science. 315:201–205. 2007. View Article : Google Scholar : PubMed/NCBI
|