Introduction
Gastric cancer is the fourth most common cancer type
and the third leading cause of cancer-associated mortality
worldwide (1). Currently, prediction
of gastric cancer prognosis predominantly relies on the
Tumor-Node-Metastasis (TNM) staging classification (2). Histological grading, which reflects
tumor differentiation, is also widely employed for the
categorization and prognostic prediction of gastric cancer
(3). Poorly differentiated gastric
cancers are often more aggressive, leading to earlier lymph node
and distal metastasis.
However, via laboratory experiments and
clinicopathological analyses, several genes that influence gastric
cancer tumorigenesis have been identified to serve as potential
biomarkers for the diagnosis, prognostic prediction and further
clinical applications associated with the treatment of gastric
cancer. For example, several studies have indicated that HER-2 is a
negative prognostic factor for patients with gastric cancer
(4,5). Moreover, Oh et al (6) reported that p53 status and HIF-1α
expression in patients with gastric cancer may be markers of tumor
invasion and lymph node involvement, and that high HIF-1α
expression predicts a poor prognosis. Despite these findings, the
mechanisms underlying the development and progression of gastric
cancer remain unclear and more cancer-associated molecules are yet
to be discovered.
Concurrent with the rapid advancement of sequencing
technologies, computational bioinformatics approaches have become
useful methods for systematically identifying the genes and
mechanisms involved in tumorigenesis and progression. Public
repositories such as the Gene Expression Omnibus (7) and cBioPortal (8) have provided access to functional
genomic data, submitted by numerous research groups. Importantly,
the datasets hosted by The Cancer Genome Atlas (TCGA; http://www.cancer.gov/) are widely used in the
bioinformatics analysis of cancer. For instance, Wang et al
(9) established a prognostic scoring
system for gastric cancer, constructed using a 53-gene signature
identified through the analysis of RNA-sequencing (RNA-seq) data
from TCGA combined with a microarray dataset (GSE30727).
Nomograms are widely used as a prognostic method in
oncology, providing a user-friendly digital interface of a
statistical predictive model that generates the numerical
probabilities of specific clinical events (10,11). For
instance, in the field of gastric cancer, Lai et al
(12) and Kim et al (13) constructed nomograms to predict the
recurrence of gastric cancer following curative resection. In
addition, several studies have focused on developing nomograms for
predicting cancer-specific survival and disease-free survival rates
(14,15). Moreover, Han et al (16) constructed a predictive nomogram by
combining clinicopathological variables associated with the overall
survival (OS) of patients with gastric cancer after gastric
resection. Wang et al (17)
and Liu et al (18) revealed
that specific gene expression patterns could be integrated with
clinical variables to provide a better prediction of prognosis
using a nomogram.
In the present study, genes with prognostic value
for predicting the OS of patients with gastric cancer were
identified by analyzing transcriptomic data retrieved from TCGA
database. Subsequently, multivariate Cox regression analyses were
conducted to determine which genes and clinicopathological
variables should be incorporated into a prognostic model. Finally,
a nomogram was constructed, providing a visualized prognostic model
for the prediction of OS of patients with gastric cancer.
Materials and methods
Patients
The present study was approved by the institutional
review boards of the First Affiliated Hospital of Zhejiang
University. Pathologically confirmed gastric cancer specimens of 59
patients (median age, 63 years; range, 30–81 years) were included
in the present study. Written informed consent was obtained from
each patient prior to sample collection and analysis. The specimens
were frozen and stored in liquid nitrogen (−80°C) following
curative or palliative surgical resection. Surgeries were performed
in the First Affiliated Hospital of Zhejiang University (Zhejiang,
China) between November 2011 and June 2015. Patient information,
including age, sex, grade and TNM stage (determined according to
the 7th edition of the American Joint Committee on Cancer staging
manual), was documented. All patients enrolled in the study were of
Han Chinese ethnicity. The primary outcome of interest was OS time,
which was defined as the duration in months from the date of
surgery to the date of death.
TCGA data retrieval and screening of
survival-associated genes
RNA-seq gene expression data and the corresponding
clinicopathological characteristics for patients with gastric
cancer were downloaded from the TCGA data portal (https://tcga-data.nci.nih.gov) using TCGA-Assembler
(search term, ‘STAD’) (19). The R
package DESeq (20) was applied to
screen for differentially expressed genes (DEGs). The screening was
conducted by comparing early-stage tumors versus metastatic tumors
and histologically well-to moderately differentiated tumors versus
poorly differentiated tumors. Genes with a difference in expression
level between groups at an adjusted P-value of <0.05 and an
absolute fold-change of >2 were classified as DEGs. The common
genes that were identified during both comparisons were selected as
candidate survival-associated genes for further analysis.
Validation of the predictive value of
the selected genes for estimating OS
Gene expression data and follow-up information were
downloaded from TCGA. To validate the predictive value of the
selected genes, the patients were classified into high and low
expression groups for each gene. The cutoff points for expression
ranges were determined using X-tile software (version 3.6.1)
(21) and survival curves were
generated using the Kaplan-Meier method. In addition, the online
Kaplan-Meier plotter tool (http://kmplot.com/analysis/) (22) was used to validate
the predictive value of the selected genes.
Cox regression analysis and risk
stratification
All predictors of interest were added, separately
and jointly, in the initial full model prior to selection,
including tumor grade, sex, TNM stage, age and the selected
survival-associated genes. A stepwise selection method was used
during model selection to choose predictive variables. The risk
score of each patient was then calculated by summing each
stepwise-selected predictive variable multiplied by its
corresponding coefficient. The risk score was then used to divide
the patients into high-, medium- and low-risk signatures (cutoff
points determined using X-tile software), in which a higher risk
score indicated a poorer survival time for the patient. To reduce
the discrepancy of gene expression values arising from the use of
multiple detection platforms, the expression level of each gene was
coded as 1, 2, 3, 4, 5 or 6 when it ranked in the ≤16.7th,
>16.7th to ≤33.3rd, >33.3rd to ≤50.0th, >50.0th to
≤66.7th, >66.7th to ≤83.3rd or >83.3rd percentile of total
gene expression, respectively.
Nomogram analysis
A nomogram was constructed, according to the results
of the multivariate Cox regression analysis, using the rms
(23) package in R version 3.3.0
(http://www.r-project.org/). The
predictive performance of the nomogram was measured using the
concordance index (C-index) and the calibration curves from
internal and external validation. The C-index is correlated with
the ability of a model to separate patients with different
outcomes, whereas the calibration curves reflect the level of
similarity between the outcomes predicted by a model and the actual
outcomes.
Tissue RNA isolation and reverse
transcription-quantitative (RT-q)PCR
For further validation of the RNA-seq data, the
expression level of prickle planar cell polarity protein 1
(PRICKLE1) was assessed in gastric cancer specimens from
patients using RT-qPCR. Gastric cancer tissue specimens were
pulverized in liquid nitrogen and total RNA was extracted using
TRIzol® reagent (Invitrogen; Thermo Fisher Scientific,
Inc.) according to the manufacturer's instructions. Reverse
transcription was conducted using the GoScript™ reverse
transcription system (Promega Corporation). Subsequently, qPCR was
performed using SYBR® Premix Eq Taq™ reagents
(Takara Bio, Inc.) and a StepOne™ Real-Time PCR System
(Applied Biosystems; Thermo Fisher Scientific, Inc.) according to
the manufacturer's protocol for 2-step PCR. The following
thermocycling conditions were used: Initial denaturation at 95°C
for 30 sec, followed by 95°C for 5 sec and 60°C for 30 sec (40
cycles). The reactions were performed in triplicate. The expression
level of PRICKLE1 was normalized to that of GAPDH
using the formula: PRICKLE1ΔCq=(Avg.
PRICKLE1Cq-Avg. GAPDHCq)
(24). Primers sequences were as
follow: PRICKLE1 forward, 5′-TGCTGCCTTGAGTGTGAAAC-3′ and
reverse, 5′-CACAAGAAAAGCAGGCTTCC-3′ (25); and GAPDH forward,
5′-GGAGCGAGATCCCTCCAAAAT-3′ and reverse,
5′-GGCTGTTGTCATACTTCTCATGG-3′.
Statistical analysis
Categorical variables were compared using the
χ2 test or Fisher's test. The optimal cut-off value was
determined using X-tile software (version 3.6.1) (21). Survival curves were depicted using
the Kaplan-Meier method and compared using the log-rank test.
Nomogram analysis was performed using the rms (23) package in R (version 3.3.0; http://www.r-project.org/). Statistical analysis was
conducted using SAS 9.4 (SAS Institute, Inc.). For all of the
analyses, P<0.05 in a two-tailed test was considered to be
statistically significant.
Results
Strategy for the selection of
survival-associated genes
The aim of the present study was to combine the two
most commonly used classifications of gastric cancer, namely TNM
stage and histological grade, to identify candidate genes
associated with the survival of patients with gastric cancer.
RNAseqV2 transcriptomic data and corresponding
clinicopathological data of 443 patients with gastric cancer were
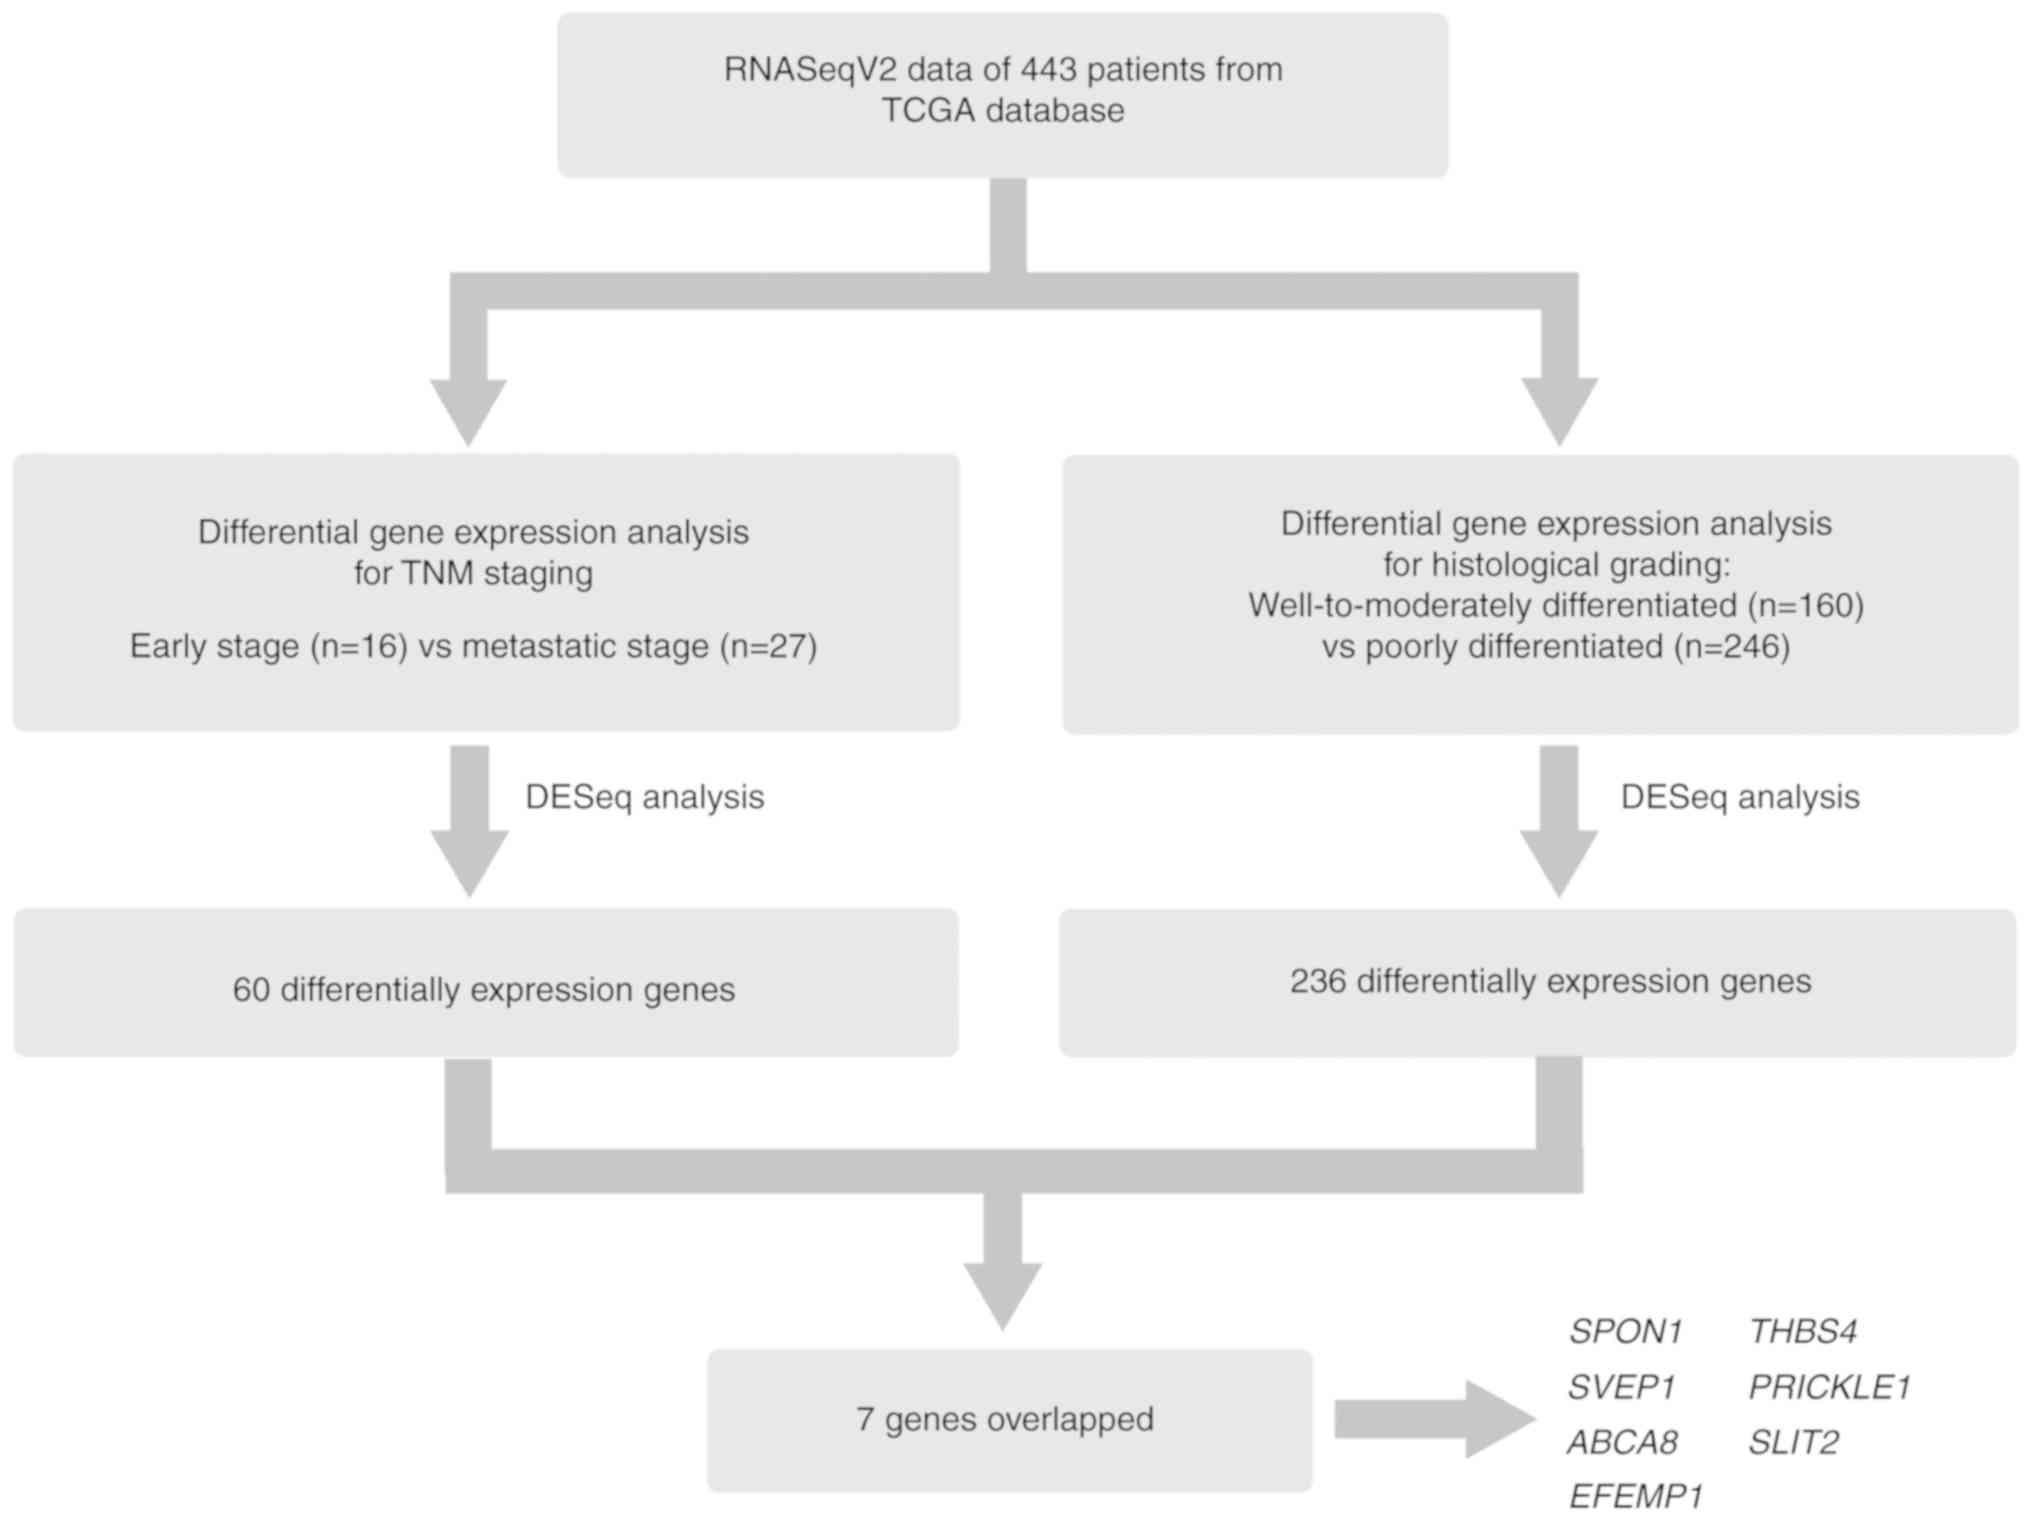
retrieved from TCGA database using TCGA-Assembler (19). As exhibited in Fig. 1, after standardizing the counts of
the RNAseqV2 data using the DESeq R package, the DEGs (P<0.05
and absolute fold-change ≥2) were identified according to
differences in the expression profiles of early-stage (TNM stage I;
n=16) and metastatic (TNM stage IV; n=27) tumors. Subsequently, a
similar analysis was performed comparing transcript levels between
patients with histologically well-to-moderately differentiated
(G1/G2; n=160) and poorly differentiated
(G3; n=246) gastric cancer. The corresponding data
regarding TNM stage and grade were missing in some samples;
therefore, the total case number in the screening analysis (n=406)
was slightly different from the total number of expression profiles
collected (n=443).
As a result, a total of 60 and 236 genes were
classified as DEGs from the analysis of TNM staging (Table SI) and histological grading
(Table SII), respectively. The
following seven genes were common to the results of both analyses:
SPON1, THBS4, SVEP1, PRICKLE1, ABCA8, SLIT2 and
EFEMP1.
Validation of the prognostic value of
seven candidate genes in gastric cancer
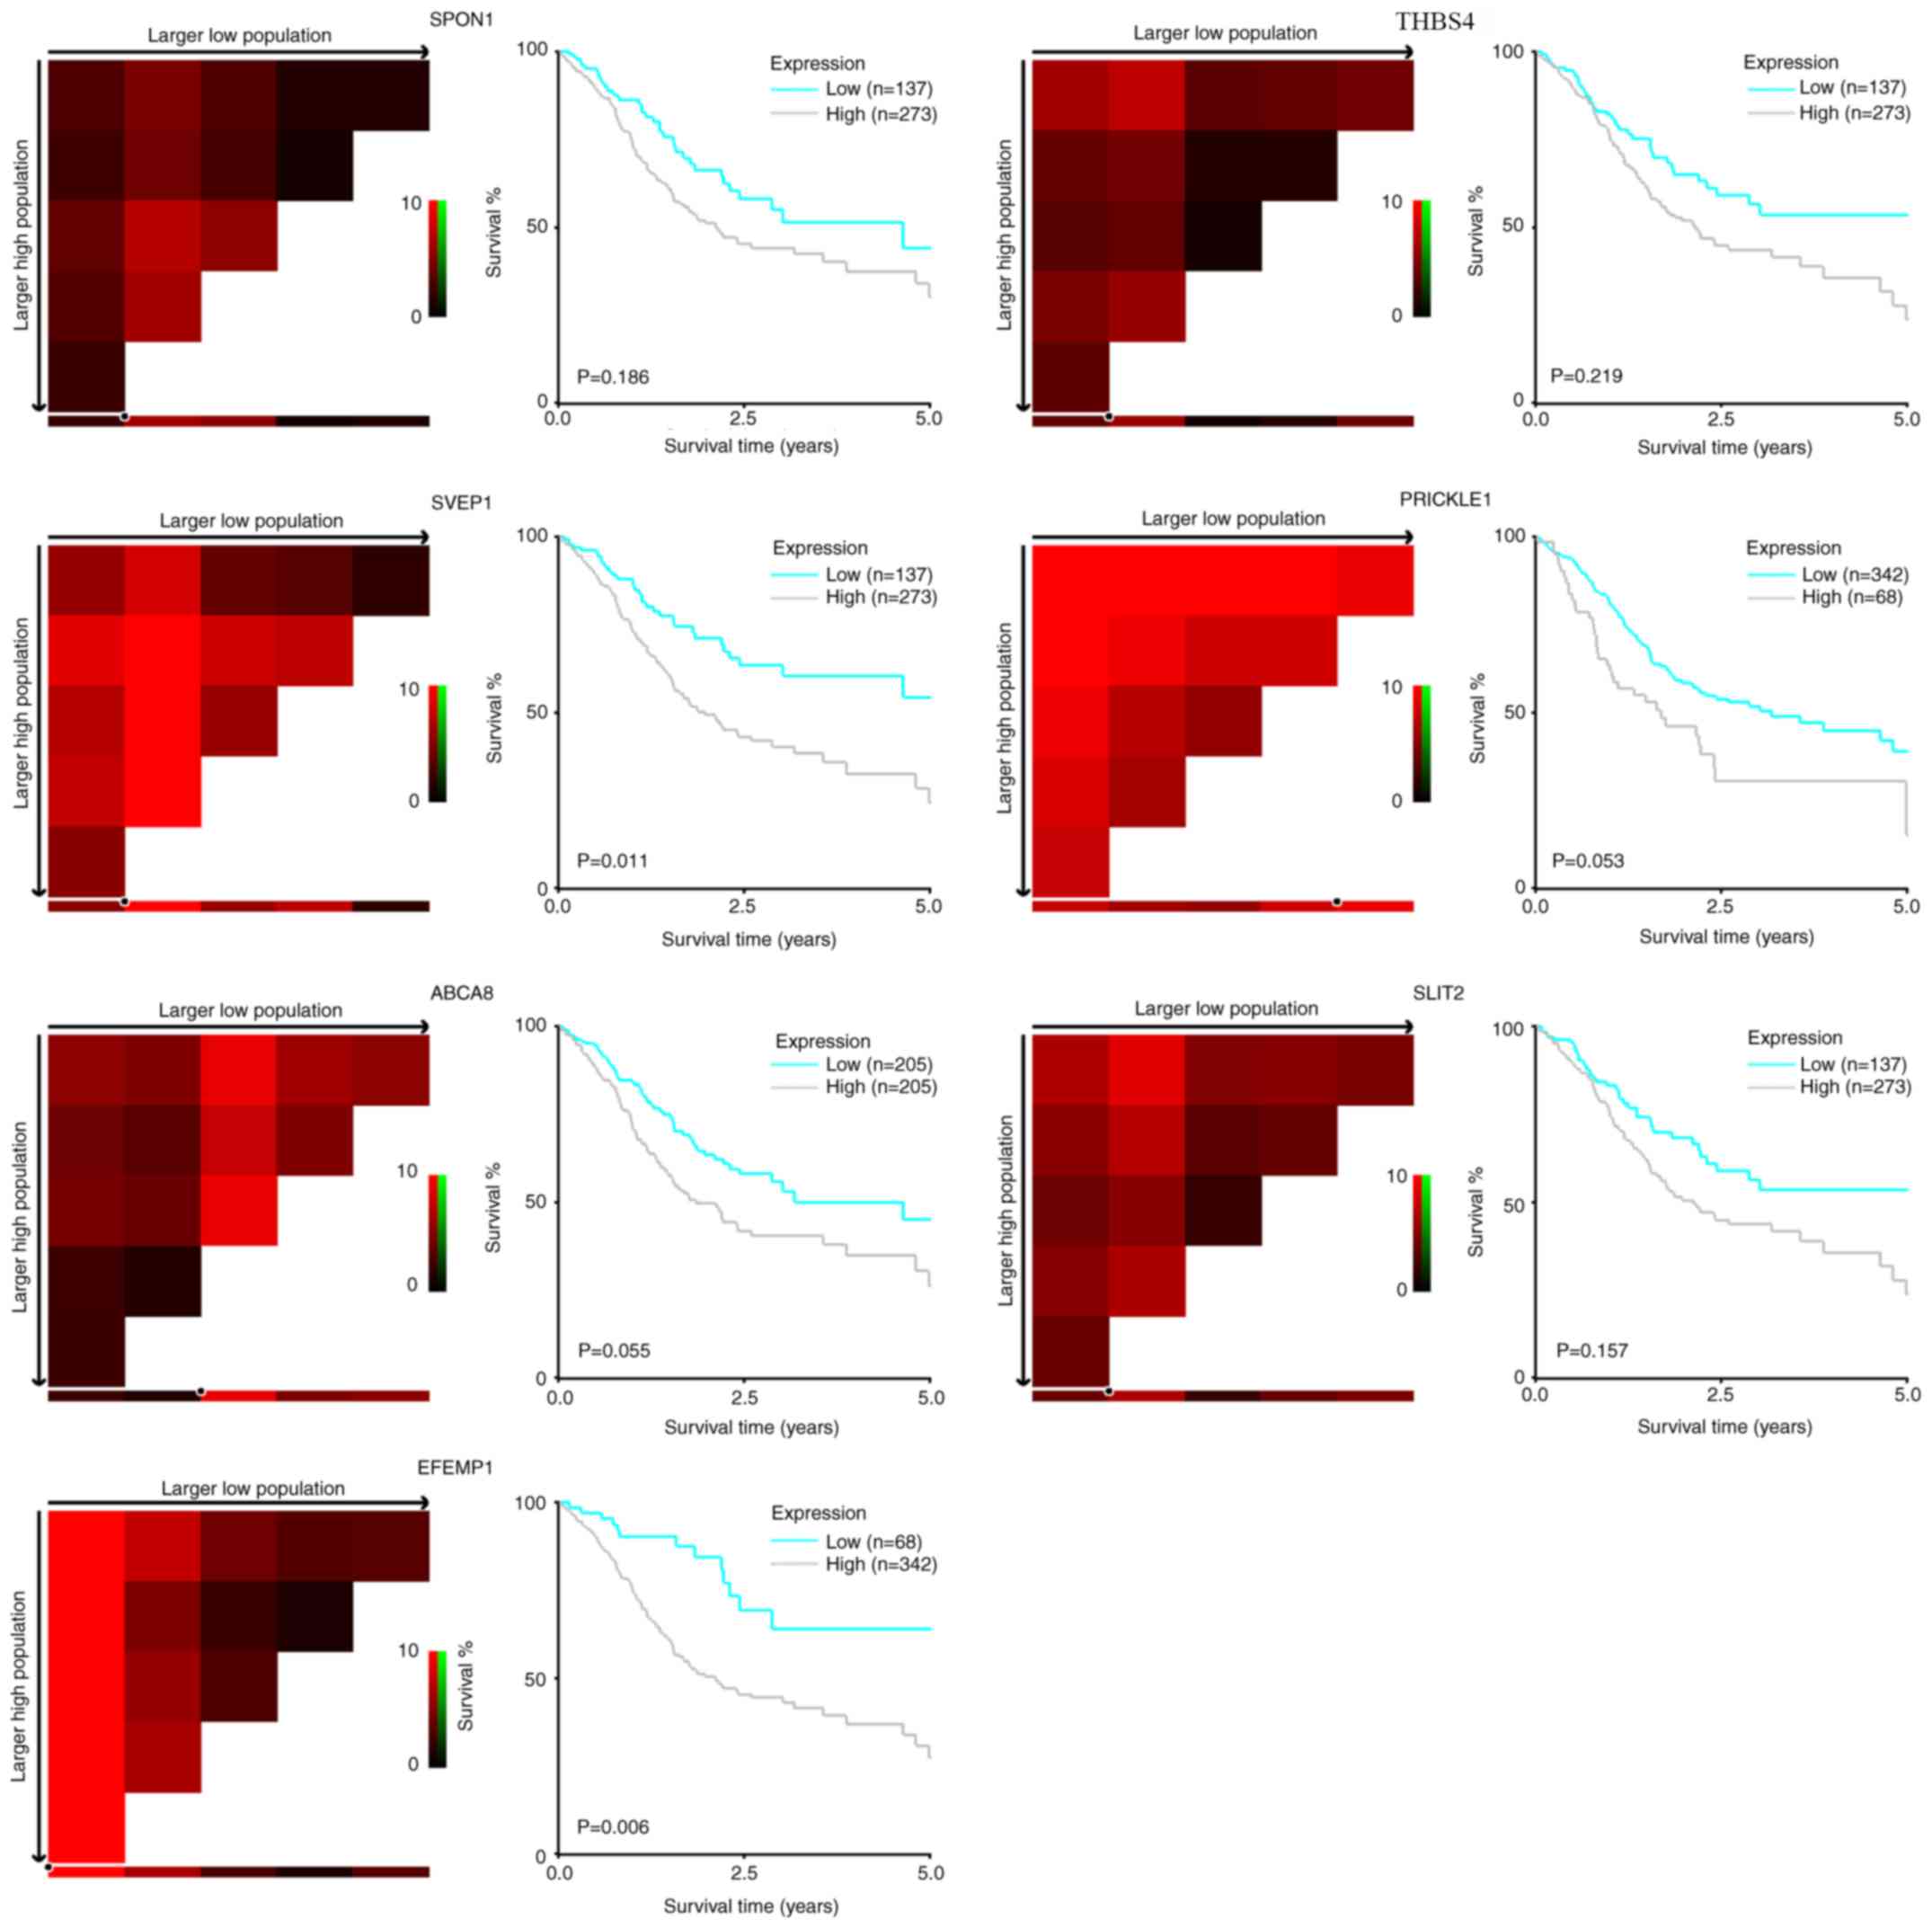
To validate the prognostic value of the seven
candidate genes, Kaplan-Meier analyses based on TCGA data (Fig. 2) were conducted. The optimal cutoff
value for classifying the expression of each gene as high or low
was determined using the X-tile program (21). There was a trend of a higher mRNA
level of each gene to be associated with a shorter OS time of
patients with gastric cancer. The association reached statistical
significance in EFEMP1 (P=0.006) and SVEP1 (P=0.011),
and showed marginal significance in PRICKLE1 (P=0.053) and
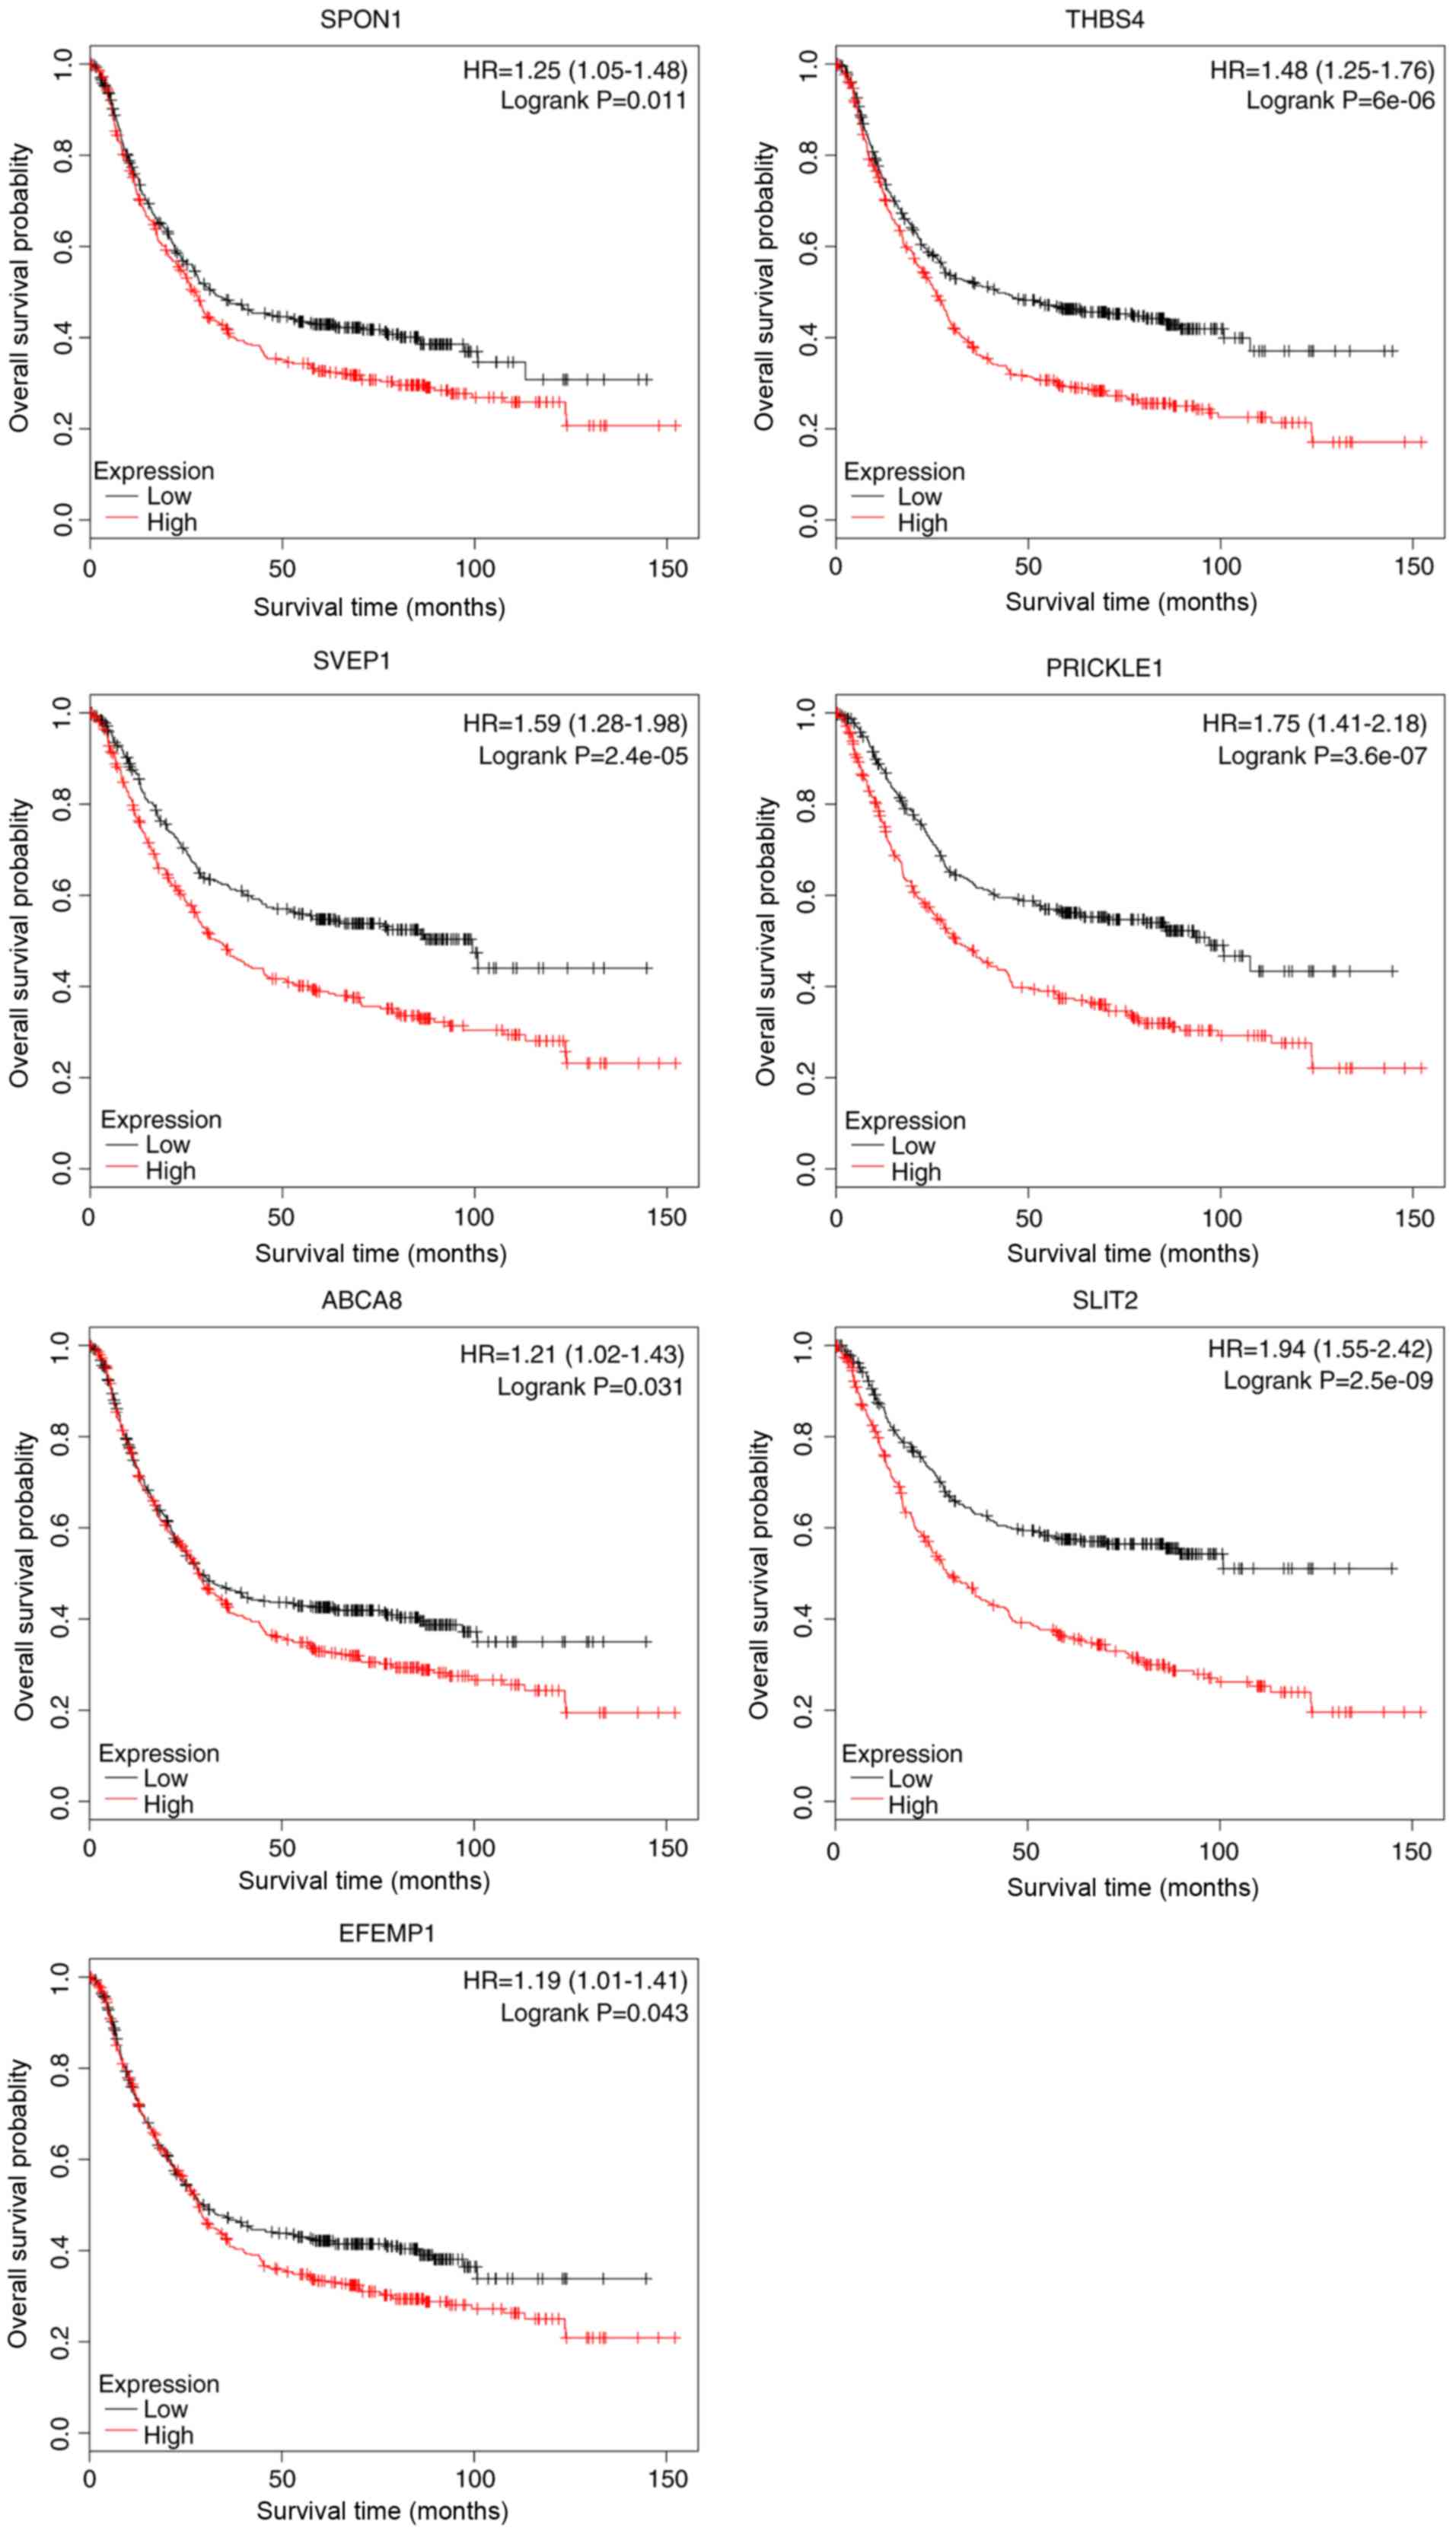
ABCA8 (P=0.055). Survival analyses based on the Kaplan-Meier
(22) plotter database revealed that
all seven candidate genes were significantly associated with poor
OS (Fig. 3).
Cox regression analysis
Univariate and multivariate Cox regression analyses
were further conducted to determine the potential value of each of
the seven genes as a predictor of OS. In the univariate Cox
regression analysis, the expression levels of 5 out of 7 candidate
genes (SVEP1, PRICKLE1, ABCA8, SLIT2 and EFEMP1), as
well as age, TNM stage and histological grade were significantly
associated with the OS of patients with gastric cancer.
PRICKLE1 showed the highest hazard ratio for OS [1.159; 95%
confidence interval (CI), 1.055–1.274] among the seven genes. The
multivariate Cox regression analysis revealed that PRICKLE1
expression in gastric cancer remained a statistically significant
predictor of OS (hazard ratio, 1.193; 95% CI, 1.017–1.400) when
combined with TNM stage and age (Table
I).
 | Table I.Univariate and multivariate cox
regression analysis for overall survival of patients with gastric
cancer. |
Table I.
Univariate and multivariate cox
regression analysis for overall survival of patients with gastric
cancer.
|
| Univariate | Multivariate |
|---|
|
|
|
|
|---|
| Variable | Hazard ratio (95%
CI) | P-value | Hazard ratio (95%
CI) | P-value |
|---|
| Grade, (poorly vs.
well to moderately) | 1.477
(1.061–2.056) | 0.021b | 1.411
(0.991–2.010) | 0.056 |
| Sex, men vs.
women | 1.255
(0.879–1.792) | 0.211 | 1.243
(0.864–1.787) | 0.241 |
| TNM stagea | 1.607
(1.313–1.967) |
<0.001c | 1.681
(1.351–2.093) |
<0.001c |
| Age, yearsa | 1.018
(1.002–1.034) | 0.025b | 1.033
(1.015–1.051) |
<0.001c |
| SPON1a | 1.095
(0.997–1.202) | 0.057 | 0.964
(0.798–1.164) | 0.700 |
| THBS4a | 1.087
(0.990–1.192) | 0.079 | 0.876
(0.719–1.067) | 0.189 |
| SVEP1a | 1.145
(1.043–1.258) | 0.005d | 1.082
(0.886–1.321) | 0.440 |
|
PRICKLE1a | 1.159
(1.055–1.274) | 0.002d | 1.193
(1.017–1.400) | 0.030b |
| ABCA8a | 1.125
(1.022–1.238) | 0.016b | 1.028
(0.879–1.201) | 0.731 |
| SLIT2a | 1.118
(1.018–1.228) | 0.020b | 0.976
(0.791–1.204) | 0.821 |
| EFEMP1a | 1.125
(1.023–1.236) | 0.015b | 1.042
(0.854–1.270) | 0.688 |
Risk stratification model using
predictive variables
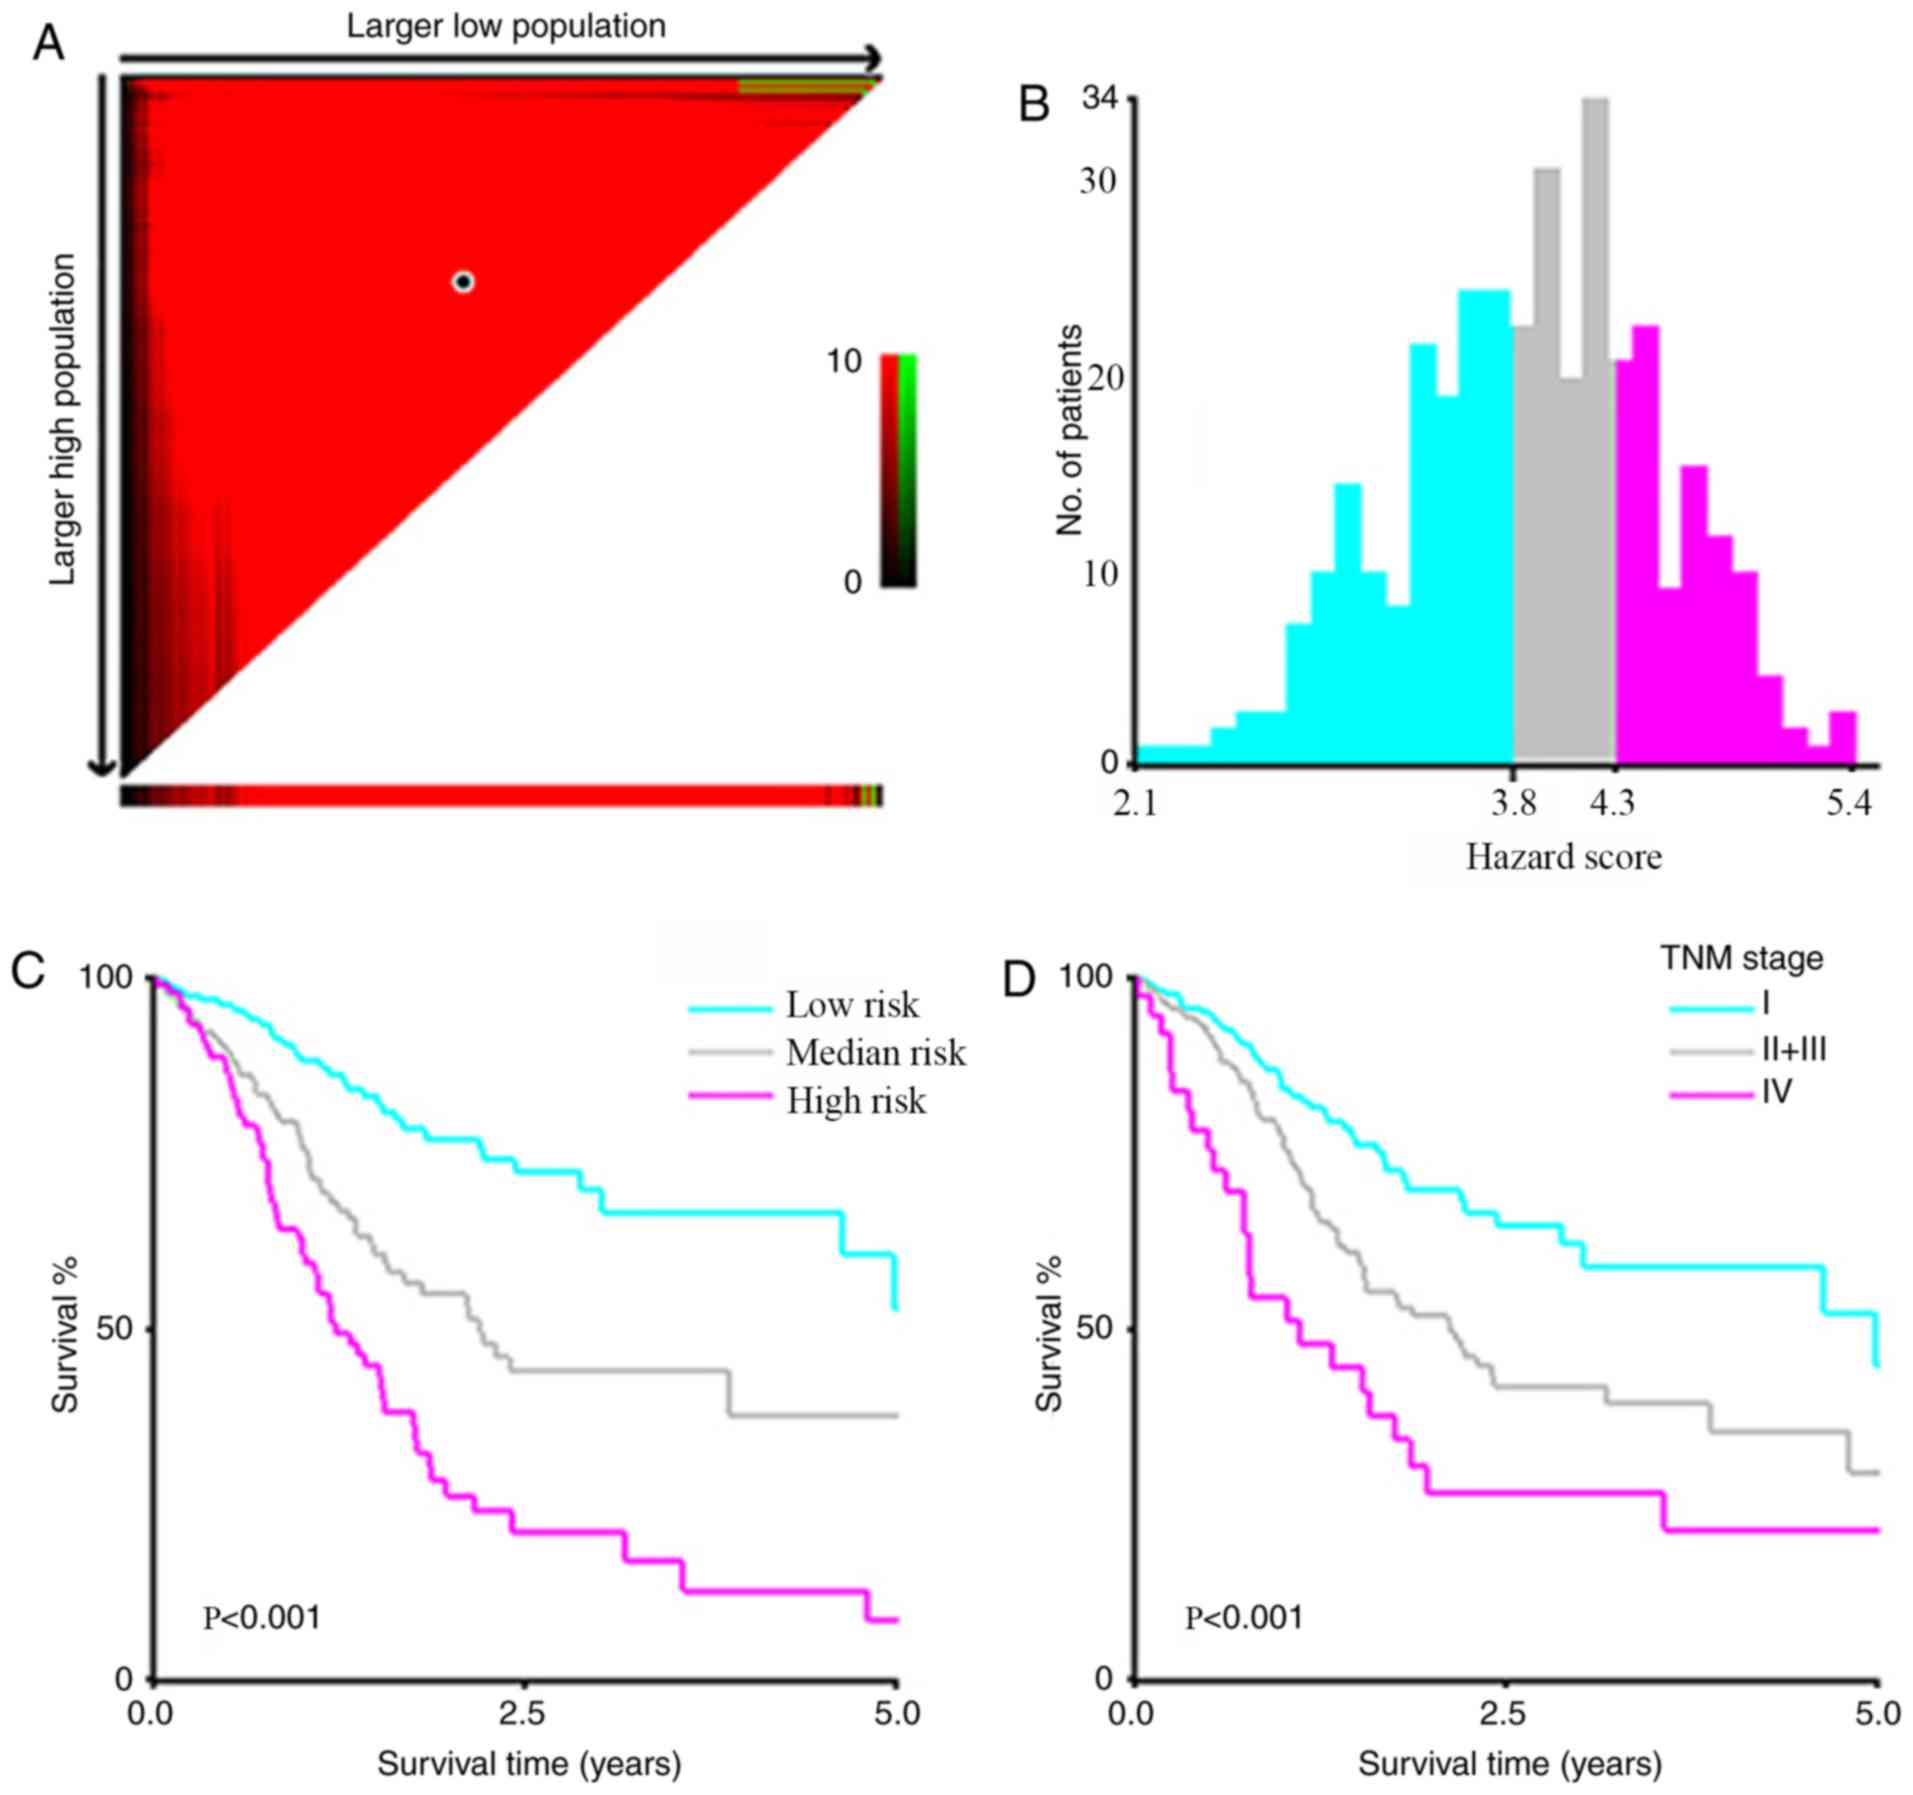
A risk stratification model was developed including
the three statistically significant predictors identified using
multivariate Cox regression analysis (age, TNM stage and
PRICKLE1 expression). A prognostic index (PI) was introduced
to the risk stratification, which was calculated as follows: 0.532
× TNM stage (stage 1–4) + 0.031 × age (years) + 0.160 ×
PRICKLE1 expression (graded on a 1–6 scale). X-tile software
was used to calculate cutoff values of PI 3.8 and 4.3 to divide
patients into low- (PI<3.8), medium- (4.3>PI≥3.8) and
high-risk (PI≥4.3) signatures that could most effectively
discriminate among differences in OS (Fig. 4A-C). Kaplan-Meier analysis according
to the risk stratification based on the PI value exhibited a higher
efficiency for discriminating OS than that based on TNM stage alone
(stage IV vs. stage II + III vs. stage I) (Fig. 4D).
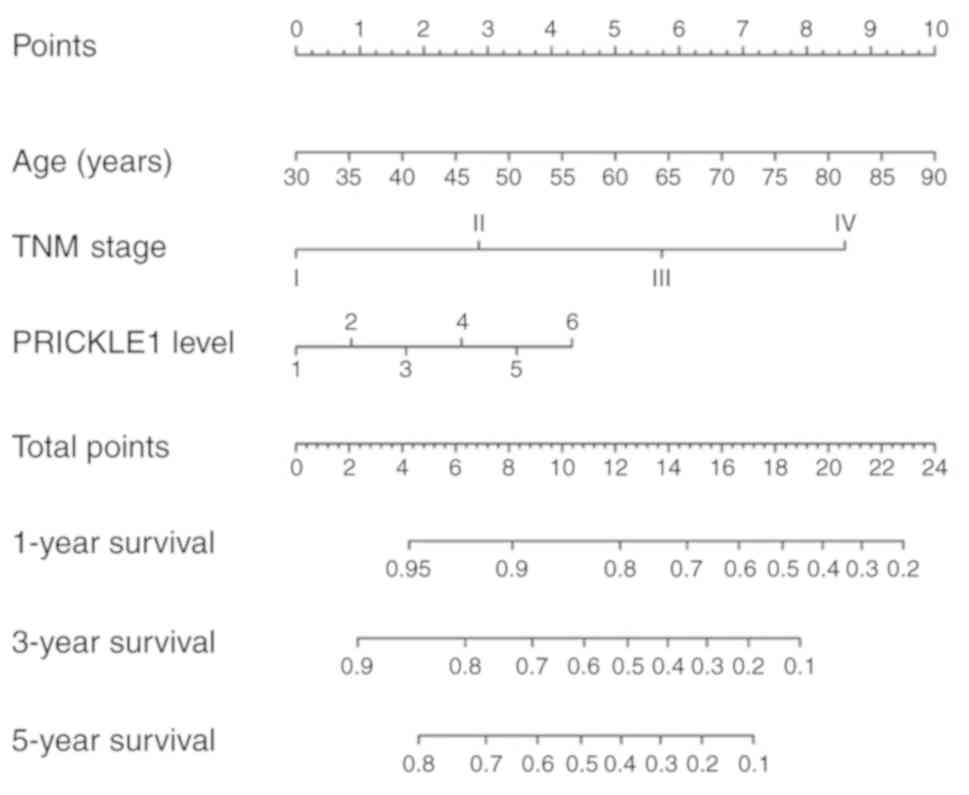
Construction of a nomogram model
including PRICKLE1 expression
To visualize the predictive model, a nomogram for
predicting the OS of patients with gastric cancer was constructed
(Fig. 5). The significant predictors
identified during the multivariate analysis (age, TNM stage and
PRICKLE1 expression) were used to build the model. Points
were assigned for each patient based on each of the three
predictors and were summed. The total points were then used to
predict the probabilities of 1-, 3- and 5-year OS, which are
displayed at the bottom of the nomogram.
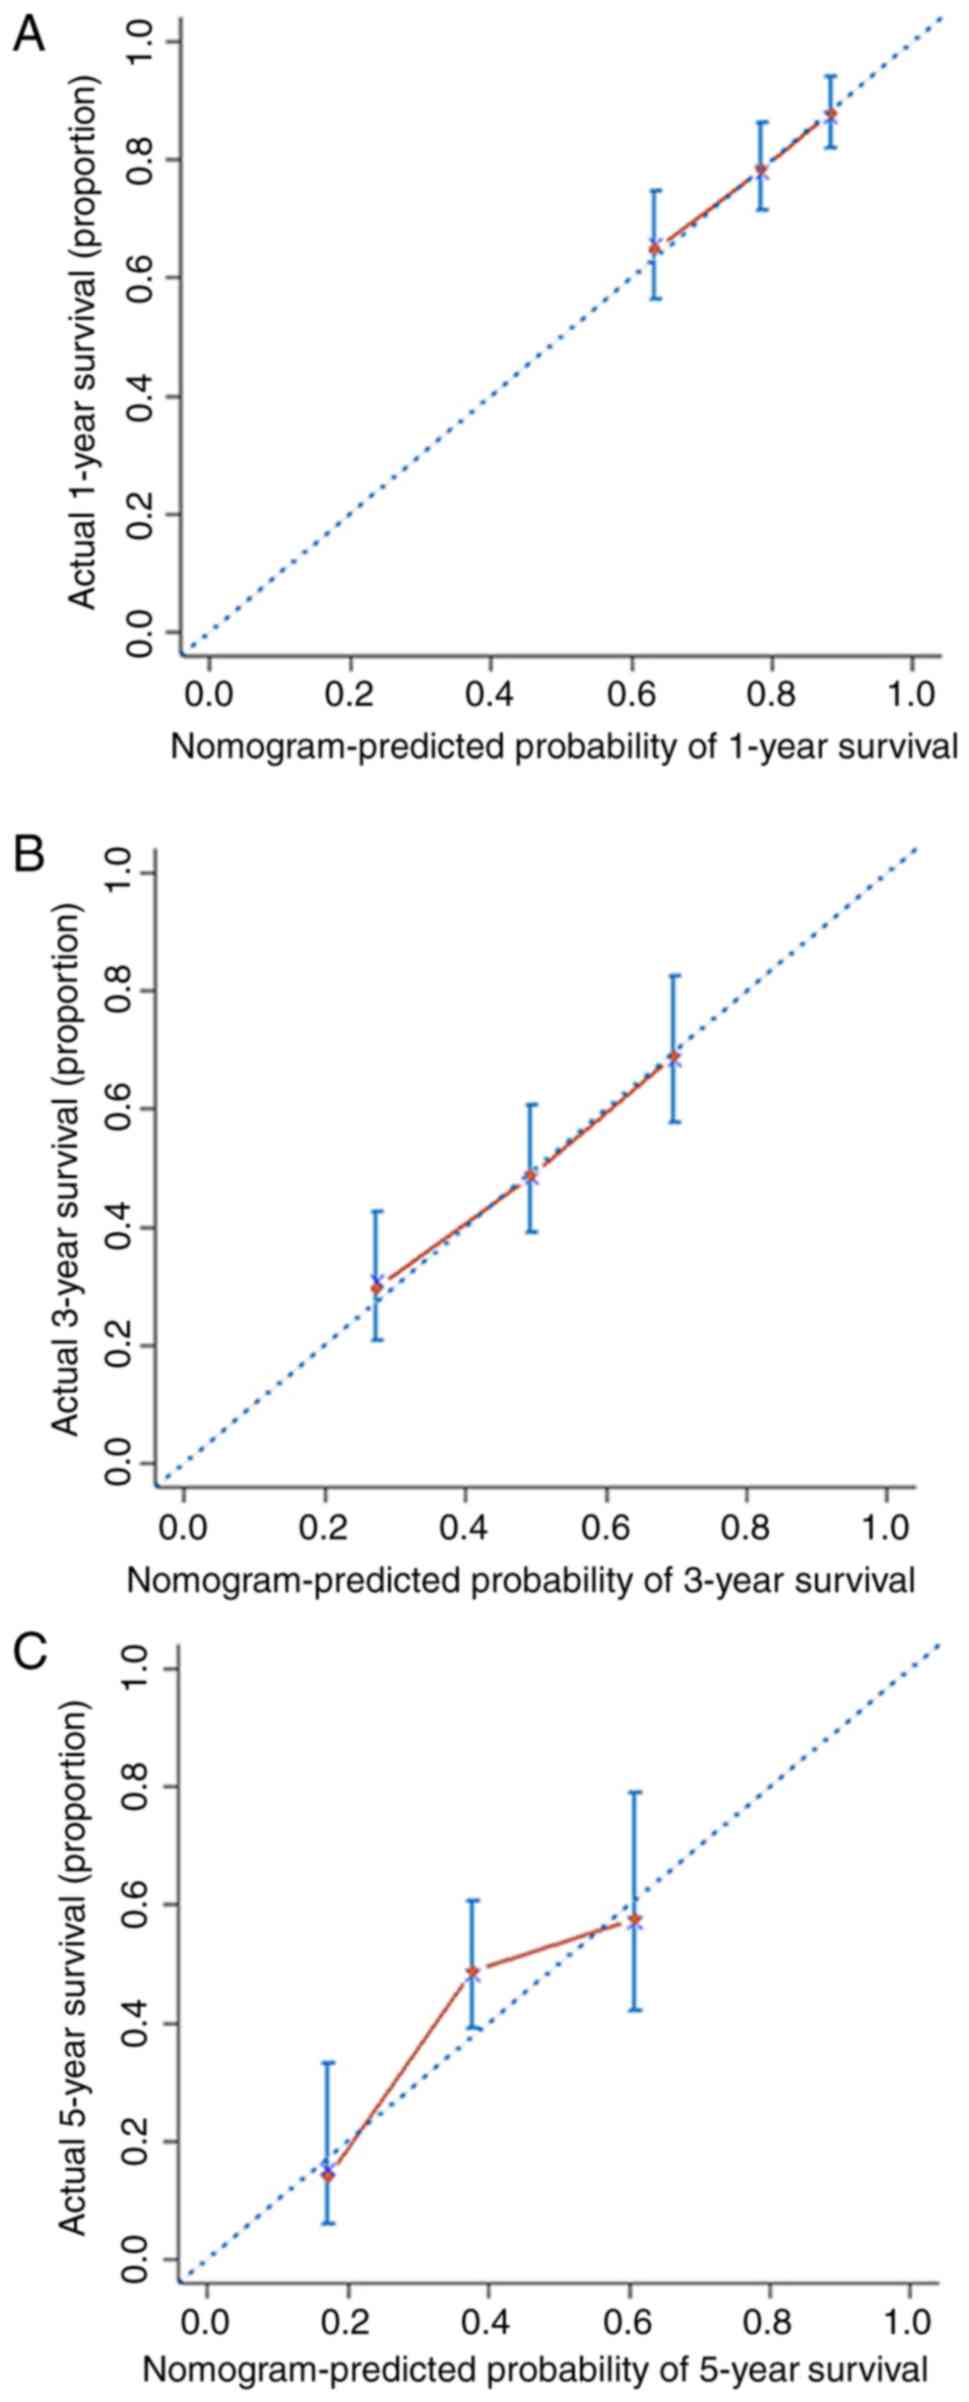
The nomogram was internally validated using the
C-index and calibration curves. The C-index of the nomogram was
0.66 (95% CI, 0.61–0.71). The calibration curves of 1-, 3- and
5-year OS obtained from the nomogram are shown in the calibration
plot in Fig. 6, indicating the
relatively high consistency of this model.
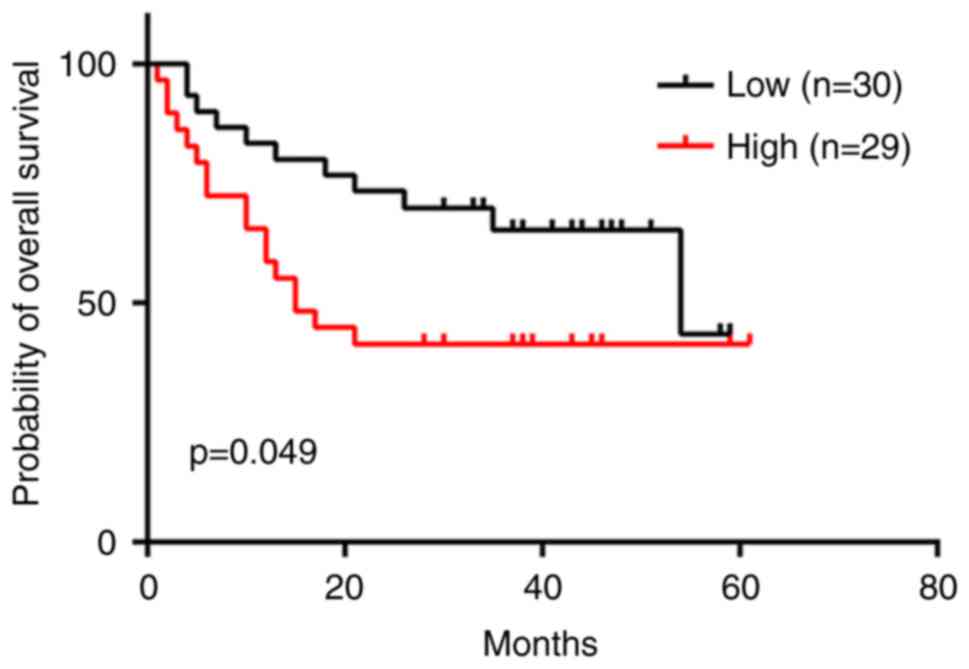
Validation of the prognostic value of
PRICKLE1 in an independent cohort
The performance of the nomogram was externally
validated using RT-qPCR to determine the expression level of
PRICKLE1 in a cohort of 59 patients who underwent curative
or palliative gastric cancer resection at the First Affiliated
Hospital of Zhejiang University. There was a significant
association between a high expression level of PRICKLE1 and
lymph node metastasis (Table II).
Tumors were grouped according to high or low expression of
PRICKLE1 using the median value as the cut-off (median
PRICKLE1ΔCq=−8.60; prickle/GAPDH ratio=0.00257).
Kaplan-Meier analysis showed that a high expression level of
PRICKLE1 was significantly associated with a poor prognosis
(hazard ratio, 2.087; 95% CI, 1.016–4.544; P<0.05; Fig. 7). In this cohort, the C-index of the
external validation was 0.63 (95% CI, 0.52–0.74), supporting the
result of the internal validation.
| Table II.Association of PRICKLE1 expression
with clinicopathological features. |
Table II.
Association of PRICKLE1 expression
with clinicopathological features.
|
| PRICKLE1
expression, n (%) |
|
|---|
|
|
|
|
|---|
| Clinicopathological
features | Low (n=30) | High (n=29) | P-value |
|---|
| Sex |
|
| 0.9367a |
|
Male | 22 (73.33) | 21 (72.41) |
|
|
Female | 8 (26.67) | 8 (27.59) |
|
| Age, years |
|
| 0.0510a |
|
≤65 | 11 (36.67) | 18 (62.07) |
|
|
>65 | 19 (63.33) | 11 (37.93) |
|
| TNM stage |
|
| 0.0776a |
|
I–II | 15 (50.00) | 8 (27.59) |
|
|
III–IV | 15 (50.00) | 21 (72.41) |
|
| T stage |
|
| 0.2184a |
|
T1-2 | 14 (46.67) | 9 (31.03) |
|
|
T3-4 | 16 (53.33) | 20 (68.97) |
|
| N stage |
|
| 0.0205b,c |
| N0 | 12 (40.00) | 3 (10.34) |
|
|
N1-3 | 18 (60.00) | 26 (89.66) |
|
| M stage |
|
| 0.2713b |
| M0 | 27 (90.00) | 22 (75.86) |
|
| M1 | 3 (10.00) | 7 (24.14) |
|
|
Differentiation |
|
| 0.3007b |
| Well to
moderately | 7 (23.33) | 3
(10.71)d |
|
|
Poorly | 23 (76.67) | 25
(89.29)d |
|
|
Missing |
| 1 |
|
Discussion
In the present study, a bioinformatics analysis was
conducted on transcriptomic data retrieved from TCGA database to
screen for candidate genes associated with the tumor aggressiveness
and prognosis of patients with gastric cancer. The screened
candidate genes, SPON1, THBS4, SVEP1, PRICKLE1, ABCA8, SLIT2
and EFEMP1 all exhibited significant associations with a
poorer prognosis of gastric cancer. Multivariate Cox regression
analysis of the candidate genes revealed that PRICKLE1 was
an independent predictor for the OS of patients with gastric
cancer. Therefore, a nomogram was constructed including
PRICKLE1 expression level as a factor to predict OS for
patients with gastric cancer. As an external validation method, the
nomogram was tested in an independent cohort of 59 patients with
gastric cancer and exhibited promising results.
To improve the efficiency of the screening process,
strict criteria were implemented in the present study. Genes with
an adjusted P-value of <0.05 and an absolute fold-change of
>2 were classified as DEGs. Significantly DEGs between certain
TNM stages and histological grades were then identified, and the
seven DEGs common to both categories were selected for further
analysis. Notably, the two sets of DEGs identified by the two
different strategies included several genes that are associated
with cancer, including FAP, FGF2 and IGF1. FAP
encodes fibroblast activation protein α, which is upregulated in
cancer-associated fibroblasts, representing the predominant
component of the stroma in various types of cancer (26), and regulates the invasion and
migration of gastric cancer cells (27). Fibroblast growth factor 2 (encoded by
FGF2) serves key roles in tumorigenesis and tumor
progression and may also serve as a prognostic indicator in gastric
cancer (28). Insulin-like growth
factor 1 (encoded by IGF1) induces epithelial-mesenchymal
transition in gastric cancer and its expression indicates a poor
prognosis (29,30). The identification of these genes as
DEGs lends support to the reliability of the screening method
used.
The functions and clinical indications of the 7
selected candidate genes in the discovery stage were investigated
in the literature. SPON1 encodes a secreted extracellular
matrix (ECM) glycoprotein (F-spondin/VSGP) and has been reported to
promote metastasis in human osteosarcoma (31). THBS4 encodes thrombospondin-4,
which influences cellular migration, adhesion, attachment and
proliferation (32). THBS4 is
upregulated in cancer-associated fibroblasts in invasive breast
cancer (33); moreover, it is
upregulated in the ECM of diffuse-type gastric cancer (34). SVEP1 encodes a multidomain
cell adhesion protein that has been demonstrated to mediate
cell-cell adhesion in osteogenic cells (35) and serves a critical role in epidermal
differentiation (36). However, its
function in relation to carcinogenesis has not yet been
investigated. PRICKLE1 regulates planar cell polarity in
Drosophila as well as convergent extension in zebrafish and
Xenopus (37,38). PRICKLE1 has been demonstrated
to be required for tumor progression in a breast cancer xenograft
mouse model (39). Moreover, a
previous study revealed that its product, PRICKLE1, contributes to
breast cancer cell dissemination via interaction with mTORC2.
Furthermore, the upregulation of PRICKLE1 in basal breast
cancer is associated with poor metastasis-free survival (25). ABCA8 encodes a member of the
superfamily of ATP-binding cassette transporters. A high expression
level of ABCA8 in primary tumors was associated with a
reduced survival rate in patients with serous ovarian cancer
(40). SLIT2 encodes a
secreted protein that functions as a repulsive axon guidance cue by
interacting with the roundabout receptor (ROBO1). It was previously
reported that SLIT2 and ROBO1 are expressed in various malignant
solid tumors and influence cell proliferation, migration, apoptosis
and angiogenesis (41–43). EFEMP1 encodes a
multifunctional ECM protein (fibulin-3) that is critical in
maintaining the integrity of the basement membrane and the
structural stability of the ECM, which was implicated to be
correlated with the tumorigenicity of cervical and ovarian cancer,
and pancreatic adenocarcinoma (44–46).
In the current study, Cox regression analysis
revealed that PRICKLE1 expression was an independent
prognostic factor for OS in patients with gastric cancer. Previous
studies have revealed the functions of PRICKLE1 and its
potential roles in cancer progression. PRICKLE1 is a
regulator of the planar cell polarity signaling pathway, which
serves multiple roles in epithelial tissue morphogenesis during
embryonic development and also in abnormal tissue polarity,
invasion and metastasis in breast cancer (39,47).
Daulat et al (25) revealed
that PRICKLE1 interacts with RICTOR, a member of the mTORC2
complex, to form a complex required for AKT activation, the
regulation of focal adhesions and cancer cell dissemination. The
study further indicated that PRICKLE1 is upregulated in
basal breast cancer, and that its upregulation is correlated with a
poor prognosis. Furthermore, the expression of PRICKLE1 mRNA
positively correlated with AKT phosphorylation in basal breast
cancer (25). Since the planar cell
polarity signaling pathway is involved in gastric cancer (47) and aberrant activation of AKT is a key
molecular signature in various human malignancies, including
gastric cancer, PRICKLE1 may influence the AKT-mediated
tumorigenesis of gastric cancer. However, further research is
needed to reveal the biological function of PRICKLE1 and its
underlying mechanistic association with gastric cancer
progression.
The most commonly used prognostic prediction system
for gastric cancer is the TNM staging (2). In addition, recent studies have
explored new prognostic prediction systems from the perspective of
omics analysis. For instance, Li et al (48) identified a seven-miRNA signature via
miRNA expression profile analysis and validated the association of
this signature with relapse-free survival and OS among patients
with gastric cancer. Additionally, Wang et al (9) developed a novel gene expression-based
prognostic scoring system to predict survival in gastric cancer.
However, it is not sufficient to only include omics data as the
prognostic variables of patients with gastric cancer. Crucial
clinical information (e.g., age and TNM stage) should also be
considered carefully. Several studies have combined genetic and
clinical variables to determine the prognosis of patients (18,22,49), but
the genes evaluated by the majority of these studies were derived
from literature reviews. In the present study, identification of
new survival-associated genes using RNA-seq expression data from
TCGA was performed. In addition, a Cox regression model including
age, TNM stage and PRICKLE1 expression revealed a good
predictive power for OS in patients with gastric cancer. Liu et
al (18) revealed that
Jagged1 was a potential prognostic biomarker for OS and that
it could be integrated with tumor depth (T stage), lymph node
metastasis (N stage) and distant metastasis (M stage).
Recently, nomograms have been constructed and
verified to be more accurate than the conventional staging systems
in predicting the prognosis of patients with a variety of cancer
types (11,50). In the present study, the factors
integrated in the nomogram were independent predictors for OS,
selected using multivariate Cox analysis. The C-index for the
constructed nomogram was higher than that of TNM stage, with an
8.2% increase, indicating that the nomogram performed better in
predicting OS in patients with gastric cancer. Moreover, the
ability of this model to discriminate among patients with different
prognoses was intuitively shown through risk stratification. Liu
et al (18) constructed a
nomogram integrating Jagged1 expression and TNM stage, which
had a C-index of 0.718. However, few patients with gastric cancer
at TNM stage IV were included in their study [6/302 (2.0%) vs.
40/406 (9.9%) in the current study], which imposes certain
limitations for interpreting the clinical application of the
results. Although the studies by Wang et al (17) and Liu et al (18) developed nomograms that included gene
expression data, they did not conduct external validation, which is
essential for ensuring the external applicability of a model. The
nomogram produced in the present study was subjected to stringent
external validation and exhibited high consistency between the
predicted and observed results for OS in patients with gastric
cancer.
To the best of our knowledge, this is the first
study to screen survival-associated genes, along with their
validation and combination with clinicopathological variables in
order to construct a nomogram to predict the prognosis of patients
with gastric cancer. In the study, seven genes were identified with
prognostic value for predicting the OS of patients with gastric
cancer. The PRICKLE1-based nomogram was developed and was capable
of predicting the 1-, 3- and 5-year OS probability for patients
with gastric cancer. The lack of validation of the other candidate
genes in the present study is a limitation and should be further
explored in future studies. In conclusion, the nomogram showed
improved predictive accuracy when compared with the conventional
TNM classification. The accuracy of the model was externally
validated in a cohort from a single institute and indicated good
applicability in this population.
Supplementary Material
Supporting Data
Acknowledgements
Not applicable.
Funding
The present study was supported by the Natural
Science Foundation of Zhejiang Province (grant nos. LZ16H160001,
LY15H160026 and LY15H160013).
Availability of data and materials
The databases used during the present study are
available as follows: The Kaplan-Meier plotter database, http://kmplot.com/analysis/; TCGA, https://www.cancer.gov/. All data generated or
analyzed during this study are included in this published
article.
Authors' contributions
LT designed and supervised the study. YD, YC, MW and
YH analysed the data. YD, YC, MW, LL and XY analysed the data and
prepared the figures and tables. NX collected the clinical samples.
YC, HYW, XY and HHW conducted the qPCR. YD, YC, MW and NX wrote the
manuscript. YD, YC, XY, NX and LT revised the manuscript. All
authors read and approved the final manuscript.
Ethics approval and consent to
participate
This study was approved by the institutional review
boards of the First Affiliated Hospital of Zhejiang University
(approval no. 2017-860). Written informed consent was obtained from
each patient for sample collection and analysis.
Patient consent for publication
Not applicable.
Competing interests
The authors declare that they have no competing
interests.
References
|
1
|
Torre LA, Bray F, Siegel RL, Ferlay J,
Lortet-Tieulent J and Jemal A: Global cancer statistics, 2012. CA
Cancer J Clin. 65:87–108. 2015. View Article : Google Scholar : PubMed/NCBI
|
|
2
|
Amin MB, Greene FL, Edge SB, Compton CC,
Gershenwald JE, Brookland RK, Meyer L, Gress DM, Byrd DR and
Winchester DP: The eighth edition AJCC cancer staging manual:
Continuing to build a bridge from a population-based to a more
‘personalized’ approach to cancer staging. CA Cancer J Clin.
67:93–99. 2017. View Article : Google Scholar : PubMed/NCBI
|
|
3
|
Nagtegaal ID, Odze RD, Klimstra D, Paradis
V, Rugge M, Schirmacher P, Washington KM, Carneiro F and Cree IA;
WHO Classification of Tumours Editorial Board, : The 2019 WHO
classification of tumours of the digestive system. Histopathology.
76:182–188. 2020. View Article : Google Scholar : PubMed/NCBI
|
|
4
|
Jørgensen JT and Hersom M: HER2 as a
prognostic marker in gastric cancer-A systematic analysis of data
from the literature. J Cancer. 3:137–144. 2012. View Article : Google Scholar : PubMed/NCBI
|
|
5
|
Jørgensen JT: Role of human epidermal
growth factor receptor 2 in gastric cancer: Biological and
pharmacological aspects. World J Gastroenterol. 20:4526–4535. 2014.
View Article : Google Scholar : PubMed/NCBI
|
|
6
|
Oh SY, Kwon HC, Kim SH, Jang JS, Kim MC,
Kim KH, Han JY, Kim CO, Kim SJ, Jeong JS and Kim HJ:
Clinicopathologic significance of HIF-1alpha, p53, and VEGF
expression and preoperative serum VEGF level in gastric cancer. BMC
Cancer. 8:1232008. View Article : Google Scholar : PubMed/NCBI
|
|
7
|
Barrett T, Wilhite SE, Ledoux P,
Evangelista C, Kim IF, Tomashevsky M, Marshall KA, Phillippy KH,
Sherman PM, Holko M, et al: NCBI GEO: Archive for functional
genomics data sets-update. Nucleic Acids Res. 41:(Database Issue).
D991–D995. 2013. View Article : Google Scholar : PubMed/NCBI
|
|
8
|
Gao J, Aksoy BA, Dogrusoz U, Dresdner G,
Gross B, Sumer SO, Sun Y, Jacobsen A, Sinha R, Larsson E, et al:
Integrative analysis of complex cancer genomics and clinical
profiles using the cBioPortal. Sci Signal. 6:pl12013. View Article : Google Scholar : PubMed/NCBI
|
|
9
|
Wang P, Wang Y, Hang B, Zou X and Mao JH:
A novel gene expression-based prognostic scoring system to predict
survival in gastric cancer. Oncotarget. 7:55343–55351.
2016.PubMed/NCBI
|
|
10
|
Iasonos A, Schrag D, Raj GV and Panageas
KS: How to build and interpret a nomogram for cancer prognosis. J
Clin Oncol. 26:1364–1370. 2008. View Article : Google Scholar : PubMed/NCBI
|
|
11
|
Balachandran VP, Gonen M, Smith JJ and
DeMatteo RP: Nomograms in oncology: More than meets the eye. Lancet
Oncol. 16:e173–e180. 2015. View Article : Google Scholar : PubMed/NCBI
|
|
12
|
Lai JF, Kim S, Kim K, Li C, Oh SJ, Hyung
WJ, Rha SY, Chung HC, Choi SH, Wang LB and Noh SH: Prediction of
recurrence of early gastric cancer after curative resection. Ann
Surg Oncol. 16:1896–1902. 2009. View Article : Google Scholar : PubMed/NCBI
|
|
13
|
Kim JH, Kim HS, Seo WY, Nam CM, Kim KY,
Jeung HC, Lai JF, Chung HC, Noh SH and Rha SY: External validation
of nomogram for the prediction of recurrence after curative
resection in early gastric cancer. Ann Oncol. 23:361–367. 2012.
View Article : Google Scholar : PubMed/NCBI
|
|
14
|
Chen D, Jiang B, Xing J, Liu M, Cui M, Liu
Y, Wang Z, Chen L, Yang H, Zhang C, et al: Validation of the
memorial Sloan-Kettering Cancer Center nomogram to predict
disease-specific survival after R0 resection in a Chinese gastric
cancer population. PLoS One. 8:e760412013. View Article : Google Scholar : PubMed/NCBI
|
|
15
|
Deng Q, He B, Liu X, Yue J, Ying H, Pan Y,
Sun H, Chen J, Wang F, Gao T, et al: Prognostic value of
pre-operative inflammatory response biomarkers in gastric cancer
patients and the construction of a predictive model. J Transl Med.
13:662015. View Article : Google Scholar : PubMed/NCBI
|
|
16
|
Han DS, Suh YS, Kong SH, Lee HJ, Choi Y,
Aikou S, Sano T, Park BJ, Kim WH and Yang HK: Nomogram predicting
long-term survival after d2 gastrectomy for gastric cancer. J Clin
Oncol. 30:3834–3840. 2012. View Article : Google Scholar : PubMed/NCBI
|
|
17
|
Wang X, Zhang H, He H, Shen Z, Tang Z, Xu
J and Sun Y: Prognostic value of stromal cell-derived factor 1
expression in patients with gastric cancer after surgical
resection. Cancer Sci. 105:1447–1456. 2014. View Article : Google Scholar : PubMed/NCBI
|
|
18
|
Liu H, Zhang H, Shen Z, Wang X, Wang Z, Xu
J and Sun Y: Expression of Jagged1 predicts postoperative clinical
outcome of patients with gastric cancer. Int J Clin Exp Med.
8:14782–14792. 2015.PubMed/NCBI
|
|
19
|
Zhu Y, Qiu P and Ji Y: TCGA-assembler:
Open-source software for retrieving and processing TCGA data. Nat
Methods. 11:599–600. 2014. View Article : Google Scholar : PubMed/NCBI
|
|
20
|
Anders S and Huber W: Differential
expression analysis for sequence count data. Genome Biol.
11:R1062010. View Article : Google Scholar : PubMed/NCBI
|
|
21
|
Camp RL, Dolled-Filhart M and Rimm DL:
X-tile: A new bio-informatics tool for biomarker assessment and
outcome-based cut-point optimization. Clin Cancer Res.
10:7252–7259. 2004. View Article : Google Scholar : PubMed/NCBI
|
|
22
|
Szász AM, Lánczky A, Nagy Á, Förster S,
Hark K, Green JE, Boussioutas A, Busuttil R, Szabó A and Győrffy B:
Cross-validation of survival associated biomarkers in gastric
cancer using transcriptomic data of 1,065 patients. Oncotarget.
7:49322–49333. 2016. View Article : Google Scholar : PubMed/NCBI
|
|
23
|
Harrell FE Jr: Rms: Regression modeling
strategies. R Package version 5.1–0. http://CRAN.Rproject.org/package=rms
|
|
24
|
Livak KJ and Schmittgen TD: Analysis of
relative gene expression data using real-time quantitative PCR and
the 2(-Delta Delta C(T)) method. Methods. 25:402–408. 2001.
View Article : Google Scholar : PubMed/NCBI
|
|
25
|
Daulat AM, Bertucci F, Audebert S, Sergé
A, Finetti P, Josselin E, Castellano R, Birnbaum D, Angers S and
Borg JP: PRICKLE1 contributes to cancer cell dissemination through
its interaction with mTORC2. Dev Cell. 37:311–325. 2016. View Article : Google Scholar : PubMed/NCBI
|
|
26
|
Jiang GM, Xu W, Du J, Zhang KS, Zhang QG,
Wang XW, Liu ZG, Liu SQ, Xie WY, Liu HF, et al: The application of
the fibroblast activation protein α-targeted immunotherapy
strategy. Oncotarget. 7:33472–33482. 2016.PubMed/NCBI
|
|
27
|
Wang RF, Zhang LH, Shan LH, Sun WG, Chai
CC, Wu HM, Ibla JC, Wang LF and Liu JR: Effects of the fibroblast
activation protein on the invasion and migration of gastric cancer.
Exp Mol Pathol. 95:350–356. 2013. View Article : Google Scholar : PubMed/NCBI
|
|
28
|
Fan L, Li W, Ying S, Shi L, Wang Z, Chen
G, Ye H, Wu X, Wu J, Liang G and Li X: A peptide derivative serves
as a fibroblast growth factor 2 antagonist in human gastric cancer.
Tumour Biol. 36:7233–7241. 2015. View Article : Google Scholar : PubMed/NCBI
|
|
29
|
Li H, Xu L, Li C, Zhao L, Ma Y, Zheng H,
Li Z, Zhang Y, Wang R, Liu Y and Qu X: Ubiquitin ligase Cbl-b
represses IGF-I-induced epithelial mesenchymal transition via ZEB2
and microRNA-200c regulation in gastric cancer cells. Mol Cancer.
13:1362014. View Article : Google Scholar : PubMed/NCBI
|
|
30
|
Ge J and Chen Z, Wu S, Chen J, Li X, Li J,
Yin J and Chen Z: Expression levels of insulin-like growth factor-1
and multidrug resistance-associated protein-1 indicate poor
prognosis in patients with gastric cancer. Digestion. 80:148–158.
2009. View Article : Google Scholar : PubMed/NCBI
|
|
31
|
Chang H, Dong T, Ma X, Zhang T, Chen Z,
Yang Z and Zhang Y: Spondin 1 promotes metastatic progression
through Fak and Src dependent pathway in human osteosarcoma.
Biochem Biophys Res Commun. 464:45–50. 2015. View Article : Google Scholar : PubMed/NCBI
|
|
32
|
Stenina OI, Desai SY, Krukovets I, Kight
K, Janigro D, Topol EJ and Plow EF: Thrombospondin-4 and its
variants: Expression and differential effects on endothelial cells.
Circulation. 108:1514–1519. 2003. View Article : Google Scholar : PubMed/NCBI
|
|
33
|
McCart Reed AE, Song S, Kutasovic JR, Reid
LE, Valle JM, Vargas AC, Smart CE and Simpson PT: Thrombospondin-4
expression is activated during the stromal response to invasive
breast cancer. Virchows Arch. 463:535–545. 2013. View Article : Google Scholar : PubMed/NCBI
|
|
34
|
Förster S, Gretschel S, Jöns T, Yashiro M
and Kemmner W: THBS4, a novel stromal molecule of diffuse-type
gastric adenocarcinomas, identified by transcriptome-wide
expression profiling. Mod Pathol. 24:1390–1403. 2011. View Article : Google Scholar : PubMed/NCBI
|
|
35
|
Shur I, Socher R, Hameiri M, Fried A and
Benayahu D: Molecular and cellular characterization of SEL-OB/SVEP1
in osteogenic cells in vivo and in vitro. J Cell Physiol.
206:420–427. 2006. View Article : Google Scholar : PubMed/NCBI
|
|
36
|
Samuelov L, Li Q, Bochner R, Najor NA,
Albrecht L, Malchin N, Goldsmith T, Grafi-Cohen M, Vodo D, Fainberg
G, et al: SVEP1 plays a crucial role in epidermal differentiation.
Exp Dermatol. 26:423–430. 2017. View Article : Google Scholar : PubMed/NCBI
|
|
37
|
Takeuchi M, Nakabayashi J, Sakaguchi T,
Yamamoto TS, Takahashi H, Takeda H and Ueno N: The prickle-related
gene in vertebrates is essential for gastrulation cell movements.
Curr Biol. 13:674–679. 2003. View Article : Google Scholar : PubMed/NCBI
|
|
38
|
Veeman MT, Slusarski DC, Kaykas A, Louie
SH and Moon RT: Zebrafish prickle, a modulator of noncanonical
Wnt/Fz signaling, regulates gastrulation movements. Curr Biol.
13:680–685. 2003. View Article : Google Scholar : PubMed/NCBI
|
|
39
|
Luga V, Zhang L, Viloria-Petit AM,
Ogunjimi AA, Inanlou MR, Chiu E, Buchanan M, Hosein AN, Basik M and
Wrana JL: Exosomes mediate stromal mobilization of autocrine
Wnt-PCP signaling in breast cancer cell migration. Cell.
151:1542–1556. 2012. View Article : Google Scholar : PubMed/NCBI
|
|
40
|
Hedditch EL, Gao B, Russell AJ, Lu Y,
Emmanuel C, Beesley J, Johnatty SE, Chen X, Harnett P, George J, et
al: ABCA transporter gene expression and poor outcome in epithelial
ovarian cancer. J Natl Cancer Inst. 106(pii): dju1492014.PubMed/NCBI
|
|
41
|
Dunaway CM, Hwang Y, Lindsley CW, Cook RS,
Wu JY, Boothby M, Chen J and Brantley-Sieders DM: Cooperative
signaling between Slit2 and Ephrin-A1 regulates a balance between
angiogenesis and angiostasis. Mol Cell Biol. 31:404–416. 2011.
View Article : Google Scholar : PubMed/NCBI
|
|
42
|
Wang B, Xiao Y, Ding BB, Zhang N, Yuan XB,
Gui L, Qian KX, Duan S, Chen Z, Rao Y and Geng JG: Induction of
tumor angiogenesis by Slit-Robo signaling and inhibition of cancer
growth by blocking Robo activity. Cancer Cell. 4:19–29. 2003.
View Article : Google Scholar : PubMed/NCBI
|
|
43
|
Zhang QQ, Zhou DL, Lei Y, Zheng L, Chen
SX, Gou HJ, Gu QL, He XD, Lan T, Qi CL, et al: Slit2/Robo1
signaling promotes intestinal tumorigenesis through Src-mediated
activation of the Wnt/β-catenin pathway. Oncotarget. 6:3123–3135.
2015. View Article : Google Scholar : PubMed/NCBI
|
|
44
|
Chen J, Wei D, Zhao Y, Liu X and Zhang J:
Overexpression of EFEMP1 correlates with tumor progression and poor
prognosis in human ovarian carcinoma. PLoS One. 8:e787832013.
View Article : Google Scholar : PubMed/NCBI
|
|
45
|
Seeliger H, Camaj P, Ischenko I, Kleespies
A, De Toni EN, Thieme SE, Blum H, Assmann G, Jauch KW and Bruns CJ:
EFEMP1 expression promotes in vivo tumor growth in human pancreatic
adenocarcinoma. Mol Cancer Res. 7:189–198. 2009. View Article : Google Scholar : PubMed/NCBI
|
|
46
|
Song EL, Hou YP, Yu SP, Chen SG, Huang JT,
Luo T, Kong LP, Xu J and Wang HQ: EFEMP1 expression promotes
angiogenesis and accelerates the growth of cervical cancer in vivo.
Gynecol Oncol. 121:174–180. 2011. View Article : Google Scholar : PubMed/NCBI
|
|
47
|
Katoh M: WNT/PCP signaling pathway and
human cancer (Review). Oncol Rep. 14:1583–1588. 2005.PubMed/NCBI
|
|
48
|
Li X, Zhang Y, Zhang Y, Ding J, Wu K and
Fan D: Survival prediction of gastric cancer by a seven-microRNA
signature. Gut. 59:579–585. 2010. View Article : Google Scholar : PubMed/NCBI
|
|
49
|
Li YF, Wang DD, Zhao BW, Wang W, Huang CY,
Chen YM, Zheng Y, Keshari RP, Xia JC and Zhou ZW: High level of
COP1 expression is associated with poor prognosis in primary
gastric cancer. Int J Biol Sci. 8:1168–1177. 2012. View Article : Google Scholar : PubMed/NCBI
|
|
50
|
Wang Y, Li J, Xia Y, Gong R, Wang K, Yan
Z, Wan X, Liu G, Wu D, Shi L, et al: Prognostic nomogram for
intrahepatic cholangiocarcinoma after partial hepatectomy. J Clin
Oncol. 31:1188–1195. 2013. View Article : Google Scholar : PubMed/NCBI
|