Introduction
Liver cancer is the third most common cause of
cancer-associated mortality and the sixth most common type of human
cancer worldwide according to the global cancer statistic report in
2020 (1). The prognosis of patients
diagnosed with liver cancer is very poor, due to the severity of
the disease (2). Local ablation
therapy and surgical resection are only effective at the early
stages of liver cancer, and the disease recurs in the majority of
patients within 5 years. Other than sorafenib, there are no
effective chemotherapy for advanced disease (3). One of the limitations of anticancer
therapy is that a small number of residual tumor cells survive, via
autophagy, and repopulate in the host in the absence of stressors.
However, molecular targeted therapy may be a potential method for
prolonging the survival of patients with advanced liver cancer.
Recent studies have indicated that the autophagic
process represents a crucial anticancer mechanism, and enhancing
autophagy may be an important therapeutic approach to liver cancer
(4–6). The process of autophagy involves the
formation of double-membrane autophagosomes, followed by fusion of
the autophagosomes with lysosomes to form autolysosomes, and
degradation of the contents by lysosomal hydrolases (7). Autophagy may play a dual role in
tumors; although it may inhibit tumor progression by degrading
oncogenic proteins, autophagy may also assist tumor cells to
overcome metabolic stress (8).
Several anticancer drugs induce autophagy; however, it remains
unclear whether autophagy leads to therapeutic resistance or
enhances the antitumor activity of the drugs (9). TubeimosideI(TBMS) is a triterpenoid
saponin extracted from the tubers of Bolbostemma paniculatum. The
sugar chains of TBMS are linked by 3-hydroxy-3-methylglutaric acid
to form a distinct macrocyclic structure (10). TBMS has been shown to induce
apoptosis in a variety of human cancer cell lines (11,12).
However, the exact effect of TBMS on liver cancer cells remains
unclear and the underlying mechanism has yet to be elucidated.
The aim of the present study was to investigate the
mechanisms underlying the potent antitumor properties of TBMS, by
examining the role of TBMS in cell cycle progression and autophagy
in HepG2 cells, in order to determine whether its potential as an
alternative therapeutic strategy for liver cancer.
Materials and methods
Cell culture and drug treatment
HepG2 cells (cat. no. 72) were obtained from the
National Infrastructure of Cell Line Resource (Beijing, China) and
were authenticated using the STR profiling method. The cells were
cultured in Dulbecco's modified Eagle's medium supplemented with
10% fetal bovine serum (both from Gibco; Thermo Fisher Scientific,
Inc.) and incubated at 37°C in an atmosphere of 5% CO2
in air. The cells were seeded at a density of 2×10⁵
cells, 24 h prior to drug treatment. TBMS or Dorsomorphin [compound
C (CC)] (both purchased from Beyotime Institute of Biotechnology)
was dissolved in DMSO and the final concentration of DMSO was
maintained at 0.1%. For TBMS treatment, the indicated concentration
of TBMS was added to the cells for 24 h. For CC treatment, 4 µM of
CC was treated alone or together with TBMS for 24 h. Subsequently,
the cells were harvested for analysis.
Cell viability assay
Cell viability was assessed by the Cell Counting
Kit-8 (CCK-8, Beyotime Institute of Biotechnology) assay. In brief,
HepG2 cells were seeded at a density of 2,000 cells/well in 96-well
plates. The cells were untreated [negative control (NC) group] or
treated with TBMS at the indicated concentrations (0, 0.4, 1, 2, 4,
8, 12 and 16 µM). Cells in the 0 µM group were only treated with
DMSO and no TMBS. At 12, 24, 48 and 72 h, 10 µl of the kit reagent
was added to each well and incubated at 37°C for 2 h. Finally, all
plates were scanned by a microplate reader at 450 nm. Cell
viability was calculated on the basis of the absorption value.
RNA extraction and reverse
transcription-quantitative PCR (RT-qPCR) analysis
Total RNA was extracted using TRIzol®
reagent (Invitrogen; Thermo Fisher Scientific, Inc.). RNA (1 µg)
was then reverse transcribed to produce first-strand cDNA using the
PrimeScript RT Reagent kit (Takara Bio, Inc.), following the
manufacturer's instructions: Incubation at 42°C for 60 min and 95°C
for 5 min. cDNA was then used as the template for qPCR using
specific primers for Beclin 1, microtubule-associated protein 1
light chain 3 (LC3)-I, p53 and GAPDH. qPCR was conducted for 40
cycles, with 30 sec of denaturation at 95°C, and 1 min of annealing
and extension at 60°C. qPCR was performed with the SYBR Green qPCR
Master Mix (Takara Bio, Inc.) on IQ5 machine (Bio-Rad Laboratories,
Inc.). The analysis of gene expression was performed by Bio-Rad
Software Manager, version 1.5 (Bio-Rad Laboratories, Inc.). The
quantification of relative expression was performed using the 2
ΔΔCq method (13). The
primers for qPCR were listed as follows: Beclin-1, forward:
5′-ACCGTGTCACCATCCAGGAA-3′ and reverse:
5′-GAAGCTGTTGGCACTTTCTGT-3′; LC3, forward:
5′-GATGTCCGACTTATTCGAAGC-3′ and reverse:
5′-TTGAGCTGTAAGCGCCTTCTA-3′; p53, forward:
5′-AGAGTCTATAGGCCCACCCC-3′ and reverse: 5′-GCTCGACGCTAGGATCTGAC-3′;
GAPDH, forward: 5′-GAAATCCCATCACCATCTTCCAGG-3′ and reverse
5′-GAGCCCCAGCCTTCTCCATG-3′.
Western blot analysis
Cells were lysed with lysis buffer (120 mmol/l NaCl,
40 mmol/l Tris-HCl, 0.5% NP-40). The protein concentrations were
determined using a BCA kit (Beyotime Institute of Biotechnology).
Samples (40 µg protein) were subjected to 10% SDS-PAGE, and then
blotted onto PVDF membranes. The membranes were blocked with 5%
skimmed milk at room temperature for 1 h, and then probed with the
indicated primary antibodies against p-AMPK (dilution 1:500, cat.
no. ab23875, Abcam), AMPK (dilution 1:500, cat. no. ab32047,
Abcam), LC3-I (dilution 1:1,000, cat. no. ab128025, Abcam), LC3-II
(dilution 1:1,000, cat. no. ab62721, Abcam) or β-actin (dilution
1:10,000, cat. no. ab8227, Abcam) at 4°C overnight. The membranes
were washed and incubated with horseradish peroxidase-conjugated
goat anti-rabbit secondary antibodies (dilution 1:5,000, cat. no.
ab7090, Abcam) at room temperature for 1 h. Images were visualized
using the electrochemiluminescence (ECL) kit (Beyotime Institute
Biotechnology). Protein expression was normalized to the internal
control GAPDH gene expression. The expression of proteins was
quantified using densitometry analysis (ChemiDoc XRS+ gel imaging
system) and analyzed using ImageLab Software (version 3.0; BioRad
Laboratories, Inc.).
Cell cycle analysis
The effect of TBMS on the cell cycle in HepG2 cells
was determined by FACSCalibur flow cytometry (Becton Dickinson and
Company). Specifically, HepG2 cells were seeded at a density of
2×10⁵ cells/well. Following treatment with TBMS, the
cells were harvested with trypsinization and fixed with 70% ethanol
overnight at 4°C. The fixed cells were then resuspended in PBS
solution containing 20 µg/ml propidium iodide (PI; Nanjing KeyGen
Biotech Co., Ltd.), 0.5 mg/ml RNase and 1% fetal calf serum, and
incubated at 37°C for 30 min without light exposure. The cells were
finally analyzed using flow cytometry with FlowJo software (version
10, FlowJo, LLC).
Annexin V apoptosis assay
The effect of TBMS on the apoptosis in HepG2 cells
was analyzed using flow cytometry. HepG2 cells were seeded at a
density of 2×10⁵ cells/well. Following treatment with
TBMS, adherent cells were harvested by trypsinization and combined
with suspended cells. Subsequently, the cells were collected and
then resuspended in 500 µl of 1X Annexin V binding buffer (2.5 mM
CaCl2, 140 mM NaCl, and 10 mM HEPES). A total of 2 µl PI
(1 mg/ml) and 5 µl FITC-conjugated Annexin V were added to the
cells for 15 min at room temperature. The percentage of
FITC-positive cells was analyzed by flow cytometry using FlowJo
software version 10 (FlowJo, LLC).
Transmission electron microscopy
(TEM)
The cells were fixed in 0.1 mol/l phosphate buffer
(pH 7.4) containing 2.5% glutaraldehyde overnight at 4°C, followed
by the addition of 1% OsO4. Then, the fixed cells were
washed with PBS solution, dehydrated through different
concentrations (70, 80, 90 and 100%) of ethanol at room temperature
for 30 min, and embedded in epoxy resin. After dehydration, thin
sections (1 mm) were stained with lead citrate and uranyl acetate
for 30 min at 4°C, and observed under a transmission electron
microscope (100× magnification; JEM-2010; JEOL Ltd.). The images
were captured digitally and analyzed by Image Pro Plus7 software
(Media Cybernetics, Inc.). The mean number of autophagosomes per
cell was determined from a randomly selected pool of 15–20
fields.
Statistical analysis
Data are expressed as the mean ± standard deviation
from three independent experiments. Data analysis was performed
using GraphPad Prism 5 software (GraphPad Software, Inc.). One-way
ANOVA was used to analyze the comparisons among multiple groups,
followed by Tukey's post hoc test for correction. P<0.05 was
considered to indicate statistically significant differences.
Results
TBMS induces extensive intracellular
vacuolization and cell morphological changes
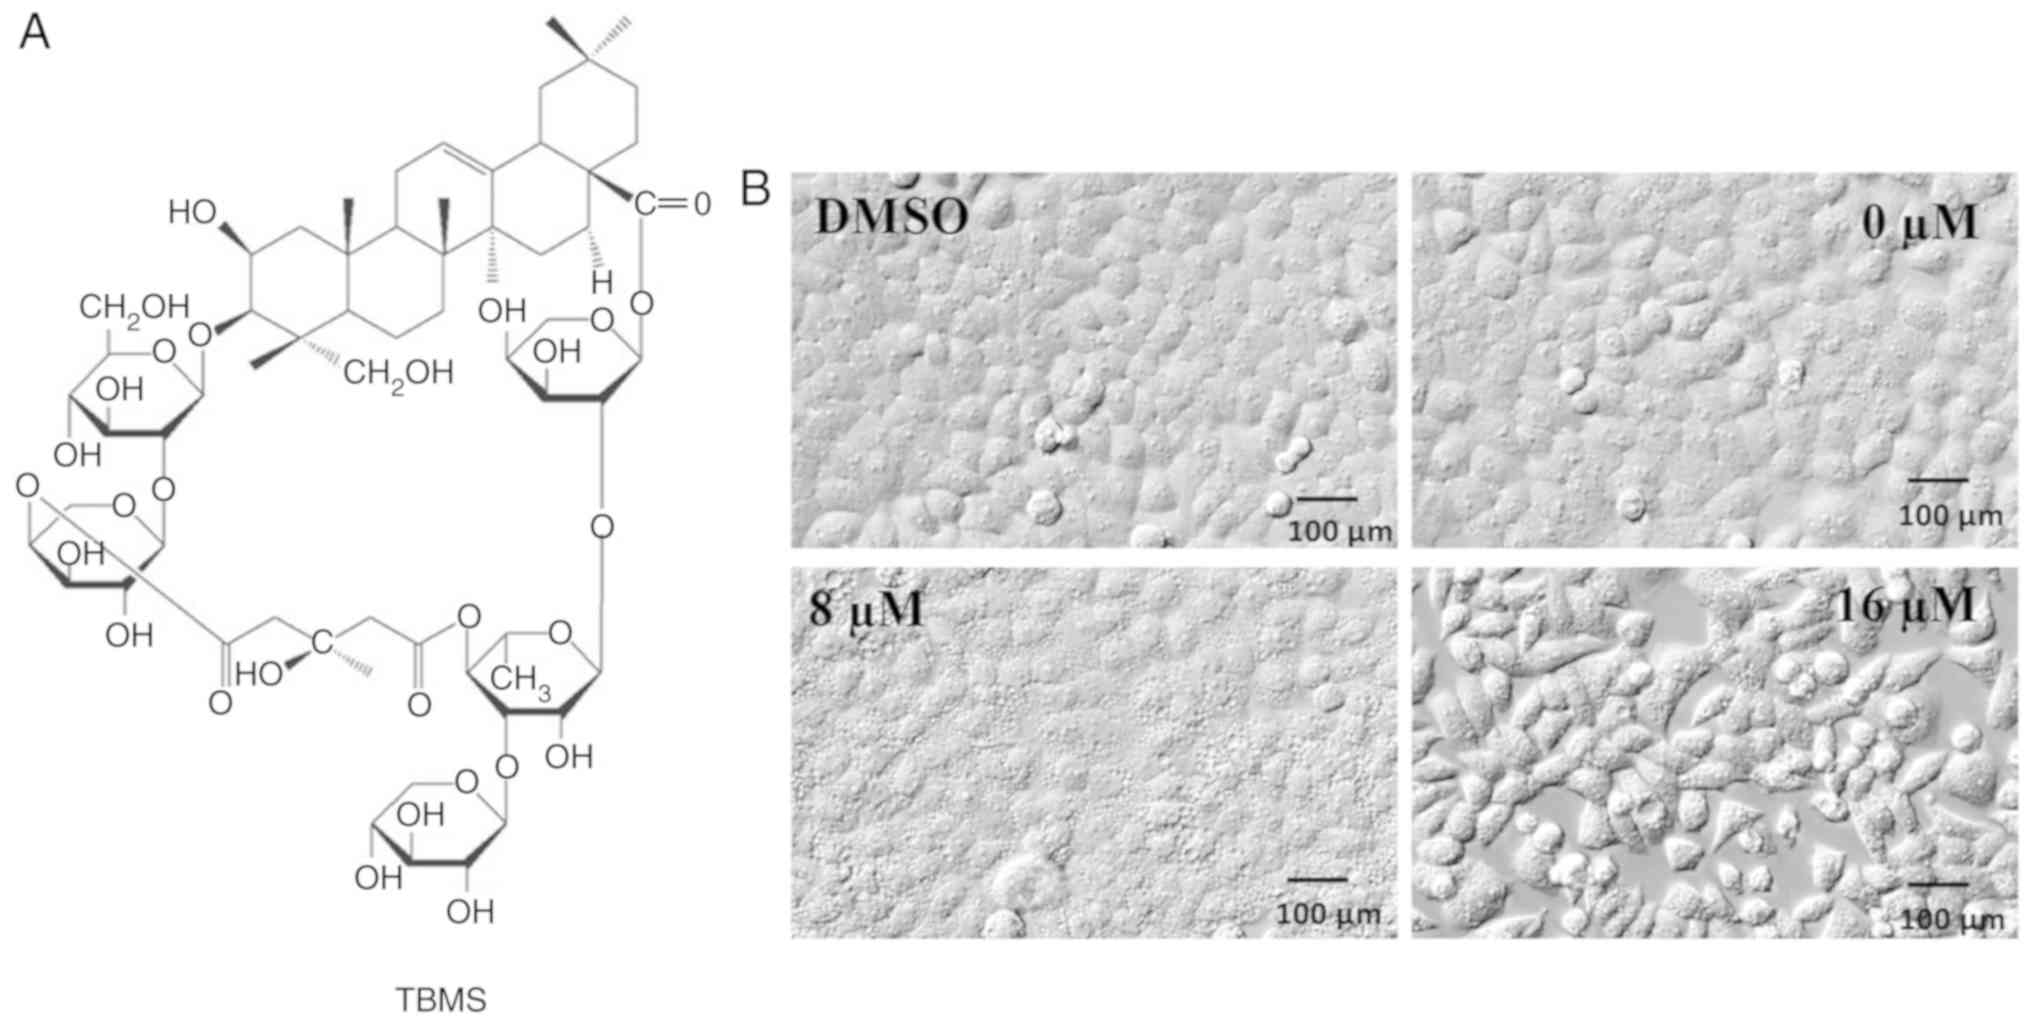
The chemical structure of TBMS is presented in
Fig. 1A. To examine the changes in
cell morphology in response to TBMS exposure, HepG2 liver cancer
cells were treated with either DMSO or TBMS at different
concentrations for 24 h. The cell morphologies were then captured
using an electron microscope (Fig.
1B). Following treatment with DMSO, HepG2 cells exhibited a
common epithelial-like shape with adherence. In the presence of 8
µM TBMS, HepG2 cells displayed extensive intracellular
vacuolization, which was observed as early as 12 h after drug
treatment. Of note, extensive vacuolization of cells may be
triggered by a moderate increase in drug concentration. Following
treatment with 16 µM TBMS, the cell morphology changed and the
cells assumed a spindled shape. These results demonstrated that
TBMS treatment induced morphological changes and intracellular
vacuolization in HepG2 cells.
TBMS causes S phase cell cycle
arrest
To investigate the cytotoxic properties of TBMS, the
effect of TBMS on HepG2 cell viability was examined using the CCK-8
assay. HepG2 cells were treated with TBMS at various concentrations
(0, 0.4, 1, 2, 4, 8, 12 and 16 µM) for different durations (12, 24,
48 and 72 h). As shown in Fig. 2A,
TBMS treatment markedly inhibited cell viability in a
concentration-dependent manner. Of note, although the viability of
HepG2 cells was concentration-dependently suppressed, with
prolonged time, all the cells treated with different concentrations
of TBMS survived, although their growth was inhibited. Notably,
there were no notable differences among the negative control (NC),
0, 0.4, 1 and 2 µM TBMS groups (Fig.
2B). Starting from the 4-µM group, the cell viability was
suppressed by TMBS in a dose-dependent manner. However, when the
concentration reached 16 µM, proliferation was significantly
inhibited at 48 h and did not proliferate at 72 h (P<0.01).
These results suggested that TBSM caused the cells to lose their
proliferative ability.
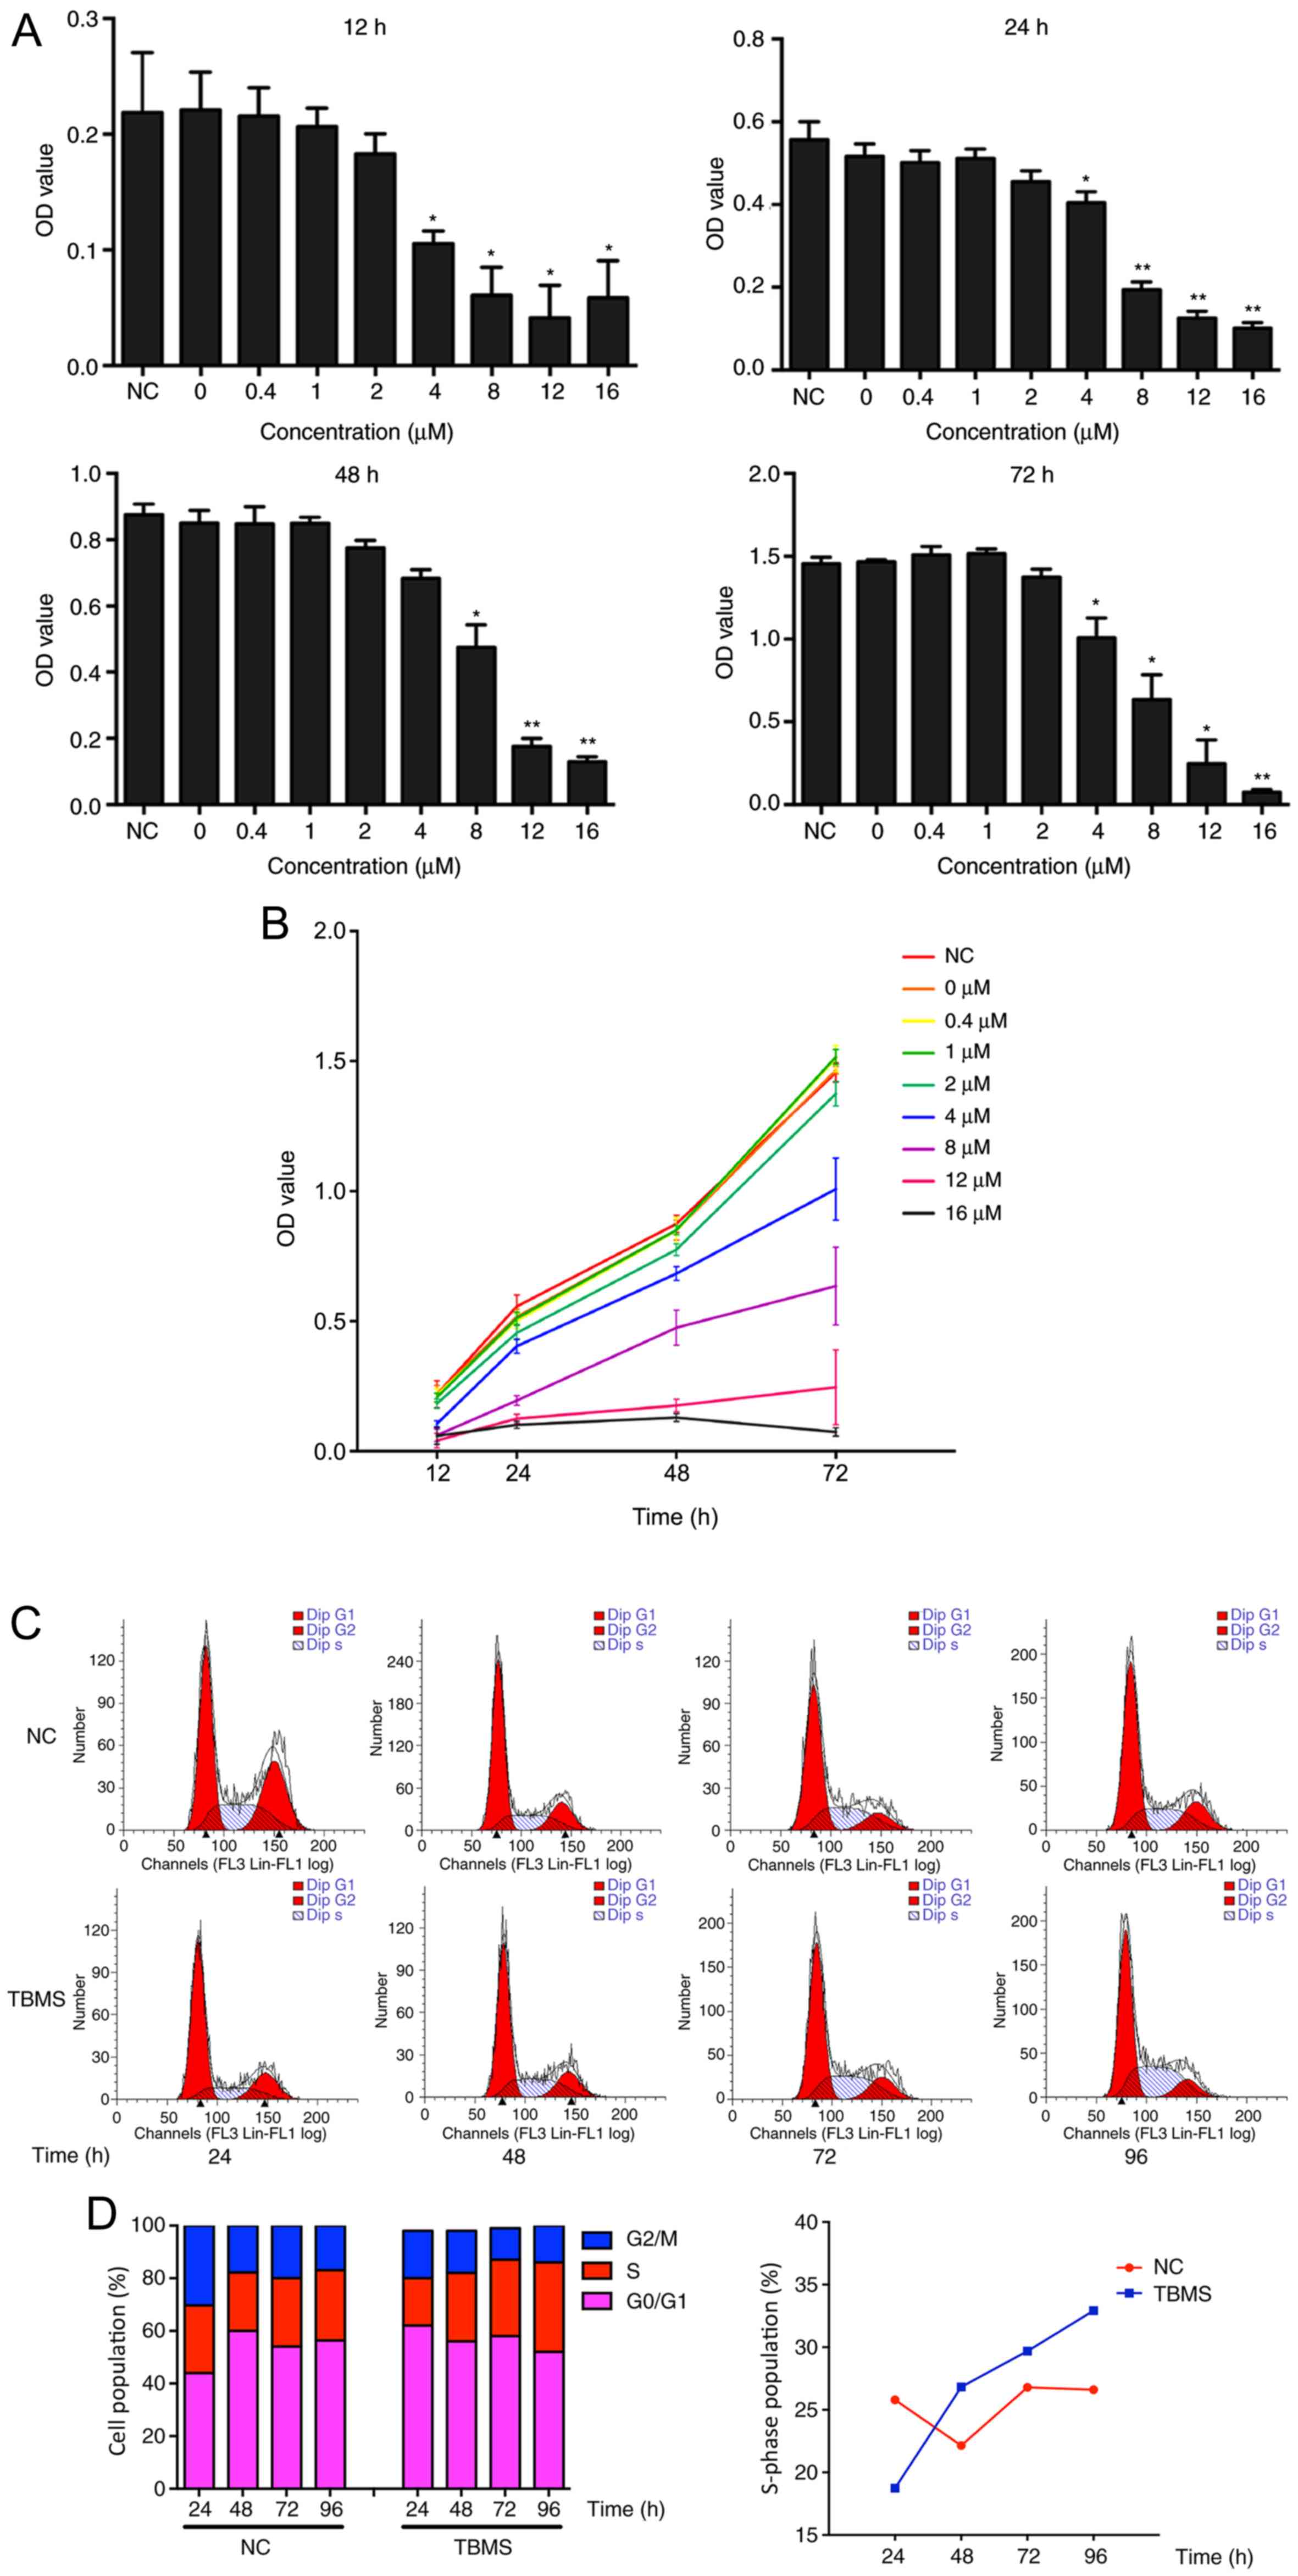 | Figure 2.TBMS causes cytotoxicity and S phase
cell cycle arrest in HepG2. (A) HepG2 cells were treated with TBMS
at various concentrations of 0, 0.4, 1, 2, 4, 8, 12 and 16 µM for
different durations (12, 24, 48, 72 h). The cytotoxicity of TBMS
was determined using CCK-8 assay. *P<0.05 and **P<0.01 vs.
NC. (B) The cells were treated with the different concentration of
TBMS for different durations. The cell growth was determined by
CCK-8 assay. (C) HepG2 cells were treated with DMSO (NC) or 16 µM
TBMS for 24, 48, 72 and 96 h. The cell cycle distribution was
analyzed by flow cytometry. (D) (Left) Quantification of cell cycle
distribution after TBMS treatment; (right) the percentage of S
phase in cells treated with NC or TBMS for different times. TBMS,
tubeimoside I; CCK-8, Cell Counting Kit-8; NC, negative
control. |
To further explore the effect of TBMS on cell cycle
progression, HepG2 cells were treated with 16 µM TBSM or DMSO
control for different durations, and flow cytometry analysis was
subsequently performed. As shown in Fig.
2C and D, TBMS treatment led to a time-dependent accumulation
of HepG2 cells in the S phase. Subsequently, prolonged treatment of
HepG2 cells resulted in a substantial increase in the percentage of
S phase cells, from 18.74% at 24 h to 32.93% at 96 h. In addition,
the S phase of the NC group exhibited no significant changes at 24
and 96 h. These data suggest that TBMS induces cell cycle arrest at
the S phase.
TBMS induces cell autophagy, but not
apoptosis
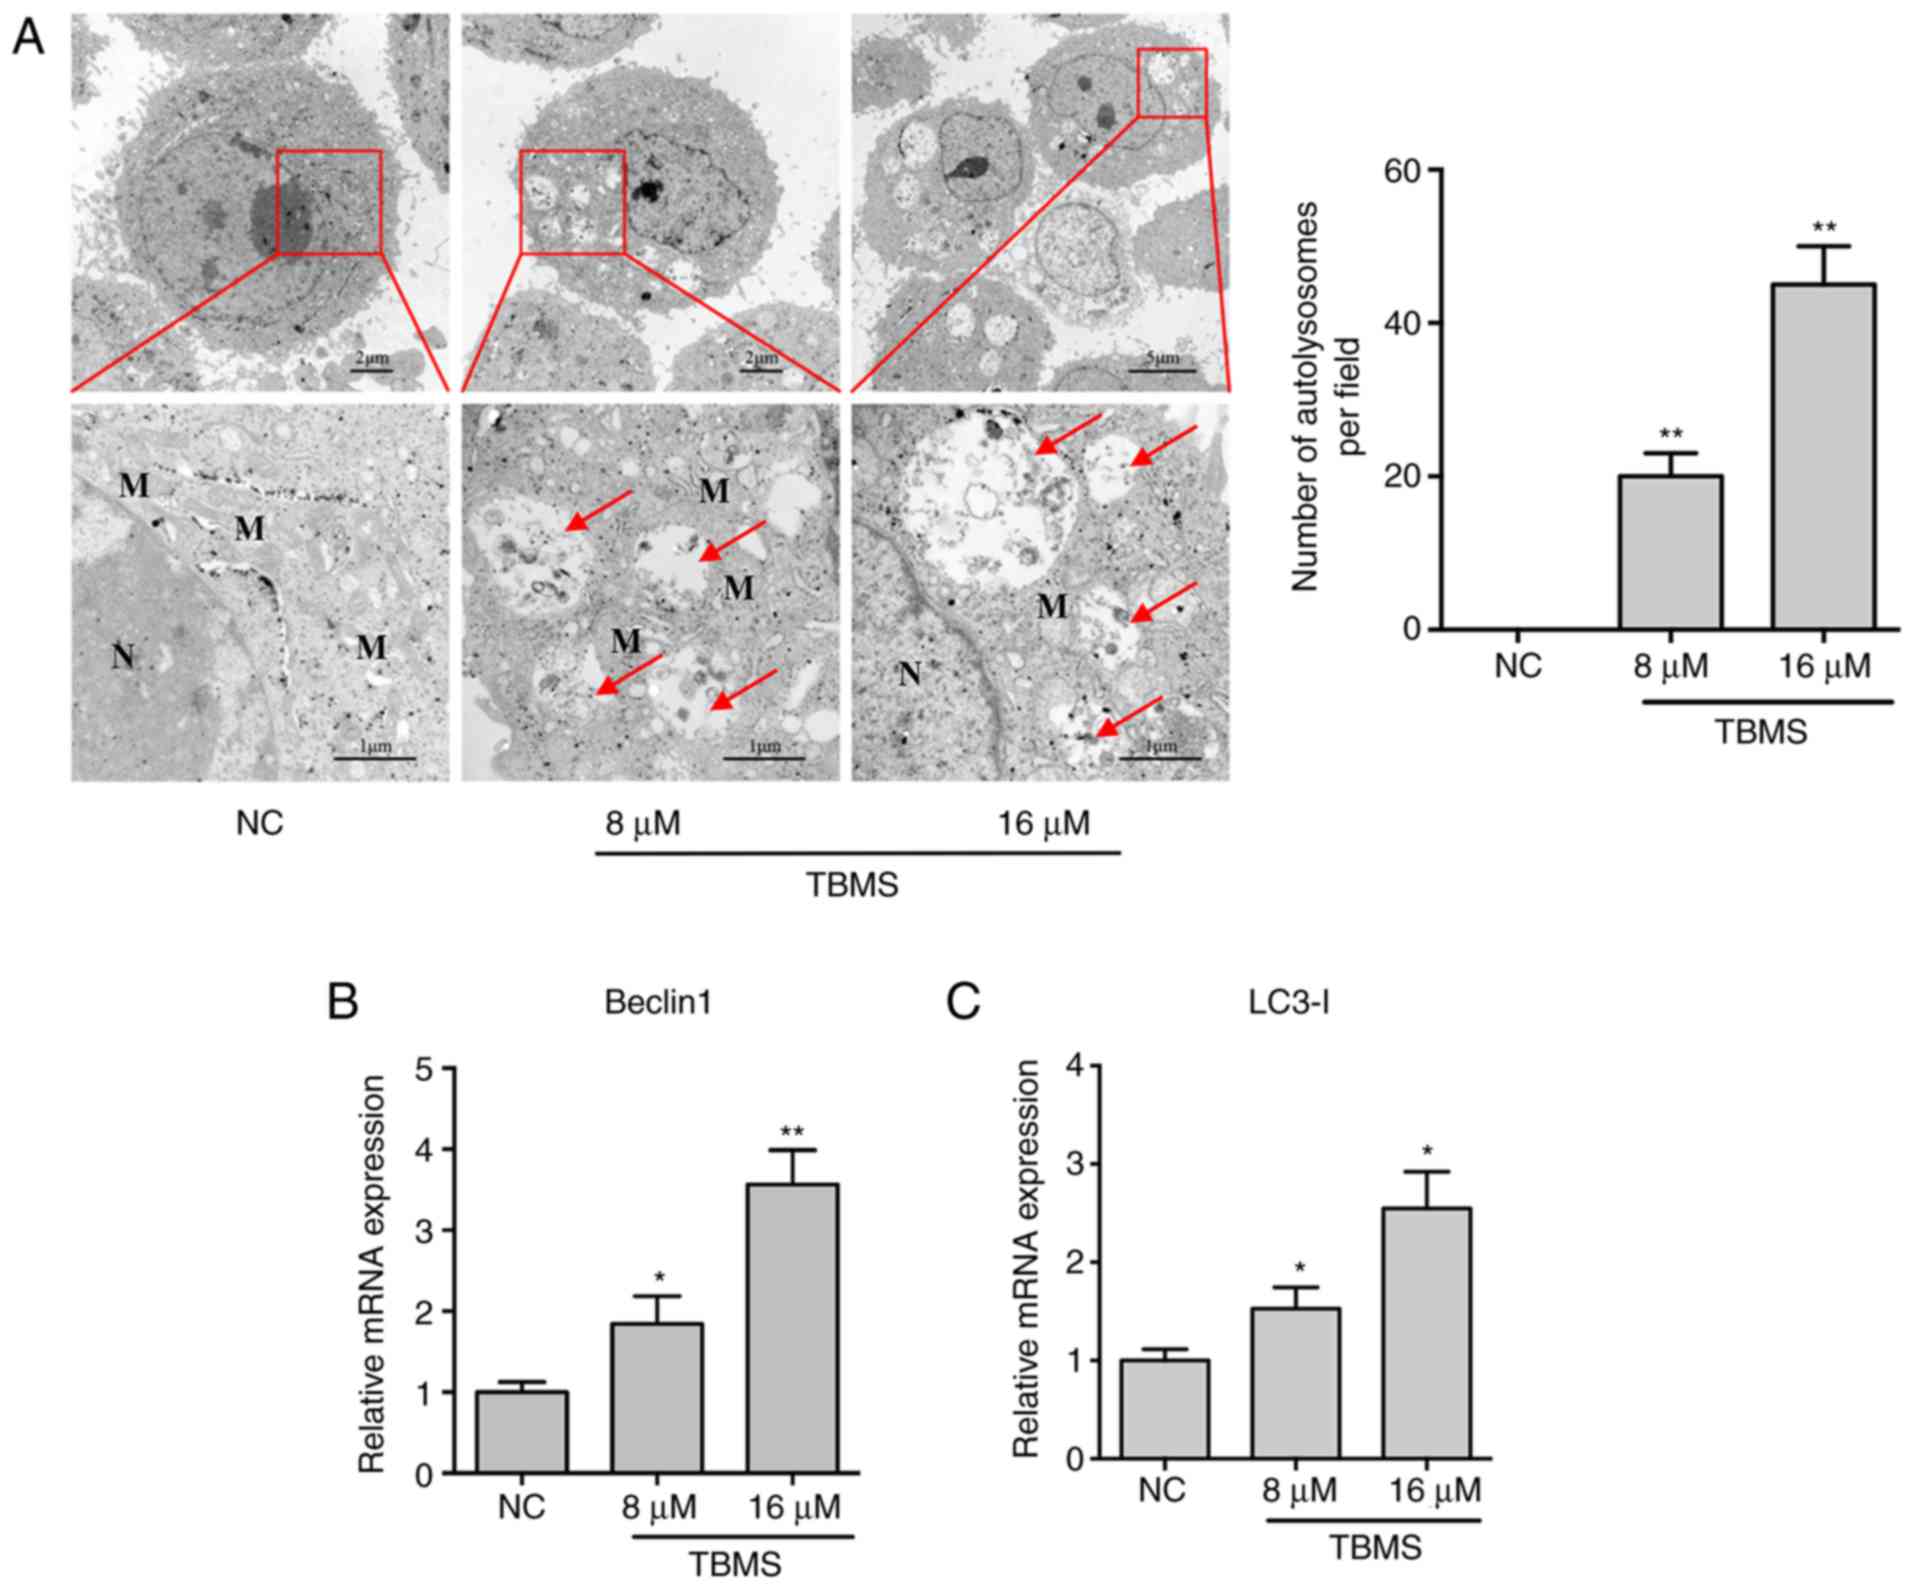
To determine whether TBMS induces autophagy in HepG2
cells, the cells were treated with TBMS at different concentrations
(8 and 16 µM) or DMSO [negative control (NC)] for 24 h. The
cytoplasmic accumulation of autophagosomes is generally consistent
with the increased expression of biomarkers in the autophagic
pathway. Therefore, TEM was first performed to evaluate the
morphological changes in the treated cells. As shown in Fig. 3A, there was a higher number of
mitochondria around the nucleus in NC cells, indicating that the
cells were in an active metabolic state. In comparison, several
autolysosomes were observed in the TBMS-treated cells, and the
mitochondria were swollen and fewer in number. These results
suggested that the cells could be undergoing autophagy. To confirm
this hypothesis, the biomarkers of autophagy, Beclin 1 and LC3-I,
were detected using RT-qPCR. As shown in Fig. 3B and C, the mRNA expression of Beclin
1 and LC3-I increased with increasing concentration of TBMS,
indicating that the cells were indeed undergoing autophagy.
To assess the effect of TBMS on apoptosis, HepG2
cells were treated with different concentrations of TBSM (0, 0.2,
2, 4, 8 and 16 µM) for 24 h (Fig.
4A), or treated with 16 µM of TBSM for different durations (24,
48 and 72 h; Fig. 4B). Subsequently,
the cells were harvested for apoptosis analysis by flow cytometry.
The results demonstrated that TBMS induced neither
concentration-dependent nor time-dependent apoptosis significantly.
There were no statistical differences among the groups after
quantification analysis (Fig. S1).
By contrast, doxorubicin, which was used as a positive control, was
able to induce apoptosis in HepG2 cells in a dose-dependent manner
(Fig. S2). In cells undergoing
apoptosis, the upregulation of the p53 gene is considered as an
indication of apoptosis (14). The
mRNA expression level of p53 was then detected in cells following
treatment with different doses of TBMS. The RT-qPCR results
demonstrated that the mRNA expression of p53 decreased with
increasing dose of TBMS, confirming that apoptosis did not occur
(Fig. S3). Taken together, these
results suggest that TBMS induces autophagy; however, not apoptosis
in HepG2 cells.
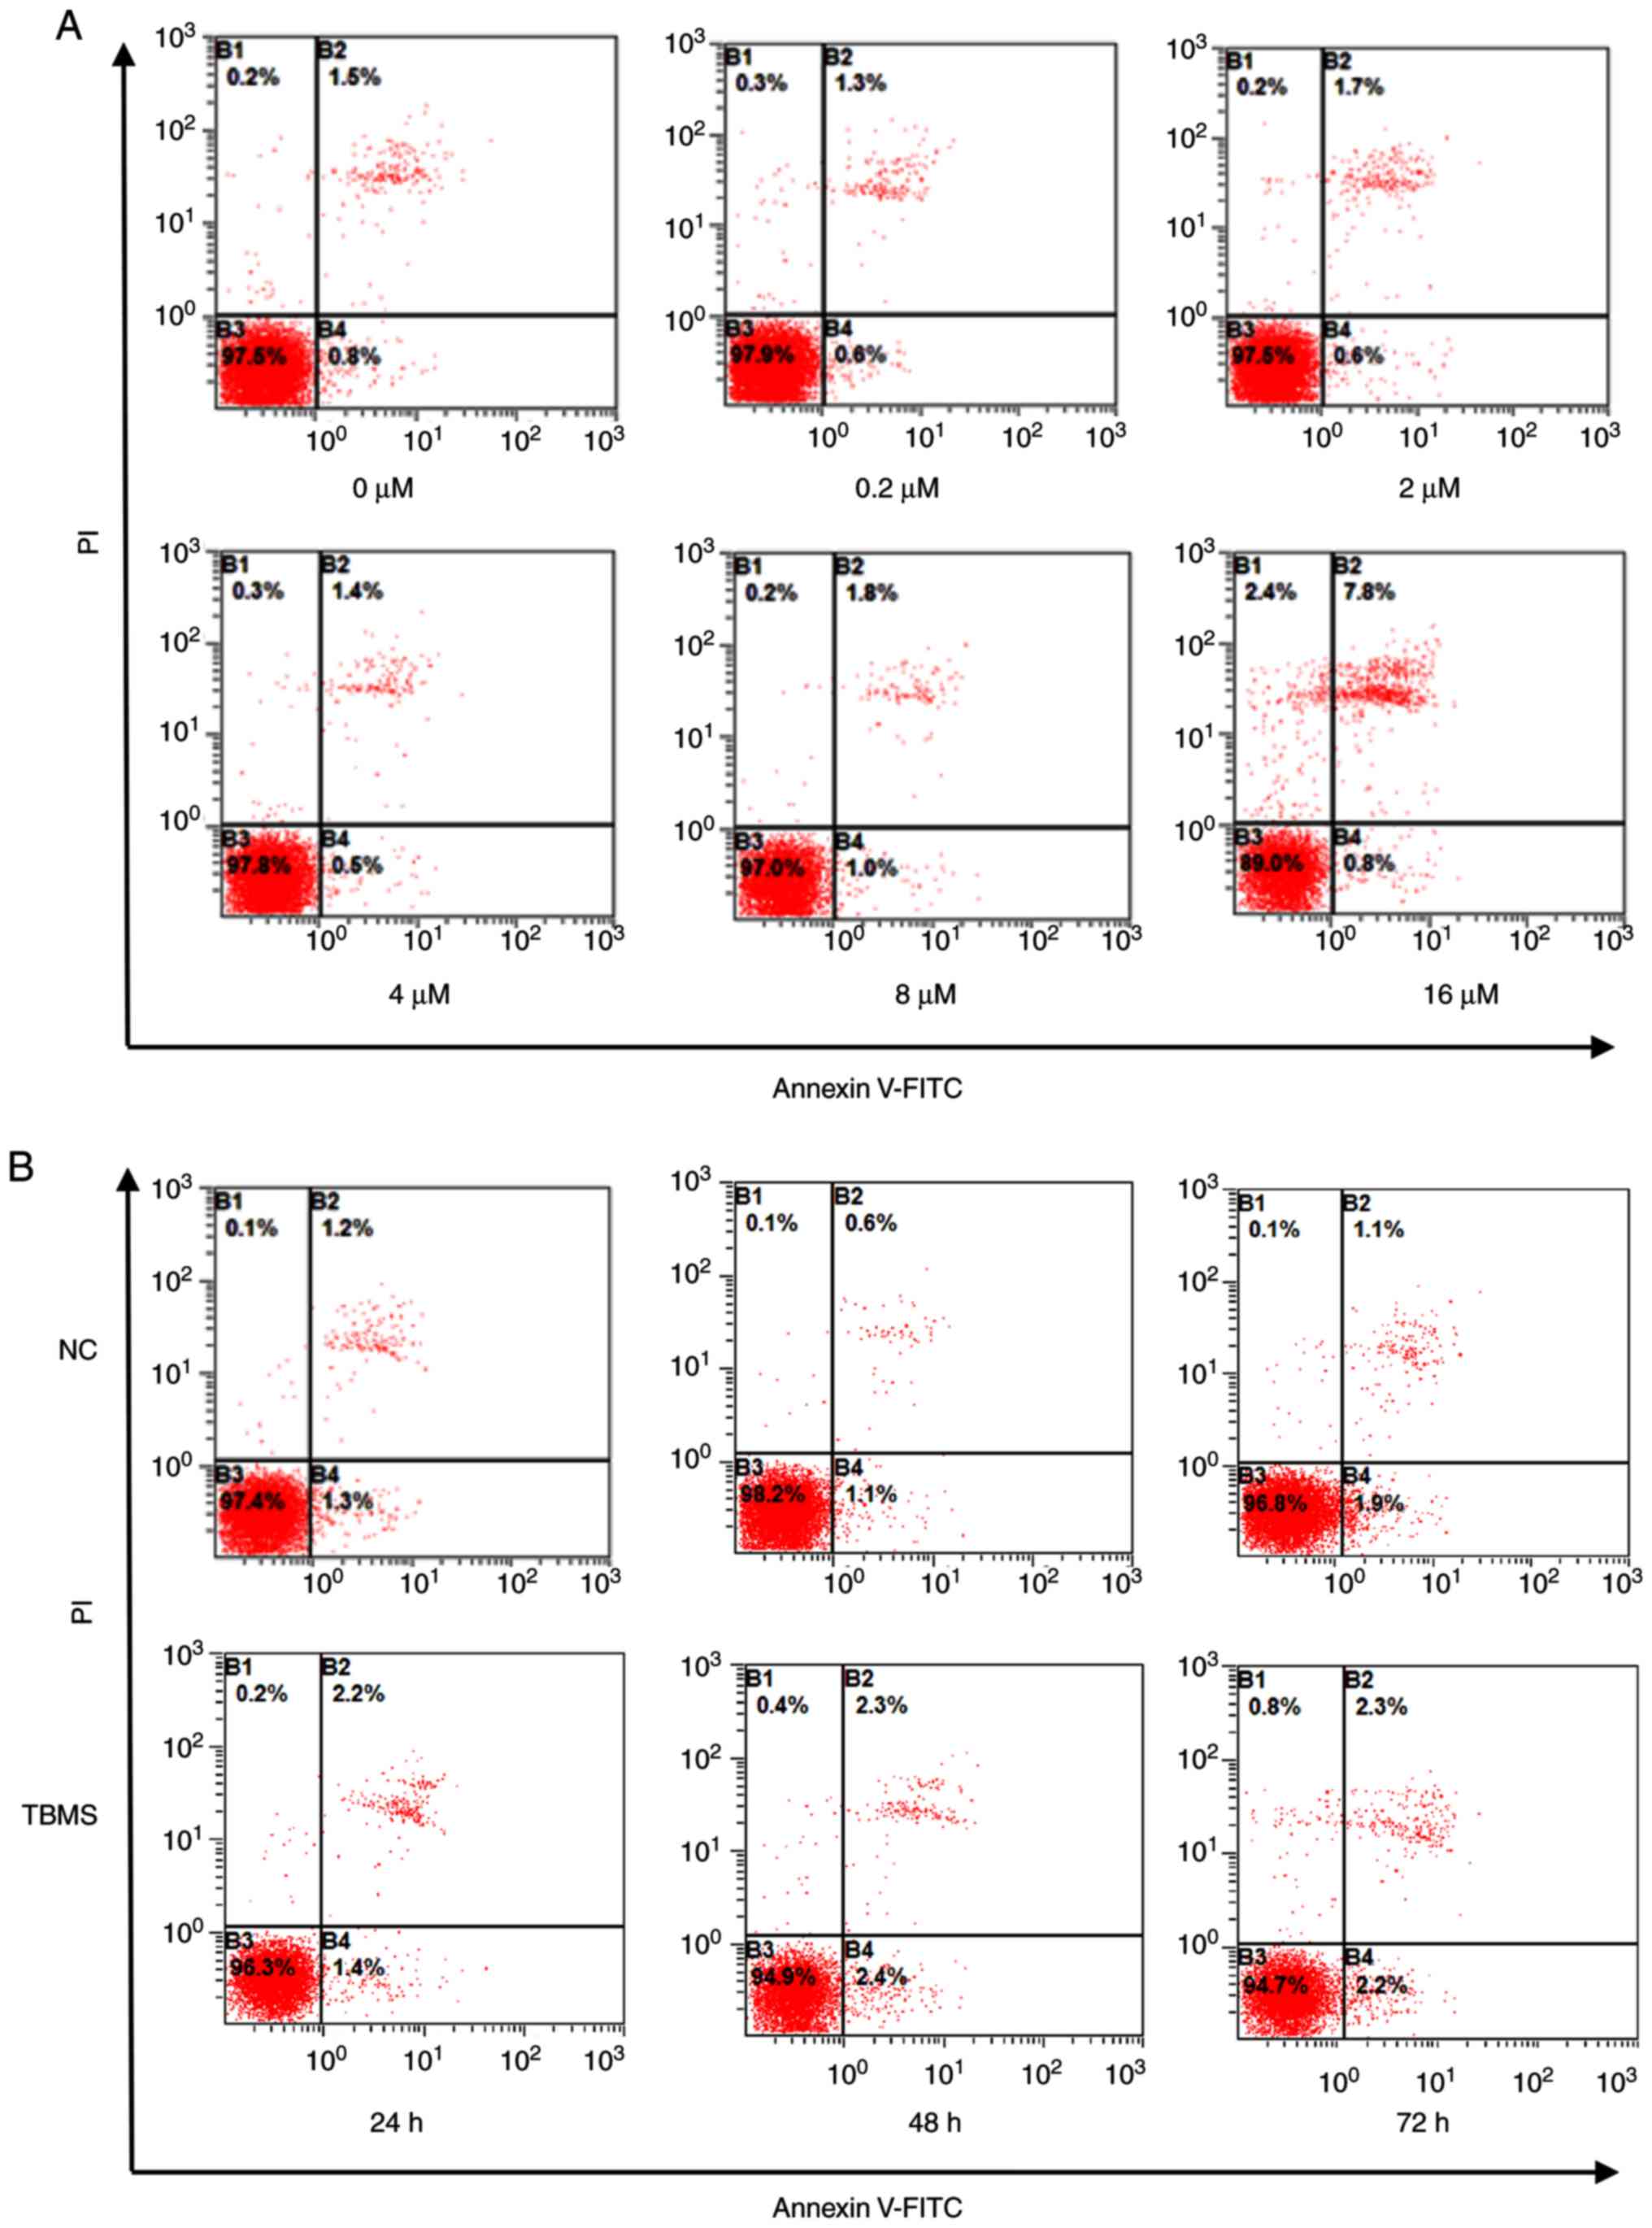 | Figure 4.TBMS does not induce apoptosis in
HepG2 cells. (A) HepG2 cells were treated with different
concentrations (0, 0.2, 2, 4, 8 and 16 µM) of TBMS for 24 h. The
cells were then harvested and stained with Annexin V-FITC/PI, and
flow cytometry was used to analyze apoptosis. (B) HepG2 cells were
treated with DMSO or 16 µM TBMS for 24, 48 or 72 h. The cells were
then harvested and stained with Annexin V/PI, to analyse apoptosis
by flow cytometry. TBMS, tubeimoside I; PI, propidium iodide; NC,
negative control. |
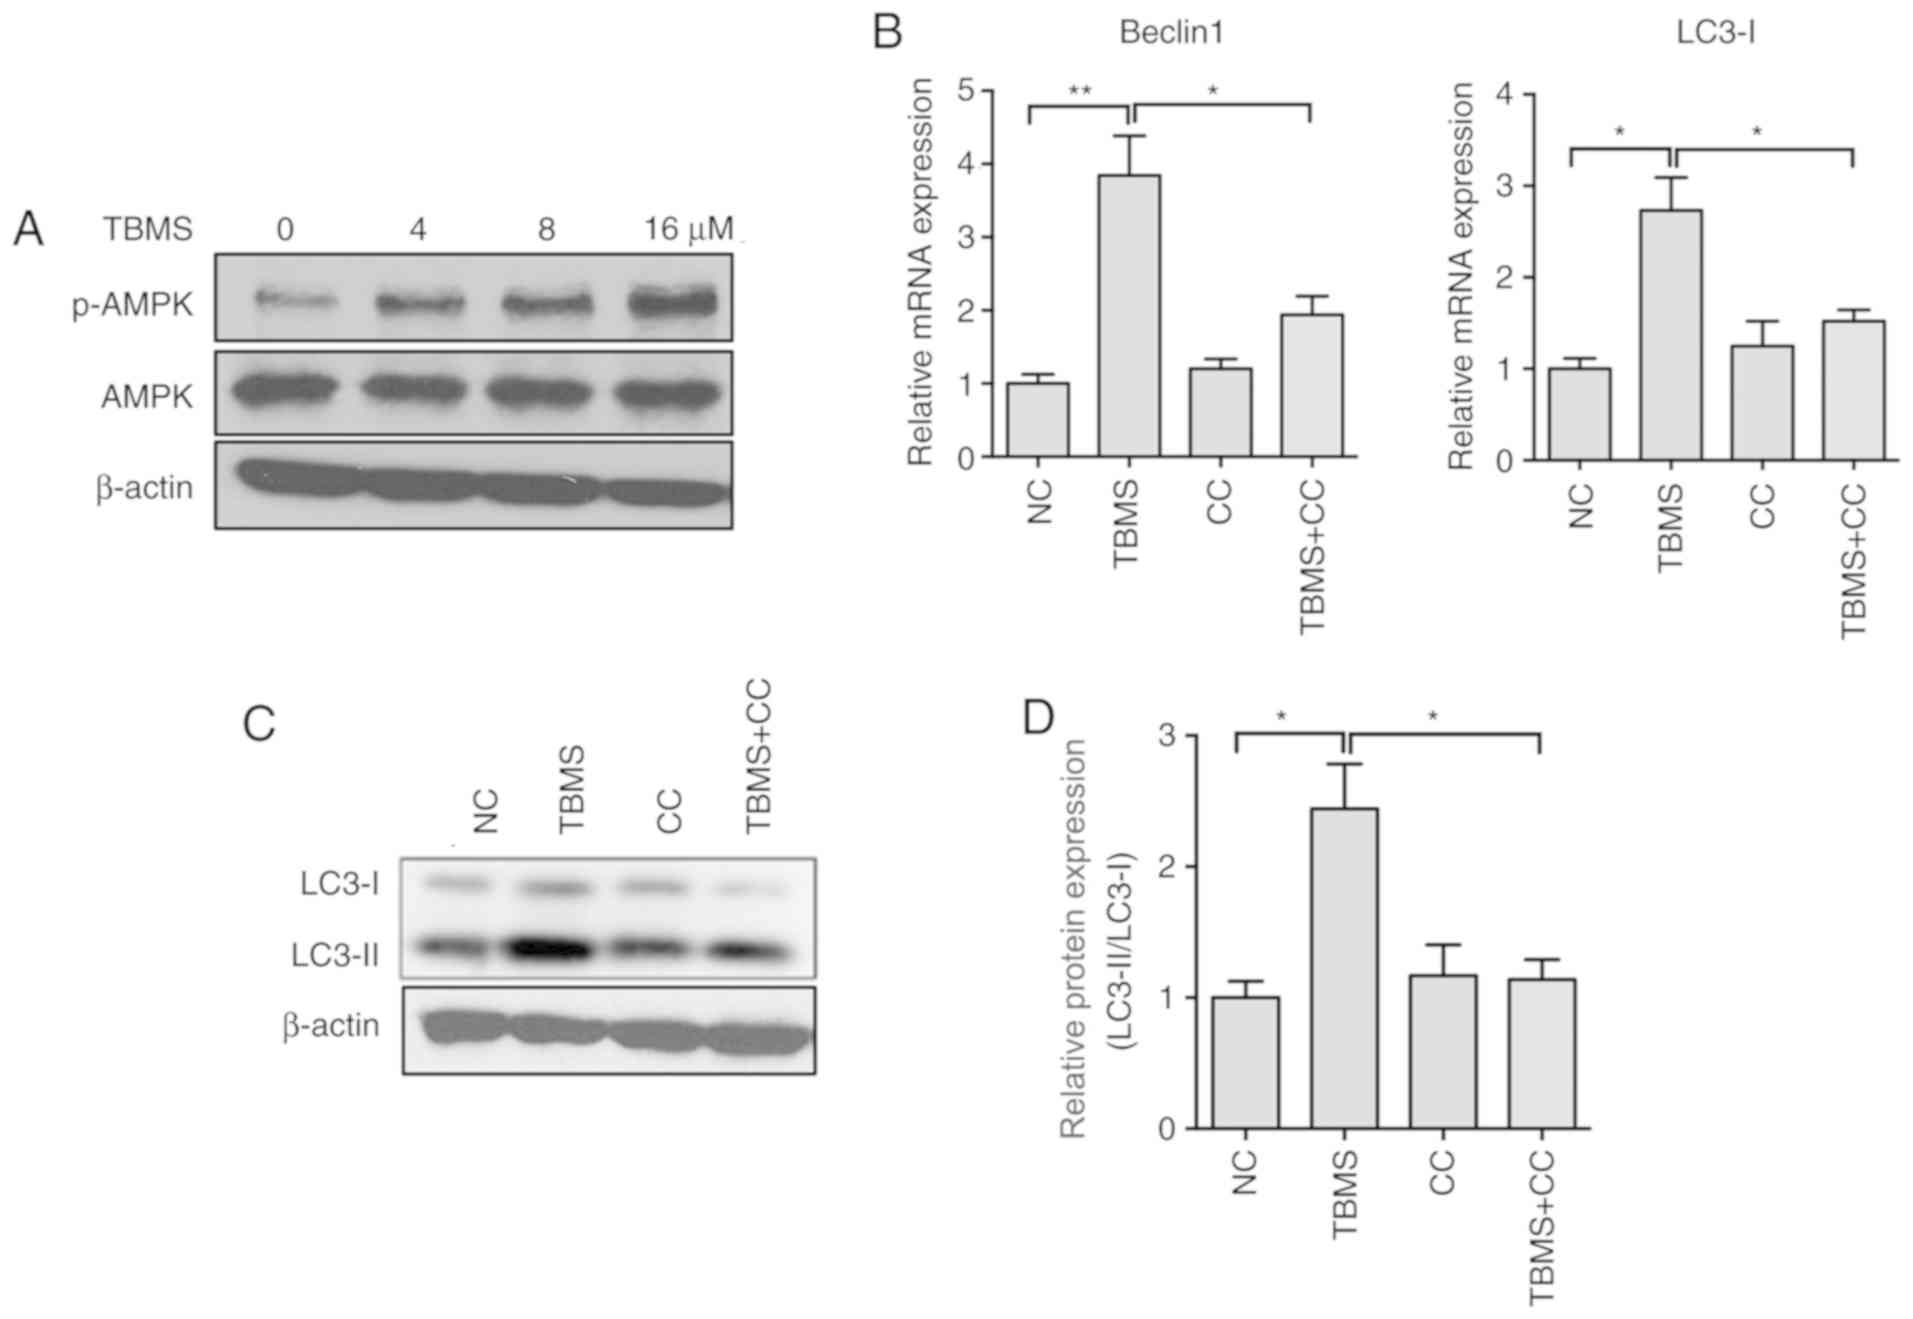
TBMS induces autophagy by activating
the AMP-activated protein kinase (AMPK) signaling pathway
The AMPK and mTOR signaling pathways have been
reported to be involved in the initiation of autophagy (15). To further explore the molecular
mechanism underlying TBMS-induced autophagy, the AMPK expression
levels were measured in HepG2 cells following treatment with TBMS.
Western blot analysis demonstrated that TBMS treatment led to
increased expression of phosphorylated-AMPK (pAMPK) in a
dose-dependent manner (Fig. 5A). To
further investigate the role of AMPK in TBMS-induced autophagy, CC,
a specific AMPK inhibitor, was employed. As shown in Fig. 5B, co-treatment with TBMS and CC
markedly suppressed the mRNA expression of Beclin 1 and LC3-I.
During autophagosome formation, free LC3-I in the cytosol is
modified and converted to LC3-II, and finally aggregates on the
membrane of the autophagosomes. Therefore, the transformation of
LC3-I to LC3-II in HepG2 cells was investigated following treatment
with TBMS and/or CC. The western blot analysis results demonstrated
that CC significantly decreased TBMS-induced LC3-II accumulation
(Fig. 5C and D). Taken together,
these results suggest that TBMS induces autophagy by activating the
AMPK signaling pathway in HepG2 cells.
Discussion
The results of the present study may improve the
current understanding of the function of TBMS, by uncovering its
cellular effects on autophagy in HepG2 cells. HepG2 cells have been
proven to be valuable in liver cancer research. Moreover, their
ability to genetically modify genes of interest, such as by
silencing or overexpression, facilitates in-depth mechanistic
studies at the molecular level (16). Although human primary hepatocytes may
be more relevant, the high variability and limited availability
among different donors limit their use (17). Therefore, the HepG2 cell line is a
useful model for studying the mechanism of action of anticancer
drugs in liver cancer.
Adaptation to the tumor microenvironment (TME) is
crucial for tumor cell survival. Metabolic stress is a
characteristic of the TME, and most chemotherapeutic agents lead to
cellular stress (18). Extracellular
stimulation may also induce autophagy; however, its specific
function in stress response is not clear. Therefore, whether
autophagy-dependent survival should be prevented in these
environments to stimulate tumor-cell death is an area that warrants
further in-depth investigation. Autophagy plays a complex role in
tumorigenesis, since its function in tumor cell death and survival
depends on the context. The results of the present study indicated
that autophagy is involved in tumor cell survival, particularly as
a modulator of the AMPK signaling pathway. The AMPK pathway is
considered to be one of the most crucial signaling pathways in
human cancer (19). The sustained
activation of AMPK regularly occurs in human cancer, and results in
a variety of changes to gene expression, involving in cell
proliferation, differentiation, metastasis or invasion. The results
of the present study demonstrated that TBMS treatment activated the
phosphorylation of AMPK dose-dependently, and blocked AMPK function
by its specific inhibitor CC suppressed the mRNA expression of
Beclin 1 and LC3-I, indicating that TBMS promotes autophagy by
activating the AMPK signaling pathway.
Autophagy, or cellular self-digestion, is a vital
cellular recycling mechanism that is responsible for the
degradation of malfunctioning or unnecessary cellular proteins and
organelles (20). Autophagy is
particularly active during metabolic stress. In cancer cells,
autophagy plays a dual role as a promoter or inhibitor of tumor
growth. Functional autophagy can prevent inflammation and necrosis,
which are involved in cell death and result in genetic instability.
On the other hand, autophagy provides energy through its
circulatory mechanism in an adverse metabolic environment, which
may be important for tumor progression (21). Autophagy may be triggered by a wide
range of stimuli, and it can induce either cell death or cell
survival under different conditions (8). Therefore, studying autophagy may
eventually help clinicians and scientists identify methods of
interfering with this process, thereby improving human health.
Researchers are starting to realize the role of autophagy in
drug-induced hepatotoxicity (22,23). LC3
is a biomarker that is widely used for monitoring autophagy
(24). To determine whether TBMS
treatment can induce autophagy, the activity of autophagy was
measured in HepG2 cells. The lipid-conjugated form of LC3 is
localized to the membranes of autophagosomes. RT-qPCR revealed that
LC3-I was upregulated in TBSM-treated cells, suggesting the
accumulation of autophagosomes. These changes were verified by
electron microscopy and the results demonstrated the different
stages of autophagic vacuole formation. These data confirmed that
TBSM treatment is accompanied by the activation of autophagy.
In conclusion, the present study demonstrated that
TBMS triggered autophagy in HepG2 cells by inducing the
accumulation of impaired autophagosomes, and its mechanisms of
action may be associated with the activation of the AMPK signaling
pathway. Therefore, TBMS is a specific autophagy regulator that may
be used as a potential adjuvant for cancer therapy, particularly in
the treatment of liver cancer.
Supplementary Material
Supporting Data
Acknowledgements
Not applicable.
Funding
This study was supported by Science and Technology
Plan Project of Fuzhou (grant no. 2019-G-43).
Availability of data and materials
The datasets used and/or analyzed during the present
study are available from the corresponding author on reasonable
request.
Authors' contributions
CR and DW conceived the study, and analyzed and
interpreted the data. CR, LY, YQ and XC performed the experiments
and analyzed data. CR wrote the manuscript. DW designed experiments
and analyzed the data. All authors read and approved the final
manuscript.
Ethics approval and consent to
participate
Not applicable.
Patient consent for publication
Not applicable.
Competing interests
The authors declare that they have no competing
interests.
References
|
1
|
Siegel RL, Miller KD and Jemal A: Cancer
Statistics, 2020. CA Cancer J Clin. 70:7–30. 2020. View Article : Google Scholar : PubMed/NCBI
|
|
2
|
Tejeda-Maldonado J, García-Juárez I,
Aguirre-Valadez J, González-Aguirre A, Vilatobá-Chapa M,
Armengol-Alonso A, Escobar-Penagos F, Torre A, Sánchez-Ávila JF and
Carrillo-Pérez DL: Diagnosis and treatment of hepatocellular
carcinoma: An update. World J Hepatol. 7:362–376. 2015. View Article : Google Scholar : PubMed/NCBI
|
|
3
|
Gomaa AI and Waked I: Recent advances in
multidisciplinary management of hepatocellular carcinoma. World J
Hepatol. 7:673–687. 2015. View Article : Google Scholar : PubMed/NCBI
|
|
4
|
Janku F, McConkey DJ, Hong DS and Kurzrock
R: Autophagy as a target for anticancer therapy. Nat Rev Clin
Oncol. 8:528–539. 2011. View Article : Google Scholar : PubMed/NCBI
|
|
5
|
Wang FZ, Xing L, Tang ZH, Lu JJ, Cui PF,
Qiao JB, Jiang L, Jiang HL and Zong L: Codelivery of Doxorubicin
and shAkt1 by Poly(ethylenimine)-Glycyrrhetinic acid nanoparticles
to induce autophagy-mediated liver cancer combination therapy. Mol
Pharm. 13:1298–1307. 2016. View Article : Google Scholar : PubMed/NCBI
|
|
6
|
Tong H, Li T, Qiu W and Zhu Z: Claudin-1
silencing increases sensitivity of liver cancer HepG2 cells to
5-fluorouracil by inhibiting autophagy. Oncol Lett. 18:5709–5716.
2019.PubMed/NCBI
|
|
7
|
Mizushima N, Yoshimori T and Levine B:
Methods in mammalian autophagy research. Cell. 140:313–326. 2010.
View Article : Google Scholar : PubMed/NCBI
|
|
8
|
Baehrecke EH: Autophagy: Dual roles in
life and death? Nat Rev Mol Cell Biol. 6:505–510. 2005. View Article : Google Scholar : PubMed/NCBI
|
|
9
|
Sui X, Chen R, Wang Z, Huang Z, Kong N,
Zhang M, Han W, Lou F, Yang J, Zhang Q, et al: Autophagy and
chemotherapy resistance: A promising therapeutic target for cancer
treatment. Cell Death Dis. 4:e8382013. View Article : Google Scholar : PubMed/NCBI
|
|
10
|
Kasai R, Miyakoshi M, Matsumoto K, Nie RL,
Zhou J, Morita T and Tanaka O: Tubeimoside I, a new cyclic
bisdesmoside from Chinese cucurbitaceous folk medicine ‘tu bei mu’,
a tuber of Bolbostemma paniculatum. Chem Pharm Bull (Tokyo).
34:3974–3977. 1986. View Article : Google Scholar : PubMed/NCBI
|
|
11
|
Jia G, Wang Q, Wang R, Deng D, Xue L, Shao
N, Zhang Y, Xia X, Zhi F and Yang Y: Tubeimoside-1 induces glioma
apoptosis through regulation of Bax/Bcl-2 and the ROS/Cytochrome
C/Caspase-3 pathway. Onco Targets Ther. 8:303–311. 2015.PubMed/NCBI
|
|
12
|
Zhang Y, Xu XM, Zhang M, Qu D, Niu HY, Bai
X, Kan L and He P: Effects of tubeimoside-1 on the proliferation
and apoptosis of BGC823 gastric cancer cells in vitro. Oncol Lett.
5:801–804. 2013. View Article : Google Scholar : PubMed/NCBI
|
|
13
|
Livak KJ and Schmittgen TD: Analysis of
relative gene expression data using real-time quantitative PCR and
the 2(-Delta Delta C(T)) method. Methods. 25:402–408. 2001.
View Article : Google Scholar : PubMed/NCBI
|
|
14
|
Abu-Qare AW and Abou-Donia MB: Biomarkers
of apoptosis: Release of cytochrome c, activation of caspase-3,
induction of 8-hydroxy-2′-deoxyguanosine, increased
3-nitrotyrosine, and alteration of p53 gene. J Toxicol Environ
Health B Crit Rev. 4:313–332. 2001. View Article : Google Scholar : PubMed/NCBI
|
|
15
|
Dikic I and Elazar Z: Mechanism and
medical implications of mammalian autophagy. Nat Rev Mol Cell Biol.
19:349–364. 2018. View Article : Google Scholar : PubMed/NCBI
|
|
16
|
Toh TB, Lim JJ and Chow EK: Epigenetics of
hepatocellular carcinoma. Clin Transl Med. 8:132019. View Article : Google Scholar : PubMed/NCBI
|
|
17
|
Seow TK, Liang RC, Leow CK and Chung MC:
Hepatocellular carcinoma: From bedside to proteomics. Proteomics.
1:1249–1263. 2001. View Article : Google Scholar : PubMed/NCBI
|
|
18
|
Ferro F, Servais S, Besson P, Roger S,
Dumas JF and Brisson L: Autophagy and mitophagy in cancer metabolic
remodelling. Semin Cell Dev Biol. 98:129–138. 2019. View Article : Google Scholar : PubMed/NCBI
|
|
19
|
Cheng J, Zhang T, Ji H, Tao K, Guo J and
Wei W: Functional characterization of AMP-activated protein kinase
signaling in tumorigenesis. Biochim Biophys Acta. 1866:232–251.
2016.PubMed/NCBI
|
|
20
|
Poillet-Perez L and White E: Role of tumor
and host autophagy in cancer metabolism. Genes Dev. 33:610–619.
2019. View Article : Google Scholar : PubMed/NCBI
|
|
21
|
Levine B and Kroemer G: Autophagy in the
pathogenesis of disease. Cell. 132:27–42. 2008. View Article : Google Scholar : PubMed/NCBI
|
|
22
|
Apostolova N, Gomez-Sucerquia LJ, Gortat
A, Blas-Garcia A and Esplugues JV: Autophagy as a rescue mechanism
in efavirenz-induced mitochondrial dysfunction: A lesson from
hepatic cells. Autophagy. 7:1402–1404. 2011. View Article : Google Scholar : PubMed/NCBI
|
|
23
|
Ni HM, Bockus A, Boggess N, Jaeschke H and
Ding WX: Activation of autophagy protects against
acetaminophen-induced hepatotoxicity. Hepatology. 55:222–232. 2012.
View Article : Google Scholar : PubMed/NCBI
|
|
24
|
Kabeya Y, Mizushima N, Ueno T, Yamamoto A,
Kirisako T, Noda T, Kominami E, Ohsumi Y and Yoshimori T: LC3, a
mammalian homologue of yeast Apg8p, is localized in autophagosome
membranes after processing. EMBO J. 19:5720–5728. 2000. View Article : Google Scholar : PubMed/NCBI
|