Introduction
Liver cancer is the third most common cause of
cancer-associated mortality in humans worldwide, with a 5-year
mortality rate <30% in 2018 (1),
and hepatocellular carcinoma (HCC) is the most common type of
primary liver carcinoma (2,3). Hepatitis B virus (HBV), HCV, alcoholic
and non-alcoholic steatohepatitis are the most frequent causes of
chronic liver disease, which remain high risk factors of HCC
(4). The diagnosis, treatment and
5-year survival rate (5–9%) of HCC has improved over the past three
decades (5). Particularly, the
5-year survival rate has been reported increase to 69% following
early diagnosis and curative resection (6). However, the lack of diagnostic markers
for early detection means the tumor is usually diagnosed at an
advanced stage, which prevents curative therapies, including
surgical resection and liver transplantation (7). In addition, the underlying molecular
mechanism involved in the development and progression of HCC is not
yet fully understood, which allows HCC to continue inducing a
devastating effect on human health. Thus, further studies on the
molecular pathological investigation and therapeutic intervention
with high efficacy are required.
The Cadherin EGF LAG seven-pass G-type (CELSR)
family derives from the cadherin EGF LAG seven-pass G-type receptor
and is classified as a special subgroup of adhesion
G-protein-coupled receptor due to cadherin repeating at the far
N-terminal (8). CELSR receptor 3
(CELSR3) contains nine cadherin domains, which act as homophilic
binding regions, and seven EGF-like domains involved in
receptor-ligand interactions and cell adhesion, and is considered
to serve a key role in cell-cell contacts (9,10).
Dysregulation of CELSR3 DNA methylation is associated with several
types of cancer, including pancreatic, hepatic, bladder and renal
carcinomas (11–14). It has been reported that CELSR3
displays a cancer-specific pattern, and a 3.04-fold increase in its
expression has been reported in tumor-associated stellate cells
compared with inflammation-associated stellate cells (14).
These previous findings suggest that CELSR3
functions as an anticancer target in the aforementioned types of
cancer. However, to the best of our knowledge, the
clinicopathological significance and functional roles of
upregulated CELSR3 in HCC have not yet been determined. Although
CELSR3 has been demonstrated to act as an oncogene in several types
of human cancer, previous studies have only focused on the
dysregulation of its methylation and differential expression in
cancer tissues (15–17), whereas limited focus has been placed
on its function in tumorigenesis. Thus, further studies are
required to understand the high expression molecular mechanism of
CELSR3 in tumors.
microRNAs (miRNA) are a class of small,
evolutionarily conserved, single-stranded non-coding RNA molecules,
which are ~22 nucleotides long and regulate gene expression by
binding to the 3′-untranslated regions of target mRNAs (18,19).
This results in silencing and post-transcriptional regulation of
gene expression (20,21). Dysregulation of miRNA has been
associated with HCC progression, including evasion of cell
apoptosis, irregular cell proliferation, angiogenesis, invasion and
metastasis by targeting protein-coding genes (22,23).
The present study hypothesized that the upregulated
CELSR3 expression may be partially due to upstream dysregulation of
miRNAs, and therefore aimed to demonstrate the expression pattern
of CELSR3 in HCC and determine its clinical significance, in order
to improve the understanding of HCC and to provide a basis for
future experimental and clinical research.
Materials and methods
Data collection
HCC-associated data from the liver hepatocellular
carcinoma dataset (TCGA-LIHC) (24)
were downloaded from The Cancer Genome Atlas (TCGA) database
(https://cancergenome.nih.gov), which
included 370 HCC tissues (survival time information was available)
and 48 normal adjacent liver tissues. A total of 346 tumor samples
were selected based on the availability of HCC progression from
stages I–IV.
Identification of differentially
expressed genes (DEGs)
Genes with an average count number <10 were
excluded from the study. Patients were divided into low- and
high-expression groups based on the median CELSR3 expression value
of 7.32. ‘EdgeR’ v3.28.1 package (25) was used to identify DEGs between the
two groups. DEGs were selected based on the following criteria:
|log2[fold change (FC)]|>1, P<0.05 and false
discovery rate (FDR)<0.05.
Identification of differentially
expressed miRNAs (DEMs)
The online GEO2R tool (https://www.ncbi.nlm.nih.gov/geo/geo2r) was used
within the R software v3.4.3 package (https://www.r-project.org/) to identify DEMs between
HCC tissues and normal adjacent tissues. miRNAs with an average
count number <10 were excluded from the study. Samples were
divided into two groups based on the median CELSR3 mRNA level of
7.32 as follows: High expression (>7.32) or low expression
(<7.32). The ‘EdgeR’ package was used to identify DEMs between
the two groups. DEMs were selected based on the following criteria:
|log2(FC)|>1 and FDR<0.05. Heatmaps illustrating
the expression levels of DEMs in samples were plotted using the
‘pheatmap’ R Bioconductor package (https://cran.r-project.org/web/packages/pheatmap).
Volcano plots showing the differential expression status were
generated using R v3.4.3 platform (https://www.r-project.org/).
Identifying target genes by inverse
correlation and target prediction
Pearson's correlation analysis was applied to the
DEMs and DEGs. Since miRNAs act as negative regulators (26), upregulated miRNAs resulted in
downregulated target mRNAs, and vice versa. The prediction
criterion was that the target gene must be identified in >2 of
the following prediction databases: miRDB (27), miRTarBase (28) and TargetScan (29). Subsequently, target genes were
combined with DEGs to select DEM-differentially expressed target
gene pairs. Pearson's correlation analysis was used for
DEM-differentially expressed target gene pairs, and pairs with
r≤-0.4 were used to construct the miRNA-mRNA negative regulatory
network using Cytoscape software v3.2.0 (https://cytoscape.org/) (30).
Copy number variation (CNV) and
methylation analysis
The present study analyzed the association between
CELSR3 expression and CNVs, as well as the methylation levels in
HCC samples. Copy numbers ≤-1 or ≥1 confirmed the presence of CNV.
Associations were estimated by Pearson correlation between
CNV/methylation levels and CELSR3 mRNA level.
Gene set enrichment analysis
Gene set enrichment analysis of miRNA target genes
was performed using KOBAS online tool v2.0 (http://kobas.cbi.pku.edu.cn/) (31), followed by Kyoto Encyclopedia of
Genes and Genomes (KEGG) pathway analysis (https://www.genome.jp/kegg/). P<0.05 was considered
to indicate significantly enriched pathways.
Cell culture
SK-Hep-1 cells were purchased from Nanjing KeyGen
Biotech Co., Ltd. and incubated in MEM supplemented with 10% FBS
(Gibco, Thermo Fisher Scientific, Inc.), at 37°C in 5%
CO2. In addition, 0.25% EDTA-trypsin and PBS were
purchased from Gibco (Thermo Fisher Scientific, Inc.) and used for
cell dissociation and washes, respectively.
Cell transfection
Specific siRNA oligonucleotides of β-catenin and
miR-181 inhibitor were designed by Qiagen GmbH. The oligonucleotide
sequences were as follows: β-catenin, 5′-GGATGTGGATACCTCCCAAGT-3′;
β-catenin siNC, 5′-UUCUCCGAACGUGUCACGUTT-3′; miR-181 inhibitor,
5′-ACUCACCGACAGCGUUGAAUGUU-3′; and NC inhibitor
5′-UUCUCCGAACGUGUCACGUTT-3′. SK-Hep-1 cells were seeded into 6-well
plates at 70–90% confluence and transfected with
Lipofectamine® 3000 (Thermo Fisher Scientific, Inc.) and
siRNA (ratio, 1:1). Transfected cells were harvested after 72 h of
transfection for RNA extraction. The siRNA concentration was 75
pmol/well.
Reverse transcription-quantitative
(RT-q)PCR
Total RNA was extracted from SK-Hep-1 cells using
the miRNeasy Mini kit (Qiagen GmbH) according to the manufacturer's
protocol. Total RNA was measured using a NanoDrop 2000
spectrophotometer (Thermo Fisher Scientific, Inc.) and
reverse-transcribed into cDNA using the miScript II RT kit (Qiagen
GmbH). The generated cDNA was used as a template for quantification
of mRNA and miRNA, respectively. The following primer sequences
were used for qPCR: miR-181 forward, 5′-AACATTCAACGCTGTCGGTGAGT-3′
and reverse, 5′-CAGTGCAGGGTCCGAGGT-3′; U6 forward,
5′-CTCGCTTCGGCAGCACA-3′ and reverse, 5′-AACGCTTCACGAATTTGCGT-3′;
β-catenin forward, 5′-GCCACAAGATTACAAGAAACG-3′ and reverse,
5′-ATCAACTGGATAGTCAGCACC-3′; CELSR3 forward,
5′-CTACAGACAGCGAATCGGAGCA-3′ and reverse,
5′-CCACGCACATTGGACTTGAGG-3′; and β-actin forward,
5′-GACGTGGACATCCGCAAAGAC-3′ and reverse,
5′-CTGCTGGAAGGTGGACAGTGAG-3′. qPCR amplification was performed
using the SYBR Premix Ex Taq kit (Roche Diagnostics), according to
the manufacturer's protocol, using the ABI 7500 Sequence Detection
system (Thermo Fisher Scientific, Inc.). The following
thermocycling conditions were used for qPCR of mRNA: 95°C for 1
min, followed by 40 cycles of 95°C for 10 sec and 60°C for 30 sec.
The following thermocycling conditions were used for qPCR of miRNA:
95°C for 10 min, followed by 40 cycles of 94°C for 10 sec, 55°C for
30 sec, and 70°C for 30 sec. Relative mRNAs and miRNAs expression
levels were measured using the 2−ΔΔCq method (32) and normalized to the internal
reference genes β-actin and RUN6, respectively. All experiments
were performed in triplicate.
Statistical analysis
Data are presented as the mean ± standard deviation
(n=3). All statistical analyses were performed using R v3.4.3
(https://www.r-project.org/). Univariate
analysis was performed using the χ2 test to assess the
association between CELSR3 expression and clinicopathological
characteristics in patients with HCC. The difference in CELSR3
expression between cancer tissues and adjacent normal tissues was
analyzed using a paired two-sided Student's t-test. ANOVA followed
by LSD post hoc test were also used to compare CELSR3 expression
levels among multiple groups with distinct gene copy numbers. The
prognostic value of CELSR3 in HCC was assessed using the
Kaplan-Meier online database (http://kmplot.com/analysis). Pearson's correlation
coefficient analysis was performed using expression values of DEGs
and the methylation levels in HCC data obtained from TCGA in order
to construct the miRNA-mRNA negative regulatory network.
Significant differences among RT-qPCR data were assessed using
one-way ANOVA with Tukey's post hoc analysis. P<0.05 was
considered to indicate a statistically significant difference.
Results
CELSR3 is associated with
clinicopathological characteristics in patients with HCC
HCC samples were divided into two groups, with the
median CELSR3 mRNA levels used as the threshold. The χ2
test and two-sided Student's t-test were used to determine whether
age, sex, pathological stage and OS status were associated with
CELSR3 expression, the results of which are presented in Table I. The results demonstrated that age
was significantly associated with CELSR3 expression, as high CELSR3
expression was observed in elderly patients (P=0.020). In addition,
CELSR3 was identified as a clinical stage-associated gene
(P=0.011). However, univariate analysis revealed that CELSR3
expression was not associated with sex (P=0.406) or OS status
(P=0.159) (data not shown).
 | Table I.Association between CELSR3 expression
and the demographic and clinicopathological characteristics of
patients with HCC. |
Table I.
Association between CELSR3 expression
and the demographic and clinicopathological characteristics of
patients with HCC.
|
| CELSR3
expression |
|
|
|---|
|
|
|
|
|
|---|
| Characteristic | High, n=209 | Low, n=209 | χ2 | P-value |
|---|
| Age, mean ± SD | 63.22±12.72 | 61.09±14.64 |
| 0.020a |
| Sex |
|
| 0.6898 | 0.406 |
|
Female | 65 | 74 |
|
|
|
Male | 144 | 135 |
|
|
| Pathologic
stage |
|
| 6.4034 | 0.011a |
|
I–II | 137 | 121 |
|
|
|
III–V | 61 | 27 |
|
|
| NA | 11 | 61 |
|
|
| Overall survival
status |
|
| 1.9800 | 0.159 |
|
Dead | 88 | 73 |
|
|
|
Alive | 121 | 136 |
|
|
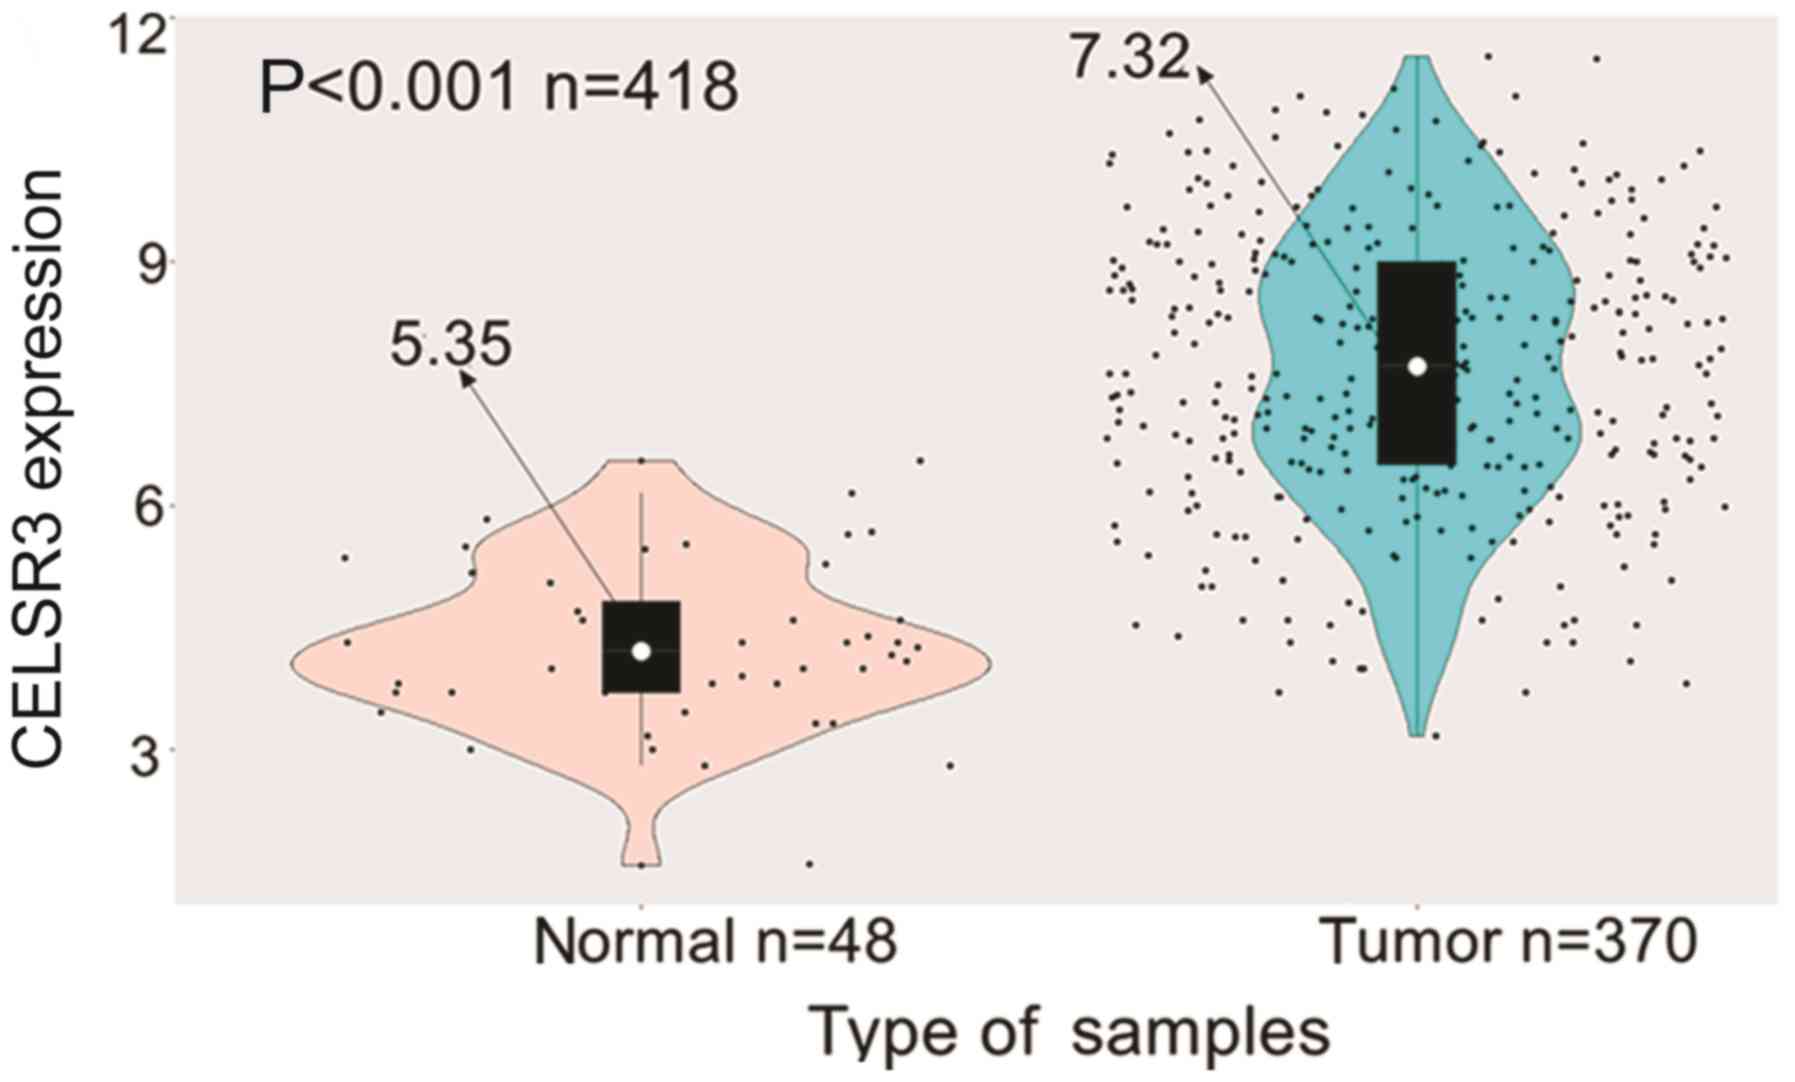
CELSR3 expression is high in HCC
Information obtained from TCGA data portal on age,
sex and clinical stage demonstrated higher CELSR3 expression in HCC
tissues compared with in normal liver tissues (P<0.001; Fig. 1). Additionally, CELSR3 expression was
significantly elevated in HBV- (P=0.038) or HCV-infected (P=0.007)
HCC samples compared with those without any infections (Fig. S1). Overall, the present results
suggested that CELSR3 may serve a key role in the carcinogenesis of
HCC.
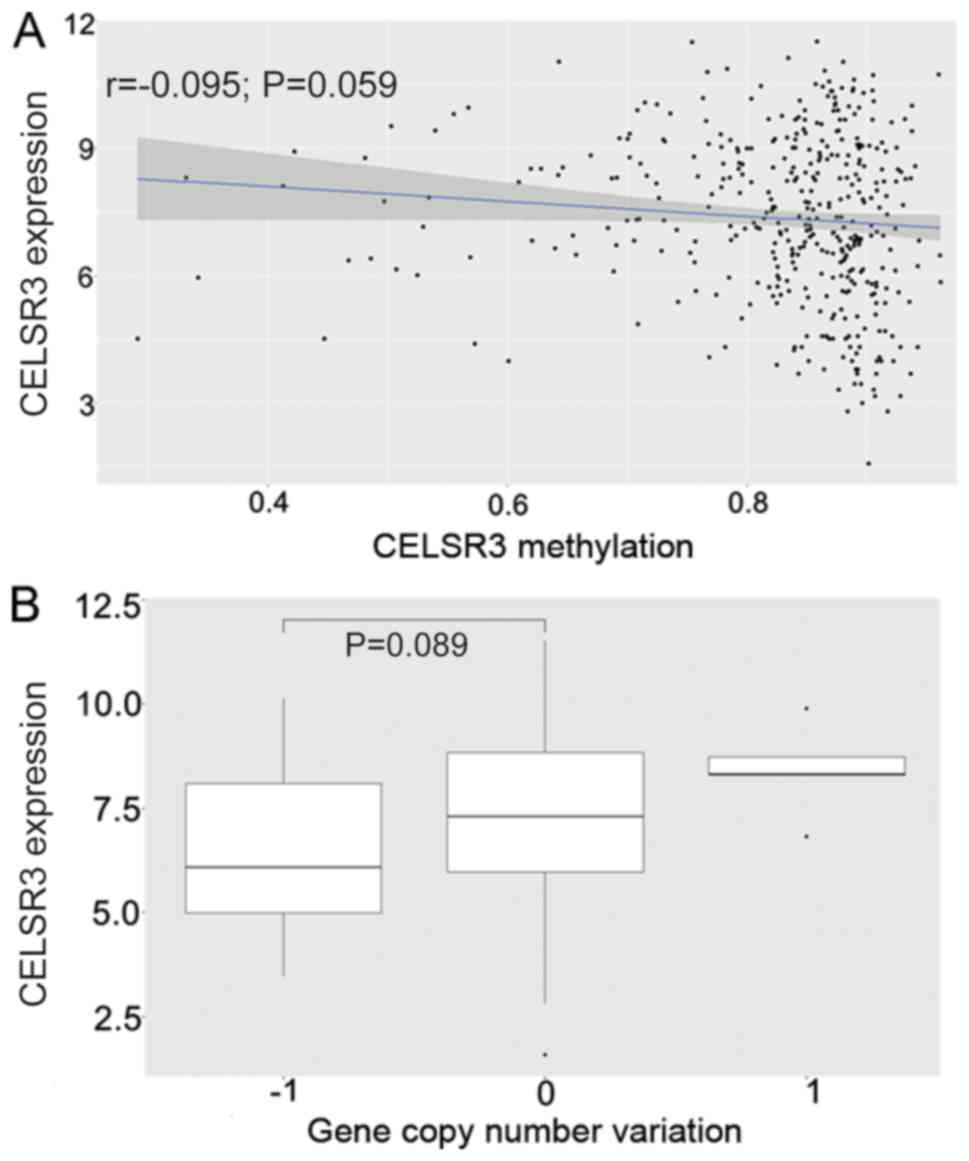
Association between CNV/methylation
and CELSR3 mRNA level
HCC samples exhibited decreased copy numbers through
homozygous deletions, whereas CELSR3 expression did not decrease
with copy number loss (P=0.089; Fig.
2B). In addition, CELSR3 expression was poorly negatively
correlated with the methylation level of CELSR3 based on Pearson's
correlation coefficient (P=0.059; r=−0.095; Fig. 2A).
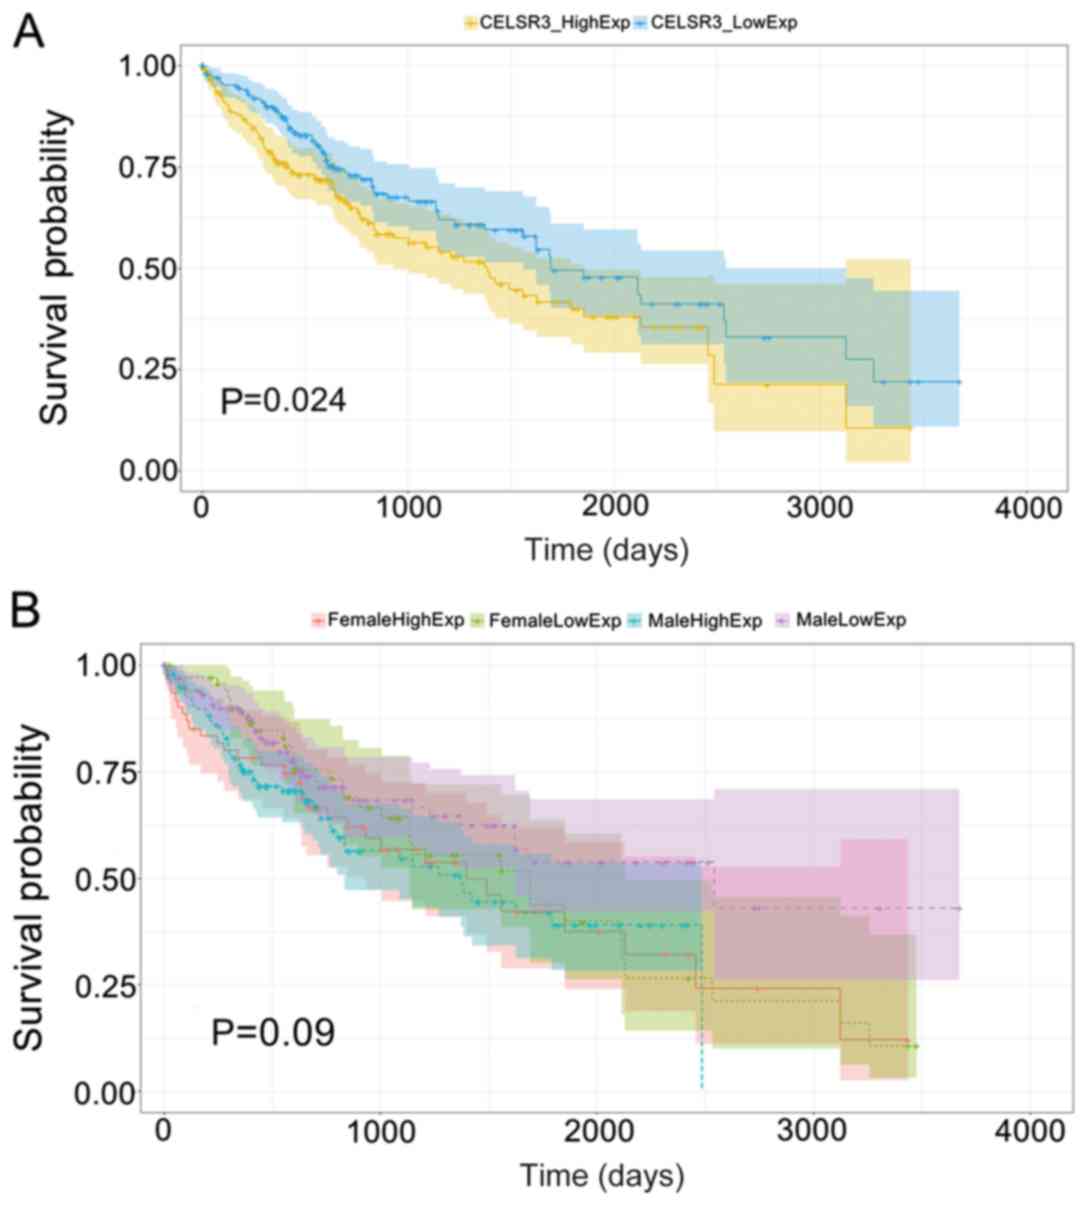
High CELSR3 expression is associated
with poor HCC prognosis
HCC samples were divided into low and high
expression groups, with the median CELSR3 mRNA levels set as the
threshold. A significantly shorter overall survival time was
observed in patients with high CELSR3 expression compared with
those in the low CELSR3 expression group (P=0.024; Fig. 3A). No significant effect on OS was
demonstrated between CELSR3 expression and sex (P=0.090; Fig. 3B), indicating that CELSR3 affected
HCC prognosis independently of sex.
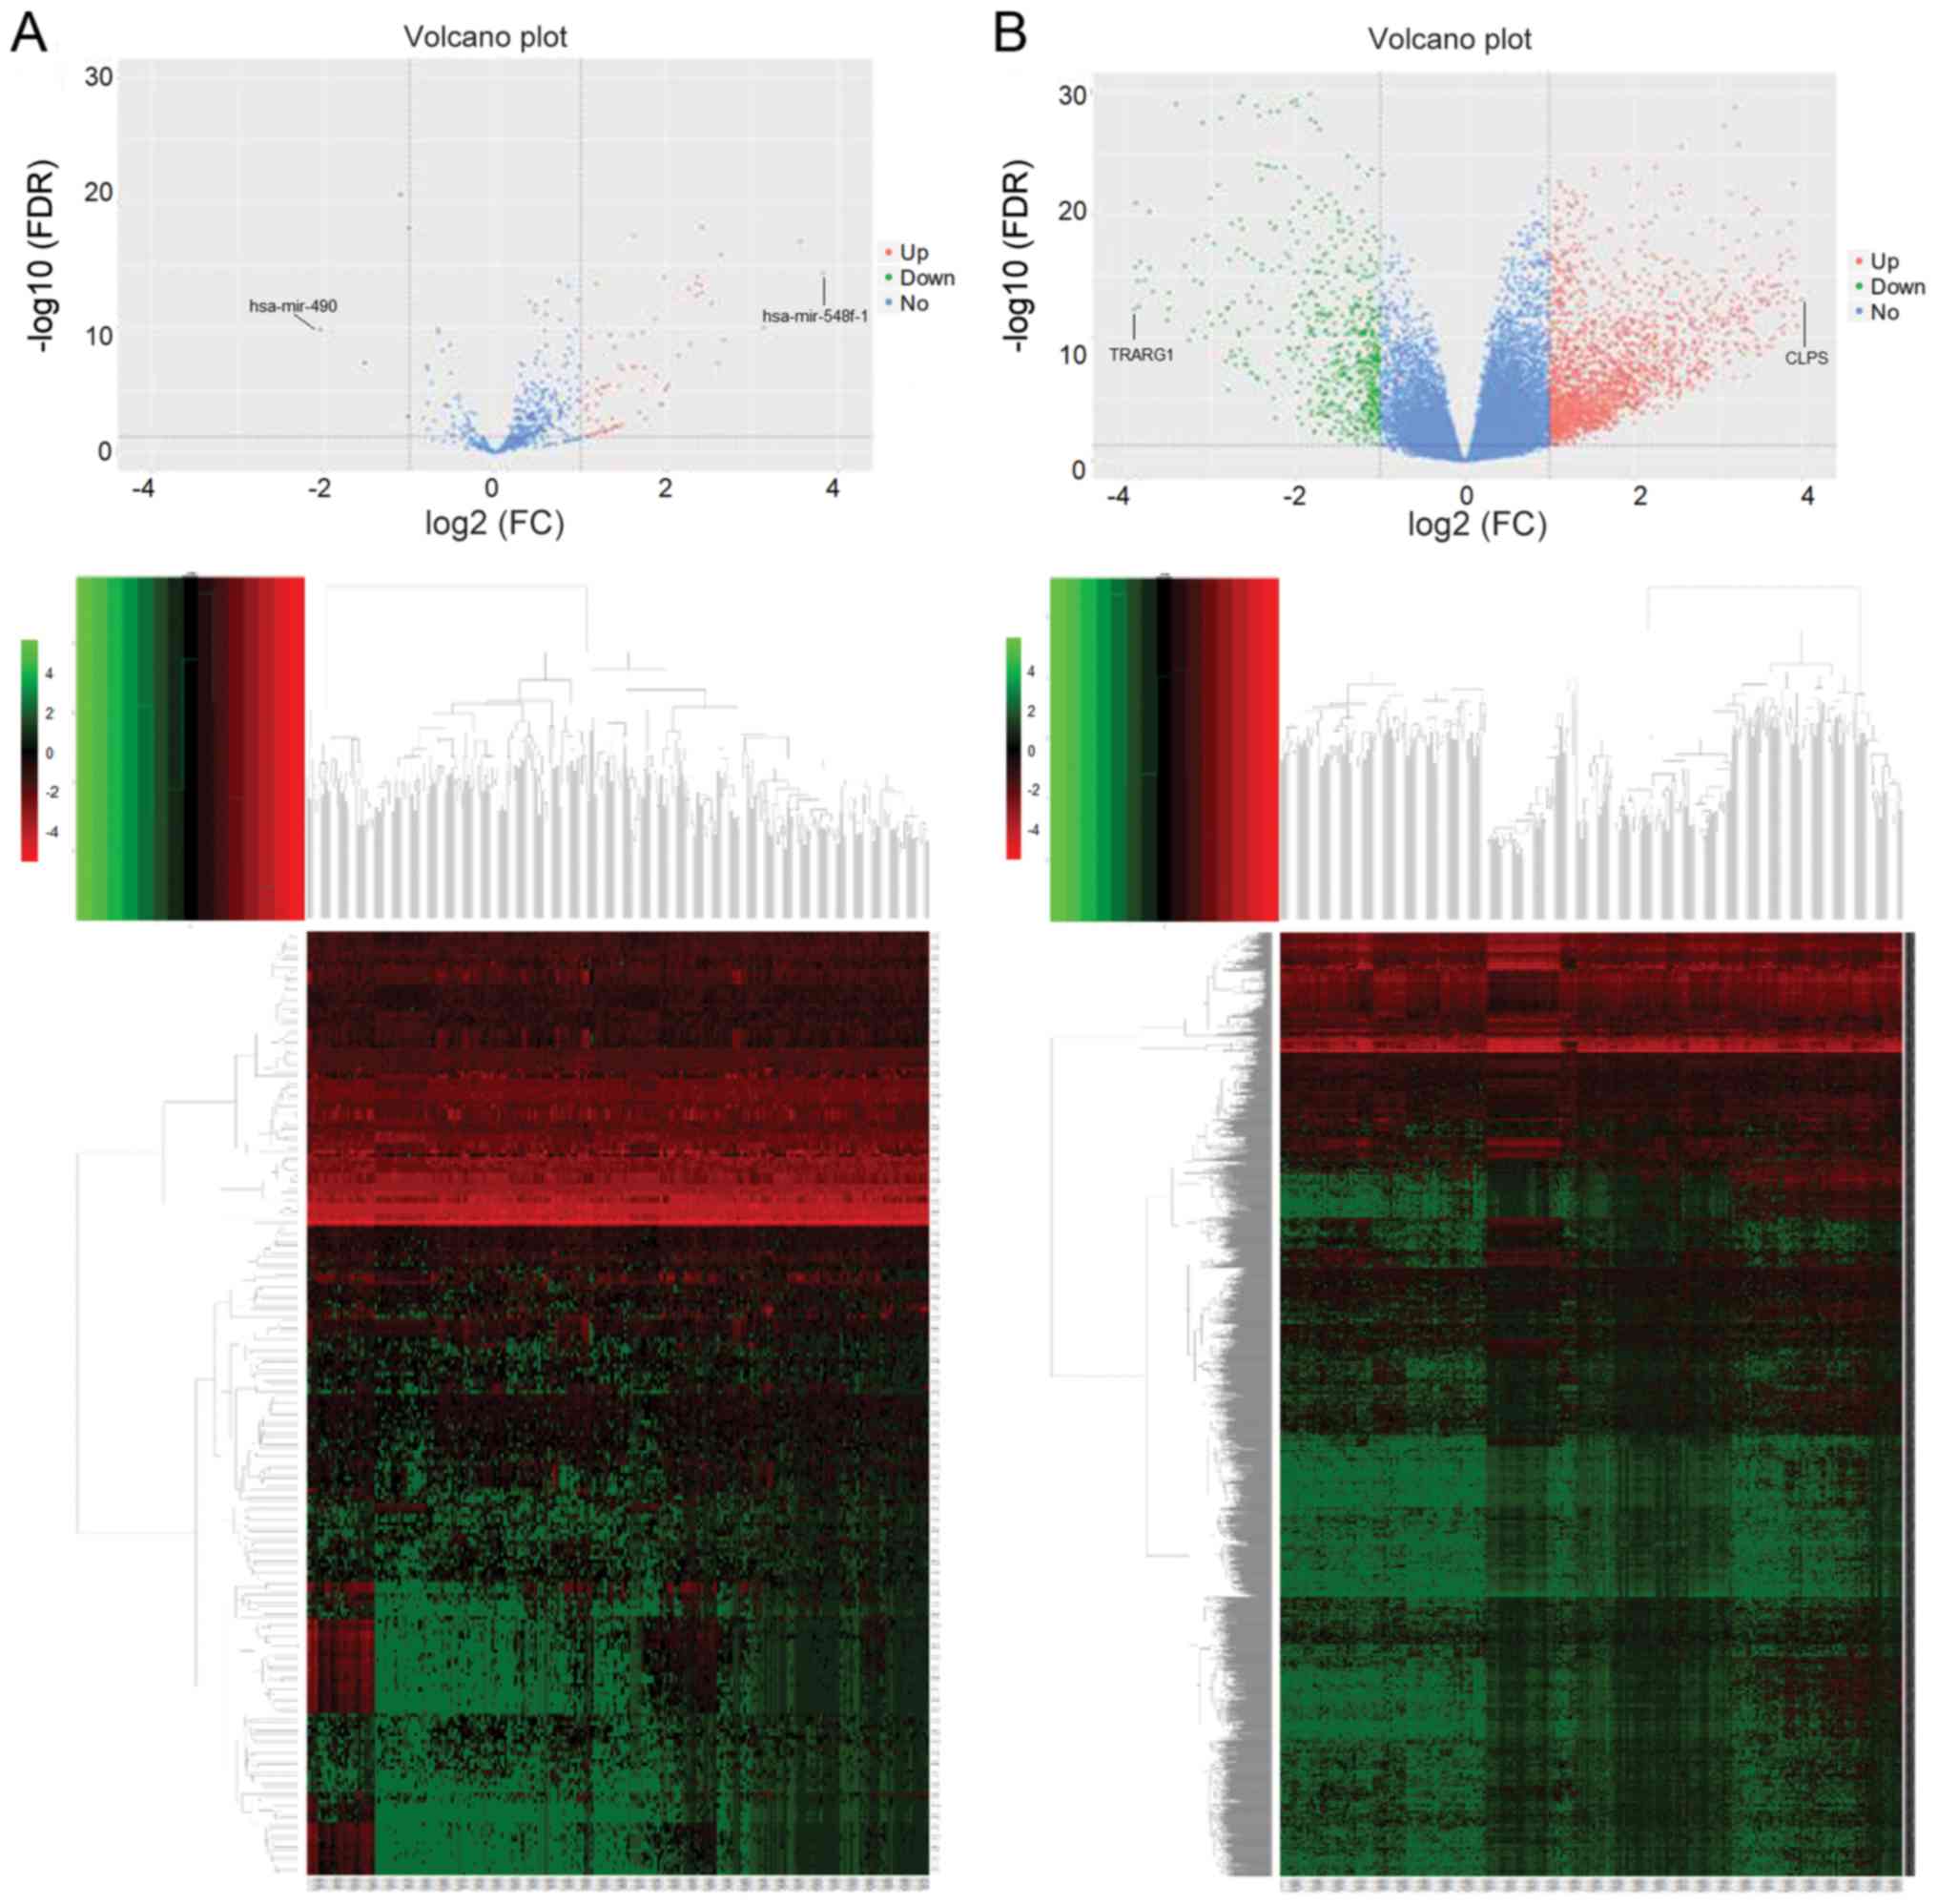
Analysis of DEGs and DEMs
miRNA expression in HCC samples with low CELSR3
expression was compared with that in samples with high CELSR3
expression, which identified 5 downregulated and 74 upregulated
miRNAs. A heatmap and volcano plot of the DEMs were generated using
the R v3.4.3 platform (Fig. 4A). The
aforementioned downregulated and upregulated miRNAs corresponded to
3,602 and 17,514 target genes, respectively. The same analysis
procedure was applied for the DEGs, which identified 625
downregulated and 2,077 upregulated genes. A heatmap and volcano
plot of the DEGs were generated (Fig.
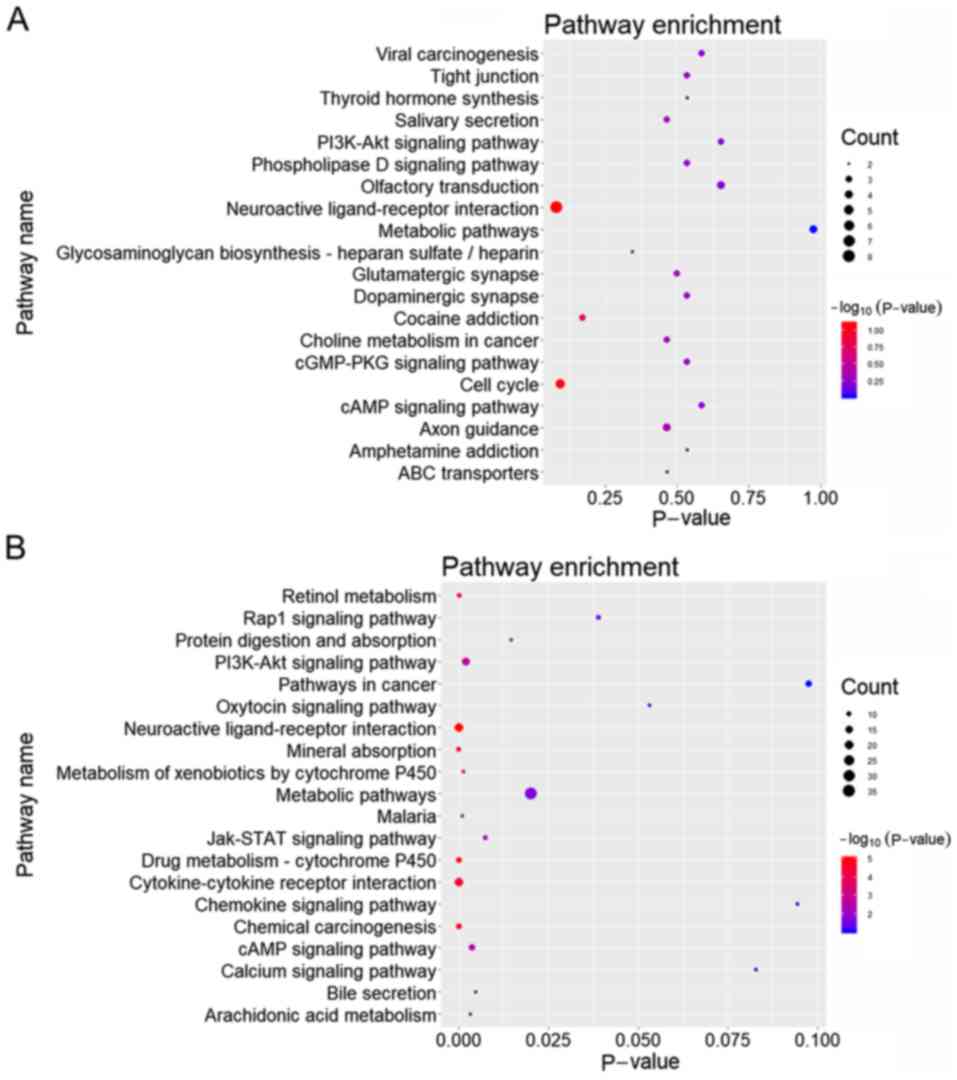
4B). KEGG pathway analysis was subsequently performed on 175
upregulated and 411 downregulated common genes between the DEGs and
the target genes of DEMs, and the top 20 pathways with the highest
enrichment were selected for plotting (Fig. 5A and B).
In order to further investigate the molecular
mechanisms, five target genes of the downregulated miRNAs were
paired with the upregulated genes, and 74 target genes of the
upregulated miRNAs were paired with the downregulated genes to
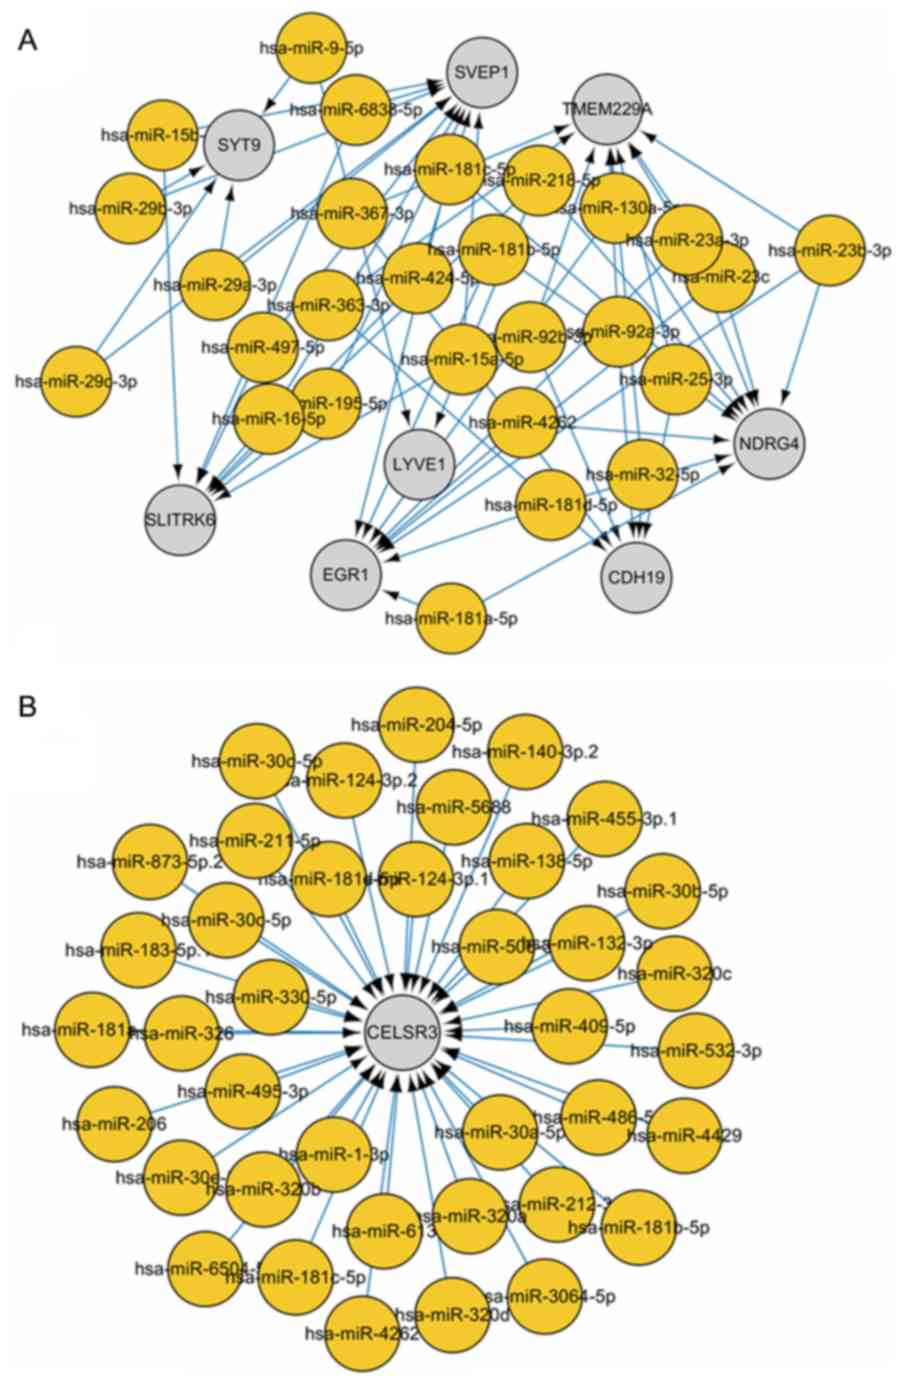
identify overlapping genes. Subsequently, a miRNA-mRNA regulatory
network was constructed based on the regulatory association between
miRNAs and mRNAs. In order to prevent bias, CELSR3 and its
connected nodes and edges were initially removed from the
miRNA-mRNA regulatory network (Fig.
6A). This was subsequently compared with the miRNA-mRNA
regulatory network containing CELSR3 alone (Fig. 6B), which identified miR-181 family
members, suggesting that miR-181 downregulated CELSR3 gene
expression in HCC.
Wnt/β-catenin signaling pathway
upregulates CELSR3 expression by downregulating miRNA-181
expression
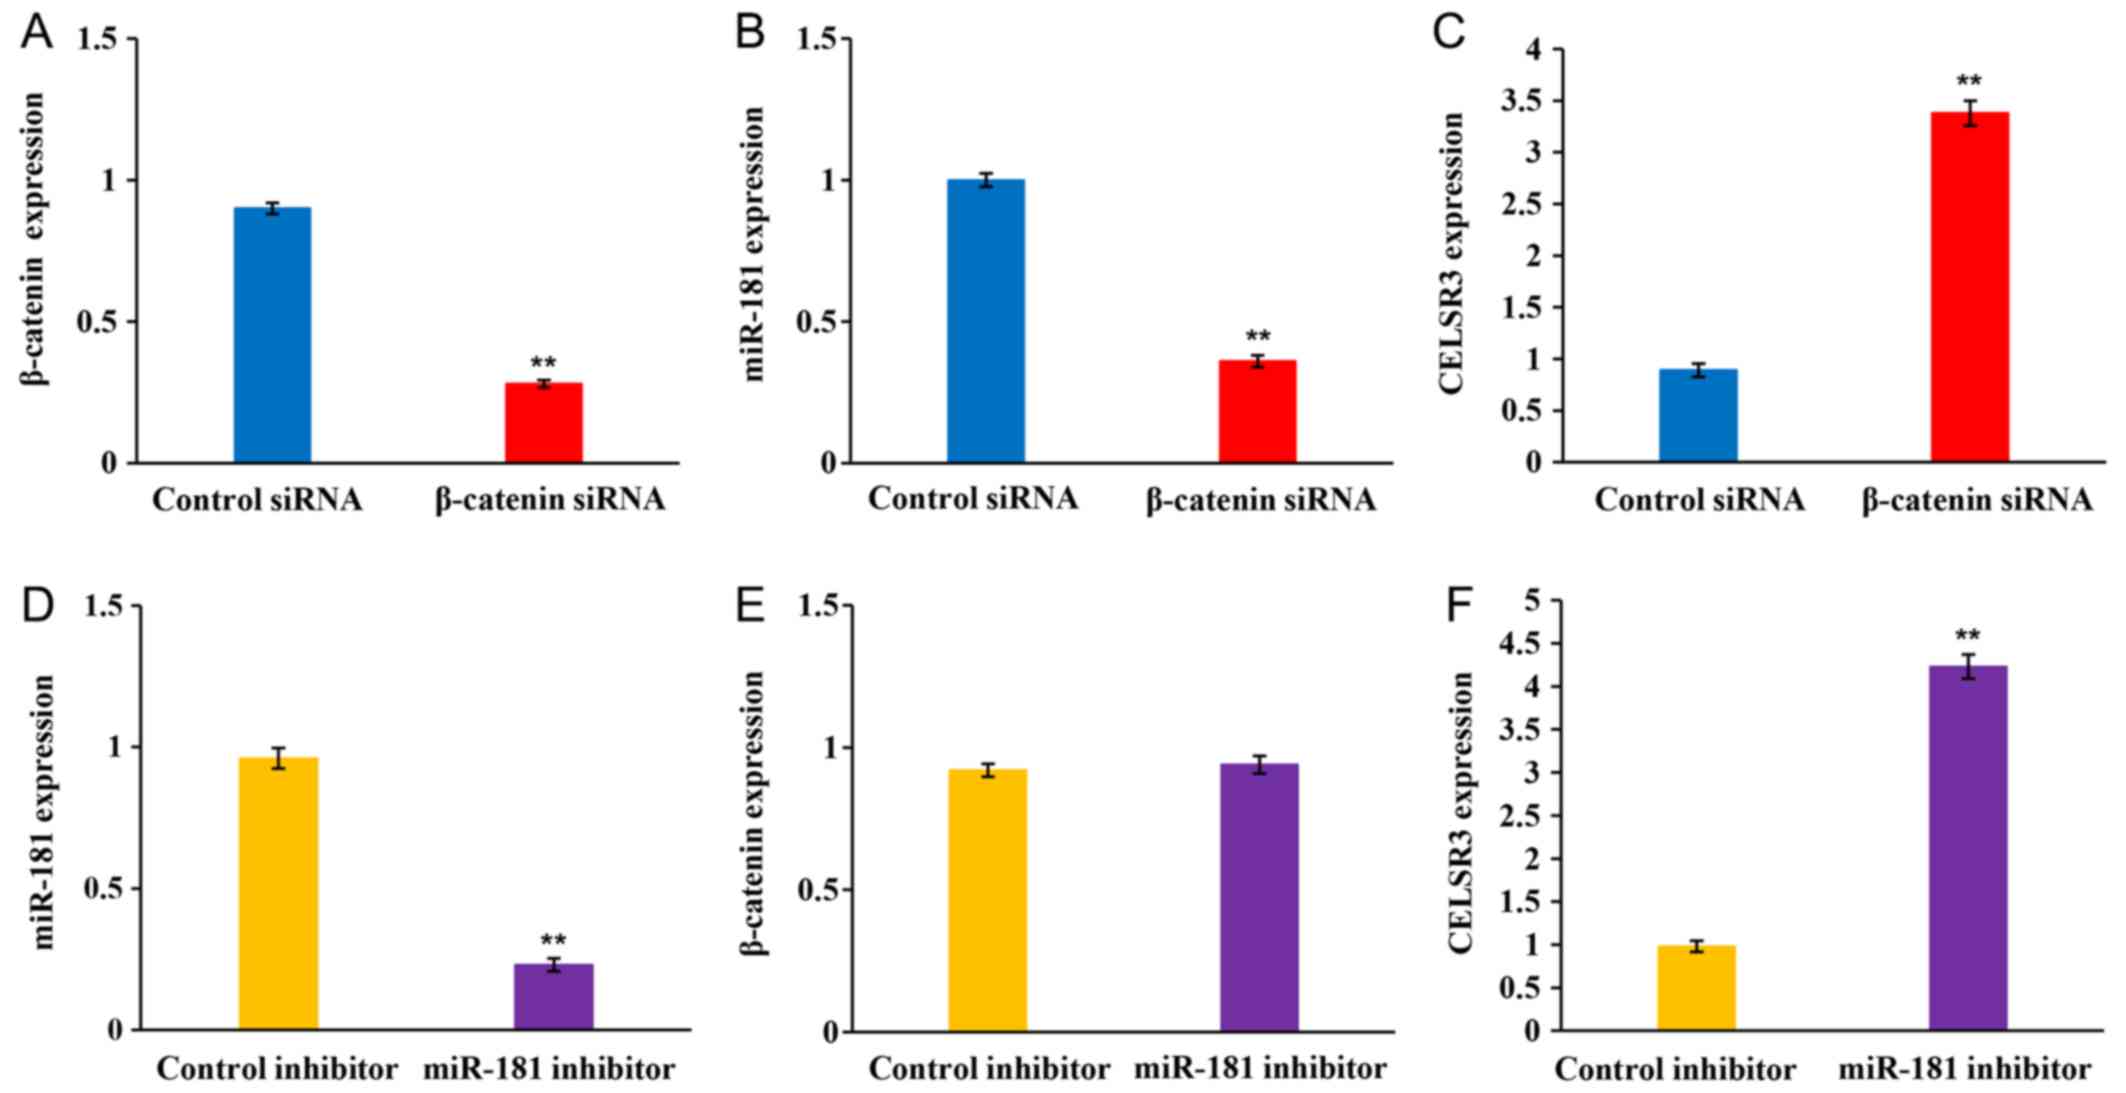
The present study performed RT-qPCR in SK-Hep-1
cells transfected with β-catenin siRNA or miR-181 inhibitor to
determine the associations between the Wnt/β-catenin signaling
pathway, miR-181 and CELSR3 expression in HCC progression.
β-catenin expression was significantly decreased following
transfection with β-catenin siRNA (Fig.
7A). In addition, β-catenin knockdown significantly decreased
miR-181 expression (Fig. 7B),
whereas CELSR3 expression was significantly upregulated following
transfection with β-catenin siRNA compared with the control siRNA
group (Fig. 7C). miR-181 expression
significantly decreased following transfection with miR-181
inhibitor (Fig. 7D). Notably,
miR-181 inhibition did not affect β-catenin expression (Fig. 7E), whereas CELSR3 expression was
significantly upregulated following transfection with miR-181
inhibitor compared with the control group (Fig. 7F). Overall, these results
demonstrated that inhibiting the Wnt/β-catenin signaling pathway
upregulated CELSR3 expression by downregulating miR-181
expression.
Discussion
CELSR3 has been reported to display a
cancer-specific pattern (15,16). A
3.04-fold increase in CALSR3 expression has been reported in
tumor-associated stellate cells compared with
inflammation-associated stellate cells (14). However, the clinicopathological
significance and functional role of CELSR3 upregulation in HCC has
not yet been fully determined. The present study aimed to
investigate the biological function of CELSR3 and determine its
underlying molecular mechanism in HCC based on information obtained
from TCGA database. The results demonstrated that CELSR3 was highly
expressed in the early stages of cancer and throughout the cancer
process. CNVs have been used to determine prognosis and subsequent
treatment strategies for different types of cancer (33). Methylation of DNA cytosine residues
at the carbon 5 position in cytosine-guanine dinucleotides is a
common epigenetic mechanism in eukaryotic DNA, which serves a key
role in regulating gene activities (34,35).
Furthermore, CELSR3 expression was not correlated with the DNA
methylation level of HCC. High CELSR3 expression was predictive of
poor overall survival time in patients with liver cancer. Taken
together, these results suggested that CELSR3 may serve a key role
in HCC tumorigenesis and prognosis, which, to the best of our
knowledge, has not been reported in previous studies.
In the present study, multiple candidate genes were
screened following integration of DEGs and target genes of DEMs,
which identified 175 upregulated and 411 downregulated genes.
Subsequent pathway enrichment analysis demonstrated that the
upregulated genes were predominantly enriched in ‘Neuroactive
ligand-receptor interaction’ and ‘Cell cycle’, whereas the
downregulated genes were primarily enriched in pathways of
‘Cytokine-cytokine receptor interaction’ and ‘Metabolic pathways’.
Neuroactive ligand-receptor interaction may be associated with HCC,
since genes expressed in human liver were previously reported to be
involved in neuroactive ligand receptor interaction pathways
(36). In addition, a previous study
has demonstrated that neuroactive ligand-receptor interaction is
observed in each stage of HCC (37).
Thus, this pathway appears to serve a key role in HCC progression.
C-kit is a receptor of the stem cell factor, the activation of
which is considered crucial for cell proliferation and migration
(38). Of note, the activation of
c-kit has been reported to attribute to the cell proliferation and
cirrhosis of HCC (39).
miRNA and mRNA expression profiling analyses were
performed in the present study using the data obtained from TCGA. A
total of five target genes of the downregulated miRNAs were paired
with the upregulated genes, and 74 target genes of the upregulated
miRNA were paired with the downregulated genes to identify
overlapping genes. This was combined with the integration analysis
between DEMs and DEGs to construct a miRNA-mRNA regulatory network.
In order to prevent bias, CELSR3, along with its connected nodes
and edges were initially removed from the miRNA-mRNA regulatory
network. This was subsequently compared with the miRNA-mRNA
regulatory network containing CELSR3 alone, which identified
miR-181 family members as the most common dysregulated miRNAs. The
results of the present study identified a novel association between
miR-181 and CELSR3 gene expression in HCC. The Wnt/β-catenin
signaling pathway has been demonstrated to directly regulate
miR-181 expression in HCC (40).
Although an integrated in silico analysis was
performed and a potential miRNA-mRNA regulatory network was
constructed, a number of limitations exist in the present study.
For example, implementing the median CELSR3 mRNA expression levels
as the cut-off values to divide high- and low-risk patients is an
arbitrary method, which makes it difficult to set a threshold for
prognostic marker detection (41–43).
Furthermore, the sample size of TCGA dataset included in the
present study was too small to demonstrate effective outcomes;
thus, future studies will aim to increase the patient sample size
to validate the respective findings.
In conclusion, the results of the present study
demonstrated that aberrant CELSR3 expression served an important
role in the pathogenesis and prognosis of HCC. In addition, CELSR3
expression was not correlated with the DNA methylation level of
HCC. Notably, a novel association was identified between miR-181
and CELSR3 mRNA expression in HCC, suggesting that the
miR-181-CELSR3 pair may regulate HCC progression. Upregulation of
CELSR3 may provide a potential therapeutic target for HCC, since
the protein encoded by this gene is located at the plasma membrane
and has intriguing signaling capabilities (44). Based on their known biological
functions, it is worth further investigating the association
between miR-181 and CELSR3 expression, their molecular mechanism
and therapeutic value.
Supplementary Material
Supporting Data
Acknowledgements
Not applicable.
Funding
The present study was funded by the Science
Foundation of the Hunan Province, Key Development Program (grant
no. 2017SK2054).
Availability of data and materials
The datasets used and/or analyzed during the present
study are available from the corresponding author on reasonable
request. The TCGA-LIHC dataset is available from TCGA database
(https://cancergenome.nih.gov).
Authors' contributions
ZW and XO contributed to the design of the study,
wrote the manuscript and analysed the data. ZW revised the
manuscript. GZ acquired, analysed and interpreted the data. LY made
substantial contributions to the conception and design of the
present study and revised the manuscript. All authors read and
approved the final manuscript.
Ethics approval and consent to
participate
Not applicable.
Patient consent for publication
Not applicable.
Competing interests
The authors declare that they have no competing
interests.
References
|
1
|
Allemani C, Matsuda T, Di Carlo V,
Harewood R, Matz M, Nikšić M, Bonaventure A, Valkov M, Johnson CJ,
Estève J, et al: Global surveillance of trends in cancer survival
2000–14 (CONCORD-3): Analysis of individual records for 37 513 025
patients diagnosed with one of 18 cancers from 322 population-based
registries in 71 countries. Lancet. 391:1023–1075. 2018. View Article : Google Scholar : PubMed/NCBI
|
|
2
|
Venook AP, Papandreou C, Furuse J and de
Guevara LL: The incidence and epidemiology of hepatocellular
carcinoma: A global and regional perspective. Oncologist. 15 (Suppl
4):S5–S13. 2010. View Article : Google Scholar
|
|
3
|
Stepien M, Fedirko V, Duarte-Salles T,
Ferrari P, Freisling H, Trepo E, Trichopoulou A, Bamia C,
Weiderpass E, Olsen A, et al: Prospective association of liver
function biomarkers with development of hepatobiliary cancers.
Cancer Epidemiol. 40:179–187. 2016. View Article : Google Scholar : PubMed/NCBI
|
|
4
|
Bhangui P, Adam R, Vibert E, Azoulay D,
Samuel D and Castaing D: 41 resection or transplantation for early
hepatocellular carcinoma in a cirrhotic liver-size does matter. J
Clin Exp Hepatol. 1:1512011. View Article : Google Scholar
|
|
5
|
Simoneau E, Hassanain M, Madkhali A,
Salman A, Nudo CG, Chaudhury P and Metrakos P:
(18)F-Fluorodeoxyglucose positron-emission tomography could have a
prognostic role in patients with advanced hepatocellular carcinoma.
Curr Oncol. 21:e551–e556. 2014. View Article : Google Scholar : PubMed/NCBIPubMed/NCBI
|
|
6
|
Trevisani F, Cantarini MC, Wands JR and
Bernardi M: Recent advances in the natural history of
hepatocellular carcinoma. Carcinogenesis. 29:1299–1305. 2008.
View Article : Google Scholar : PubMed/NCBI
|
|
7
|
Zheng H, Zou AE, Saad MA, Wang XQ, Kwok
JG, Korrapati A, Li P, Kisseleva T, Wang-Rodriguez J and Ongkeko
WM: Alcohol-dysregulated microRNAs in hepatitis B virus-related
hepatocellular carcinoma. PLoS One. 12:e01785472017. View Article : Google Scholar : PubMed/NCBI
|
|
8
|
Wang XJ, Zhang DL, Xu ZG, Ma ML, Wang WB,
Li LL, Han XL, Huo Y, Yu X and Sun JP: Understanding cadherin EGF
LAG seven-pass G-type receptors. J Neurochem. 131:699–711. 2014.
View Article : Google Scholar : PubMed/NCBI
|
|
9
|
Usui T, Shima Y, Shimada Y, Hirano S,
Burgess RW, Schwarz TL, Takeichi M and Uemura T: Flamingo, a
seven-pass transmembrane cadherin, regulates planar cell polarity
under the control of Frizzled. Cell. 98:585–595. 1999. View Article : Google Scholar : PubMed/NCBI
|
|
10
|
Langenhan T, Aust G and Hamann J: Sticky
signaling-adhesion class G protein-coupled receptors take the
stage. Sci Signal. 6:re32013. View Article : Google Scholar : PubMed/NCBI
|
|
11
|
Jeong P, Ha YS, Cho IC, Yun SJ, Yoo ES,
Kim IY, Choi YH, Moon SK and Kim WJ: Three-gene signature predicts
disease progression of non-muscle invasive bladder cancer. Oncol
Lett. 2:679–684. 2011. View Article : Google Scholar : PubMed/NCBI
|
|
12
|
Anwar SL and Lehmann U: DNA methylation,
microRNAs, and their crosstalk as potential biomarkers in
hepatocellular carcinoma. World J Gastroenterol. 20:7894–7913.
2014. View Article : Google Scholar : PubMed/NCBI
|
|
13
|
Ricketts CJ, Morris MR, Gentle D, Brown M,
Wake N, Woodward ER, Clarke N, Latif F and Maher ER: Genome-wide
CpG island methylation analysis implicates novel genes in the
pathogenesis of renal cell carcinoma. Epigenetics. 7:278–290. 2012.
View Article : Google Scholar : PubMed/NCBI
|
|
14
|
Erkan M, Weis N, Pan Z, Schwager C,
Samkharadze T, Jiang X, Wirkner U, Giese NA, Ansorge W, Debus J, et
al: Organ-, inflammation- and cancer specific transcriptional
fingerprints of pancreatic and hepatic stellate cells. Mol Cancer.
9:882010. View Article : Google Scholar : PubMed/NCBI
|
|
15
|
Gu X, Li H, Sha L, Mao Y, Shi C and Zhao
W: CELSR3 mRNA expression is increased in hepatocellular carcinoma
and indicates poor prognosis. PeerJ. 7:e78162019. View Article : Google Scholar : PubMed/NCBI
|
|
16
|
Khor GH, Froemming GR, Zain RB, Abraham TM
and Lin TK: Involvement of CELSR3 hypermethylation in primary oral
squamous cell carcinoma. Asian Pac J Cancer Prev. 17:219–223. 2016.
View Article : Google Scholar : PubMed/NCBI
|
|
17
|
Xie Z, Dang Y, Wu H, He R, Ma J, Peng Z,
Rong M, Li Z, Yang J, Jiang Y, et al: Effect of CELSR3 on the cell
cycle and apoptosis of hepatocellular carcinoma cells. J Cancer.
11:2830–2844. 2020. View Article : Google Scholar : PubMed/NCBI
|
|
18
|
Hayes CN and Chayama K: MicroRNAs as
biomarkers for liver disease and hepatocellular carcinoma. Int J
Mol Sci. 17:2802016.
|
|
19
|
Tat TT, Maroney PA, Chamnongpol S, Coller
J and Nilsen TW: Cotranslational microRNA mediated messenger RNA
destabilization. Elife. 5:e128802016. View Article : Google Scholar : PubMed/NCBI
|
|
20
|
Zhang X, Xu X, Ge G, Zang X, Shao M, Zou
S, Zhang Y, Mao Z, Zhang J, Mao F, et al: miR498 inhibits the
growth and metastasis of liver cancer by targeting ZEB2. Oncol Rep.
41:1638–1648. 2019.PubMed/NCBI
|
|
21
|
Liu H: MicroRNAs in breast cancer
initiation and progression. Cell Mol Life Sci. 69:3587–3599. 2012.
View Article : Google Scholar : PubMed/NCBI
|
|
22
|
Chu R, Mo G, Duan Z, Huang M, Chang J, Li
X and Liu P: miRNAs affect the development of hepatocellular
carcinoma via dysregulation of their biogenesis and expression.
Cell Commun Signal. 12:452014. View Article : Google Scholar : PubMed/NCBI
|
|
23
|
Fang T, Lv H, Lv G, Li T, Wang C, Han Q,
Yu L, Su B, Guo L, Huang S, et al: Tumor-derived exosomal
miR-1247-3p induces cancer-associated fibroblast activation to
foster lung metastasis of liver cancer. Nat Commun. 9:1912018.
View Article : Google Scholar : PubMed/NCBI
|
|
24
|
Liu J, Lichtenberg T, Hoadley KA, Poisson
LM, Lazar AJ, Cherniack AD, Kovatich AJ, Benz CC, Levine DA, Lee
AV, et al: An integrated TCGA pan-cancer clinical data resource to
drive high-quality survival outcome analytics. Cell.
173:400–416.e11. 2018. View Article : Google Scholar : PubMed/NCBI
|
|
25
|
Robinson MD, McCarthy DJ and Smyth GK:
edgeR: A Bioconductor package for differential expression analysis
of digital gene expression data. Bioinformatics. 26:139–140. 2010.
View Article : Google Scholar : PubMed/NCBI
|
|
26
|
Lu TX and Rothenberg ME: MicroRNA. J
Allergy Clin Immunol. 141:1202–1207. 2018. View Article : Google Scholar : PubMed/NCBI
|
|
27
|
Kertesz M, Iovino N, Unnerstall U, Gaul U
and Segal E: The role of site accessibility in microRNA target
recognition. Nat Genet. 39:1278–1284. 2007. View Article : Google Scholar : PubMed/NCBI
|
|
28
|
Rehmsmeier M, Steffen P, Hochsmann M and
Giegerich R: Fast and effective prediction of microRNA/target
duplexes. RNA. 10:1507–1517. 2004. View Article : Google Scholar : PubMed/NCBI
|
|
29
|
Chung TK, Lau TS, Cheung TH, Yim SF, Lo
KW, Siu NS, Chan LK, Yu MY, Kwong J, Doran G, et al: Dysregulation
of microRNA-204 mediates migration and invasion of endometrial
cancer by regulating FOXC1. Int J Cancer. 130:1036–1045. 2012.
View Article : Google Scholar : PubMed/NCBI
|
|
30
|
Shannon P, Markiel A, Ozier O, Baliga NS,
Wang JT, Ramage D, Amin N, Schwikowski B and Ideker T: Cytoscape: A
software environment for integrated models of biomolecular
interaction networks. Genome Res. 13:2498–2504. 2003. View Article : Google Scholar : PubMed/NCBI
|
|
31
|
Xie C, Mao X, Huang J, Ding Y, Wu J, Dong
S, Kong L, Gao G, Li CY and Wei L: KOBAS 2.0: A web server for
annotation and identification of enriched pathways and diseases.
Nucleic Acids Res. 39:W316–W322. 2011. View Article : Google Scholar : PubMed/NCBI
|
|
32
|
Livak KJ and Schmittgen TD: Analysis of
relative gene expression data using real-time quantitative PCR and
the 2(-Delta Delta C(T)) method. Methods. 25:402–408. 2001.
View Article : Google Scholar : PubMed/NCBI
|
|
33
|
Lee JW, Son MH, Cho HW, Ma YE, Yoo KH,
Sung KW and Koo HH: Clinical significance of MYCN amplification in
patients with high-risk neuroblastoma. Pediatr Blood Cancer.
65:e272572018. View Article : Google Scholar : PubMed/NCBI
|
|
34
|
Laisné M, Gupta N, Kirsh O, Pradhan S and
Defossez PA: Mechanisms of DNA methyltransferase recruitment in
mammals. Genes (Basel). 9:6172018. View Article : Google Scholar
|
|
35
|
Roos L, van Dongen J, Bell CG, Burri A,
Deloukas P, Boomsma DI, Spector TD and Bell J: Integrative DNA
methylome analysis of pan-cancer biomarkers in cancer discordant
monozygotic twin-pairs. Clin Epigenetics. 8:72016. View Article : Google Scholar : PubMed/NCBI
|
|
36
|
Li H, Zhao X, Li C, Sheng C and Bai Z:
Integrated analysis of lncRNA-associated ceRNA network reveals
potential biomarkers for the prognosis of hepatitis B virus-related
hepatocellular carcinoma. Cancer Manag Res. 11:877–897. 2019.
View Article : Google Scholar : PubMed/NCBI
|
|
37
|
Zhao Y, Xue F, Sun J, Guo S, Zhang H, Qiu
B, Geng J, Gu J, Zhou X, Wang W, et al: Genome-wide methylation
profiling of the different stages of hepatitis B virus-related
hepatocellular carcinoma development in plasma cell-free DNA
reveals potential biomarkers for early detection and high-risk
monitoring of hepatocellular carcinoma. Clin Epigenetics. 6:302014.
View Article : Google Scholar : PubMed/NCBI
|
|
38
|
Kazi JU and Rönnstrand L: FMS-like
Tyrosine kinase 3/FLT3: From basic science to clinical
implications. Physiol Rev. 99:1433–1466. 2019. View Article : Google Scholar : PubMed/NCBI
|
|
39
|
Lebron MB, Brennan L, Damoci CB, Prewett
MC, O'Mahony M, Duignan IJ, Credille KM, DeLigio JT, Starodubtseva
M, Amatulli M, et al: A human monoclonal antibody targeting the
stem cell factor receptor (c-Kit) blocks tumor cell signaling and
inhibits tumor growth. Cancer Biol Ther. 15:1208–1218. 2014.
View Article : Google Scholar : PubMed/NCBI
|
|
40
|
Ji J, Yamashita T and Wang XW:
Wnt/beta-catenin signaling activates microRNA-181 expression in
hepatocellular carcinoma. Cell Biosci. 1:42011. View Article : Google Scholar : PubMed/NCBI
|
|
41
|
Lu Y, Wang L, Liu P, Yang P and You M:
Gene-expression signature predicts postoperative recurrence in
stage I non-small cell lung cancer patients. PLoS One.
7:e308802012. View Article : Google Scholar : PubMed/NCBI
|
|
42
|
Zhu CQ, Ding K, Strumpf D, Weir BA,
Meyerson M, Pennell N, Thomas RK, Naoki K, Ladd-Acosta C, Liu N, et
al: Prognostic and predictive gene signature for adjuvant
chemotherapy in resected non-small-cell lung cancer. J Clin Oncol.
28:4417–4424. 2010. View Article : Google Scholar : PubMed/NCBI
|
|
43
|
Subramanian J and Simon R: Gene
expression-based prognostic signatures in lung cancer: Ready for
clinical use? J Natl Cancer Inst. 102:464–474. 2010. View Article : Google Scholar : PubMed/NCBI
|
|
44
|
Feng J, Xu Y, Wang M, Ruan Y, So KF,
Tissir F, Goffinet A and Zhou L: A role for atypical cadherin
Celsr3 in hippocampal maturation and connectivity. J Neurosci.
32:13729–13743. 2012. View Article : Google Scholar : PubMed/NCBI
|