Introduction
Ovarian cancer is one of the most serious threats to
reproductive health in women, which is estimated to account for
~21,750 new cases and 13,940 mortalities in the United States in
2020, with the highest mortality rate among female reproductive
system malignancies (1). For
patients initially diagnosed with ovarian epithelial cancer, the
standard treatment is tumour resection and chemotherapy (2). Carboplatin combined with paclitaxel is
currently the standard first-line chemotherapy for patients with
ovarian cancer (3), whereas
carboplatin combined with pegylated liposomal doxorubicin is
considered as an alternative to standard therapy (4). Alternatively, carboplatin plus
topotecan co-treatment is recommended in patients who are allergic
to paclitaxel (5). However, owing to
the differences observed between individual patients with ovarian
cancer and due to tumour heterogeneity, patient sensitivity and
tolerance to different drugs differ (6). Thus, improved treatment plans for
precision medicine would benefit patient outcome. Considering the
different mechanisms of action of topotecan and three other common
drugs, including cisplatin, doxorubicin and paclitaxel (7–10), the
National Cancer Institute Clinical Trial Group in collaboration
with the European Cancer Research and Treatment Organization
successfully completed a phase II clinical trial to evaluate the
triple combination of cisplatin, topotecan and paclitaxel in
patients with advanced epithelial ovarian cancer (11). However, Brotto et al (12) and Hoskins et al (13) found that the combination of these
three drugs did not significantly improve the quality of life of
patients compared with the standard drug regimen of carboplatin
plus paclitaxel, and increased the side effects experienced by the
patients. Therefore, considering the efficacy and side effects,
identifying the optimal combination of two drugs for individual
patients is very important.
Clinical trials are the best method of studying the
efficacy of chemotherapy regimens (14), but these are time-consuming and
precision medicine is difficult to achieve (15). A phase III clinical trial conducted
in Italy found that the overall survival and efficacy of
carboplatin combined with doxorubicin is not superior to
carboplatin plus paclitaxel; besides, different drug combinations
display different side effects (16). It is recommended that drugs are
selected based on patient tolerance to side effects. Another phase
III clinical trial in France found that the progression-free
survival (PFS) and efficacy of carboplatin combined with
doxorubicin was superior to carboplatin plus paclitaxel in elderly
patients (17). A number of phase
III clinical trials found that carboplatin combined with topotecan
reduced side effects in patients, whereas progression-free survival
and overall survival were not higher compared with carboplatin plus
paclitaxel (18,19). However, this large-scale clinical
trial was not suitable for individualised treatment due to tumour
heterogeneity. Therefore, the data analysis methods presented in
the current study may provide ideas and directions for basic
research as well as indicate a design for future clinical
trials.
To date, many data analysis studies on the
expression profiles of common chemotherapeutic drug resistance
genes in ovarian cancer have been performed. As reviewed by
Galluzzi et al (20), these
studies aimed to screen crucial molecules to reverse the drug
resistance of ovarian cancer using corresponding target inhibitors
or activators to restore chemosensitivity of tumour cells.
Currently, the relationship between differentially expressed genes
(DEGs) and clinical medication guidance has not yet been
determined. Through the integrated analysis of gene expression
profiling microarray data of four first-line chemotherapy drugs,
cisplatin, doxorubicin, paclitaxel and topotecan, the present study
aimed to identify effective and reliable molecular markers to
provide guidance for the selection of clinical chemotherapy drugs.
In this study, overlapping DEGs between the four different groups
of drug-resistant ovarian cancer cells were identified by Venn map
analysis, protein-protein interaction networks were generate,
associated hub genes were identified and the accuracy of these hub
genes was verified by in vitro experiments and data from The
Cancer Genome Atlas (TCGA), which were used to determine possible
effective treatment options for clinical treatment of patients with
ovarian cancer.
Materials and methods
Microarray data
The GSE73935 microarray dataset was downloaded from
the Gene Expression Omnibus (GEO) database (http://www.ncbi.nlm.nih.gov/geo). These RNA profiles
were based on GPL13667 (HG-U219) Affymetrix human genome U219
beadchip platform containing a total of six cisplatin-resistant
ovarian cell sublines (A2780), six doxorubicin-resistant cell
sublines, six paclitaxel-resistant cell sublines, six
topotecan-resistant cell sublines and three sensitive control cell
sublines.
Identification of DEGs
Following data standardisation, the ‘limma’ package
in R software (version 3.5, http://www.r-project.org) was applied to screen DEGs
between the four groups of resistant ovarian cancer cell lines and
the sensitive controls. Genes with P<0.01 and |log2
[fold change (FC)]|>2 were considered as DEGs. Considering that
the first line of clinical therapy is the combination of two drugs,
the DEGs in each group were classified and further overlapped using
the ‘VennDiagram’ package within R software. The genes that were
upregulated or downregulated in several drug-resistant cell lines
under the same classification were classified as overlapping DEGs.
The combination of drugs mainly included cisplatin combined with
doxorubicin, paclitaxel or topotecan, and paclitaxel combined with
doxorubicin or topotecan.
Gene Ontology (GO) functional term and
Kyoto Encyclopedia of Genes and Genomes (KEGG) pathway enrichment
analysis
To determine the potential biological functions of
the overlapping DEGs, GO (http://www.geneontology.org) term enrichment analysis
was performed based on three aspects; biological process (BP),
molecular function (MF) and cellular component (CC). Subsequently
KEGG (http://www.genome.jp/kegg) pathway
enrichment analysis was conducted to investigate the potential
signalling pathways related to the overlapping DEGs. GO term and
KEGG pathway enrichment analyses were performed using R
software.
Protein-protein interaction (PPI)
network construction and hub gene analysis
The potential interactions of the overlapping DEGs
were analysed using STRING (https://string-db.org) software tool. PPI score was
set to 0.4, and all isolated nodes were hidden. Subsequently, the
PPI network was visualised and further analysed using Cytoscape
software (www.cytoscape.org). The ‘CentiScaPe’
plug-in of Cytoscape was used to calculate the degree and
betweenness parameters of the PPI network; it was stipulated that a
gene with degree ≥ meandegree + standard deviation
(SDdegree) satisfying betweenness ≥
meanbetweenness + SDbetweenness was a hub
gene. It was postulated that hub genes are essential for protein
networks encoded by chemoresistance-related genes of ovarian
cancer. To further confirm the reliability of the hub genes
generated by the bioinformatics analysis, reverse
transcription-quantitative PCR (RT-qPCR) was conducted to analyse
the hub gene expression with respect to paclitaxel resistance.
Kaplan-Meier survival curve
Clinical data of patients with ovarian cancer were
accessed from TCGA (https://cancergenome.nih.gov), which includes public
genomic data. The Kaplan-Meier curve was generated using
Kaplan-Meier plotter (https://kmplot.com/) and SPSS software (version 19.0;
IBM Corp.). The log-rank and Tarone-Ware tests were used to
determine statistical significance. Patients were grouped according
to the quartile of the gene's FPKM value, with those before the
first quartile as low expression and those after the third quartile
as high expression. Kaplan-Meier survival curves were used to
observe the effect of gene expression on the prognosis of different
clinical groups. In addition, immunohistochemical data from
patients with ovarian cancer were obtained from The Human Protein
Atlas (HPA) database (https://www.proteinatlas.org).
Cell lines and RT-qPCR
The paclitaxel-sensitive human ovarian cancer cell
line A2780 and the paclitaxel-resistant cell line A2780/PA were
obtained from the BeNa Culture Collection (Beijing, China). All
cell lines were cultured in RPMI-1640 medium (Gibco; Thermo Fisher
Scientific, Inc.) supplemented with 10% FBS (Gibco; Thermo Fisher
Scientific, Inc.), 50 U/ml penicillin and 50 U/ml streptomycin at
37°C in 5% CO2. The medium of A2780/PA cells was
supplemented with 800 ng/ml paclitaxel (Invitrogen; Thermo Fisher
Scientific, Inc.) to maintain its drug-resistance phenotype.
Total RNA was extracted from A2780/PA and A2780
cells using TRIzol® (Invitrogen; Thermo Fisher
Scientific Inc.). Then 2 µg of total RNA was used to synthesise
cDNA, using the High Capacity RNA-to-cDNA kit (TaqMan, Applied
Biosystems). mRNA levels were examined using TransStart Top Green
qPCR SuperMix (TransGen Biotech Co., Ltd). The relative expression
level of each target gene was normalised to ACTB (internal
control; Forward, 5′-CTTAGTTGCGTTACACCCTTTCTTG-3′ and reverse,
5′-CTGTCACCTTCACCGTTCCAGTTT-3′) using a 2−ΔΔCq relative
quantification method (21,22). All reactions were performed using the
following cycling parameters: Initial denaturation at 94°C for 30
sec; followed by 45 cycles of 94°C for 5 sec, 60°C for 15 sec and
72°C for 10 sec. Primer sequences are provided on Table SI.
Measurement of reactive oxygen species
(ROS)
The oxidant-sensitive dye
dichloro-dihydro-fluorescein diacetate (DCFH-DA; Beyotime Institute
of Biotechnology) was used to detect intracellular ROS levels.
Exponentially growing A2780 and A2780/PA cells were seeded in
6-well culture plates at a density of 3×10⁵ cells/well.
After 24 h of incubation, the fresh medium was changed and 400
ng/ml paclitaxel was added for 12 h. Then the cells were
trypsinized and incubated in 2 ml DCFH-DA (10 µM) working solution
for 20 min at 37°C in the dark, washed with PBS twice and then
evaluated using a guava easyCyte flow cytometer (Millipore). Data
analysis was performed using ExpressPro software (version 8.1;
Millipore).
Measurement of lipid peroxidation
The fluorescent lipid peroxidation reporter molecule
C11-BODIPY (Beyotime Institute of Biotechnology) was detected lipid
peroxidation. Exponentially growing A2780 and A2780/PA cells were
seeded in 6-well culture plates at a density of 3×10⁵
cells/well. After 24 h of incubation, the fresh medium was changed
and 400 ng/ml paclitaxel was added for 12 h. Then the cells were
trypsinized and incubated in 2 ml C11-BODIPY (10 µM) working
solution for 20 min at 37°C in the dark, washed with PBS twice and
then evaluated using a guava easyCyte flow cytometer (Millipore).
Data analysis was performed using ExpressPro software.
Statistical analysis
Data are expressed as the mean ± standard error of
the mean of three independent experiments. Statistical analysis was
performed using SPSS 19.0 software (IBM Corp.). Student's t-test
was used to compare the mean values of two groups. P<0.05 was
considered to indicate a statistically significant difference.
Results
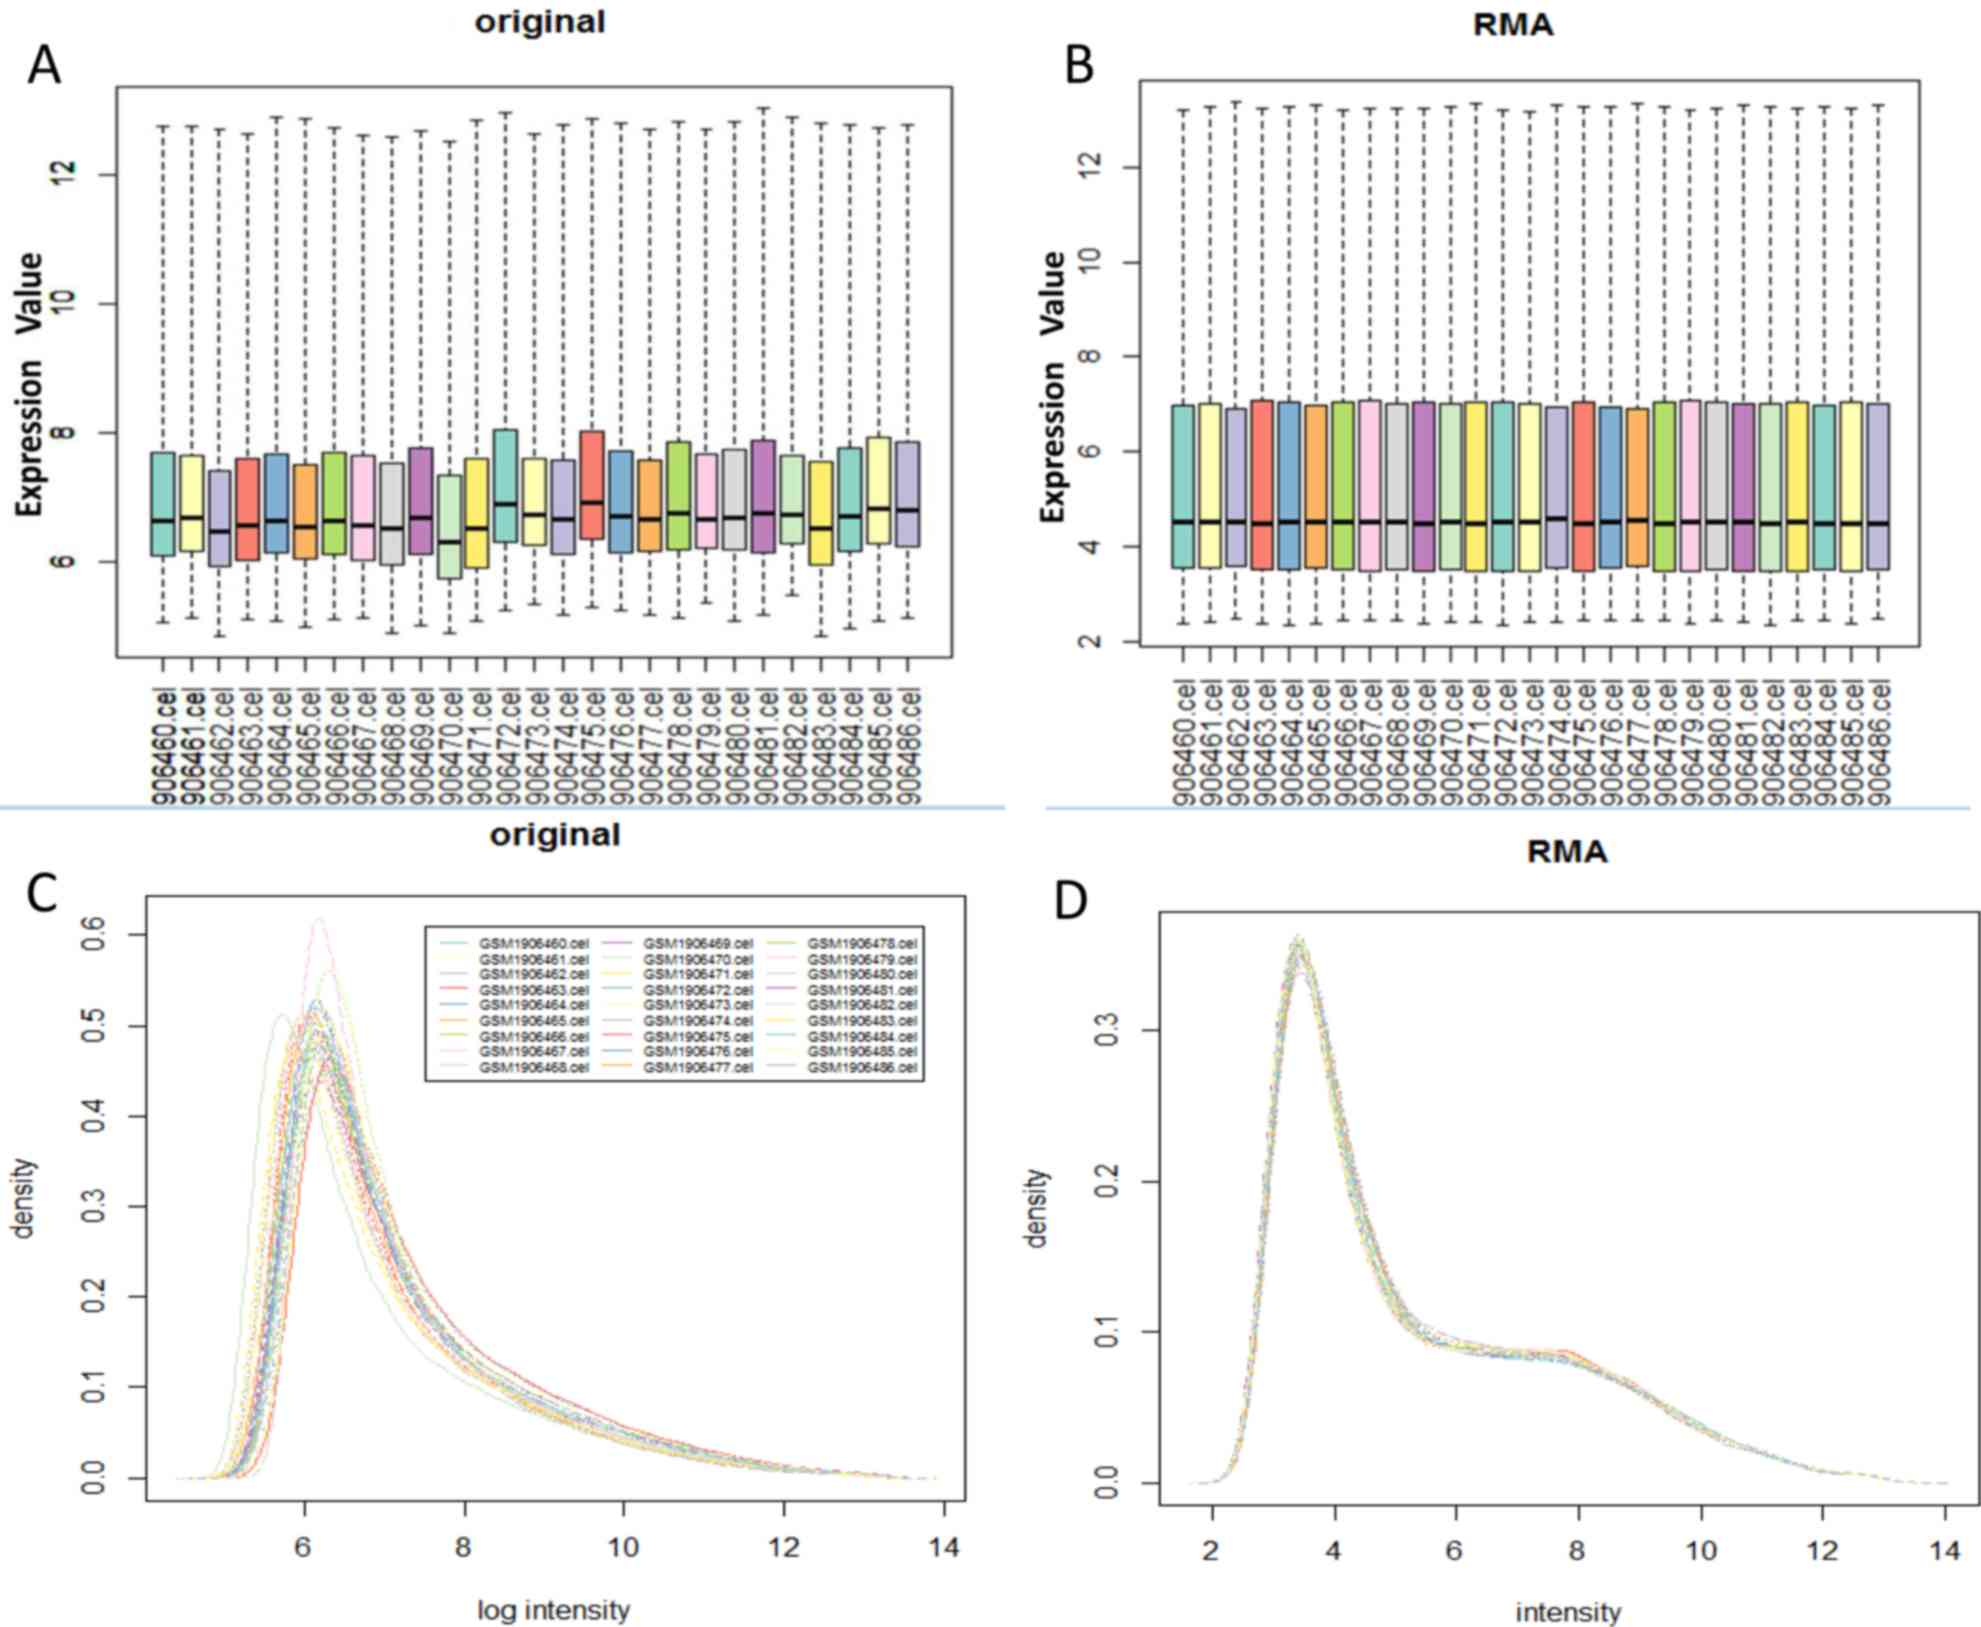
Data preprocessing
After GSE73935 dataset was preprocessed with
multi-array average (RMA) (23)
integrated algorithm in R software ‘Bioconductor’ package, the data
was converted into logarithmic form. The original chip data and the
RMA preprocessed data are shown in Fig.
1.
Characteristics of dataset and DEG
identification
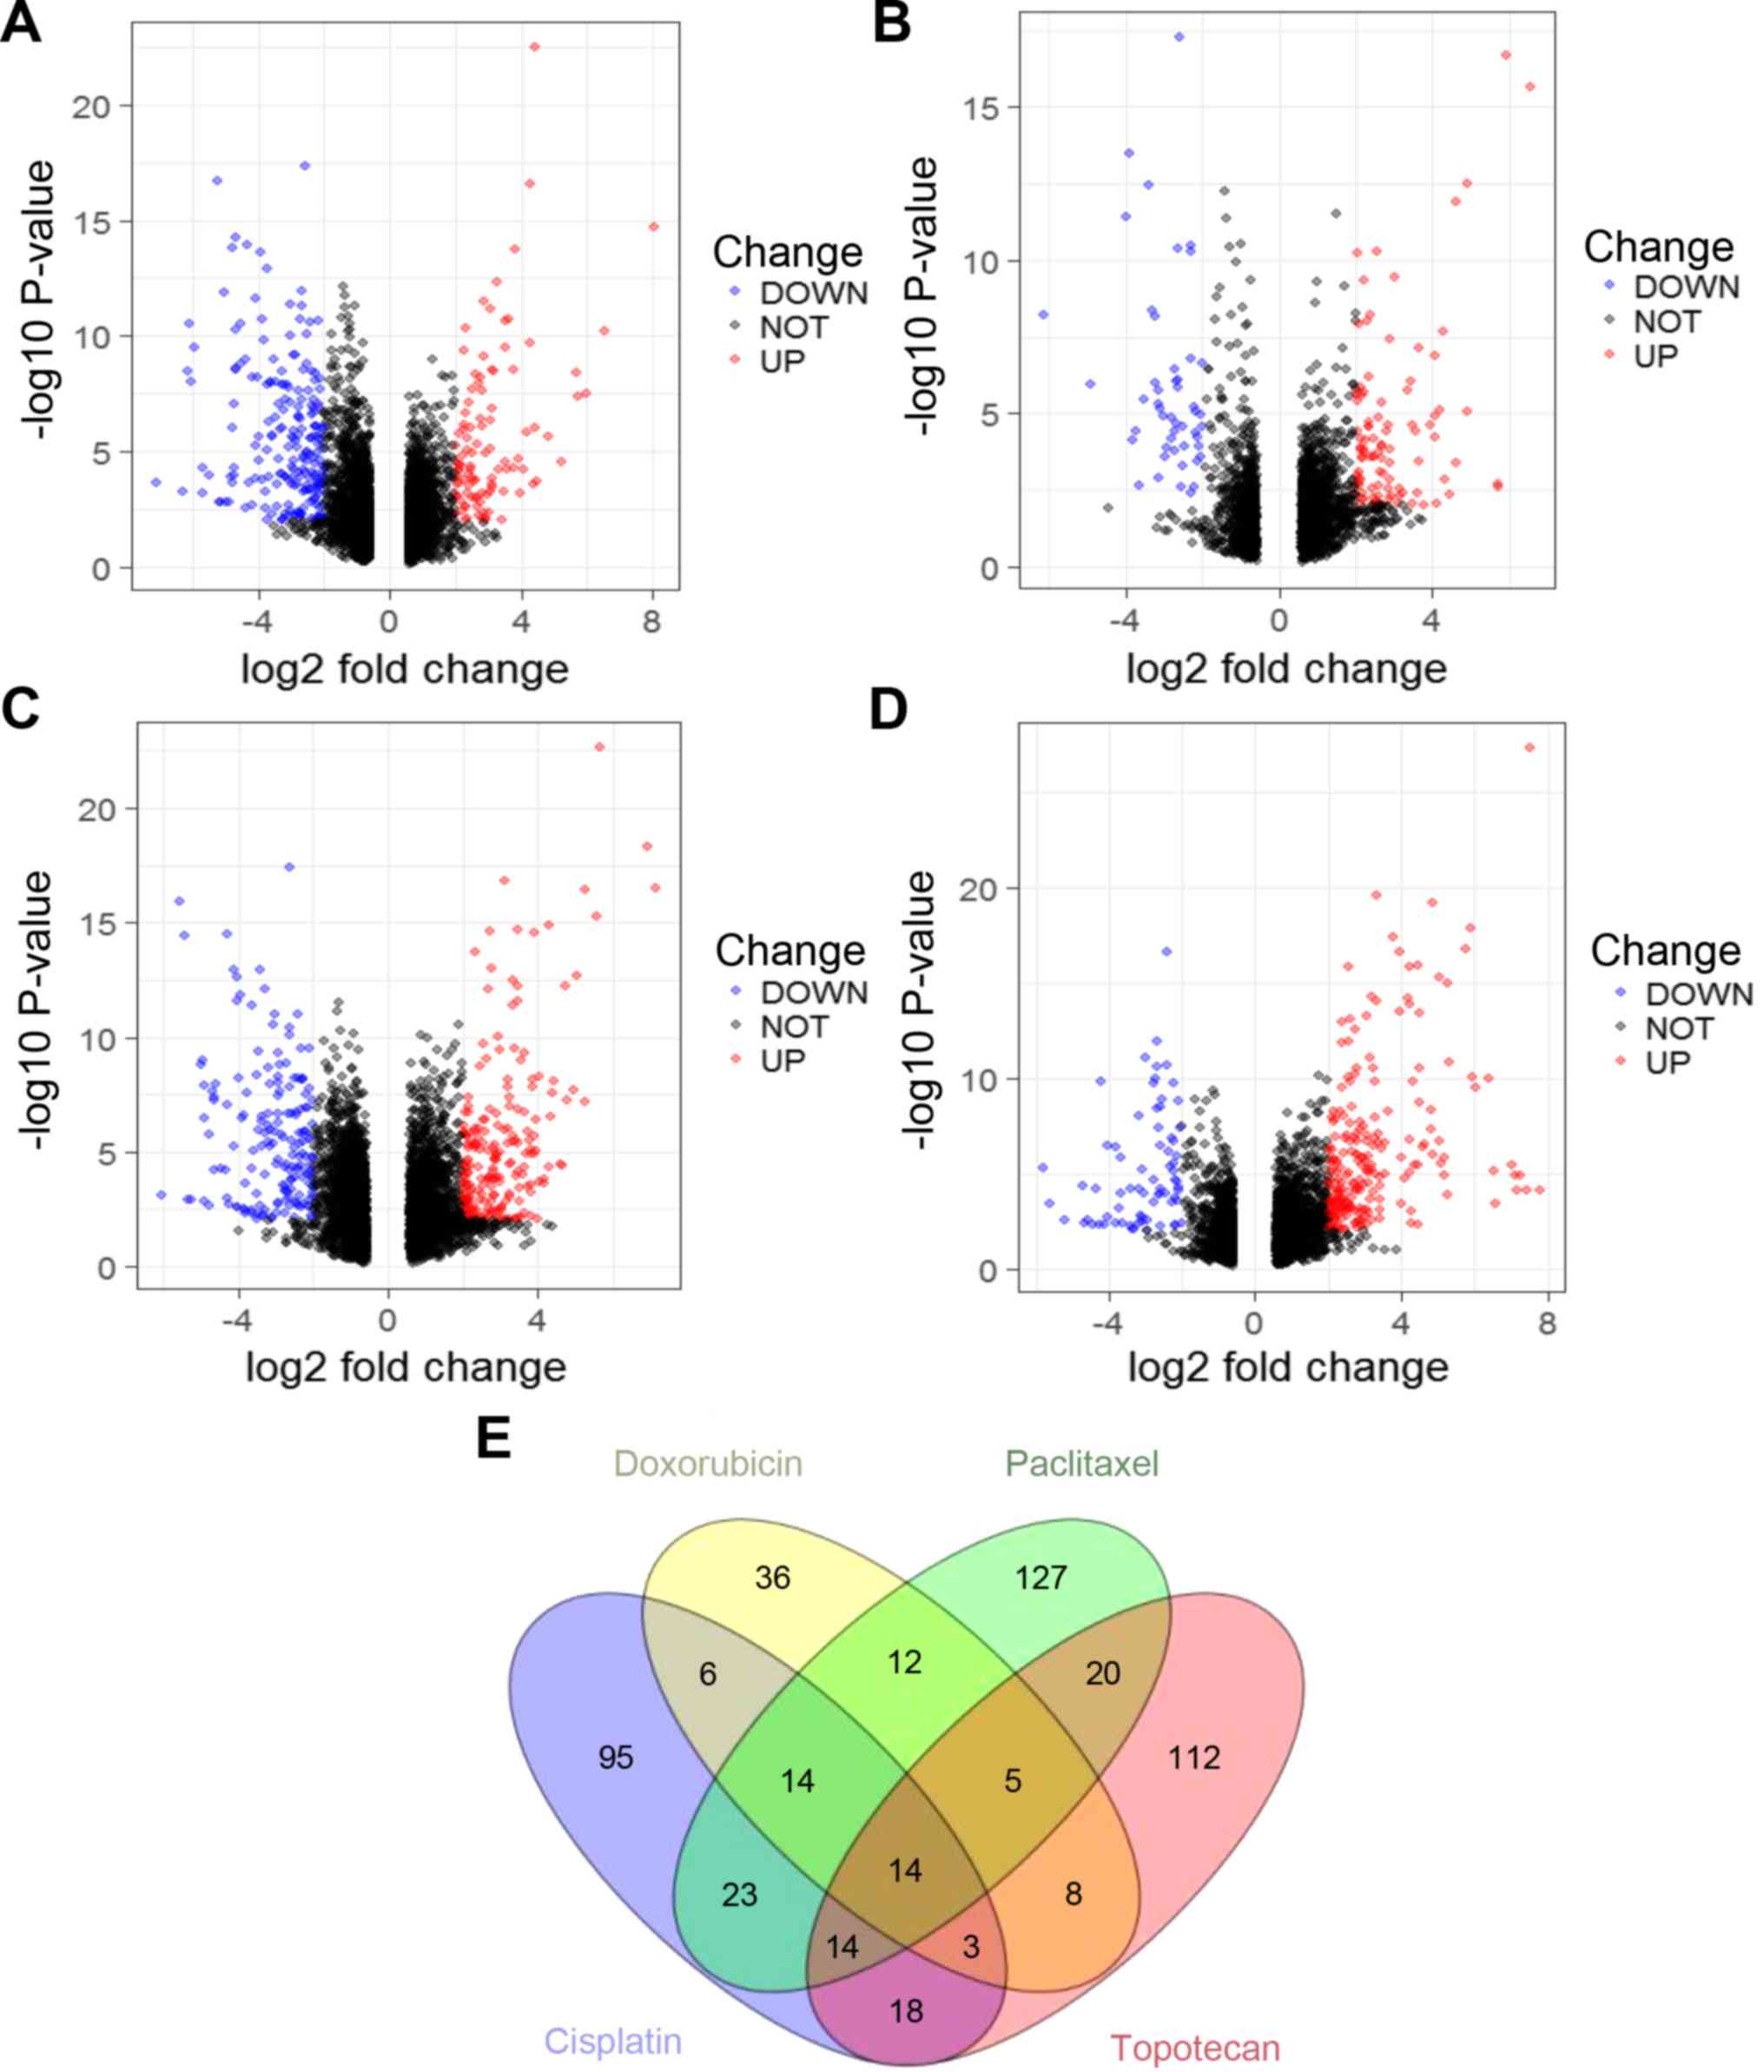
A total of 1,062 DEGs were identified from the
GSE73935 dataset, of which 598 were upregulated and 464 were
downregulated. A total of 188 DEGs were identified in cisplatin
resistance/chemotherapy sensitivity, of which 126 were
downregulated and 62 were upregulated (Fig. 2A; Table
SII). A total of 98 DEGs were identified in the doxorubicin
resistance/chemotherapy sensitivity group, of which 32 were
downregulated and 66 were upregulated (Fig. 2B; Table
SIII). In the paclitaxel resistant/sensitive group, 232 DEGs
were identified, of which 101 were downregulated and 131 were
upregulated (Fig. 2C; Table SIV). In addition, 194 DEGs were
identified in the topotecan resistance/chemotherapy sensitivity
group, of which 46 were downregulated and 148 were upregulated
(Fig. 2D; Table SV). According to ovarian cancer
treatment guidelines (24),
overlapping genes for the two-drug combinations were defined,
including cisplatin plus doxorubicin, cisplatin plus paclitaxel and
cisplatin plus topotecan. The number of overlapping genes can be
determined by Venn plot analysis. (Fig.
2E). As shown in Table I, 37
DEGs were identified between the cisplatin and doxorubicin groups,
of which 27 were downregulated and 10 were upregulated; 65 DEGs
were identified between the cisplatin and paclitaxel groups, of
which 51 were downregulated and 14 were upregulated; 49 DEGs were
identified between the cisplatin and topotecan groups, of which 31
were downregulated and 18 were upregulated.
 | Table I.Combination of two chemotherapy drugs
resistance group overlapped DEGs. |
Table I.
Combination of two chemotherapy drugs
resistance group overlapped DEGs.
| Group | Number of
overlapping DEGs (downregulate; upregulate) | Exclusive
overlapping DEG ratio (%)a |
|---|
| Cisplatin +
doxorubicin | 37 (27; 10) | 16.2 (6/37) |
| Cisplatin +
paclitaxel | 65 (51; 14) | 35.4 (23/65) |
| Cisplatin +
topotecan | 49 (31; 18) | 36.7 (18/49) |
GO function term and KEGG pathway
enrichment analysis
GO analysis of DEGs was divided into three
functional groups, including molecular function, biological
processes and cell composition. GO function term enrichment and
KEGG pathway enrichment were performed on upregulated and
downregulated DEGs of the four separate sets of data. Significant
results are shown in Table SVI. The
top five descriptions of each part after the p-value is ranked from
small to large (Fig. 3A-H).
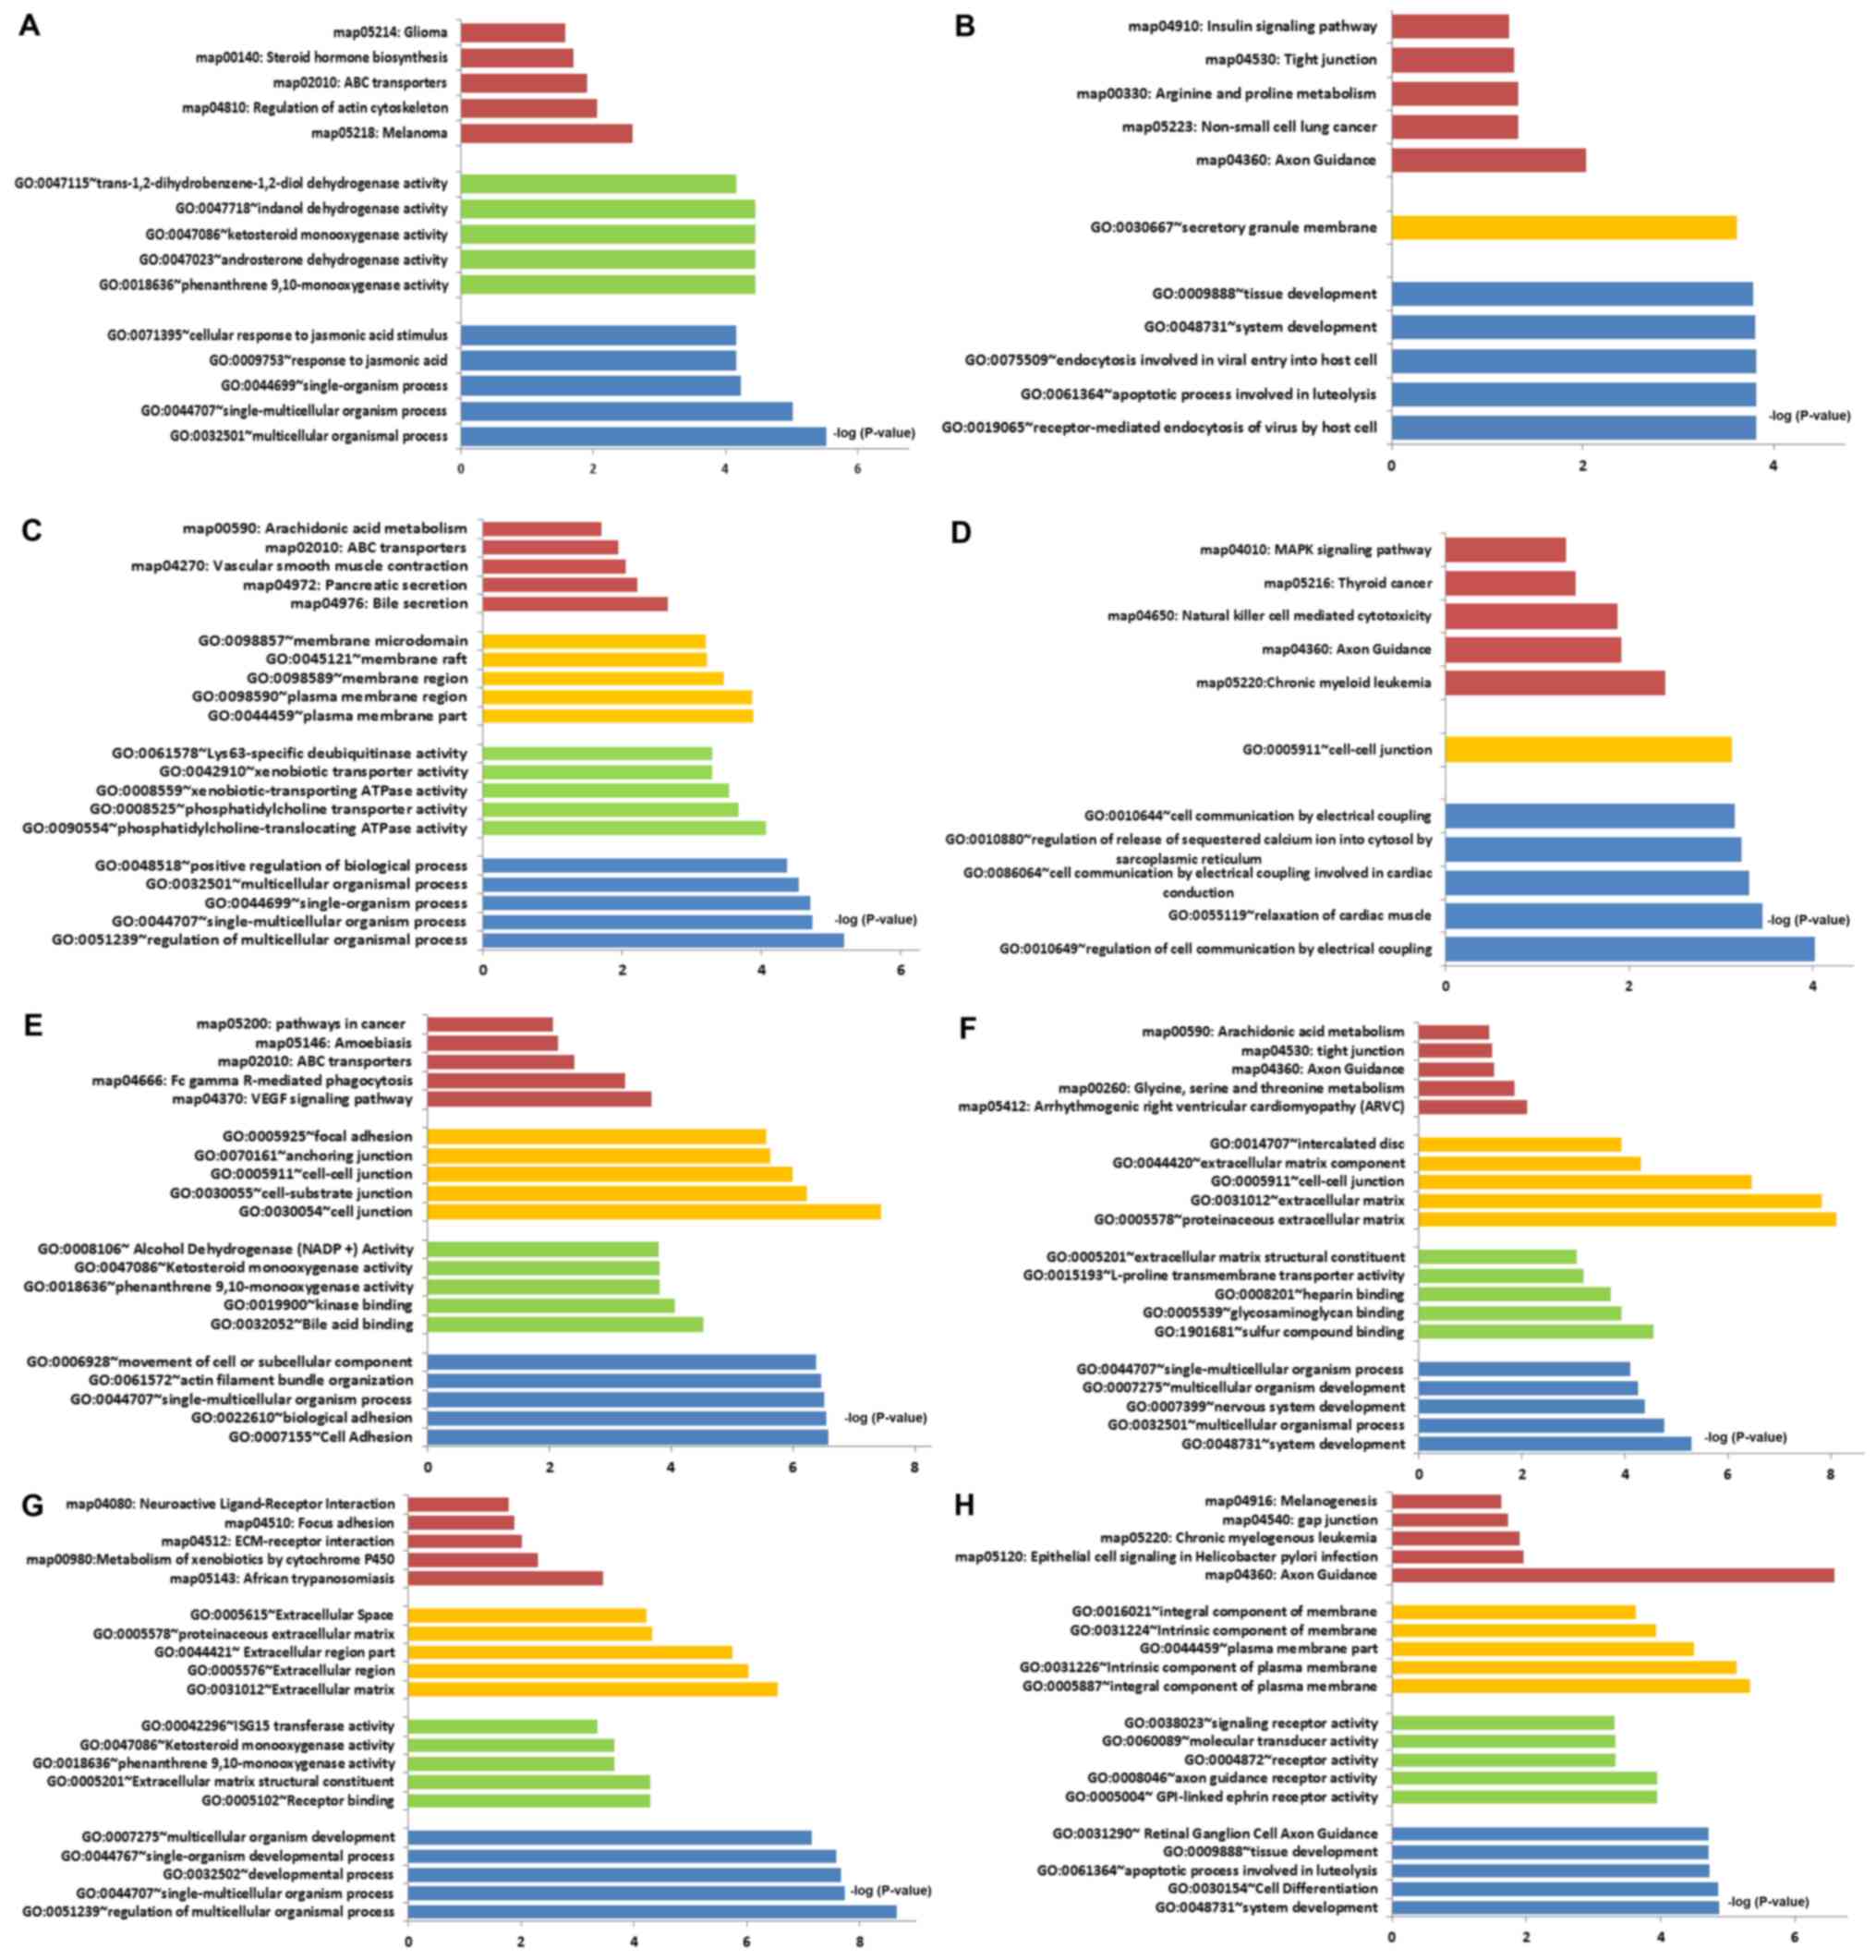 | Figure 3.GO functional term and KEGG pathway
enrichment. (A) Cisplatin resistance; upregulated DEGs. (B)
Cisplatin resistance; downregulated DEGs. (C) Doxorubicin
resistance; upregulated DEGs. (D) Doxorubicin resistance;
downregulated DEGs. (E) Paclitaxel resistance; upregulated DEGs.
(F) Paclitaxel resistance; downregulated DEGs. (G) Topotecan
resistance; upregulated DEGs. (H) Topotecan resistance;
downregulated DEGs. The red bars represent signalling pathways
identified with the KEGG, The yellow, green and blue bars represent
cell components, molecular function and biological process,
respectively, identified with GO enrichment analysis. ABC,
ATP-binding cassette; DEGs, differentially expressed genes; ECM,
extracellular matrix; GO, Gene Ontology; KEGG, Kyoto Encyclopedia
of Genes and Genomes. |
GO function enrichment of the cisplatin resistance
group demonstrated that the upregulated genes were mainly enriched
in ‘receptor-mediated endocytosis of virus by host cell’ and
‘secretory granule membrane system development’, while the
downregulated genes were mainly enriched in ‘multicellular
organismal process’ and ‘phenanthrene 9,10-monooxygenase activity’.
In KEGG signaling pathways enrichment, the upregulated genes were
mainly enriched in ‘axon guidance’ and ‘non-small cell lung
cancer’, while the downregulated genes were mainly enriched in
‘melanoma’ and ‘regulation of actin cytoskeleton’ (Fig. 3A and B).
GO function enrichment of the doxorubicin resistance
group demonstrated that the upregulated genes were mainly enriched
in ‘regulation of cell communication by electrical coupling’ and
‘cell-cell junction’, while the downregulated genes were mainly
enriched in ‘regulation of multicellular organismal process’,
‘phosphatidylcholine-translocating ATPase activity’ and ‘plasma
membrane part’. In KEGG signaling pathways enrichment, the
upregulated genes were mainly enriched in ‘chronic myeloid
leukemia’ and ‘axon guidance’, while the downregulated genes were
mainly enriched in ‘bile secretion’ and ‘pancreatic secretion’
(Fig. 3C and D).
GO function enrichment of the paclitaxel resistance
group demonstrated that the upregulated genes were mainly enriched
in ‘system development’, ‘sulfur compound binding’ and
‘proteinaceous extracellular matrix’, while the downregulated genes
were mainly enriched in ‘cell adhesion’ and ‘cell junction’. In
KEGG signaling pathways enrichment, the upregulated genes were
mainly enriched in ‘arrhythmogenic right ventricular cardiomyopathy
(ARVC)’ and ‘glycine, serine and threonine metabolism’, while the
downregulated genes were mainly enriched in ‘VEGF signaling
pathway’ and ‘Fc gamma R-mediated phagocytosis’ (Fig. 3E and F).
GO function enrichment of the topotecan resistance
group demonstrated that the upregulated genes were mainly enriched
in ‘system development’, ‘GPI-linked ephrin receptor activity’ and
‘integral component of plasma membrane’, while the downregulated
genes were mainly enriched in ‘regulation of multicellular
organismal process’, ‘receptor binding’ and ‘extracellular matrix’.
In KEGG signaling pathways enrichment, the upregulated genes were
mainly enriched in ‘axon guidance’ and ‘Epithelial cell signaling
in Helicobacter pylori’, while the downregulated genes were mainly
enriched in ‘African trypanosomiasis’ and ‘Metabolism of
xenobiotics by cytochrome P450’ (Fig. 3G
and H).
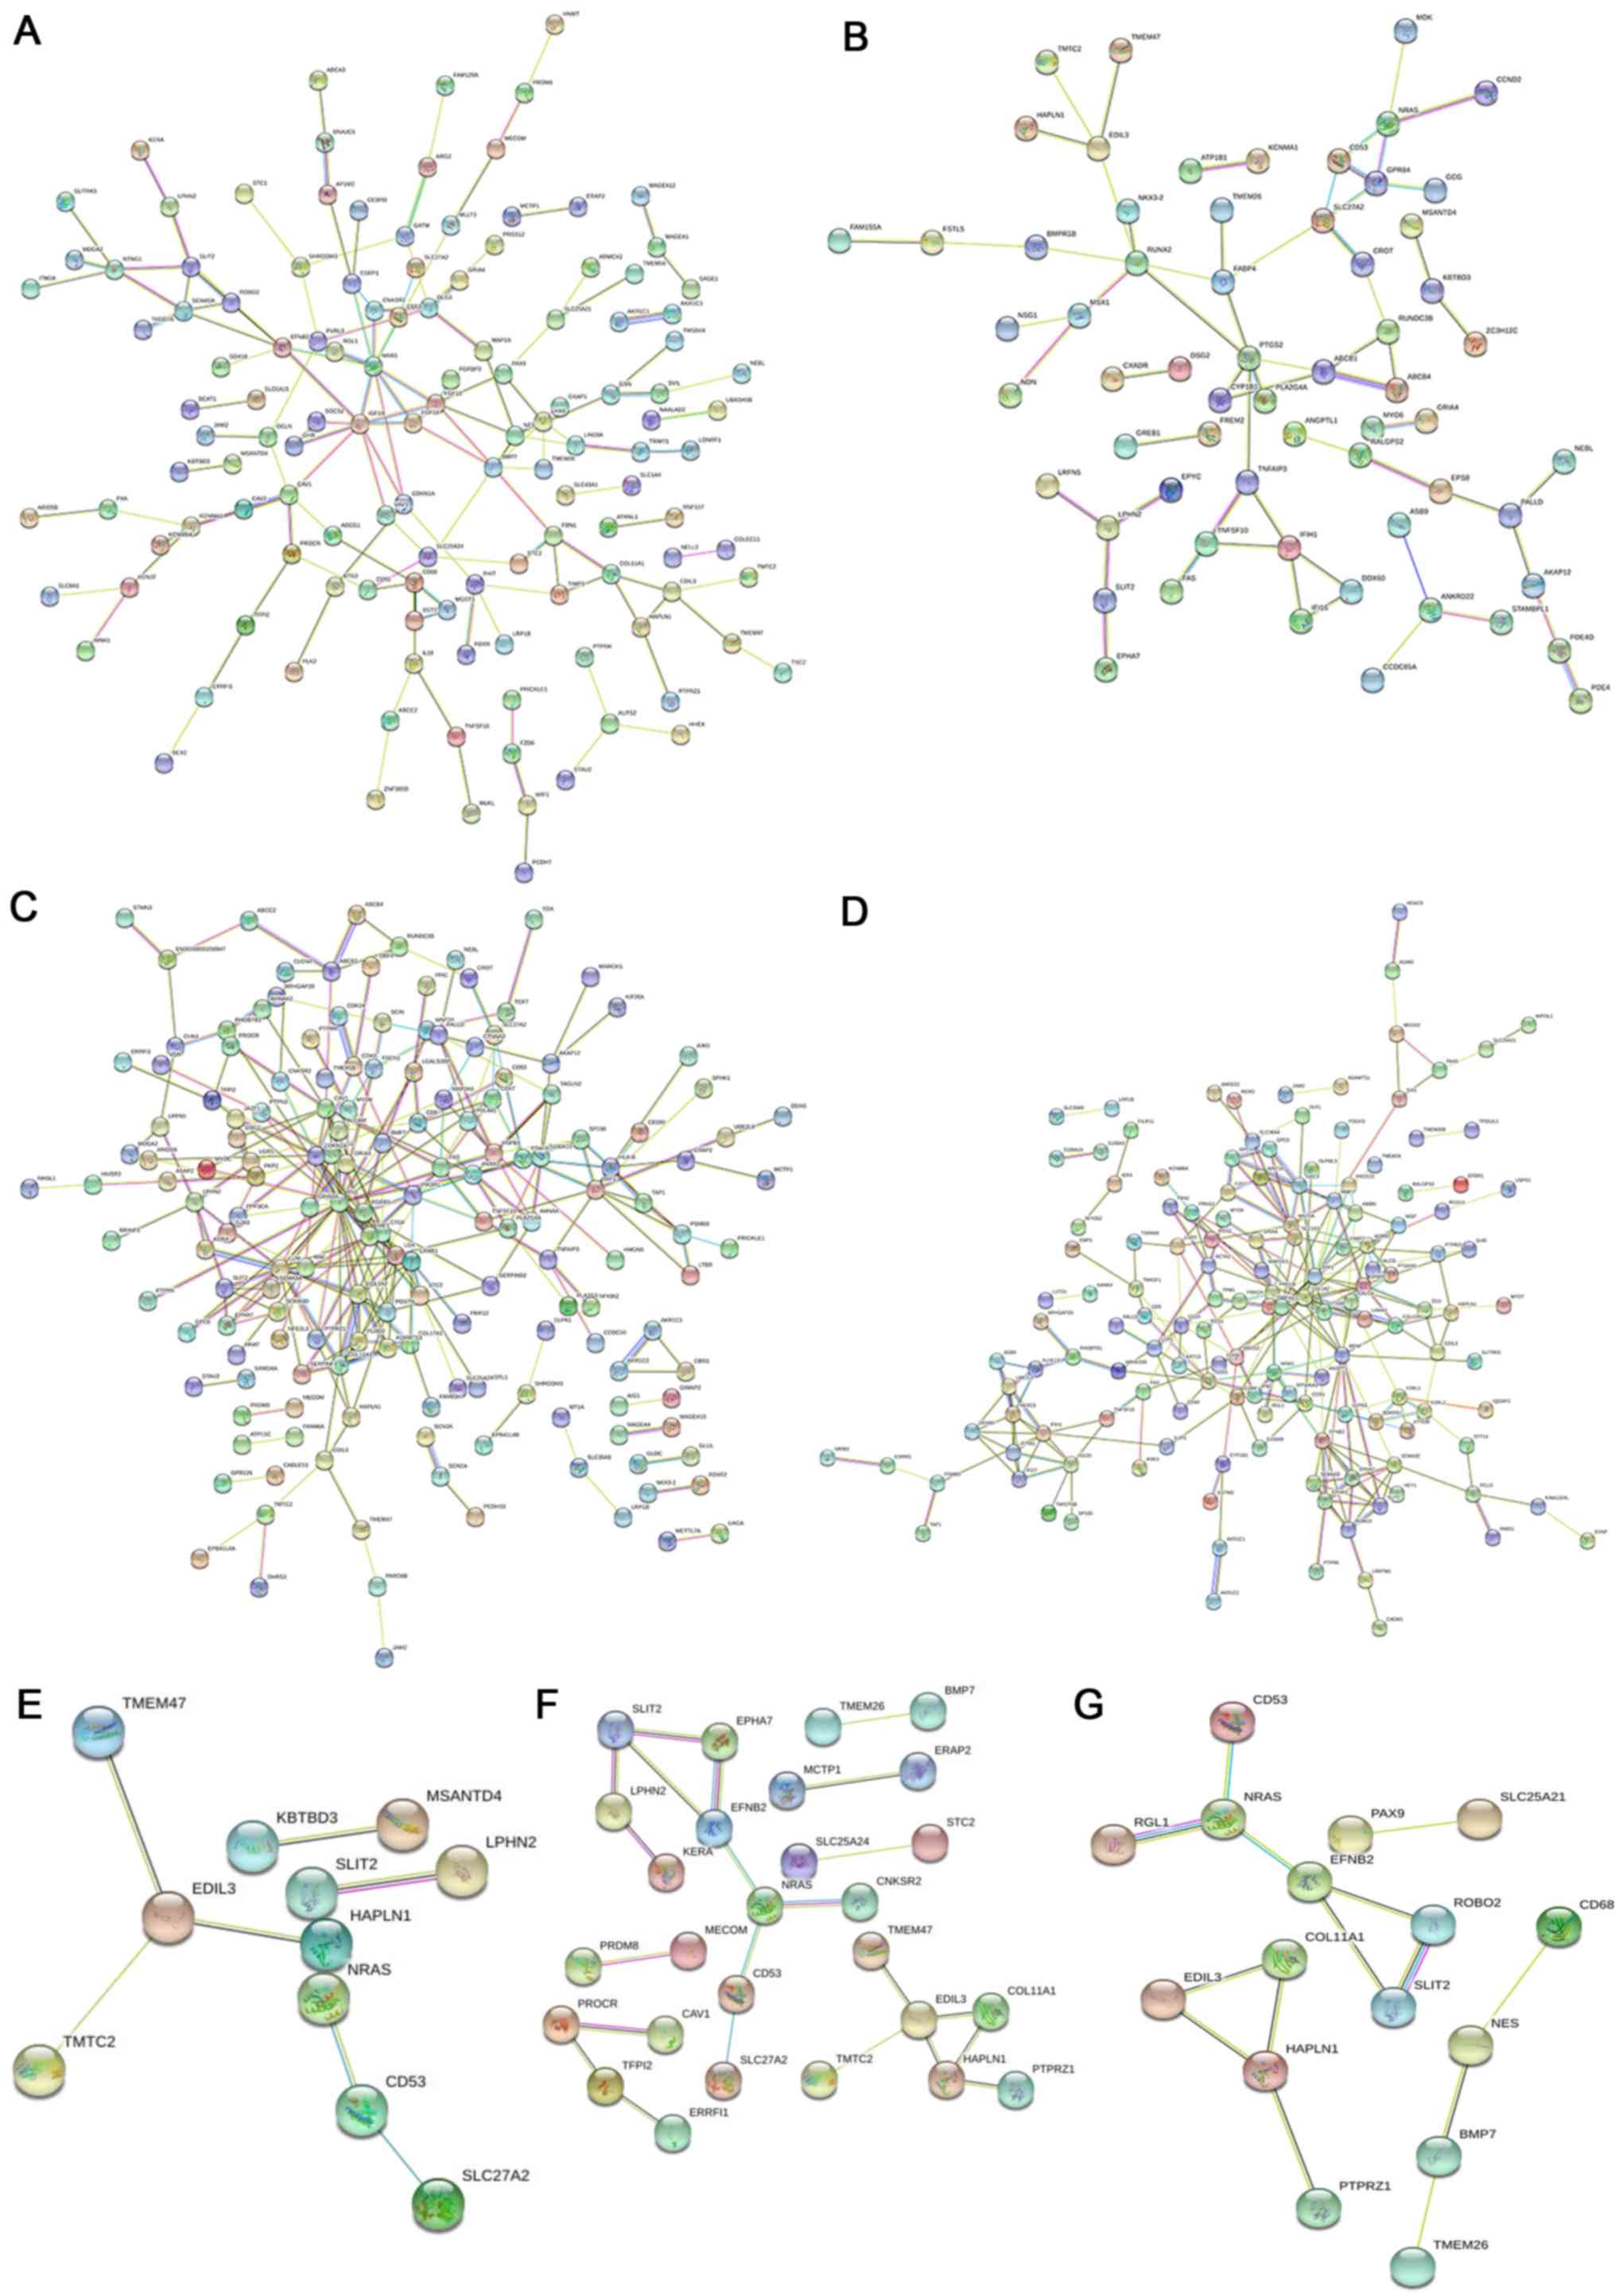
PPI network
According to results from STRING analysis, compared
with the chemotherapy-sensitive group, 118 nodes and 77 edges in
the cisplatin-resistant group met the screening conditions (score
>0.4), and a PPI network map was drawn (Fig. 4A). The PPI network map of the
doxorubicin-resistant group comprises 83 nodes and 52 edges
(Fig. 4B). The PPI network map of
paclitaxel resistance and chemotherapy sensitivity has 163 nodes
and 170 edges (Fig. 4C), and the PPI
network map of topotecan resistance and chemotherapy sensitivity
has 173 nodes and 193 edges (Fig.
4D). In addition, the PPI network map of cisplatin plus
doxorubicin has 11 nodes and seven edges (Fig. 4E), the PPI network map of cisplatin
plus paclitaxel has 27 nodes and 22 edges (Fig. 4F), and the PPI network map of
cisplatin plus topotecan has 16 nodes and 14 edges (Fig. 4G).
The hub genes were obtained by calculating the
degree and betweenness parameters of the PPI network map. Among
them, the cisplatin-resistant chemotherapy group has five hub
genes, the doxorubicin-resistant chemotherapy group has five hub
genes, the paclitaxel-resistant chemotherapy group has 15 hub genes
and the topotecan-resistant chemotherapy group has five hub genes
(Table II). The cisplatin plus
doxorubicin group had three hub genes, the cisplatin plus
paclitaxel group has six hub genes, and the cisplatin plus
topotecan group has five hub genes (Table III).
| Table II.Single chemotherapy drug resistance
group hub genes. |
Table II.
Single chemotherapy drug resistance
group hub genes.
| Group | Hub gene | Degree | Betweenness | Expression |
|---|
| Cisplatin | IGF1R | 10 | 1,714.33 | Up |
|
| NRAS | 9 | 830.33 | Down |
|
| FGF10 | 5 | 662.00 | Up |
|
| DLG3 | 6 | 531.33 | Down |
|
| CAV1 | 6 | 524.67 | Down |
| Doxorubicin | NRAS | 10 | 799.67 | Down |
|
| RUNX2 | 6 | 482.00 | Up |
|
| MDK | 5 | 340.67 | Down |
|
| PTGS2 | 4 | 187.00 | Up |
|
| MSX1 | 5 | 186.00 | Up |
| Paclitaxel | CDKN2A | 10 | 2,889.06 | Up |
|
| DLG1 | 11 | 2,437.20 | Down |
|
| CTGF | 9 | 2,173.22 | Up |
|
| MET | 8 | 1,852.22 | Up |
|
| MAF | 6 | 1,741.90 | Down |
|
| FGFR3 | 6 | 1,721.56 | Up |
|
| PIK3R1 | 5 | 1,703.86 | Up |
|
| FAS | 6 | 1,378.57 | Up |
|
| PTAFR | 5 | 1,326.63 | Up |
|
| ABCB1 | 7 | 1,276.65 | Up |
|
| TNFAIP3 | 5 | 1,076.96 | Up |
|
| CDK14 | 8 | 1,042.03 | Up |
|
| TUBB3 | 5 | 1,034.81 | Up |
|
| COL1A2 | 10 | 959.60 | Up |
|
| RHOBTB1 | 6 | 899.87 | Down |
| Topotecan | NRAS | 16 | 4,558.12 | Down |
|
| ACTA2 | 10 | 2,192.64 | Up |
|
| SPP1 | 9 | 2,111.47 | Up |
|
| PRKG1 | 9 | 1,354.34 | Up |
|
| BMP7 | 8 | 1,694.94 | Up |
| Table III.Combination of two chemotherapy drugs
resistance group hub genes. |
Table III.
Combination of two chemotherapy drugs
resistance group hub genes.
| Group | Hub gene | Degree | Betweenness | Expression |
|---|
| Cisplatin +
doxorubicin | EDIL3 | 3 | 6 | Up |
|
| CD53 | 2 | 2 | Down |
|
| SLIT2 | 1 | 2 | Down |
| Cisplatin +
paclitaxel | EDIL3 | 4 | 14 | Up |
|
| NRAS | 3 | 14 | Down |
|
| EFNB2 | 3 | 12 | Down |
|
| HAPLN1 | 3 | 8 | Up (down) |
|
| TFPI2 | 2 | 4 | Down |
|
| PROCR | 2 | 4 | Up |
| Cisplatin +
topotecan | HAPLN1 | 3 | 4 | Up |
|
| NRAS | 3 | 4 | Down |
|
| EFNB2 | 3 | 4 | Down |
|
| ROBO2 | 2 | 2 | Down |
|
| COL11A1 | 2 | 2 | Down |
Validation of hub genes and survival
analysis
To verify the proposed clinical protocol, survival
analyses were performed using data from patients with ovarian
cancer in the TCGA database (Fig.
5). Considering the clinical medication information of TCGA
ovarian cancer patients and cisplatin plus paclitaxel is the
preferred chemotherapy regimen, survival analysis was grouped
according to the expression of the hub gene in the cisplatin plus
paclitaxel group and the observed prognosis in the cisplatin plus
paclitaxel group and the other group, which mainly included
sequential doxorubicin-cisplatin/paclitaxel and sequential
topotecan-cisplatin/paclitaxel. The results demonstrated that the
expression of epidermal growth factor-like repeats and discoidin
I-like domains 3 (EDIL3), NRAS proto-oncogene (NRAS),
hyaluronan and proteoglycan link protein 1 (HAPLN1) and
activated protein C receptor (PROCR) were closely related to
the prognosis of the cisplatin plus paclitaxel group. The
expression of ephrin B2 (EFNB2) and tissue factor pathway
inhibitor 2 (TFPI2) did not affect the prognosis of
cisplatin plus paclitaxel group (Fig.
S1).
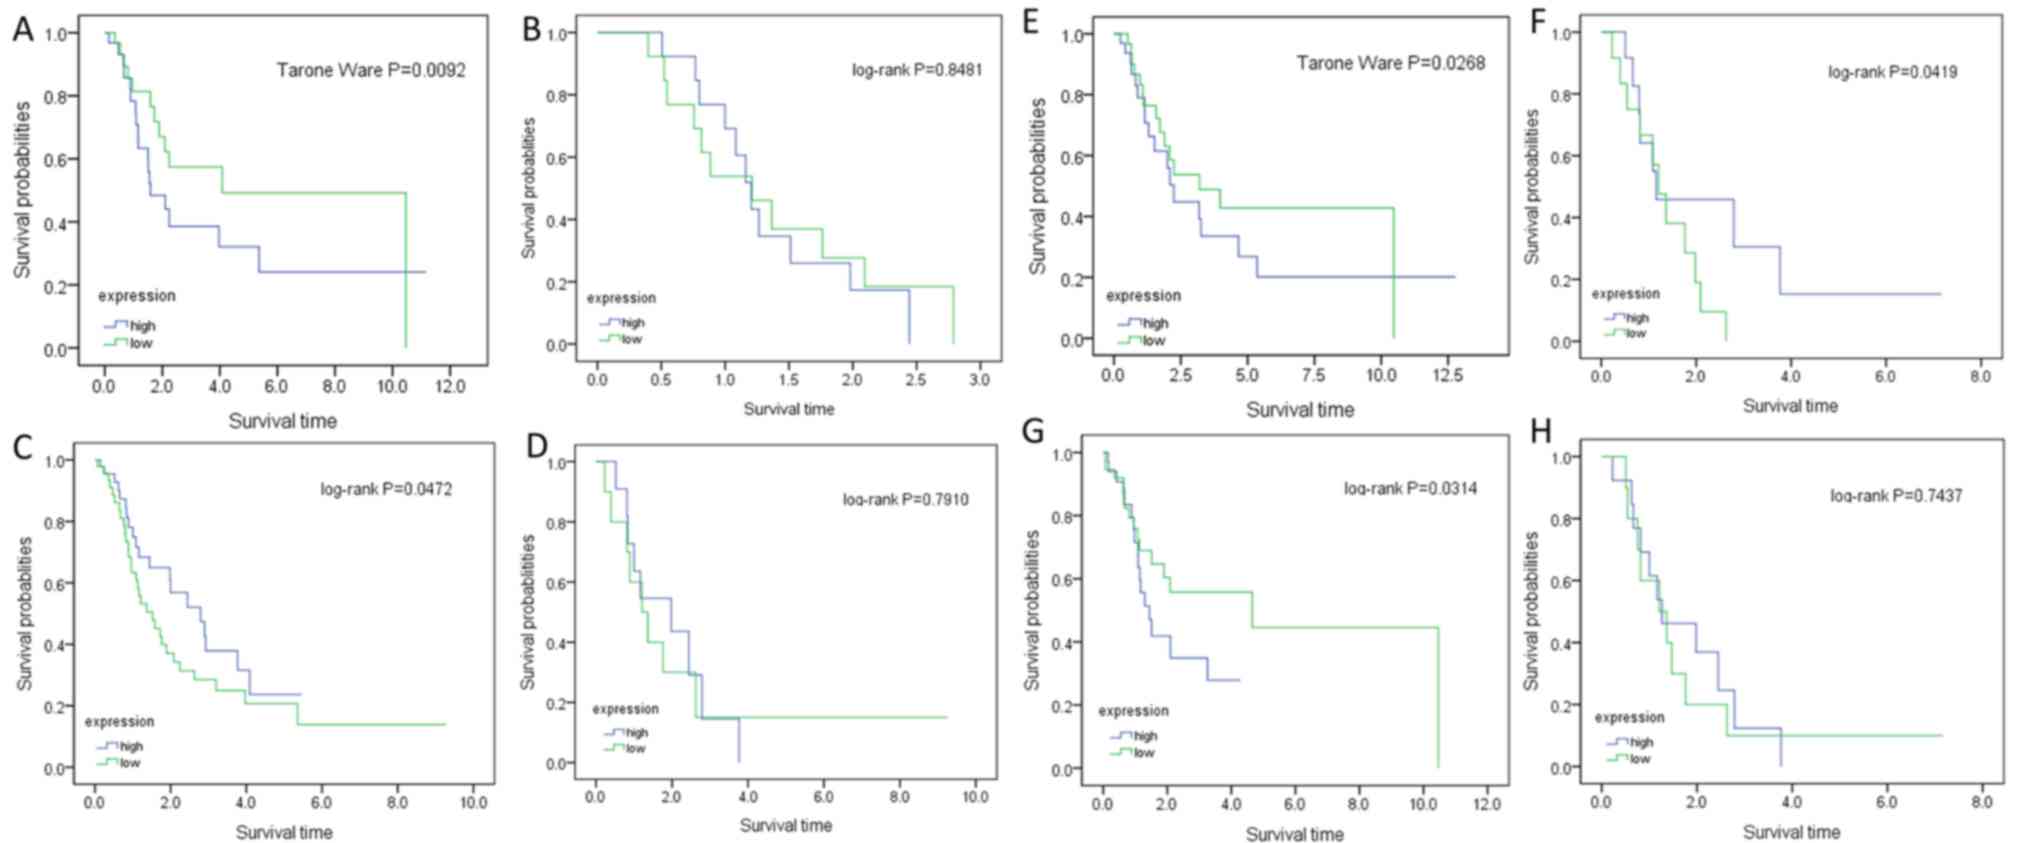 | Figure 5.Kaplan-Meier survival curves of
patients with ovarian cancer, stratified by gene expression levels.
(A) EDIL3, cisplatin plus paclitaxel. (B) EDIL3, others. (C) NRAS,
cisplatin plus paclitaxel. (D) NRAS, others. (E) HAPLN1, cisplatin
plus paclitaxel. (F) HAPLN1, others. (G) PROCR, cisplatin plus
paclitaxel. (H) PROCR, others. others, sequential
doxorubicin-cisplatin/paclitaxel and sequential
topotecan-cisplatin/paclitaxel. EDIL3, epidermal growth factor-like
repeats and discoidin I-like domains 3; HAPLN1, hyaluronan and
proteoglycan link protein 1; NRAS, NRAS proto-oncogene; PROCR,
activated protein C receptor. |
In the cisplatin plus paclitaxel group, the
five-year survival rate of the EDIL3 high expression group
was 32%, and the five-year survival rate of the EDIL3 low
expression group was 50%. Compared with the low expression group of
EDIL3, the prognosis of patients with ovarian cancer in the
high expression group of EDIL3 was worse (P<0.05;
Fig. 5A). In the other group, the
expression of this gene was not associated with prognosis
(P>0.05; Fig. 5B).
In the cisplatin plus paclitaxel group, the
five-year survival rate of ovarian cancer patients with high
NRAS expression was 38%, and the five-year survival rate of
patients with ovarian cancer with low NRAS expression was
23%. Compared with the high expression group of NRAS, the
prognosis of ovarian cancer patients in the low expression group of
NRAS was worse (P<0.05; Fig.
5C). In the other group, the expression of this gene was not
associated with prognosis (P>0.05; Fig. 5D).
In the cisplatin plus paclitaxel group, the
five-year survival rate of patients with ovarian cancer with high
expression of HAPLN1 was 28%, and the five-year survival
rate of patients with ovarian cancer with low expression of
HAPLN1 was 42%. Compared with the low expression group of
HAPLN1, the prognosis of patients with ovarian cancer in the
high expression group of HAPLN1 was worse (P<0.05;
Fig. 5E). In the other group, the
survival rate of patients with ovarian cancer with low expression
of HAPLN1 decreased to 0 at 2.7 years, while the five-year
survival rate of patients with ovarian cancer with high expression
of HAPLN1 was 48%, and the prognosis of the low expression
group was worse (P<0.05; Fig.
5F).
In the cisplatin plus paclitaxel group, the
five-year survival rate of patients with ovarian cancer with high
PROCR expression was 30%, and the five-year survival rate of
patients with ovarian cancer with low PROCR expression was
48%. Compared with the low expression group of PROCR, the
prognosis of patients with ovarian cancer in the high expression
group of PROCR was worse (P<0.05; Fig. 5G). In the other group, the expression
of this gene was not associated with prognosis (P>0.05; Fig. 5H).
In addition, since TCGA data do not contain clinical
information of other drug groups, which included cisplatin,
paclitaxel, cisplatin + doxorubicin and cisplatin + topotecan, to
verify that the hub genes of the other drug groups are also
suitable for clinical samples, the immunohistochemistry results for
patients with ovarian cancer in HPA database were used. The
Insulin-like growth factor I receptor (IGF1R) in the
cisplatin group, cyclin-dependent kinase inhibitor 2A
(CDKN2A) in the paclitaxel group, CD53 in the
cisplatin plus doxorubicin group, and Roundabout guidance receptor
2 (ROBO2) in the cisplatin plus topotecan group were
verified, and the effect of the expression of each hub gene on
prognosis was observed with the Kaplan-Meier Plotter database.
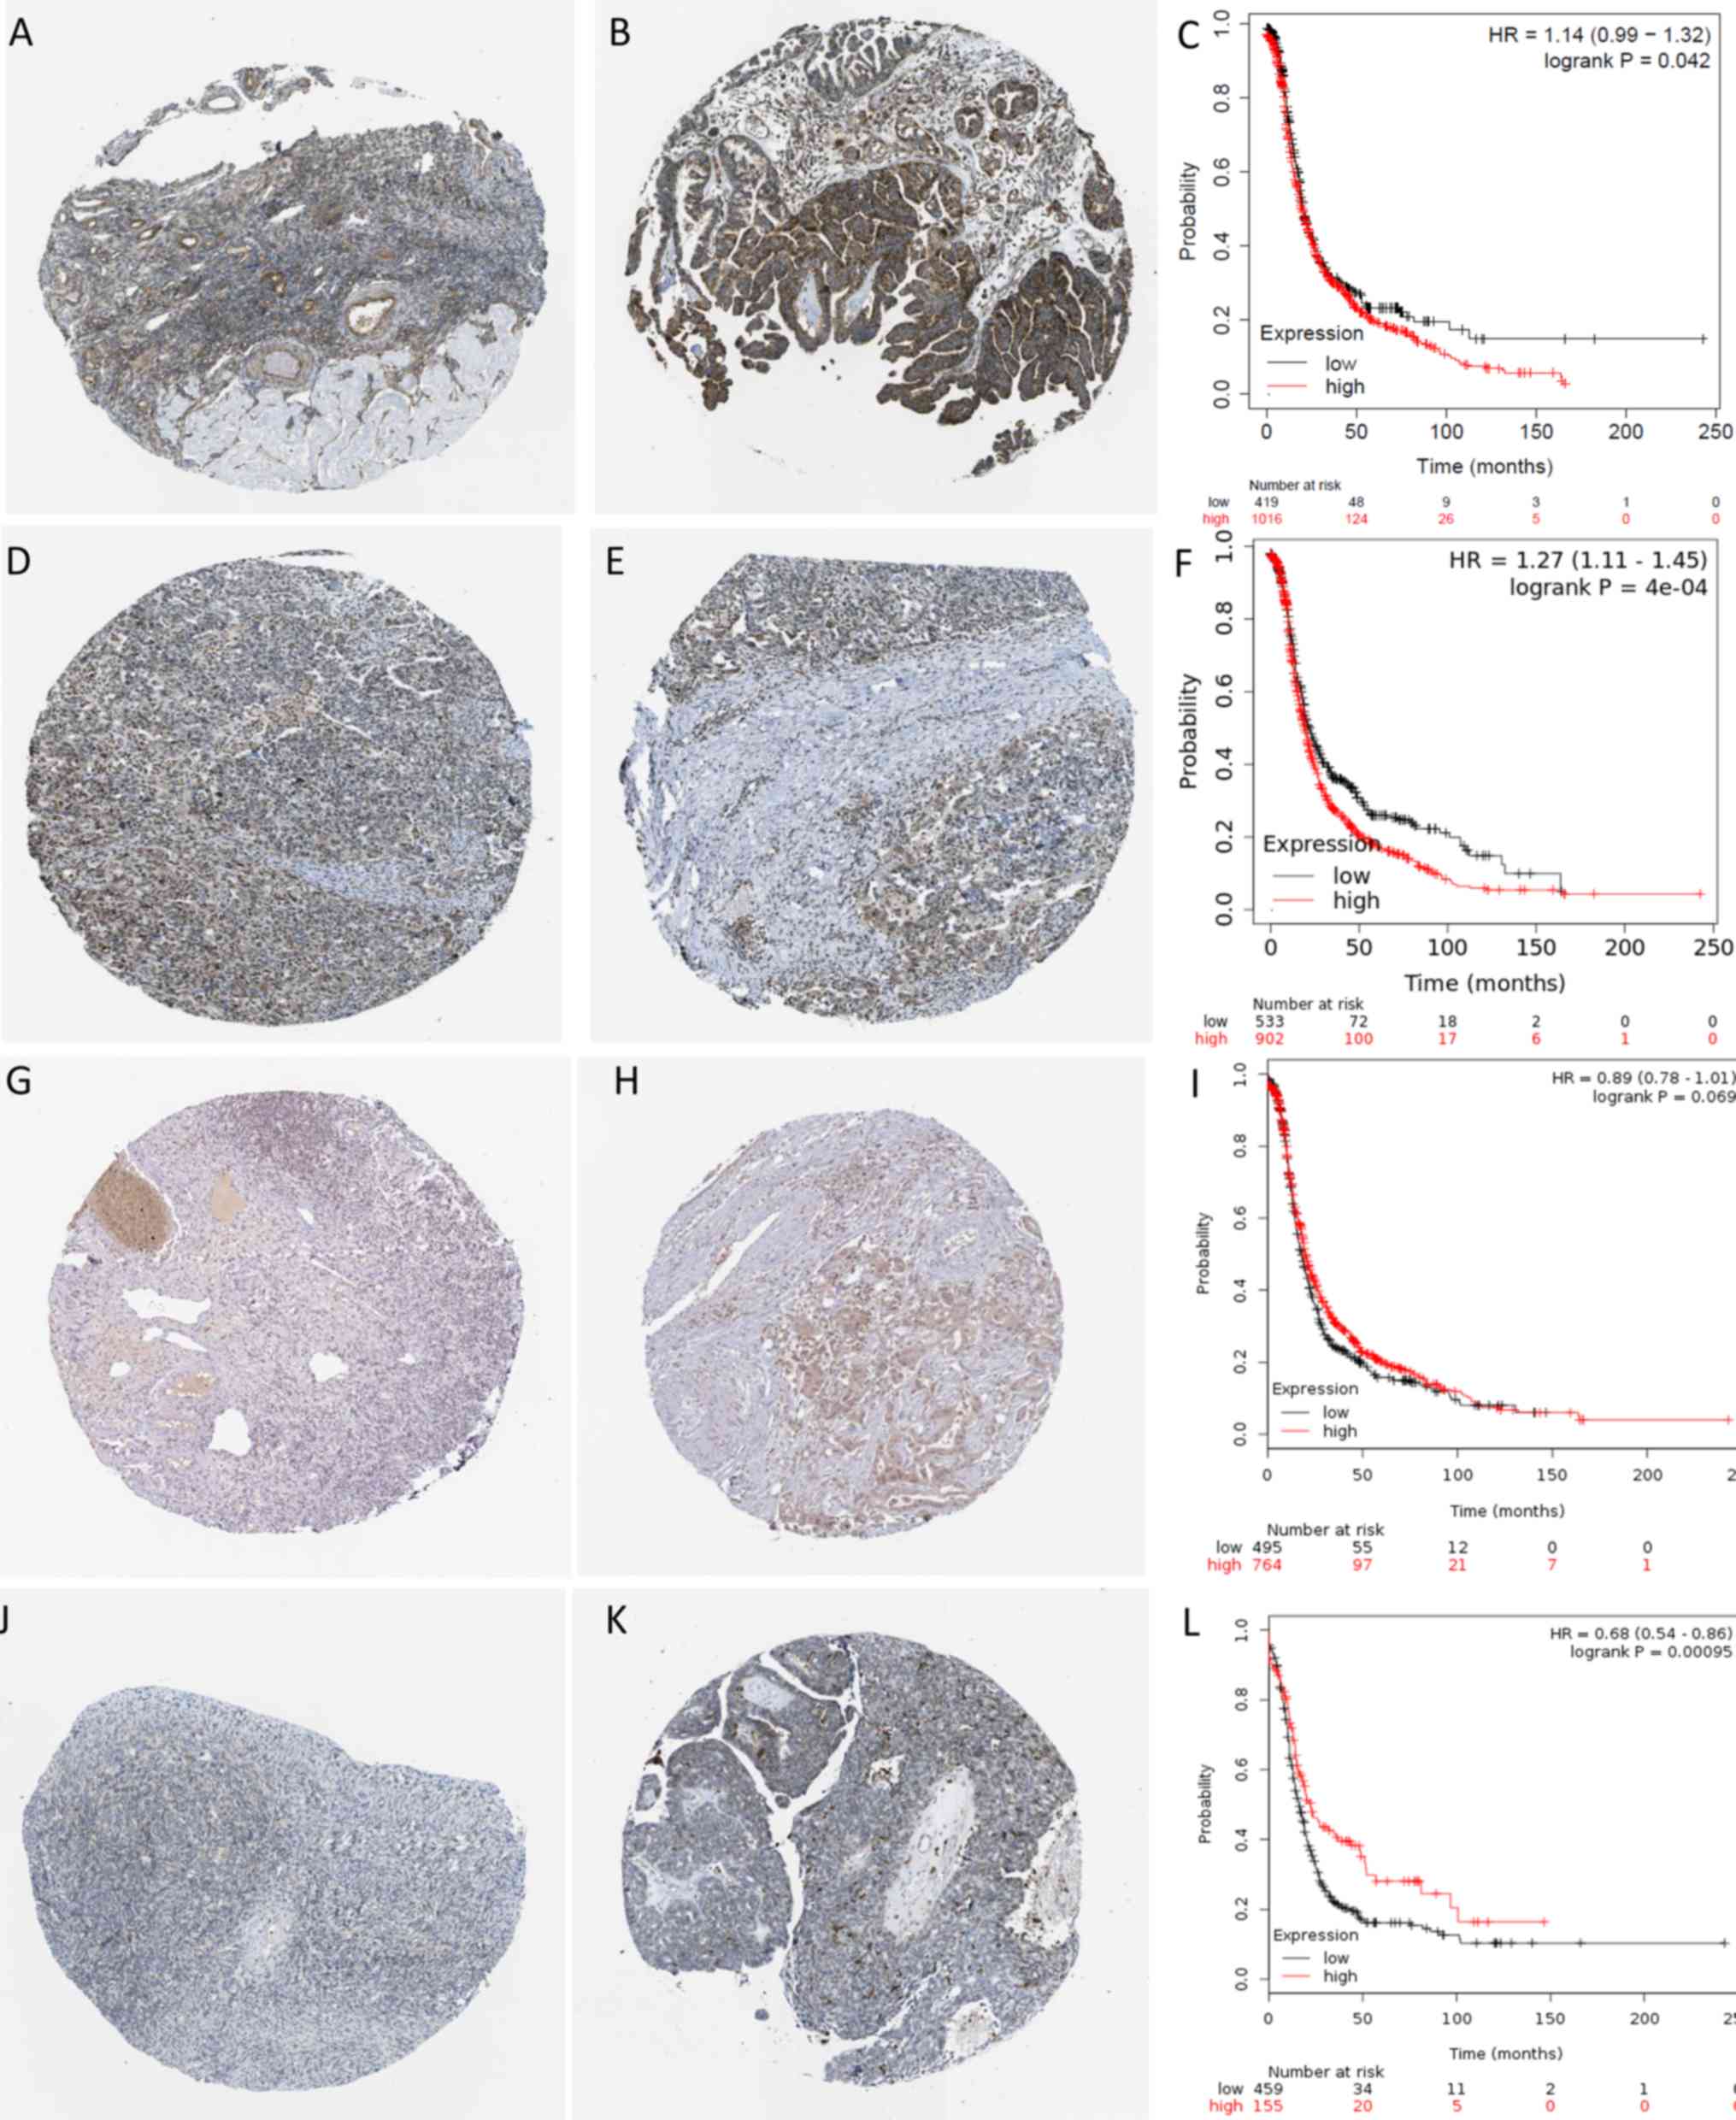
IGF1R is a hub gene that was upregulated in
ovarian cancer cisplatin-resistant cells and not in other
drug-resistant cell lines. It showed medium positive protein
expression in normal ovarian tissues (Fig. 6A) and high positive protein
expression in ovarian cancer tissues (Fig. 6B). IGF1R was significantly
upregulated in tumor tissues compared with normal tissues. The
five-year survival rate of patients with ovarian cancer with high
IGF1R expression was 15%, and the five-year survival rate of
patients with ovarian cancer with low IGF1R expression was
27%. Compared with the low expression group of IGF1R, the
prognosis of patients with ovarian cancer with high expression of
IGF1R was worse (P<0.05; Fig.
6C).
CDKN2A was identified as a hub gene that was
upregulated in paclitaxel-resistant ovarian cancer cells but not in
other drug-resistant cell lines. It showed low positive protein
expression in normal ovarian tissue (Fig. 6D) and high positive protein
expression in ovarian cancer tissues (Fig. 6E). CDKN2A was significantly
upregulated in tumor tissues compared with normal tissues. The
5-year survival rate of patients with ovarian cancer with high
CDKN2A expression was 18%, and the 5-year survival rate of
patients with ovarian cancer with low CDKN2A expression was
28%. The prognosis of patients with ovarian cancer, with high
expression of CDKN2A was worse compared with the low
expression group of CDKN2A (P<0.01; Fig. 6F).
CD53 was identified as a hub gene with
downregulated in the cisplatin plus doxorubicin group. It was found
that this gene showed medium positive protein expression in normal
ovarian tissue (Fig. 6G) and low
positive protein expression in ovarian cancer tissues (Fig. 6H). CD53 was significantly
downregulated in tumor tissues compared with normal tissues.
CD53 expression had no significant effect on the five-year
survival rate of patients with ovarian cancer (P>0.05) (Fig. 6I).
ROBO2 is a hub gene with downregulated in the
cisplatin plus topotecan group. This gene showed low positive
protein expression in normal ovarian tissues (Fig. 6J) and no protein expression was
observed in ovarian cancer tissues (Fig.
6K). ROBO2 was significantly downregulated in tumor
tissues compared with normal tissues. The five-year survival rate
of patients with ovarian cancer with high ROBO2 expression
was 30%, whereas that of patients with low ROBO2 expression
was 18%. Compared with the high ROBO2 expression group, the
prognosis of patients with ovarian cancer in the low ROBO2
expression group was worse (P<0.01; Fig. 6L).
Evaluation of hub gene expression in
ovarian cancer
To verify the expression of hub genes in the
paclitaxel-resistant and sensitive network, A2780/PA and A2780 cell
lines were used, respectively. Relative mRNA expression levels of
hub genes in A2780/PA and A2780 cells were quantified by qPCR, and
the results showed that the average mRNA expression levels of disks
large homolog 1 (DLG1) was significantly lower in A2780/PA
cells compared with expression levels in A2780 cells. Furthermore,
the average mRNA expression levels of ATP binding cassette
subfamily B member 1 (ABCB1), CDKN2A, cyclin
dependent kinase 14 (CDK14), fibroblast growth factor
receptor 3 (FGFR3), MET proto-oncogene, receptor tyrosine
kinase (MET), phosphoinositide-3-kinase regulatory subunit 1
(PIK3R1) and tubulin beta 3 class III (TUBB3) were
significantly higher in A2780/PA cells compared to A2780 cells
(Fig. 7).
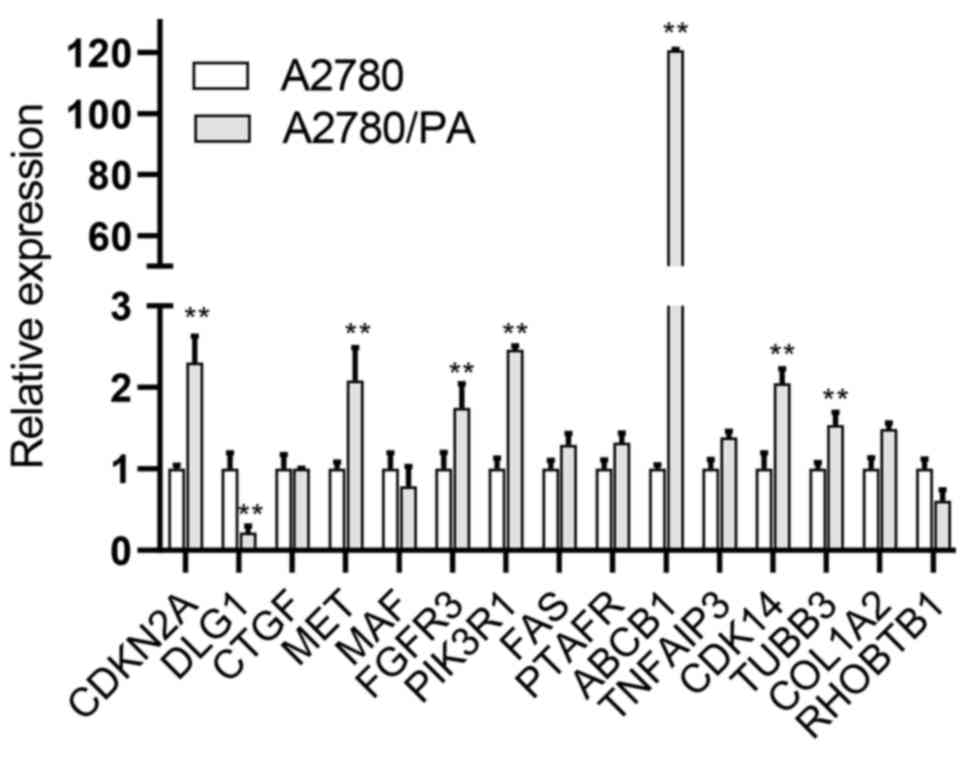 | Figure 7.mRNA expression of hub genes in
A2780/PA and A2780 cell lines. **P<0.01 vs. A2780. ABCB1, ATP
binding cassette subfamily B member 1; CDKN2A, cyclin dependent
kinase inhibitor 2A; CDK14, cyclin dependent kinase 14; COL1A2,
collagen type I alpha 2 chain; CTGF, connective tissue growth
factor; DLG1, disks large homolog 1; FAS, Fas cell surface death
receptor; FGFR3, fibroblast growth factor receptor 3; MAF, MAF bZIP
transcription factor; MET, MET proto-oncogene, receptor tyrosine
kinase; PIK3R1, phosphoinositide-3-kinase regulatory subunit 1;
PTAFR, platelet activating factor receptor; RHOBTB1, Rho related
BTB domain containing 1; TNFAIP3, TNF alpha induced protein 3;
TUBB3, tubulin beta 3 class III. |
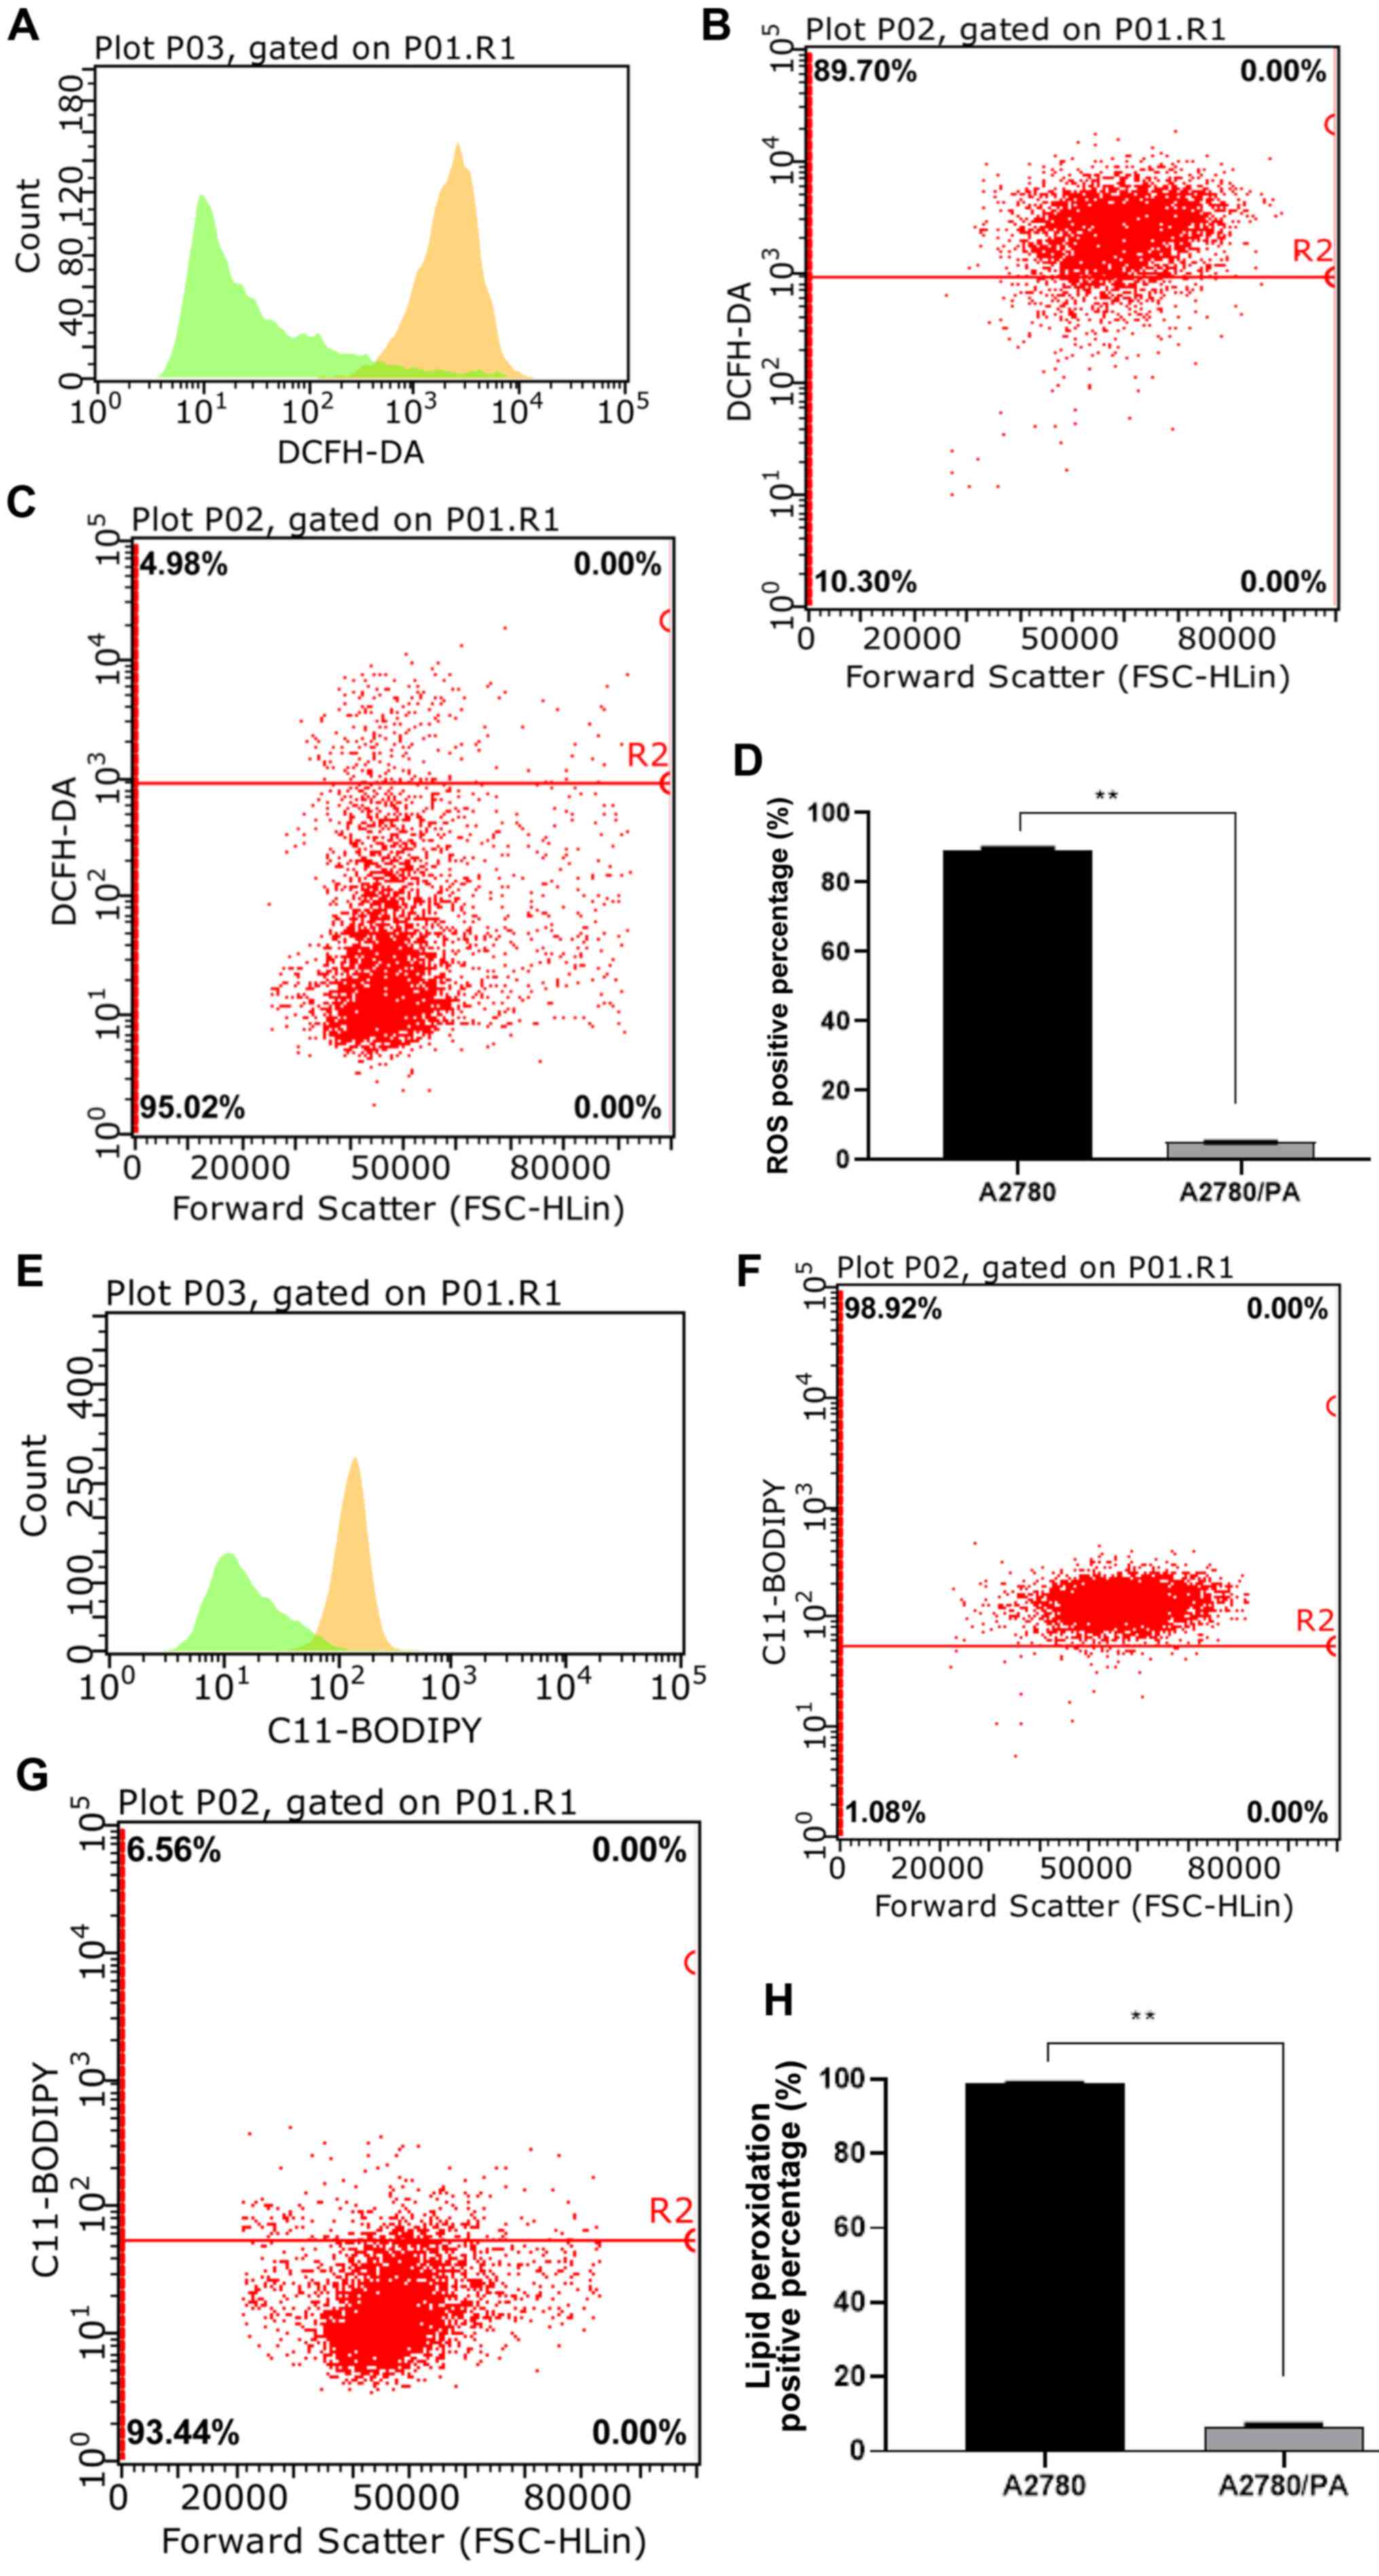
Effect of ROS level on paclitaxel
resistance in ovarian cancer
ROS serve a role in cellular responses to stress and
are associated with apoptosis through mitochondrial DNA damage
which has an effect on drug resistance (25). The role of mitochondrial ROS-mediated
mechanisms, along with ROS prominent roles and modulation of
metabolic events may be essential contributors for cancer drug
resistance (26). Recent
observations demonstrate that chronic and abnormally high ROS
levels may instigate or accentuate cancer phenotypes, including
drug resistance (27,28). Therefore, intracellular ROS levels
were measured by flow cytometry analysis after paclitaxel
treatment. The results indicated that A2780/PA cells had
significantly lower levels of ROS compared with A2780 cells after
paclitaxel treatment (Fig.
8A-D).
Effect of lipid peroxidation on
paclitaxel resistance in ovarian cancer
Elevated ROS can cause apoptosis by increasing the
level of cellular lipid peroxidation and consequently augmenting
the permeability of the mitochondrial membrane (29). Thus, intracellular lipid peroxidation
levels were measured by flow cytometry analysis after paclitaxel
treatment. The results indicated that A2780/PA cells had
significantly lower lipid peroxidation than A2780 cells after
paclitaxel treatment (Fig.
8E-H).
From the above results, it can be seen that the ROS
level of A2780/PA was significantly lower than that of A2780 after
paclitaxel administration, and the degree of lipid peroxidation was
also significantly reduced, indicating that resistant cell lines
can withstand ROS and lipid oxidation to enhance drug resistance.
In addition, it was verified that the expression of the hub gene of
each cell group was consistent with the gene expression of the
clinical samples of ovarian cancer.
Discussion
Chemoresistance in ovarian cancer has been a hot
topic in recent years. In the present study, bioinformatics
analyses were used to analyse the GSE73935 chip dataset downloaded
from the GEO database. The dataset included four different ovarian
cancer chemotherapy-resistant cell lines and one
chemotherapy-sensitive cell line. DEGs and overlapping genes were
screened and PPI analysis of these genes yielded crucial genes that
were then validated.
The current clinical guidelines recommend that the
first-line chemotherapy drugs for advanced ovarian cancer should be
cisplatin combined with paclitaxel, and that cisplatin plus
doxorubicin can be used as a standard replacement for the former.
If the patient has an allergic reaction to paclitaxel, topotecan is
the preferred alternative (3,4).
Although the standard treatment for patients with ovarian cancer is
cisplatin plus paclitaxel, other factors such as histology,
distribution of disease, asymptomatic versus symptomatic, toxicity
profile, genetic signature, vulnerable and elderly patients, and
patient desire (for example to avoid hair loss) need to be taken
into account (30).
The present study was based on an analysis of the
genetic signature, which refers to the effect of genetic level on
drug resistance, and it carries the largest weight among all these
factors. Therefore, the results have high reference value for
clinical decision-making and future research. By identifying DEGs
through an integrated bioinformatics analysis of signalling
pathways in ovarian cancer, as well as validating these findings
using immunohistochemistry results and survival analysis curves, we
hypothesise that data-driven clinical decisions are feasible.
Overlapping DEGs have the potential to indicate what
genes are abnormally expressed in cells resistant to two or more
chemotherapy drugs. The higher the number of overlapping DEGs
between different drugs, the more likely the patient is to show
resistance to one drug after showing resistance to another.
Cisplatin combined with paclitaxel had the highest number of
overlapping genes at 65. Therefore, the results from the present
study suggested that when patients subsequently develop cisplatin
resistance, the likelihood of these patients to additionally
acquire resistance to paclitaxel is high.
The exclusive overlapping DEGs ratio refers to the
ratio of DEGs that are only resistant to two chemotherapeutic drugs
among the four chemotherapeutic drugs The smaller the ratio, the
more likely individual patients who are resistant to such
combinations of drugs will be resistant to other combinations of
drugs. Cisplatin combined with doxorubicin had the smallest
proportion of exclusive consensus genes at only 16.2%. Although
some studies suggest that it can be used as a standard replacement
(4,31,32),
when it is used as first-line therapy, with the emergence of drug
resistance, the possibility of multi-drug resistance increases, to
ensure more drug choices are available for subsequent treatment,
this combination is not recommended for first-line
chemotherapy.
After undergoing tumour resection, patients can be
tested for protein and gene expression by immunohistochemistry and
other methods. The present study identified eight genes that can
guide individualised treatment according to their expression.
EDIL3, an extracellular matrix protein associated with
vascular morphogenesis and remodelling, is commonly upregulated in
multiple types of human cancers and is correlated with apoptosis
and tumour growth (33). Jiang et
al (34) reported that
EDIL3 exerts its antiapoptotic effect by altering the
protein expression of the Bcl-2 family. The present study found
that among patients with ovarian cancer with a high expression of
EDIL3, those receiving a regimen of cisplatin plus
paclitaxel had a poor prognosis, and thus this chemotherapy is not
recommended.
NRAS mutations are present in multiple
cancers, and high expression of mutant NRAS in low-grade
serous ovarian carcinomas leads to uncontrolled RAS/MAPK signalling
(35). The current study found that
patients with ovarian cancer who received cisplatin plus paclitaxel
had a poorer prognosis when non-mutated NRAS was expressed
at lower levels, thus this regimen is not recommended.
PROCR is known for promoting the migration of
ovarian cancer cells (36). Previous
studies have suggested that PROCR induces the activation of
ERK and PI3K-Akt-mTOR signals to promote tumour growth (37,38). The
present study also found that the prognosis of patients with
ovarian cancer, with high PROCR expression, and those
receiving cisplatin combined with paclitaxel chemotherapy regimen
was poor, and therefore this chemotherapy regimen should not be
used, as it is unlikely to promote patient benefit.
HAPLN1 is known for activating NF-κB activity
to increase myeloma resistance (39), and is associated with the prognosis
of several types of tumour (40,41). To
date there are no reports associating this gene with ovarian
cancer. In the current study, the prognosis of ovarian cancer
patients with high HAPLN1 expression who were receiving
cisplatin combined with paclitaxel was found to be poor, but the
prognosis in other chemotherapy groups was better. Combined with
the microarray results, this gene was highly expressed in
cisplatin-, doxorubicin- and topotecan-resistant cells, but was
weakly expressed in paclitaxel-resistant cells. Therefore, for
patients with high expression of HAPLN1, cisplatin combined
with paclitaxel is not recommended. Instead, a combined
chemotherapy regimen based on paclitaxel may be administered.
In cisplatin-resistant ovarian cancer cells,
IGF1R is highly expressed (42), and the inhibition of IGF1R
signalling pathway reverses cisplatin resistance in ovarian cancer
(43,44). These previous findings are consistent
with the results of the present study, that suggest that the
cisplatin-based chemotherapy regimen is also shown to not be
beneficial in tumours expressing high levels of IGF1R.
The inhibition of CDKN2A suppressed cell
proliferation, invasion and migration abilities, while inducing
apoptosis and sensitivity to paclitaxel in breast cancer (45). This supports the results of the
present study that patients with high CDKN2A expression
levels were found to have a poor prognosis, therefore a
paclitaxel-based regimen is not recommended in such patients.
CD53 promotes B cell receptor-dependent
protein kinase C signalling (46),
and increases tumour growth in Cd53−/− mice
(47). Patients with low CD53
expression levels were found to have a poor prognosis. Therefore,
cisplatin combined with doxorubicin is not recommended.
A pathway composed of the secreted SLIT
glycoproteins and their ROBO receptors has the dual role of
carcinogenesis and tumour suppression in human cancer (48). A previous study has shown that
ROBO2 is downregulated in ovarian cancer as a tumour
suppressor gene, and SLIT/ROBO activity can induce programmed cell
death through the activation of caspase-3 in ovarian tumour cell
lines (49). These findings support
the results of the present study that patients with low
ROBO2 expression were found to have a poor prognosis. Thus,
these patients are not recommended to undergo cisplatin plus
topotecan chemotherapy.
In addition, ROS levels and lipid peroxidation in
A2780/PA cells were significantly lower than in A2780 after
administration of paclitaxel, indicating that drug-resistant cell
lines enhance their resistance to chemotherapeutic drugs by
blocking the production of ROS and inducing lipid peroxidation.
Previous studies have demonstrated that increased levels of ROS and
lipid peroxidation can damage mitochondria and DNA, which in turn
can affect cancer drug resistance (25,26,29).
Therefore, we hypothesised that the DEGs of paclitaxel-resistant
cells proposed in this study may affect cell metabolism through
mitochondrial functions and oxidative stress levels to promote
resistance, which might have implications for future research
directions.
In conclusion, using an integrated bioinformatics
analysis for microarray datasets, eight crucial genes were
identified, EDIL3, NRAS, HAPLN1, PROCR, CD53, CDKN2A, IGF1R
and ROBO2, that can indicate the most appropriate
chemotherapy drugs for ovarian cancer in order to minimise the
occurrence of ovarian cancer drug resistance enabling improved
precision medicine. In addition, this study proposed
recommendations for clinical drug use through an integrated
bioinformatics analysis of microarray datasets. These findings
could contribute to further basic research and clinical trial
design. Data-driven clinical decisions have the potential to
greatly promote the transparency and reproducibility of diagnoses
and treatments. These findings could also provide new insights into
genomic personalised medicine and survival prediction for ovarian
cancer.
Supplementary Material
Supporting Data
Acknowledgements
Not applicable.
Funding
This work was supported by The National Natural
Science Foundation of China (grant no. 81772794), The National
Natural Science Foundation of China (grant no. 81672948), The
National Natural Science Foundation of China (grant no. 81472419),
The Jilin Provincial Industrial Innovation Project (grant no.
2018C052-7), The Jilin Provincial Research Foundation for the
Development of Science and Technology Projects (grant no.
20191004004TC), and The Fundamental Research Funds of Central
Universities, Jilin University.
Availability of data and materials
The datasets used and/or analyzed during the
present study are available from the corresponding author upon
reasonable request.
Authors' contributions
DY drafted the initial manuscript and performed the
experiments. HZ acquired and analyzed the data. HS revised the
manuscript and assisted in some experiments. RT and MX assisted in
the data processing, and reviewed and edited the manuscript. LS and
YL supervised the research work, participated in designing the
study and revised the manuscript. All authors read and approved the
final manuscript.
Ethics approval and consent to
participate
Not applicable.
Patient consent for publication
Not applicable.
Competing interests
The authors declare that they have no competing
interests.
References
|
1
|
Siegel RL, Miller KD and Jemal A: Cancer
statistics, 2020. CA Cancer J Clin. 70:7–30. 2020. View Article : Google Scholar : PubMed/NCBI
|
|
2
|
Terraneo N, Jacob F, Dubrovska A and
Grünberg J: Novel therapeutic strategies for ovarian cancer stem
cells. Front Oncol. 10:3192020. View Article : Google Scholar : PubMed/NCBI
|
|
3
|
Marth C, Reimer D and Zeimet AG:
Front-line therapy of advanced epithelial ovarian cancer: Standard
treatment. Ann Oncol. 28 (Suppl_8):viii36–viii39. 2017. View Article : Google Scholar
|
|
4
|
Pignata S, Lauraine EP, du Bois A and
Pisano C: Pegylated liposomal doxorubicin combined with
carboplatin: A rational treatment choice for advanced ovarian
cancer. Crit Rev Oncol Hematol. 73:23–30. 2010. View Article : Google Scholar : PubMed/NCBI
|
|
5
|
Morgan RJ Jr, Armstrong DK, Alvarez RD,
Bakkum-Gamez JN, Behbakht K, Chen LM, Copeland L, Crispens MA,
DeRosa M, Dorigo O, et al: Ovarian cancer, version 1.2016, NCCN
clinical practice guidelines in oncology. J Natl Compr Canc Netw.
14:1134–1163. 2016. View Article : Google Scholar : PubMed/NCBI
|
|
6
|
Rojas V, Hirshfield KM, Ganesan S and
Rodriguez-Rodriguez L: Molecular characterization of epithelial
ovarian Cancer: Implications for diagnosis and treatment. Int J Mol
Sci. 17(pii): E21132016. View Article : Google Scholar : PubMed/NCBI
|
|
7
|
Thomas A and Pommier Y: Targeting
Topoisomerase I in the Era of Precision Medicine. Clin Cancer Res.
25:6581–6589. 2019. View Article : Google Scholar : PubMed/NCBI
|
|
8
|
Dasari S and Tchounwou PB: Cisplatin in
cancer therapy: Molecular mechanisms of action. Eur J Pharmacol.
740:364–378. 2014. View Article : Google Scholar : PubMed/NCBI
|
|
9
|
Wenningmann N, Knapp M, Ande A, Vaidya TR
and Ait-Oudhia S: Insights into doxorubicin-induced cardiotoxicity:
Molecular mechanisms, preventive strategies, and early monitoring.
Mol Pharmacol. 96:219–232. 2019. View Article : Google Scholar : PubMed/NCBI
|
|
10
|
Zhu L and Chen L: Progress in research on
paclitaxel and tumor immunotherapy. Cell Mol Biol Lett. 24:402019.
View Article : Google Scholar : PubMed/NCBI
|
|
11
|
Hoskins P, Eisenhauer E, Vergote I,
Dubuc-Lissoir J, Fisher B, Grimshaw R, Oza A, Plante M, Stuart G
and Vermorken J: Phase II feasibility study of sequential couplets
of Cisplatin/Topotecan followed by paclitaxel/cisplatin as primary
treatment for advanced epithelial ovarian cancer: A National Cancer
Institute of Canada Clinical Trials Group Study. J Clin Oncol.
18:4038–4044. 2000. View Article : Google Scholar : PubMed/NCBI
|
|
12
|
Brotto L, Brundage M, Hoskins P, Vergote
I, Cervantes A, Casado HA, Poveda A, Eisenhauer E and Tu D;
Gynecologic Cancer Intergroup Study of NCIC Clinical Trials Group
(NCIC CTG); European Organization for Research and Treatment of
Cancer, : Randomized study of sequential
cisplatin-topotecan/carboplatin-paclitaxel versus
carboplatin-paclitaxel: Effects on quality of life. Support Care
Cancer. 24:1241–1249. 2016. View Article : Google Scholar : PubMed/NCBI
|
|
13
|
Hoskins P, Vergote I, Cervantes A, Tu D,
Stuart G, Zola P, Poveda A, Provencher D, Katsaros D, Ojeda B, et
al: Advanced ovarian cancer: Phase III randomized study of
sequential cisplatin-topotecan and carboplatin-paclitaxel vs
carboplatin-paclitaxel. J Natl Cancer Inst. 102:1547–1556. 2010.
View Article : Google Scholar : PubMed/NCBI
|
|
14
|
Antman E, Weiss S and Loscalzo J: Systems
pharmacology, pharmacogenetics, and clinical trial design in
network medicine. Wiley Interdiscip Rev Syst Biol Med. 4:367–383.
2012. View Article : Google Scholar : PubMed/NCBI
|
|
15
|
Garralda E, Dienstmann R, Piris-Giménez A,
Braña I, Rodon J and Tabernero J: New clinical trial designs in the
era of precision medicine. Mol Oncol. 13:549–557. 2019. View Article : Google Scholar : PubMed/NCBI
|
|
16
|
Pignata S, Scambia G, Ferrandina G,
Savarese A, Sorio R, Breda E, Gebbia V, Musso P, Frigerio L, Del
Medico P, et al: Carboplatin plus paclitaxel versus carboplatin
plus pegylated liposomal doxorubicin as first-line treatment for
patients with ovarian cancer: the MITO-2 randomized phase III
trial. J Clin Oncol. 29:3628–3635. 2011. View Article : Google Scholar : PubMed/NCBI
|
|
17
|
Kurtz JE, Kaminsky MC, Floquet A, Veillard
AS, Kimmig R, Dorum A, Elit L, Buck M, Petru E, Reed N, et al:
Ovarian cancer in elderly patients: Carboplatin and pegylated
liposomal doxorubicin versus carboplatin and paclitaxel in late
relapse: A Gynecologic Cancer Intergroup (GCIG) CALYPSO sub-study.
Ann Oncol. 22:2417–2423. 2011. View Article : Google Scholar : PubMed/NCBI
|
|
18
|
Sehouli J, Chekerov R, Reinthaller A,
Richter R, Gonzalez-Martin A, Harter P, Woopen H, Petru E, Hanker
LC, Keil E, et al: Topotecan plus carboplatin versus standard
therapy with paclitaxel plus carboplatin (PC) or gemcitabine plus
carboplatin (GC) or pegylated liposomal doxorubicin plus
carboplatin (PLDC): A randomized phase III trial of the
NOGGO-AGO-Study Group-AGO Austria and GEICO-ENGOT-GCIG intergroup
study (HECTOR). Ann Oncol. 27:2236–2241. 2016. View Article : Google Scholar : PubMed/NCBI
|
|
19
|
Bolis G, Scarfone G, Raspagliesi F,
Mangili G, Danese S, Scollo P, Lo Russo D, Villa A, Aimone PD and
Scambia G: Paclitaxel/carboplatin versus
topotecan/paclitaxel/carboplatin in patients with FIGO suboptimally
resected stage III–IV epithelial ovarian cancer a multicenter,
randomized study. Eur J Cancer. 46:2905–2912. 2010. View Article : Google Scholar : PubMed/NCBI
|
|
20
|
Galluzzi L, Vitale I, Michels J, Brenner
C, Szabadkai G, Harel-Bellan A, Castedo M and Kroemer G: Systems
biology of cisplatin resistance: Past, present and future. Cell
Death Dis. 5:e12572014. View Article : Google Scholar : PubMed/NCBI
|
|
21
|
Livak KJ and Schmittgen TD: Analysis of
relative gene expression data using real-time quantitative PCR and
the 2(-Delta Delta C(T)) method. Methods. 25:402–408. 2001.
View Article : Google Scholar : PubMed/NCBI
|
|
22
|
Schmittgen TD and Livak KJ: Analyzing
real-time PCR data by the comparative C(T) method. Nat Protoc.
3:1101–1108. 2008. View Article : Google Scholar : PubMed/NCBI
|
|
23
|
Irizarry RA, Hobbs B, Collin F,
Beazer-Barclay YD, Antonellis KJ, Scherf U and Speed TP:
Exploration, normalization, and summaries of high density
oligonucleotide array probe level data. Biostatistics. 4:249–264.
2003. View Article : Google Scholar : PubMed/NCBI
|
|
24
|
Armstrong DK, Alvarez RD, Bakkum-Gamez JN,
Barroilhet L, Behbakht K, Berchuck A, Berek JS, Chen LM, Cristea M,
DeRosa M, et al: NCCN Guidelines Insights: Ovarian Cancer, Version
1.2019. J Natl Compr Canc Netw. 17:896–909. 2019. View Article : Google Scholar : PubMed/NCBI
|
|
25
|
Zheng X and Li H: TKTL1 modulates the
response of paclitaxel-resistant human ovarian cancer cells to
paclitaxel. Biochem Biophys Res Commun. 503:572–579. 2018.
View Article : Google Scholar : PubMed/NCBI
|
|
26
|
Okon IS and Zou MH: Mitochondrial ROS and
cancer drug resistance: Implications for therapy. Pharmacol Res.
100:170–174. 2015. View Article : Google Scholar : PubMed/NCBI
|
|
27
|
Chen G, Wang F, Trachootham D and Huang P:
Preferential killing of cancer cells with mitochondrial dysfunction
by natural compounds. Mitochondrion. 10:614–625. 2010. View Article : Google Scholar : PubMed/NCBI
|
|
28
|
Okon IS, Coughlan KA, Zhang M, Wang Q and
Zou MH: Gefitinib-mediated reactive oxygen specie (ROS) instigates
mitochondrial dysfunction and drug resistance in lung cancer cells.
J Biol Chem. 290:9101–9110. 2015. View Article : Google Scholar : PubMed/NCBI
|
|
29
|
Środa-Pomianek K, Michalak K, Świątek P,
Poła A, Palko-Łabuz A and Wesołowska O: Increased lipid
peroxidation, apoptosis and selective cytotoxicity in colon cancer
cell line LoVo and its doxorubicin-resistant subline LoVo/Dx in the
presence of newly synthesized phenothiazine derivatives. Biomed
Pharmacother. 106:624–636. 2018. View Article : Google Scholar : PubMed/NCBI
|
|
30
|
Harter P, Hilpert F, Mahner S, Heitz F,
Pfisterer J and du Bois A: Systemic therapy in recurrent ovarian
cancer: Current treatment options and new drugs. Expert Rev
Anticancer Ther. 10:81–88. 2010. View Article : Google Scholar : PubMed/NCBI
|
|
31
|
Tempfer CB, Hartmann F, Hilal Z and
Rezniczek GA: Intraperitoneal cisplatin and doxorubicin as
maintenance chemotherapy for unresectable ovarian cancer: A case
report. BMC Cancer. 17:262017. View Article : Google Scholar : PubMed/NCBI
|
|
32
|
Tempfer CB, Giger-Pabst U, Seebacher V,
Petersen M, Dogan A and Rezniczek GA: A phase I, single-arm,
open-label, dose escalation study of intraperitoneal cisplatin and
doxorubicin in patients with recurrent ovarian cancer and
peritoneal carcinomatosis. Gynecol Oncol. 150:23–30. 2018.
View Article : Google Scholar : PubMed/NCBI
|
|
33
|
Feng MX, Ma MZ, Fu Y, Li J, Wang T, Xue F,
Zhang JJ, Qin WX, Gu JR, Zhang ZG and Xia Q: Elevated autocrine
EDIL3 protects hepatocellular carcinoma from anoikis through
RGD-mediated integrin activation. Mol Cancer. 13:2262014.
View Article : Google Scholar : PubMed/NCBI
|
|
34
|
Jiang SH, Wang Y, Yang JY, Li J, Feng MX,
Wang YH, Yang XM, He P, Tian GA, Zhang XX, et al: Overexpressed
EDIL3 predicts poor prognosis and promotes anchorage-independent
tumor growth in human pancreatic cancer. Oncotarget. 7:4226–4240.
2016. View Article : Google Scholar : PubMed/NCBI
|
|
35
|
Etemadmoghadam D, Azar WJ, Lei Y, Moujaber
T, Garsed DW, Kennedy CJ, Fereday S, Mitchell C, Chiew YE, Hendley
J, et al: EIF1AX and NRAS mutations co-occur and
cooperate in low-grade serous ovarian carcinomas. Cancer Res.
77:4268–4278. 2017. View Article : Google Scholar : PubMed/NCBI
|
|
36
|
Althawadi H, Alfarsi H, Besbes S, Mirshahi
S, Ducros E, Rafii A, Pocard M, Therwath A, Soria J and Mirshahi M:
Activated protein C upregulates ovarian cancer cell migration and
promotes unclottability of the cancer cell microenvironment. Oncol
Rep. 34:603–609. 2015. View Article : Google Scholar : PubMed/NCBI
|
|
37
|
Polyak K and Metzger Filho O: SnapShot:
Breast cancer. Cancer Cell. 22:562–562.e1. 2012. View Article : Google Scholar : PubMed/NCBI
|
|
38
|
Wang D, Liu C, Wang J, Jia Y, Hu X, Jiang
H, Shao ZM and Zeng YA: Protein C receptor stimulates multiple
signaling pathways in breast cancer cells. J Biol Chem.
293:1413–1424. 2018. View Article : Google Scholar : PubMed/NCBI
|
|
39
|
Huynh M, Pak C, Markovina S, Callander NS,
Chng KS, Wuerzberger-Davis SM, Bakshi DD, Kink JA, Hematti P, Hope
C, et al: Hyaluronan and proteoglycan link protein 1 (HAPLN1)
activates bortezomib-resistant NF-κB activity and increases drug
resistance in multiple myeloma. J Biol Chem. 293:2452–2465. 2018.
View Article : Google Scholar : PubMed/NCBI
|
|
40
|
Ecker BL, Kaur A, Douglass SM, Webster MR,
Almeida FV, Marino GE, Sinnamon AJ, Neuwirth MG, Alicea GM, Ndoye
A, et al: Age-related Changes in HAPLN1 increase lymphatic
permeability and affect routes of melanoma metastasis. Cancer
Discov. 9:82–95. 2019. View Article : Google Scholar : PubMed/NCBI
|
|
41
|
Yau C, Esserman L, Moore DH, Waldman F,
Sninsky J and Benz CC: A multigene predictor of metastatic outcome
in early stage hormone receptor-negative and triple-negative breast
cancer. Breast Cancer Res. 12:R852010. View Article : Google Scholar : PubMed/NCBI
|
|
42
|
Eckstein N, Servan K, Hildebrandt B,
Pölitz A, von Jonquières G, Wolf-Kümmeth S, Napierski I, Hamacher
A, Kassack MU, Budczies J, et al: Hyperactivation of the
insulin-like growth factor receptor I signaling pathway is an
essential event for cisplatin resistance of ovarian cancer cells.
Cancer Res. 69:2996–3003. 2009. View Article : Google Scholar : PubMed/NCBI
|
|
43
|
Du J, Shi HR, Ren F, Wang JL, Wu QH, Li X
and Zhang RT: Inhibition of the IGF signaling pathway reverses
cisplatin resistance in ovarian cancer cells. BMC Cancer.
17:8512017. View Article : Google Scholar : PubMed/NCBI
|
|
44
|
Zhang Y, Huang S, Guo Y and Li L: MiR-1294
confers cisplatin resistance in ovarian Cancer cells by targeting
IGF1R. Biomed Pharmacother. 106:1357–1363. 2018. View Article : Google Scholar : PubMed/NCBI
|
|
45
|
Wang L, Zhan X, Shen X, Li M, Yang J, Yu
W, Chen H, Jin B and Mao Z: P16 promotes the growth and mobility
potential of breast cancer both in vitro and in vivo: the key role
of the activation of IL-6/JAK2/STAT3 signaling. Mol Cell Biochem.
446:137–148. 2018. View Article : Google Scholar : PubMed/NCBI
|
|
46
|
Zuidscherwoude M, Dunlock VE, van den
Bogaart G, van Deventer SJ, van der Schaaf A, van Oostrum J,
Goedhart J, In't Hout J, Hämmerling GJ, Tanaka S, et al:
Tetraspanin microdomains control localized protein kinase C
signaling in B cells. Sci Signal. 10(pii): eaag27552017. View Article : Google Scholar : PubMed/NCBI
|
|
47
|
Schaper F and van Spriel AB: Antitumor
immunity is controlled by tetraspanin proteins. Front Immunol.
9:11852018. View Article : Google Scholar : PubMed/NCBI
|
|
48
|
Jiang Z, Liang G, Xiao Y, Qin T, Chen X,
Wu E, Ma Q and Wang Z: Targeting the SLIT/ROBO pathway in tumor
progression: molecular mechanisms and therapeutic perspectives.
Ther Adv Med Oncol. 11:17588359198552382019. View Article : Google Scholar : PubMed/NCBI
|
|
49
|
Dickinson RE and Duncan WC: The SLIT-ROBO
pathway: A regulator of cell function with implications for the
reproductive system. Reproduction. 139:697–704. 2010. View Article : Google Scholar : PubMed/NCBI
|