Introduction
Acute myeloid leukemia (AML) is a heterogeneous
hematologic malignancy characterized by clonal expansion of
myeloblasts in peripheral blood, bone marrow and/or other tissues.
AML prognosis is suboptimal and several patients will ultimately
experience recurrence (1). The
latest National Comprehensive Cancer Network (NCCN) guidelines
predicted that 21,450 new cases of AML will be diagnosed in 2019
and 10,920 patients will die from the disease (1). According to the SEER Cancer Statistics
Review, the median age at diagnosis of AML is 67 years (2). However, other registries have reported
a median age of 71 years (3), with
54% of patients diagnosed at ≥65 years, and ~1/3 diagnosed at ≥75
years (2). Thus, the incidence of
AML and myelodysplastic syndromes increases with age.
Currently, the pathogenesis of AML remains unclear.
Previous studies have demonstrated that molecular abnormalities,
such as chromosomal abnormalities, gene mutations, abnormal myeloid
cell proliferation in bone marrow and peripheral blood, and
inhibition of normal hematopoietic stem cell (HSC) apoptosis and
differentiation, contribute to the progression of AML and clinical
outcomes (1,2,4).
Recently, considerable progress has been made in risk
stratification for AML, based on molecular biology and cytogenetic
changes, such as chromosomal abnormalities and somatic mutations
(1,4,5). Based
on retrospective analyses of data from large cooperative group
studies, 40–50% of patients with de novo AML exhibit a
normal karyotype, representing the single most important prognostic
factor for predicting remission rates, relapse risks, and OS
outcomes (6,7). However, clinical outcome is
heterogeneous even in patients with normal karyotype AML (1,3,4).
The most frequently used chemotherapy regimen for
AML involves combination therapy with continuous infusion of
cytarabine for 7 days and intravenous injection of daunorubicin for
3 days (1–4). However, despite the substantial initial
sensitivity of AML to chemotherapy in the early stages of
treatment, patients eventually develop clinical drug resistance due
to relapse (1–3). Thus, identification of effective
markers to improve the clinical outcome prediction of AML is
crucial.
Gene expression profiling in AML is valuable in the
diagnosis of different cytogenetic subtypes, discovery of novel AML
subclasses and prediction of prognosis. Furthermore, molecular
analysis is a promising source of clinically useful prognostic
biomarkers (1–4). The present study aimed to identify
prognostic biomarkers for patients with AML, using a gene
expression profile dataset from a publicly available database, and
set out to construct a gene signature for AML prognostic
prediction.
Materials and methods
Data collection and baseline
characteristics of patients with AML
Expression of RNA profiles, such as those of mRNAs,
microRNAs (miRNAs/miRs) and long non-coding RNAs (lncRNAs), and the
corresponding clinical information mutation data of 200 patients
with AML in The Cancer Genome Atlas (TCGA) dataset (TCGA, Firehose
Legacy Version; http://www.cbioportal.org/study/summary?id=laml_tcga)
(8) were downloaded from the
cBioPortal online platform (http://www.cbioportal.org) (9). Of the 200 patients assessed in the
present study, 109 were male and 91 were female. The median age of
the patients was 58 years (P25-P75: 44–67 years), and the median
mutation count was nine. The clinical data of patients with AML are
listed in Table I.
 | Table I.Characteristics of patients with
acute myeloid leukemia (n=200). |
Table I.
Characteristics of patients with
acute myeloid leukemia (n=200).
| Characteristic | Patient, n (%) |
|---|
| Median age, years
(P25-P75) | 58 (44–67) |
| Age, years |
|
|
<60 | 108 (54.0) |
|
≥60 | 92 (46.0) |
| Sex |
|
|
Male | 109 (54.5) |
|
Female | 91 (45.5) |
| Race |
|
|
White | 181 (90.5) |
|
Black/African American | 15 (7.5) |
|
Asian | 2 (1.0) |
|
Missing | 2 (1.0) |
| Median mutation
count (P25-P75) | 9 (5–14) |
| Mutation count |
|
|
<10 | 101 (50.5) |
|
≥10 | 95 (47.5) |
|
Missing | 4 (2.0) |
| Ethnicity |
|
| Not
Hispanic or Latino | 194 (97.0) |
|
Hispanic or Latino | 3 (1.5) |
|
Missing | 3 (1.5) |
| Median platelet
count preresection (P25-P75) | 52 (31–87) |
| Median abnormal
lymphocyte (P25-P75) | 0 (0–2) |
Survival analysis
Samples with incomplete lncRNA, mRNA or miRNA data
were excluded, while patients with AML, with complete
lncRNA-sequence (seq, n=20), mRNA-seq (n=150) and miRNA-seq data
(n=164), and survival information were included in the survival
analysis. Univariate Cox regression analysis was performed to
determine the associations between survival and lncRNAs, miRNAs and
mRNAs. Kaplan-Meier plots were generated for the top five lncRNAs,
miRNAs and mRNAs, using the survminer package [version 0.4.6;
(10)] within R software version
3.3.3 (11).
Bioinformatics analysis
The statistically significant mRNAs (P<0.05)
identified during univariate Cox regression analysis were included
in the Kyoto Encyclopedia of Genes and Genomes (KEGG), Reactome and
Gene Ontology (GO) analyses; Gene set enrichment analysis (GSEA)
was performed using the clusterProfiler package [version 3.14.3;
(12)] within R software, in order
to identify significantly enriched signaling pathways. The
transcripts were ranked by the log2 (fold change) between high and
low expression groups, according to the median expression, and GSEA
was performed. A protein-protein interaction (PPI) network was
constructed and modular analyses were performed using Metascape
(http://metascape.org/gp/index.html)
(13). The ggplot2 R package was
used to visualize the correlation heatmap (14). The ggplot2 R package within R
software was also used to visualize the results of KEGG and GO
analyses, and P<0.05 was set as the cut-off value. Spearmen's
correlation analysis was performed to assess the association
between expression levels of the five mRNAs (MYH15, TREML2,
ATP13A2, MMP7 and KANSL1L).
Statistical analysis
Statistical analysis was performed using SPSS
software (version 24.0; IBM Corp). R software was used to plot
figures. Kaplan-Meier analysis was used to assess survival outcomes
and a log-rank test was used to compare differences between
survival curves. The ComplexHeatmap package [version 2.2.0;
(15)] within R software was used to
analyze mutation data and plot gene mutation landscapes. P<0.05
(two-tailed) was considered to indicate a statistically significant
difference.
Results
Mutation profiles of patients with
AML
Analysis of somatic mutation data using the
ComplexHeatmap package within R software demonstrated that among
the mutation landscapes of patients with AML (Fig. 1), the genes with the highest mutation
frequencies were: DNMT3A (13%), FLT3 (11%), NPM1 (9%), RUNX1 (9%),
IDH2 (8%), MUC16 (8%) and TP53 (8%) (Fig. 1). The mutation rates varied among
patients. In TCGA cohort, the median age of patients with AML at
diagnosis was 58 years (Table
I).
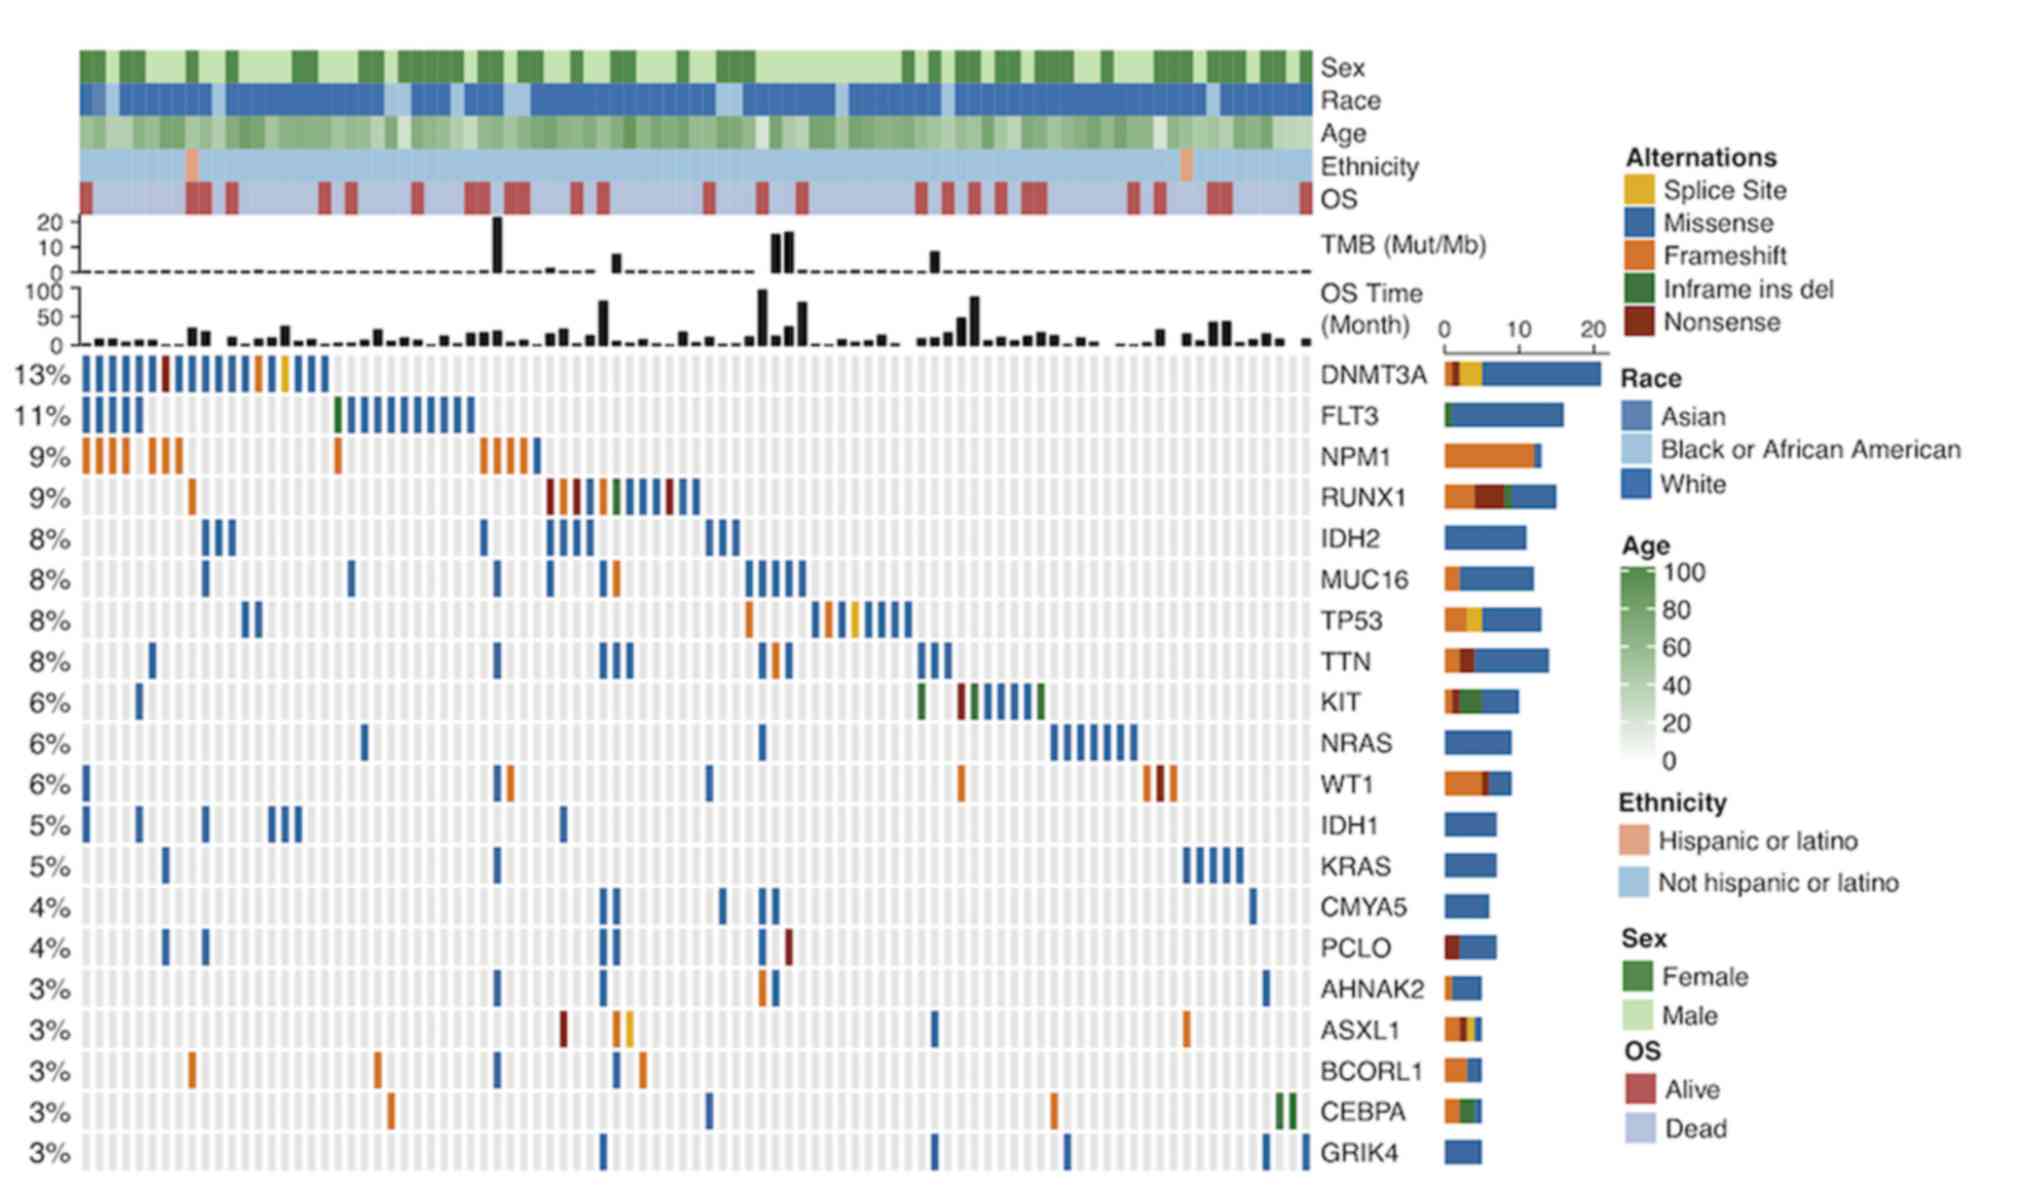 | Figure 1.Mutation landscape and clinical
information of patients with acute myeloid leukemia. Alternation
type, OS status, age, race, ethnicity, OS time and TMB are
annotated. OS, overall survival; TMB, tumor mutation burden; Mut,
mutation; Mb, megabase; ins, insertion; del, deletion. The genes
with the highest mutation frequencies were: DNMT3A, FLT3, NPM1,
RUNX1, IDH2, MUC16 and TP53. Most of the gene mutations were
missense mutations. The mutation rates varied among patients. |
Survival analysis of the prognosis of
patients with AML
The expression data of mRNAs, miRNAs and lncRNAs
were subjected to univariate Cox regression analysis to determine
the top 100 genes associated with the survival of patients with
AML. Age and sex were used as covariates. The top 100 genes
(P<0.05) for each gene type are listed in Table II. A total of 48 mRNAs, 52 miRNAs,
and 73 lncRNAs were identified as risk factors for poor prognosis,
whereas 52 mRNAs, 48 miRNAs and 27 lncRNAs were identified as
protective factors for prognosis. Subsequently, the top five
miRNAs, mRNAs and lncRNAs in the cox regression model were analyzed
via Kaplan-Meier analysis. The 5 mRNAs (MYH15, TREML2, ATP13A2,
KANSL1L and MMP7; Fig. 2A-E), 5
miRNAs (hsa-let-7a-2-3p, hsa-miR-362-3p, hsa-miR-500a-5p,
hsa-miR-500b-5p and hsa-miR-362-5p; Fig.
2F-J) and 5 lncRNAs (LINC00987, LACAT143, THCAT393, THCAT531
and KHCAT230; Fig. 2K-O) were
significantly associated with overall survival time (all
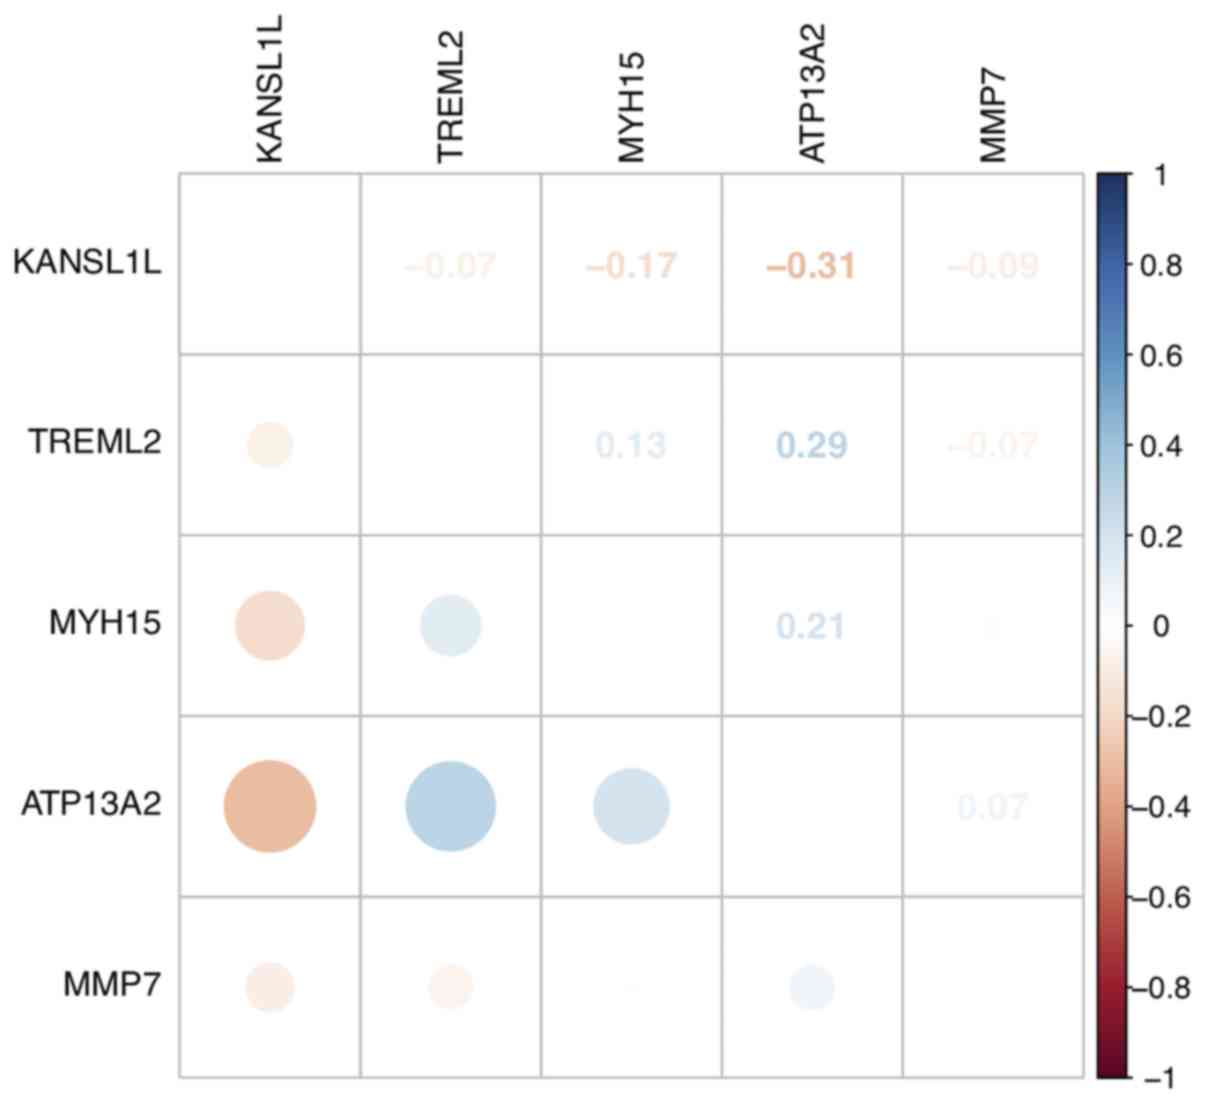
P<0.05). KANSL1L expression was negatively correlated with the
other four mRNAs, while ATP13A2 expression was positively
correlated with MYH15 and TREML2 expression levels (Fig. 3).
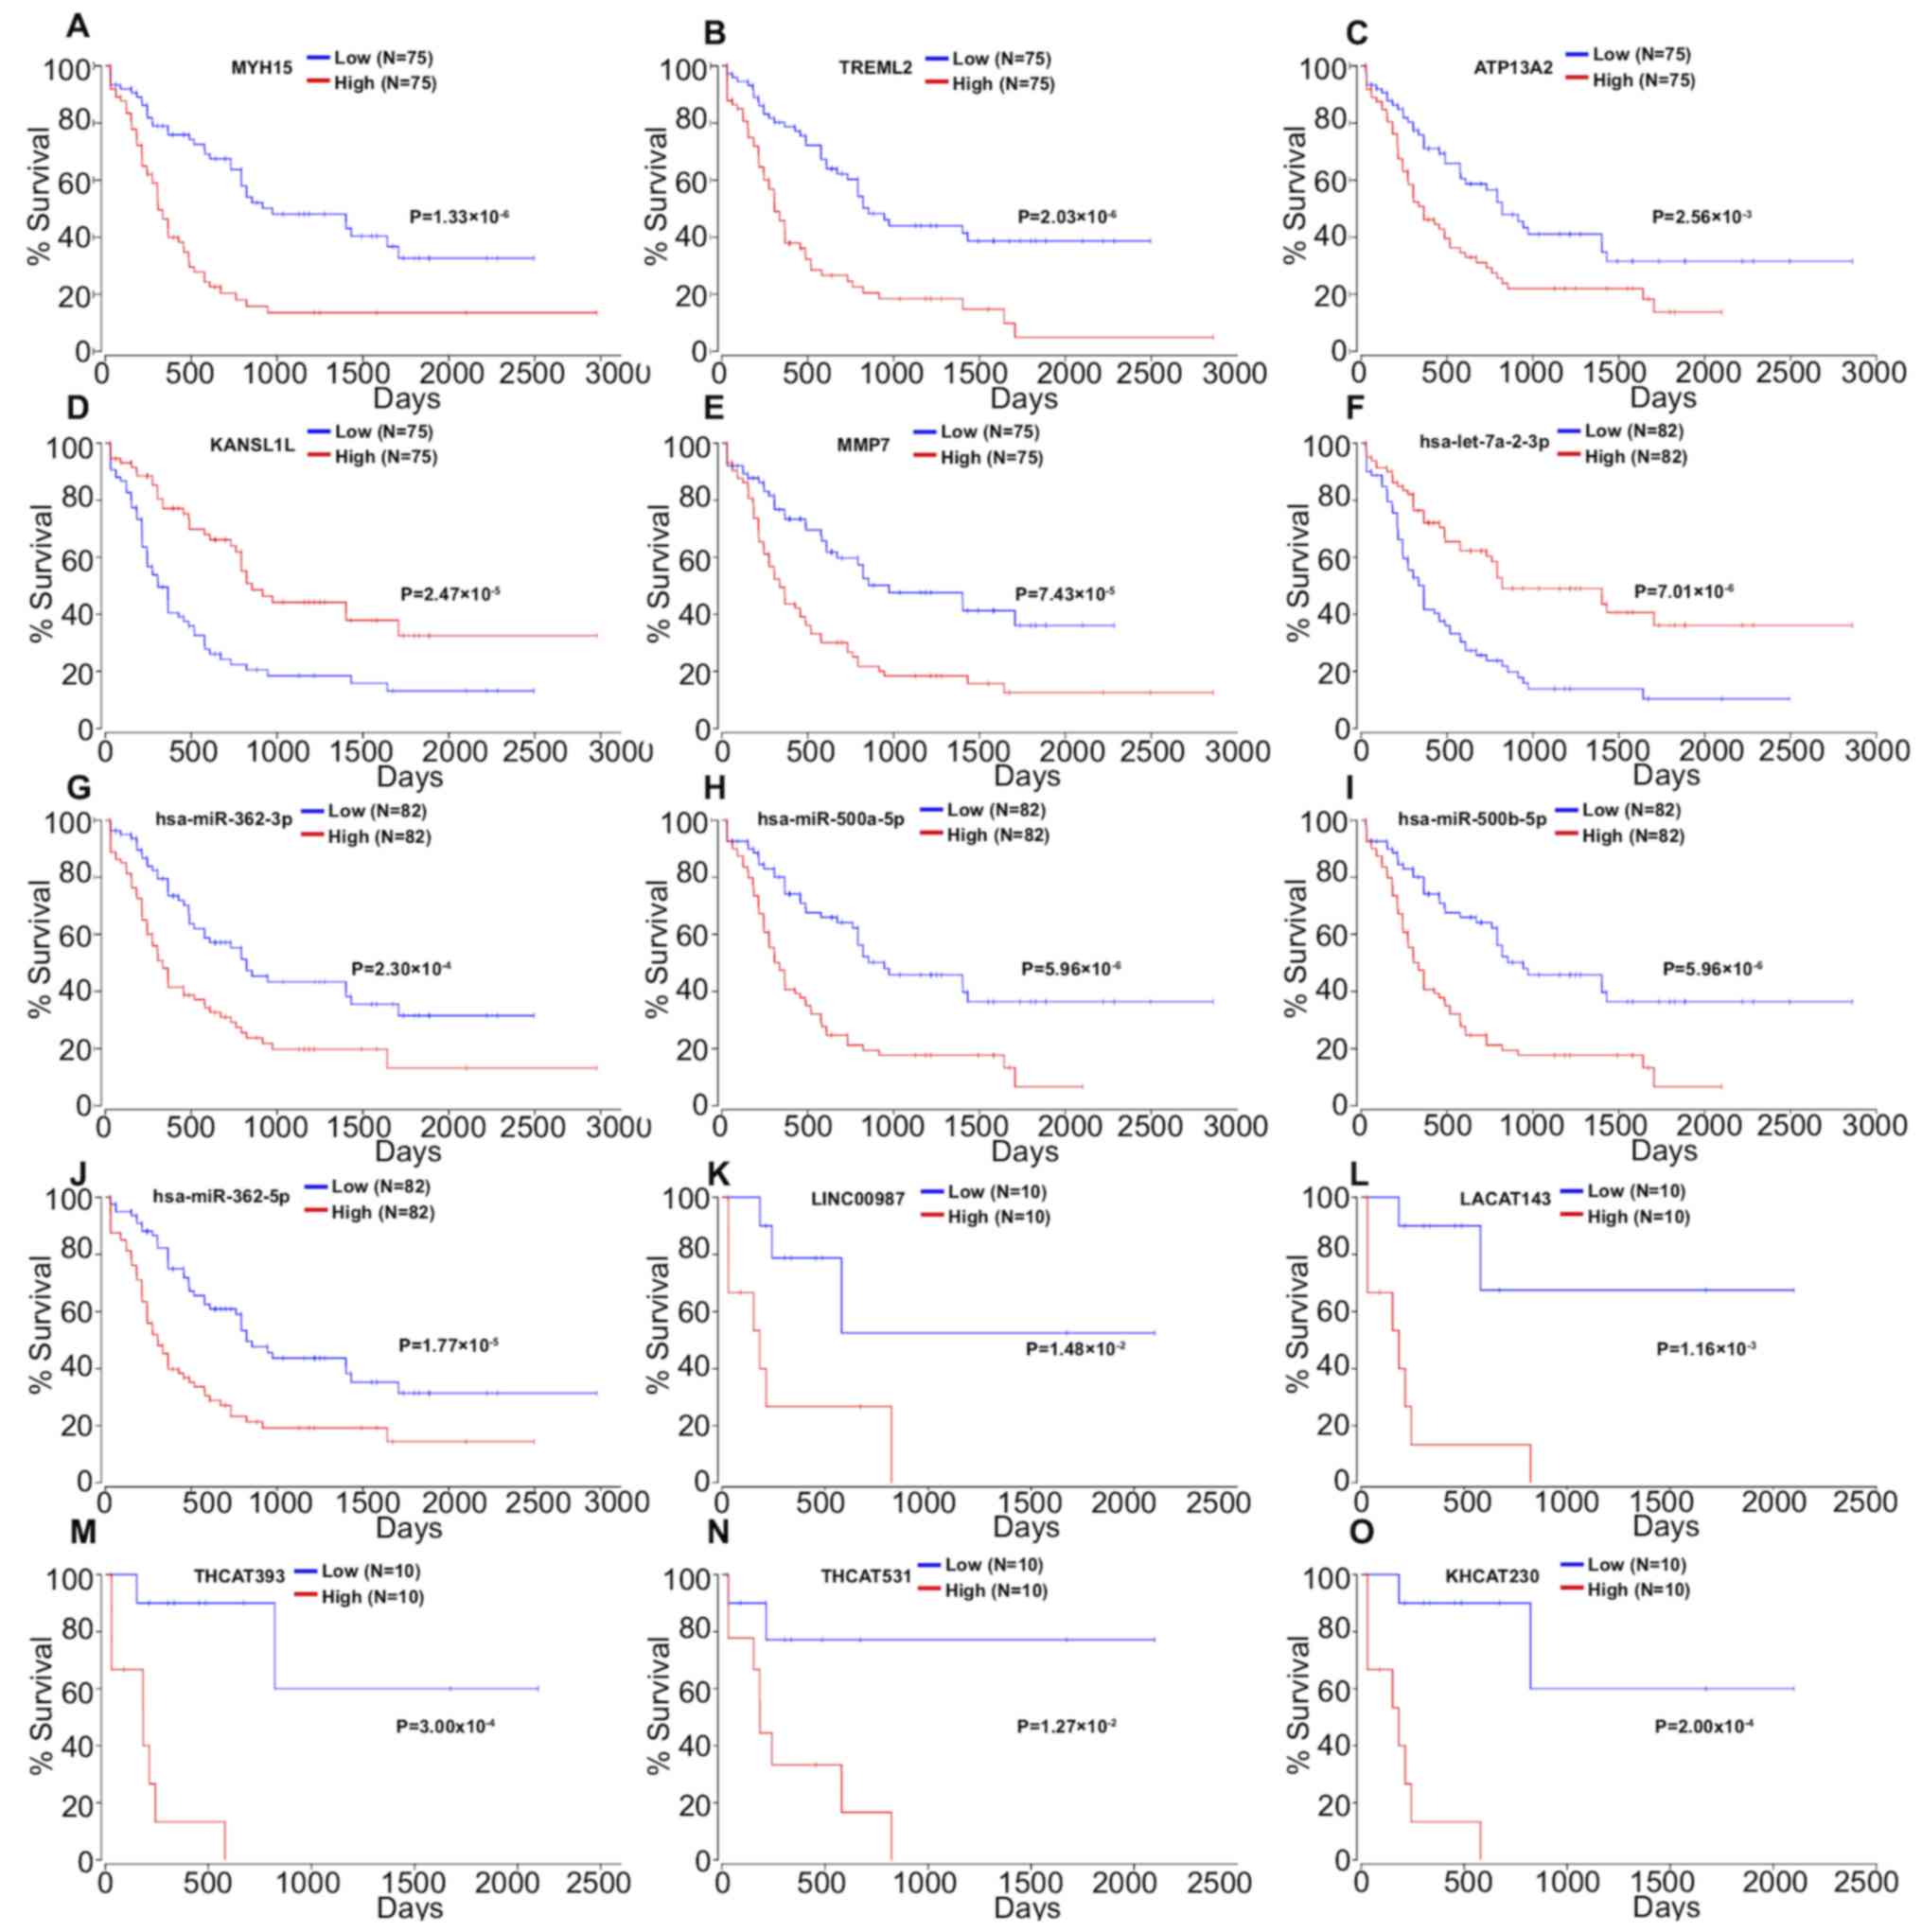 | Figure 2.Kaplan-Meier survival curves for (A)
MYH15, (B) TREML2, (C) ATP13A2, (D) KANSL1L and (E) MMP7, (F)
hsa-let-7a-2-3p, (G) hsa-miR-362-3p, (H) has-miR-500a-5p, (I)
hsa-miR-500b-5p, (J) hsa-miR-362-5p, (K) LINC00987, (L) LACAT143,
(M) THCAT393, (N) THCAT531 and (O) KHCAT230 associated with overall
survival time of patients with acute myeloid leukemia. |
| Table II.Univariate Cox regression analysis of
top 100 miRNA, mRNA and lncRNA in patients with acute myeloid
leukemia. |
Table II.
Univariate Cox regression analysis of
top 100 miRNA, mRNA and lncRNA in patients with acute myeloid
leukemia.
| Gene type | Risk factor | Protective
factor |
|---|
| mRNAa | MYH15, TREML2,
ATP13A2, MMP7, SPINK2, FAM207A, IL2RA, CLNK, FAM83G, F12, MAP4K1,
FBXW4, RPS6KA1, NUP210, PRR7, RHOF, STK10, CBR1, TGFB1, LSP1, CKLF,
SH3BP1, PNPLA6, PRICKLE4, IL12RB1, SPAG1, ETFB, UNC45A, BCKDK,
DAXX, KBTBD8, ZNF296, SELPLG, LSM4, RAC2, TOMM40L, ANKEF1,
C10orf128, GRK6, FERMT3, TAGLN2, PARVB, PPCDC, UPF1, TBCC, PTP4A3,
PDE7B, FIBP | KANSL1L, HSDL1,
ZFYVE16, MYB, NMT2, GALNT1, MAP3K1, MBNL1-AS1, C14orf37, DCBLD2,
GFPT1, POU5F2, SUZ12P1, TM6SF1, PWWP2A, ANKRD50, DCP2, MIB1, PDE3B,
ADAMTS7, ADSS, TVP23A, ZNF333, CCSAP, MMP14, DHRSX, ZNF124,
SERINC5, SNRK, CANX, CYP4F2, CCNJL, PLXNB1, SMA4, PRRC1, TAS2R43,
ARL15, LOC100130264, CENPC, SLC35F5, LRRC37A6P, EPHX1, ZSCAN23,
LCORL, LOXL4, TGIF1, DDX59, SRPK2, CLINT1, LRRTM2, GABRE,
H2AFV |
| miRNAa | hsa-miR-362-3p,
hsa-miR-500a-5p, hsa-miR-500b-5p, hsa-miR-362-5p, hsa-miR-532-5p,
hsa-miR-502-3p, hsa-miR-660-5p, hsa-miR-155-3p, hsa-miR-20b-5p,
hsa-let-7b-5p, hsa-miR-10a-5p, hsa-miR-501-3p, hsa-miR-500a-3p,
hsa-miR-141-5p, hsa-miR-20b-3p, hsa-miR-501-5p, hsa-miR-532-3p,
hsa-miR-20a-5p, hsa-miR-363-3p, hsa-miR-188-5p, hsa-miR-339-5p,
hsa-miR-196b-5p, hsa-miR-155-5p, hsa-miR-107, hsa-miR-196a-5p,
hsa-let-7a-3p, hsa-let-7b-3p, hsa-miR-339-3p, hsa-miR-29c-5p,
hsa-miR-18a-5p, hsa-miR-9-5p, hsa-miR-769-5p, hsa-miR-1284,
hsa-miR-185-3p, hsa-miR-548d-3p, hsa-miR-194-5p, hsa-miR-15b-3p,
hsa-miR-29b-2-5p, hsa-miR-10a-3p, hsa-miR-17-5p, hsa-miR-15a-3p,
hsa-miR-451a, hsa-miR-106a-5p, hsa-miR-200c-3p, hsa-miR-629-3p,
hsa-miR-301a-3p, hsa-miR-33b-5p, hsa-miR-151a-5p, hsa-miR-15a-5p,
hsa-miR-338-3p, hsa-miR-1-3p, hsa-miR-1976 | hsa-let-7a-2-3p,
hsa-miR-100-5p, hsa-miR-3913-5p, hsa-miR-181b-3p, hsa-miR-181c-5p,
hsa-miR-452-5p, hsa-miR-181a-5p, hsa-miR-181a-3p, hsa-miR-224-5p,
hsa-miR-181b-5p, hsa-miR-181a-2-3p, hsa-miR-195-5p,
hsa-miR-203a-3p, hsa-miR-199a-3p, hsa-miR-199b-3p, hsa-miR-3607-3p,
hsa-miR-193a-5p, hsa-miR-125b-5p, hsa-miR-574-3p, hsa-miR-3605-3p,
hsa-miR-1287-3p, hsa-miR-3653-3p, hsa-miR-193b-3p, hsa-miR-25-3p,
hsa-miR-10b-5p, hsa-miR-142-5p, hsa-miR-365a-3p, hsa-miR-424-3p,
hsa-miR-181c-3p, hsa-miR-32-5p, hsa-miR-335-5p, hsa-miR-148a-5p,
hsa-miR-98-3p, hsa-miR-127-3p, hsa-miR-450b-5p, hsa-miR-143-3p,
hsa-miR-146a-5p, hsa-miR-340-3p, hsa-miR-148a-3p,
hsa-miR-181b-2-3p, hsa-miR-335-3p, hsa-miR-30a-3p, hsa-miR-106b-3p,
hsa-miR-1468-5p, hsa-miR-219a-1-3p, hsa-miR-30e-3p,
hsa-miR-125a-5p, hsa-miR-424-5p |
| lncRNAa | LINC00987,
HICLINC36.3, LACAT143, THCAT393, THCAT531, KHCAT230, LINC00511.12,
HICLINC365.1, CAT74, AMAT158, LSCAT43, CAT58.2, PRCAT231, KCCAT685,
BRCAT407, BRCAT320, KCCAT44, DDX11-AS1.3, SNHG12.4, LACAT91,
OVAT85, THCAT614, CAT1620, KCCAT539, THCAT283.1, SNHG9, CAT1764.1,
OVAT60, ESAT58, KCCAT680.2, BRCAT104, KHCAT392, LINC00152.2,
CAT990, CAT2214, KPCAT17, CAT18.1, HICLINC36.2, CAT862.2, THCAT591,
CAT461, CAT1560.2, OVAT76, LSCAT160, STCAT14, GBAT5, THCAT220,
HICLINC36.1, HICLINC285, CAT1010, THCAT422.1, CAT43, CAT122,
BRCAT392, CAT2313, CAT277.2, THCAT546, CAT993, CAT1358.2,
CAT1424.3, KCCAT499, PRKCQ-AS1.3, CAT295.1, LSCAT277, TMCC1-AS1.1,
KCCAT52, LINC00621.3, SMAT11, LSCAT218, PRKCQ-AS1.2, CAT292,
CAT1405, CAT318 | CAT121.2, CAT313.1,
FOXD2-AS1.1, CAT1824, CAT1631, CAT1569.1, HNCAT240, CAT2189,
PRCAT188.3, CAT1950.1, CAT2155, KCCAT349, CAT1966.1, CAT541,
WAC-AS1, KCCAT448, MPAT11, CAT2031, CAT353.3, CAT1966.2,
HICLINC283.5, CAT1849, CAT439, CAT1319.2, CAT1140, CAT2062,
CAT1569.2 |
Function analysis
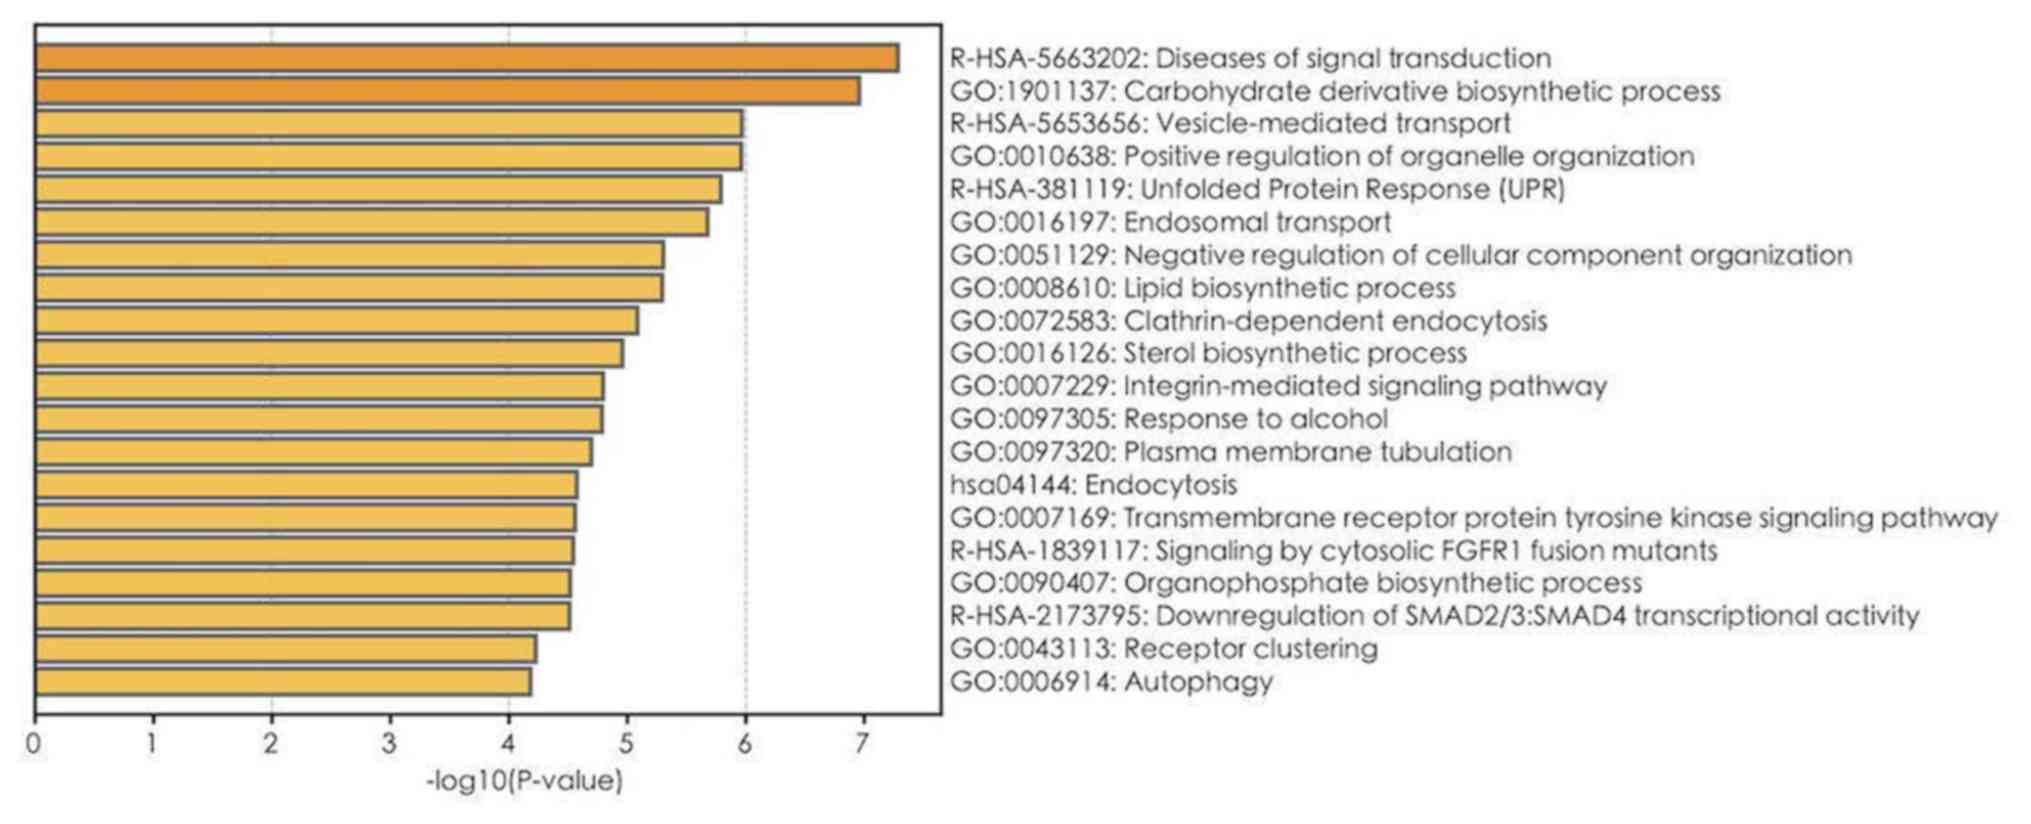
GO, Reactome and KEGG pathway enrichment analyses on
1,900 mRNAs with P<0.05 in the univariate Cox regression model
were performed (Table III). The
top 20 results of GO, Reactome and KEGG analyses are presented in
Fig. 4. A total of 112 GO terms were
enriched in biological mechanisms, including ‘SMAD protein complex
assembly’, ‘transmembrane receptor tyrosine kinase signaling
pathway’, ‘cell proliferation’, ‘apoptosis’, ‘autophagy’ and
‘protein processing’ (Fig. 4;
Table III). Pathway enrichment
analysis demonstrated that different genes are involved in multiple
signaling pathways, such as signaling by TGF-beta family members,
interleukin-2 family signaling, loss of function of SMAD4 in cancer
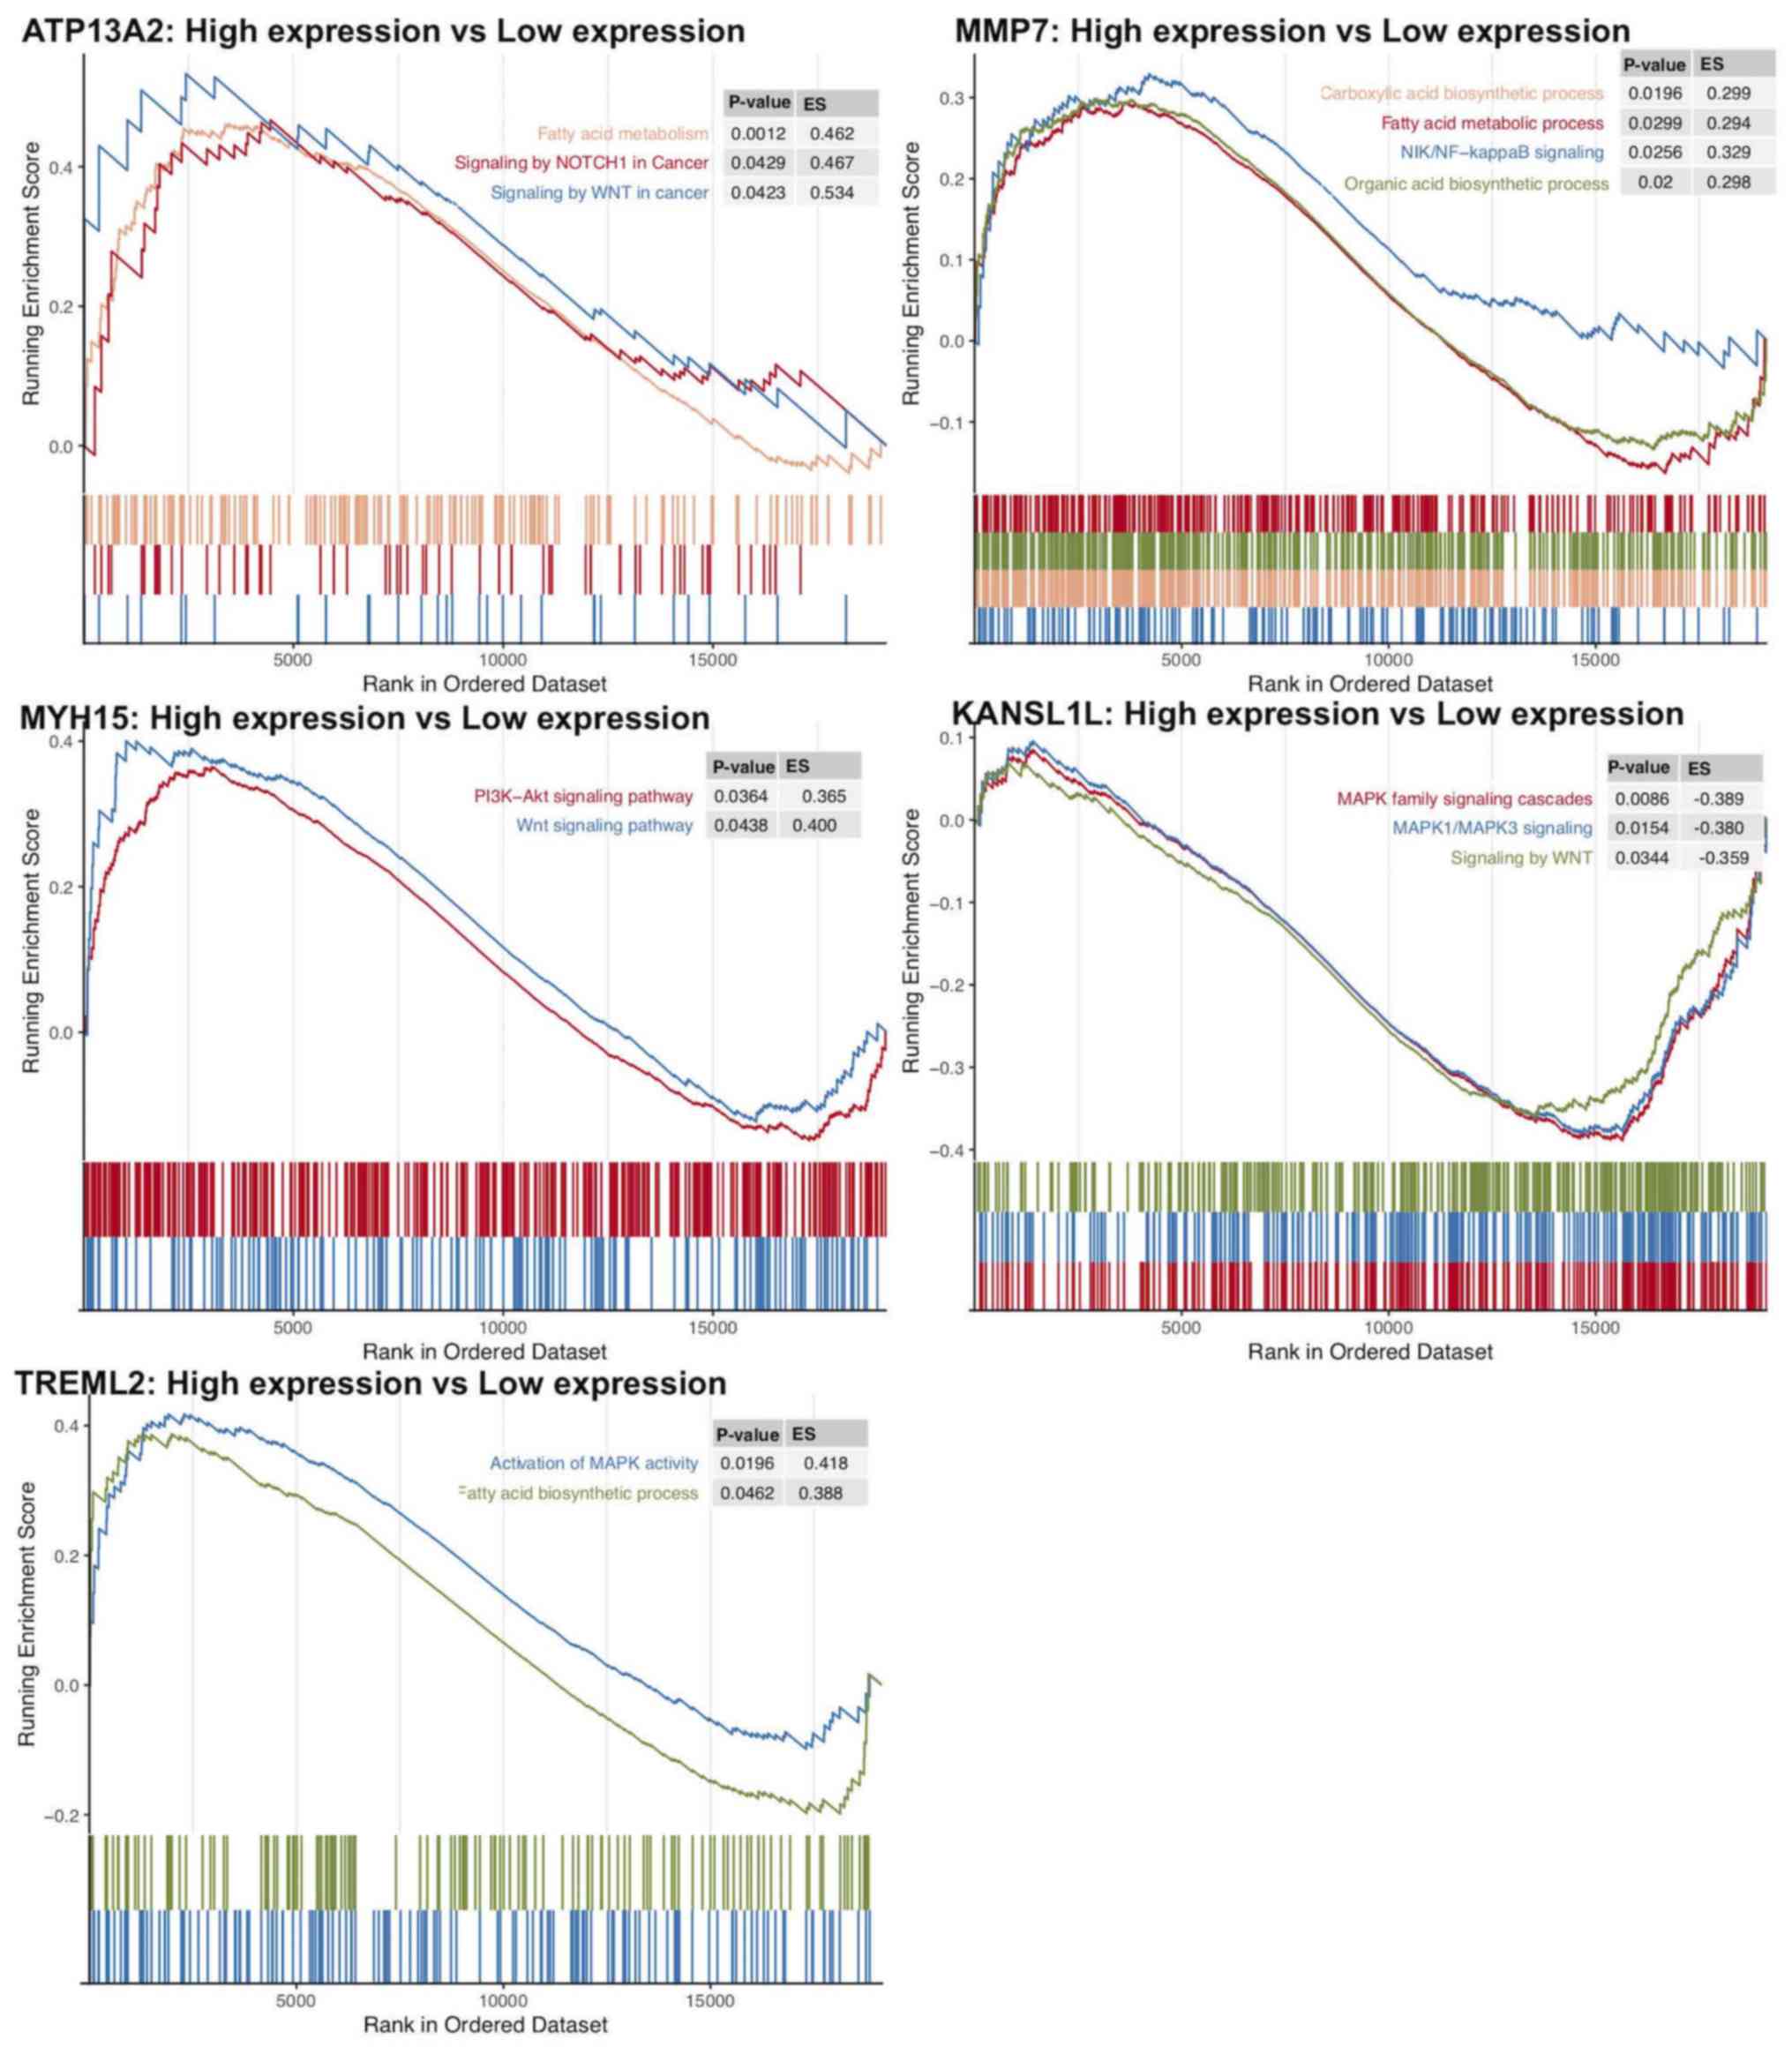
and signaling by cytosolic FGFR1 fusion mutants (Table III). Furthermore, using GSEA, gene
sets, such as signaling by Wnt in cancer, signaling by NOTCH1 in
cancer, and fatty acid metabolism were demonstrated to be enriched
in the ATP13A2 high expression group (Fig. 5). Oncogenic signaling pathways and
metabolism pathways were differentially enriched in MMP7
(NF-κB-inducing kinase/NF-κB and the fatty acid metabolic process),
TREML2 (the fatty acid metabolic process and MAPK signaling) and
MYH15 (phosphoinositide-3-kinase-protein kinase B/Akt, WNT
signaling) high expression phenotypes. Conversely, Wnt and
MAPK1/MAPK3 signaling pathways were differentially enriched in the
KANSL1L low expression phenotype.
| Table III.Significantly enriched pathways (GO,
KEGG and Reactome) of 1,900 mRNAs in univariate Cox regression
model. |
Table III.
Significantly enriched pathways (GO,
KEGG and Reactome) of 1,900 mRNAs in univariate Cox regression
model.
| Term | Pathway | P-value | Count | Gene symbol |
|---|
| R-HSA-5663202 | Diseases of signal
transduction | <0.001 | 62 | AREG, CREB1, CSK,
CTBP1, CUX1, GSK3A, HGF, LRP6, SMAD2, SMAD3, SMAD4, MAP3K11, PHB,
PIK3CA, PIK3R1, POLR2E, POLR2I, PPP2R5B, PSMA7, PSMB10, PSMC4,
PSMD2, PSMD3, PSMD8, RAC2, SEL1L, STAT5B, TGFA, TGFB1, TLN1, VAV1,
VCL, VCP, ZMYM2, FXR1, CUL1, IRS2, TRIM24, NEURL1, ZFYVE9, QKI,
PSMF1, NCOR2, GAB2, BCL2L11, AKAP9, CPSF6, CDC37, RASA3, NCBP2,
ERLEC1, TRAT1, HDAC7, MIB1, KIAA1549, MAPKAP1, HDAC11, KDM7A,
APH1B, NRG4, SPRED2, RICTOR |
| R-HSA-1839117 | Signaling by
cytosolic FGFR1 fusion mutants | <0.001 | 8 | CUX1, PIK3CA,
PIK3R1, STAT5B, ZMYM2, TRIM24, GAB2, CPSF6 |
| R-HSA-2173795 | Downregulation of
SMAD2/3: SMAD4 transcriptional activity | <0.001 | 9 | PARP1, SMAD2,
SMAD3, SMAD4, PPM1A, SKIL, TGIF1, NCOR2, SMURF2 |
| R-HSA-3304349 | Loss of function of
SMAD2/3 in cancer | <0.001 | 5 | SMAD2, SMAD3,
SMAD4, TGFB1, ZFYVE9 |
| R-HSA-9006934 | Signaling by
receptor tyrosine kinases | <0.001 | 59 | AREG, AP2M1,
COL2A1, COL3A1, COL4A2, COL6A3, CREB1, CSK, CTNNA1, DOCK1, DUSP7,
ELK1, PTK2B, FLT4, HGF, INSR, ITGB1, ITPR2, LAMA3, LAMB1, NCF4,
PDE3B, PIK3CA, PIK3R1, PLAT, POLR2E, POLR2I, PRKCD, PTPN1, PTPN6,
PTPRS, PXN, RALGDS, RPS6KA1, STAT5B, TGFA, THBS2, VAV1, SOCS1,
IRS2, NRP2, SOCS6, GAB2, SPINT2, CDC37, NCBP2, TAB2, NELFB, VRK3,
ATP6V1H, TLR9, ERBIN, MAPKAP1, APH1B, NRG4, ATP6V0E2, SPRED2,
ATP6V1C2, RICTOR |
| R-HSA-9006936 | Signaling by
TGF-beta family members | <0.001 | 20 | ACVR1B, PARP1,
SMAD2, SMAD3, SMAD4, SMAD5, PPM1A, PPP1CA, SKIL, TGFB1, TGIF1,
FOXH1, MTMR4, ZFYVE9, NCOR2, ZFYVE16, FSTL1, BAMBI, PARD3,
SMURF2 |
| R-HSA-3304351 | Signaling by
TGF-beta Receptor Complex in Cancer | <0.001 | 5 | SMAD2, SMAD3,
SMAD4, TGFB1, ZFYVE9 |
| R-HSA-170834 | Signaling by
TGF-beta Receptor Complex | <0.001 | 15 | PARP1, SMAD2,
SMAD3, SMAD4, PPM1A, PPP1CA, SKIL, TGFB1, TGIF1, MTMR4, ZFYVE9,
NCOR2, BAMBI, PARD3, SMURF2 |
| R-HSA-3304347 | Loss of function of
SMAD4 in cancer | <0.001 | 3 | SMAD2, SMAD3,
SMAD4 |
| R-HSA-3311021 | SMAD4 MH2 domain
mutants in cancer | <0.001 | 3 | SMAD2, SMAD3,
SMAD4 |
| R-HSA-3315487 | SMAD2/3 MH2 domain
mutants in cancer | <0.001 | 3 | SMAD2, SMAD3,
SMAD4 |
| R-HSA-3304356 | SMAD2/3
phosphorylation motif mutants in cancer | <0.001 | 4 | SMAD2, SMAD3,
TGFB1, ZFYVE9 |
| R-HSA-3656532 | TGFBR1 KD mutants
in cancer | <0.001 | 4 | SMAD2, SMAD3,
TGFB1, ZFYVE9 |
| R-HSA-2173788 | Downregulation of
TGF-beta receptor signaling | 0.001 | 8 | SMAD2, SMAD3,
PPP1CA, TGFB1, MTMR4, ZFYVE9, BAMBI, SMURF2 |
| R-HSA-3656534 | Loss of function of
TGFBR1 in cancer | 0.001 | 4 | SMAD2, SMAD3,
TGFB1, ZFYVE9 |
| R-HSA-451927 | Interleukin-2
family signaling | 0.002 | 10 | PTK2B, IL2RA,
IL3RA, IL15RA, PIK3CA, PIK3R1, PTPN6, SOS2, STAT5B, GAB2 |
| R-HSA-1839124 | FGFR1 mutant
receptor activation | 0.002 | 8 | CUX1, PIK3CA,
PIK3R1, STAT5B, ZMYM2, TRIM24, GAB2, CPSF6 |
| R-HSA-1655829 | Regulation of
cholesterol biosynthesis by SREBP (SREBF) | 0.003 | 11 | FDPS, LSS, MVD,
MVK, NFYA, NFYB, SREBF2, NCOA1, MBTPS1, SEC24A, MBTPS2 |
| R-HSA-8952158 | RUNX3 regulates
BCL2L11 (BIM) transcription | 0.004 | 3 | SMAD3, SMAD4,
BCL2L11 |
| R-HSA-381038 | XBP1(S) activates
chaperone genes | 0.005 | 10 | DDX11, GFPT1,
GSK3A, DNAJB9, PPP2R5B, DNAJC3, SSR1, TLN1, PDIA6, SEC31A |
| R-HSA-2173793 | Transcriptional
activity of SMAD2/SMAD3:SMAD4 heterotrimer | 0.006 | 9 | PARP1, SMAD2,
SMAD3, SMAD4, PPM1A, SKIL, TGIF1, NCOR2, SMURF2 |
| R-HSA-5655302 | Signaling by FGFR1
in disease | 0.008 | 8 | CUX1, PIK3CA,
PIK3R1, STAT5B, ZMYM2, TRIM24, GAB2, CPSF6 |
| R-HSA-1226099 | Signaling by FGFR
in disease | 0.009 | 11 | CUX1, PIK3CA,
PIK3R1, POLR2E, POLR2I, STAT5B, ZMYM2, TRIM24, GAB2, CPSF6,
NCBP2 |
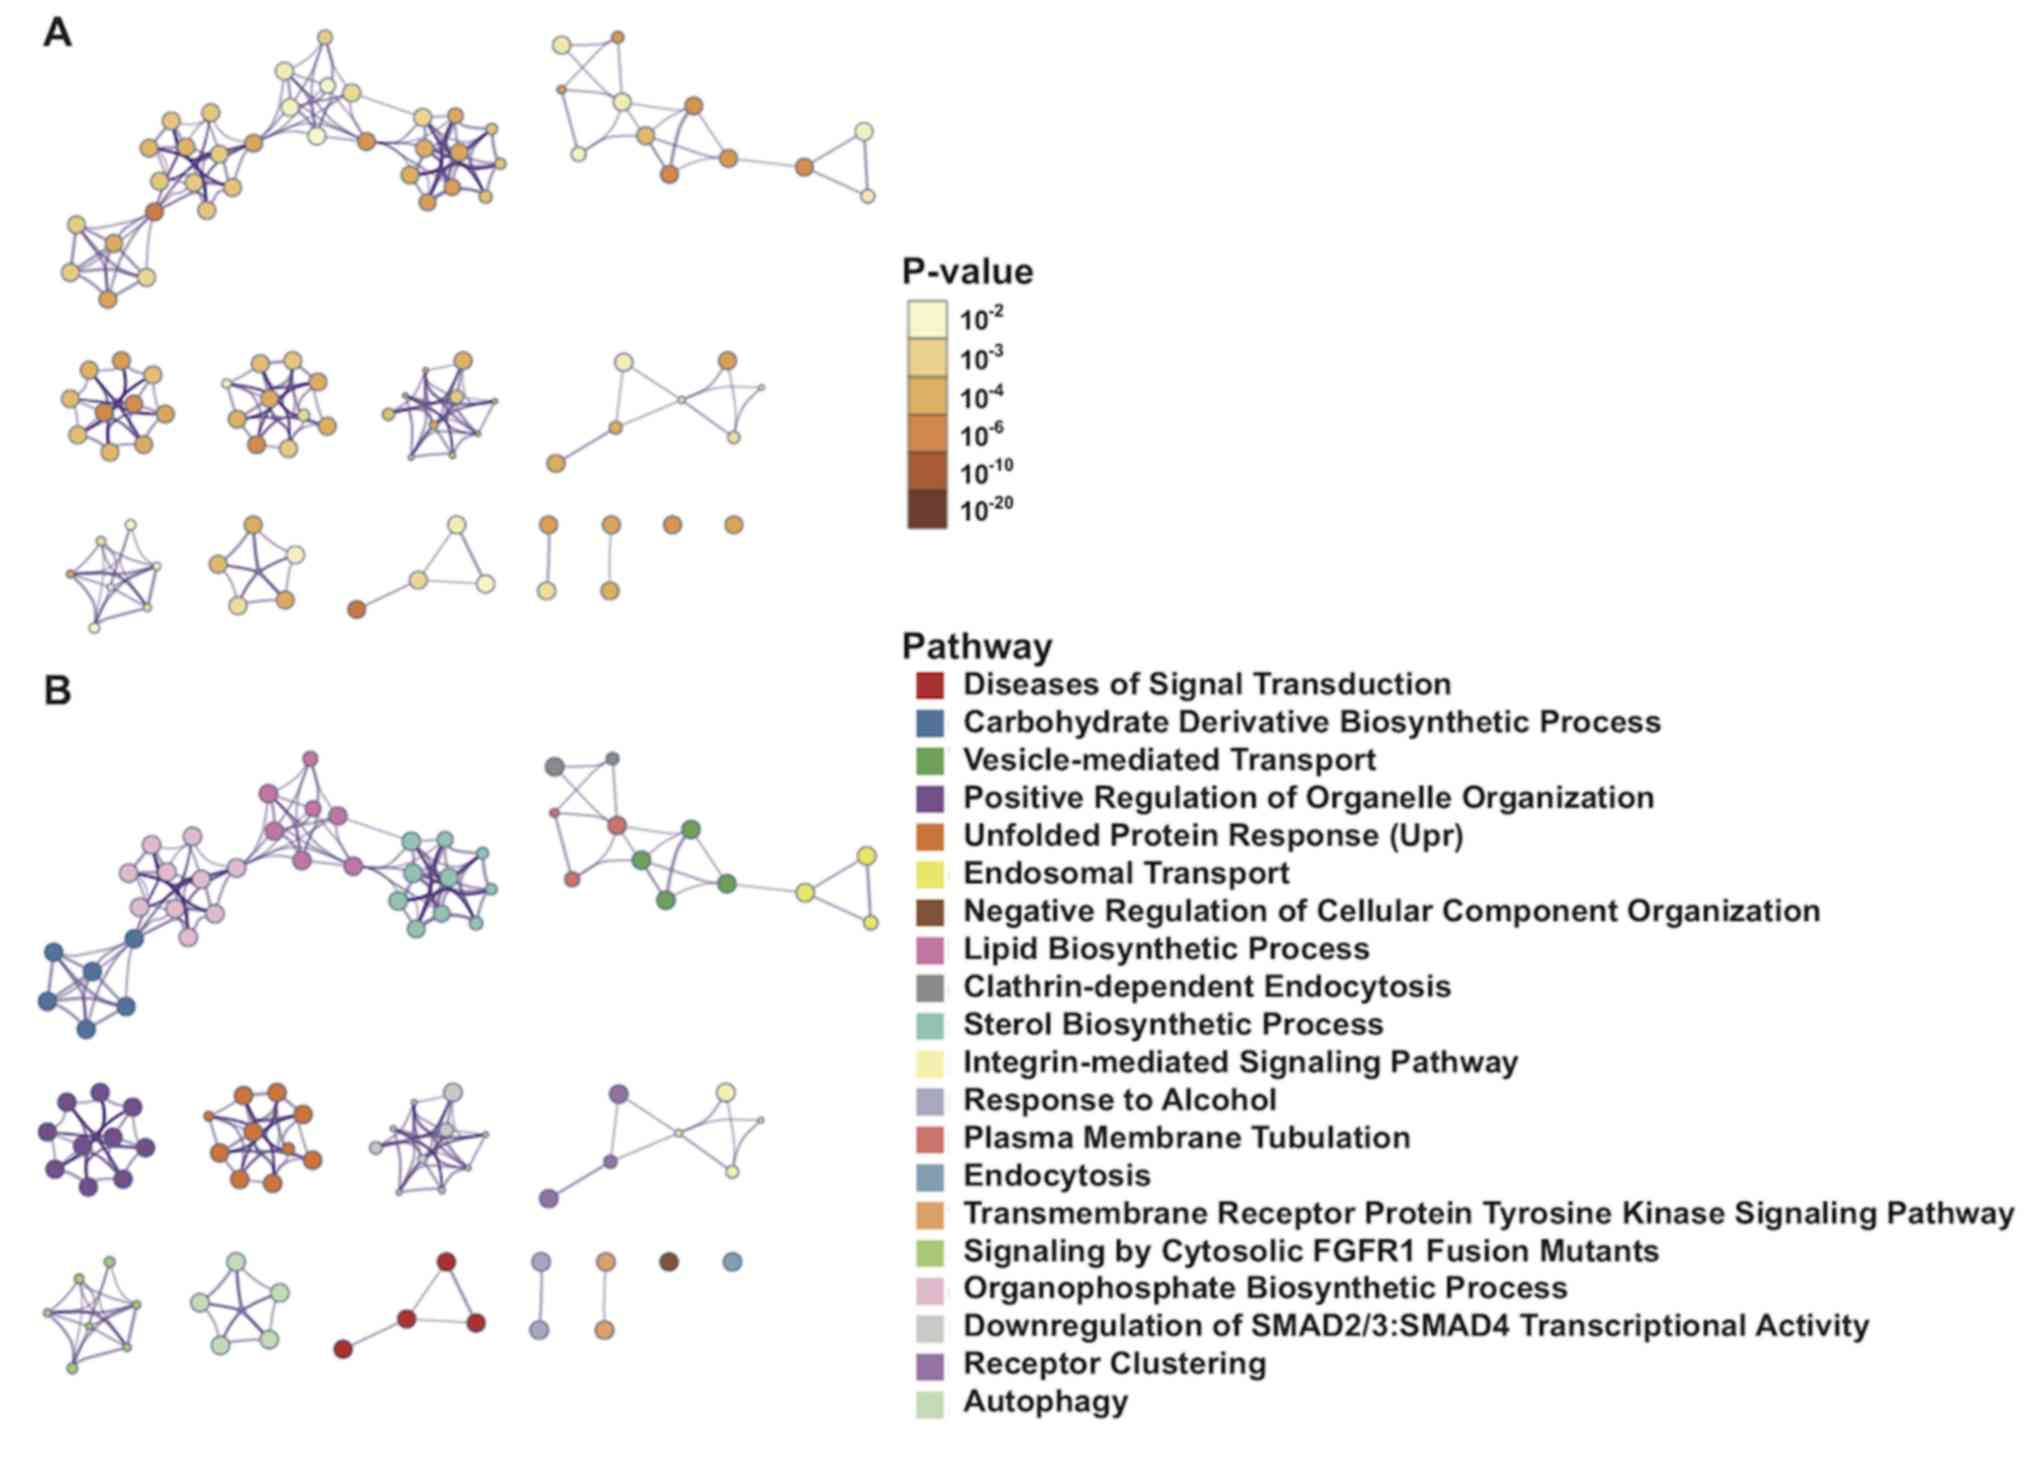
Protein interaction network
visualization and analysis
Metascape was used to visualize the PPIs of 1,900
mRNAs with significant differences in the univariate Cox regression
model. The interactions among enrichment pathways are presented in
Fig. 6. The metabolic pathways,
including ‘carbohydrate derivative biosynthetic processing’,
‘vesicle-mediated transport’ and ‘lipid biosynthetic processing’
were significantly associated and highly interactive.
Discussion
AML is a heterogeneous clonal disorder characterized
by immature myeloid cell proliferation and bone marrow failure.
Currently, 7 + 3 induction therapy is the standard treatment for
young adults and fit elderly patients (<60 years). Under the 7 +
3 regimen, 65–73% of patients with AML achieve complete remission
(CR). However, only 38–62% of patients with AML, >60 years
achieve CR (1–4). Elderly patients are unable to tolerate
the toxicity of high-dose chemotherapy drugs (1–4). The
5-year survival rate of patients with AML is ~30% (5,16).
Advancements in genetics and molecular research, as well as
improved understanding of AML biology, certain cytogenetic
abnormalities, and specific gene mutations and/or changes, have
been achieved (17). Furthermore,
novel targets that can considerably improve therapeutic efficacy in
some patients with specific molecular genetics have been developed
(1,2,4). The
presence or absence of specific gene mutations and/or changes in
gene expression, such as P53 or FLT3 gene mutations, can be used to
further classify AML cases and affect the prognosis of patients
with somatic mutations (18–22). Thus, the NCCN has added NPM1, FLT3,
CEBPA, IDH1/2, DNMT3A, KIT, TP53, RUNX1 and ASXL1 gene mutations to
the AML prognostic stratification system. However, ~50% of all
patients with AML exhibit normal karyotypes and lack specificity
(1,3,4). Novel
molecular biomarkers based on somatic mutations can improve the
risk stratification of patients with normal karyotypes (1). Research on novel biomarkers and
treatment methods, as well as improvement of current chemotherapy
methods, represent breakthroughs through which the quality of life
of patients with AML can be improved. The present study analyzed
the AML dataset from TCGA database through bioinformatics analysis.
Univariate Cox's regression analysis demonstrated that mRNAs,
miRNAs and lncRNAs gene mutations are significantly associated with
survival prognosis. Enrichment analysis of 1,900 mRNAs with
P<0.05 in the univariate Cox regression model was also
performed.
The TGF-β and SMAD signaling pathways are enriched,
and FGFR1 fusion gene mutations are significantly associated with
poor survival in patients with AML (23,24).
Previous studies have demonstrated that the TGF-β and SMAD
signaling pathways are dysregulated in leukemia (23,24). De
Visser and Kast (25) reported that
loss of TGF-β function is involved in the occurrence, progression
and metastasis of AML. Furthermore, Lin et al (26) demonstrated that missense and
frameshift mutations of SMAD4 disrupt gene function in the TGF-β
signaling pathway, and ultimately block the TGF-β signaling pathway
in AML. These studies suggest that the TGF-β and SMAD signaling
pathways may be closely associated with the occurrence, development
and poor prognosis of patients with AML (23–26).
TGF-β signaling plays an important role in the
extracellular microenvironment and several cellular processes,
including cell proliferation, differentiation, apoptosis and
migration (27). TGF-β is a potent
inhibitor of hematopoietic stem cell proliferation, which plays an
important role in the hematopoietic stem and progenitor cell
maintenance at rest, hyperproliferation inhibition, differentiation
induction and apoptosis promotion. TGF-β, TGF-β receptor (TGF-βR)
and SMAD proteins, and their target genes constitute a
tumor-suppressor pathway (27,28).
Thus, any component defect can lead to loss of the growth
inhibition function of TGF-β, thereby encouraging cell malignant
proliferation in several types of solid tumors (28). TGF-β/SMADs act as tumor suppressor
signals, whereby mutational inactivation or downregulation inhibits
TGF-β signaling in solid tumors, including colon, lung, breast,
pancreatic and gastric cancer (28).
TGF-β/SMAD signaling is a negative regulatory signal for HSC
proliferation in the blood system. In vitro experiments have
demonstrated that exogenous TGF-β can decrease the number of HSCs
that enter the cell cycle (27–29).
Furthermore, antibodies against TGF-β1 may allow HSCs to stay in
the S phase for a long period of time (29). Patients with AML lose their TGF-βR
function, which is considered to induce insensitivity to TGF-β
signaling and TGF-β-mediated growth inhibition (22). The combination treatment with TGF-β
and activated vitamin D3 may enhance therapeutic effects on
patients through the reduction of SMAD2/3 phosphorylation levels
and nuclear translocation (30).
The extracellular receptor binding domain of FGFR1
binds to its corresponding ligand and activates downstream signals,
such as PLC-γ, STAT5, STAT1, PI3K and RAS/MAP kinase (31,32).
Although FGFR1 plays an important role in controlling cell
proliferation, differentiation, migration and cell phenotype
transformation, to the best of our knowledge, the function of this
gene in HSCs is not yet fully understood (31). A novel protein composed of FGFR1
rearrangements activates the receptor tyrosine kinase (RTK)
activity of FGFR1 in a non-ligand-dependent manner, continues to
activate downstream signaling pathways and inhibits apoptosis
(32). Jackson et al
(33) reported that the ZNF198-FGFR1
fusion gene mutation retains the RTK domain of FGFR1 and causes the
proline-rich domain of ZNF198 to mediate the ligand-free
intracellular partial dimerization of FGFR1. Furthermore,
ZNF198-FGFR1 fusion gene mutation further promotes
autophosphorylation of tyrosine residues, thereby activating
multiple downstream signaling pathways, inhibiting apoptosis and
promoting proliferation. These effects result in tumorigenic
transformation. Thus, it is speculated that FGFR1 fusion gene
mutation may play a role in AML occurrence and development, and in
the poor prognosis of patients with this disease.
In the present study, GSEA demonstrated that high
expression levels of ATP13A2, MMP7, TREML2 and MYH15 were
associated with oncogenic signaling pathways and metabolism
pathways, including the NIK/NF-κB, PI3K-Akt, Wnt and MAPK signaling
pathways, and the fatty acid metabolic process. Yu et al
(34) reported that the Wnt
signaling pathway promotes tumor cell proliferation and metastasis
in chronic lymphocytic leukemia. Furthermore, Agarwal et al
(35) demonstrated that the
PI3K/AKT/IkB kinase signaling pathway is abnormally activated in
colorectal cancer, eventually leading to tumor growth.
High expression levels of the following markers:
MYH15, TREML2, ATP13A2, MMP7, hsa-let-7a-2-3p, hsa-miR-362-3p,
hsa-miR-500a-5p, hsa-miR-500b-5p, hsa-miR-362-5p, LINC00987,
LACAT143, THCAT393, THCAT531 and KHCAT230 are associated with poor
prognosis of patients with AML. Furthermore, the TGF-β and SMAD
signaling pathways, and FGFR1 fusion gene mutations may be closely
associated with AML occurrence, development and poor prognosis.
However, further investigation on the functions of these genes is
required to determine their molecular mechanism in the progression
of AML.
Acknowledgements
Not applicable.
Funding
No funding was received.
Availability of data and materials
The datasets generated and/or analyzed during the
current study are available in the cBioPortal database (https://www.cbioportal.org/study/summary?id=laml_tcga).
Authors' contributions
AL and ZJ conceived and designed the present study.
GL, YG, KL, AL and ZJ acquired, analyzed and interpreted the data.
KL performed the statistical analysis. GL, YG and KL drafted the
initial manuscript, in consultation with AL and ZJ. All authors
read and approved the final manuscript.
Ethics approval and consent to
participate
Not applicable.
Patient consent for publication
Not applicable.
Competing interests
The authors declare that they have no competing
interests.
References
|
1
|
Tallman MS, Wang ES, Altman JK, Appelbaum
FR, Bhatt VR, Bixby D, Coutre SE, De Lima M, Fathi AT, Fiorella M,
et al: Acute myeloid leukemia, version 3.2019, NCCN clinical
practice guidelines in oncology. J Natl Compr Canc Netw.
17:721–749. 2019. View Article : Google Scholar : PubMed/NCBI
|
|
2
|
National Cancer Institute, . SEER cancer
statistics review, 1975–2015: Overview, median age at diagnosis.
September
10–2018
|
|
3
|
Juliusson G: Older patients with acute
myeloid leukemia benefit from intensive chemotherapy: An update
from the Swedish acute leukemia registry. Clin Lymphoma Myeloma
Leuk. 11 (Suppl 1):S54–S59. 2011. View Article : Google Scholar : PubMed/NCBI
|
|
4
|
DiNardo C and Lachowiez C: Acute myeloid
leukemia: From mutation profiling to treatment decisions. Curr
Hematol Malig Rep. 14:386–394. 2019.PubMed/NCBI
|
|
5
|
Stuani L, Sabatier M and Sarry JE:
Exploiting metabolic vulnerabilities for personalized therapy in
acute myeloid leukemia. BMC Biol. 17:572019. View Article : Google Scholar : PubMed/NCBI
|
|
6
|
Pagana L, Pulsoni A, Tosti ME, Avvisati G,
Mele L, Mele M, Martino B, Visani G, Cerri R, Di Bona E, et al:
Clinical and biological features of acute myeloid leukaemia
occurring as second malignancy: GIMEMA archive of adult acute
leukaemia. Br J Haematol. 112:109–117. 2001. View Article : Google Scholar : PubMed/NCBI
|
|
7
|
Pulsoni A, Pagano L, Lo Coco F, Avvisati
G, Mele L, Di Bona E, Invernizzi R, Leoni F, Marmont F, Mele A, et
al: Clinicobiological features and outcome of acute promyelocytic
leukemia occurring as a second tumor: The GIMEMA experience. Blood.
100:1972–1976. 2002. View Article : Google Scholar : PubMed/NCBI
|
|
8
|
Tomczak K, Czerwińska P and Wiznerowicz M:
The cancer genome atlas (TCGA): An immeasurable source of
knowledge. Contemp Oncol (Pozn). 19:A68–A77. 2015.PubMed/NCBI
|
|
9
|
Gao J, Aksoy BA, Dogrusoz U, Dresdner G,
Gross B, Sumer SO, Sun Y, Jacobsen A, Sinha R, Larsson E, et al:
Integrative analysis of complex cancer genomics and clinical
profiles using the cBioPortal. Sci Signal. 6:pl12013. View Article : Google Scholar : PubMed/NCBI
|
|
10
|
Alboukadel K, Marcin K and Przemyslaw B:
Drawing Survival Curves using ‘ggplot2’. R package version 0.4.6.
September
9–2019
|
|
11
|
Chambers J: Programming with R. Software
for data analysis. Springer-Verlag. (New York, NY). 2008.
View Article : Google Scholar
|
|
12
|
Yu G, Wang LG, Han Y and He QY:
clusterProfiler: An R package for comparing biological themes among
gene clusters. OMICS. 16:284–287. 2012. View Article : Google Scholar : PubMed/NCBI
|
|
13
|
Zhou Y, Zhou B, Pache L, Chang M,
Khodabakhshi AH, Tanaseichuk O, Benner C and Chanda SK: Metascape
provides a biologist-oriented resource for the analysis of
systems-level datasets. Nat Commun. 10:15232019. View Article : Google Scholar : PubMed/NCBI
|
|
14
|
Wickham H: ggplot2. Wiley
Interdisciplinary Reviews: Computational Statistics. 3:180–185.
2011. View
Article : Google Scholar
|
|
15
|
Gu Z, Eils R and Schlesner M: Complex
heatmaps reveal patterns and correlations in multidimensional
genomic data. Bioinformatics. 32:2847–2849. 2016. View Article : Google Scholar : PubMed/NCBI
|
|
16
|
Ilyas AM, Ahmad S, Faheem M, Naseer MI,
Kumosani TA, Al-Qahtani MH, Gari M and Ahmed F: Next generation
sequencing of acute myeloid leukemia: Influencing prognosis. BMC
Genomics. 16 (Suppl 1):S52015. View Article : Google Scholar : PubMed/NCBI
|
|
17
|
Ding L, Ley TJ, Larson DE, Miller CA,
Koboldt DC, Welch JS, Ritchey JK, Young MA, Lamprecht T, McLellan
MD, et al: Clonal evolution in relapsed acute myeloid leukaemia
revealed by whole-genome sequencing. Nature. 481:506–510. 2012.
View Article : Google Scholar : PubMed/NCBI
|
|
18
|
Martelli MP, Sportoletti P, Tiacci E,
Martelli MF and Falini B: Mutational landscape of AML with normal
cytogenetics: Biological and clinical implications. Blood Rev.
27:13–22. 2013. View Article : Google Scholar : PubMed/NCBI
|
|
19
|
Tomasson MH, Xiang Z, Walgren R, Zhao Y,
Kasai Y, Miner T, Ries RE, Lubman O, Fremont DH, McLellan MD, et
al: Somatic mutations and germline sequence variants in the
expressed tyrosine kinase genes of patients with de novo acute
myeloid leukemia. Blood. 111:4797–4808. 2008. View Article : Google Scholar : PubMed/NCBI
|
|
20
|
Lindsley RC, Mar BG, Mazzola E, Grauman
PV, Shareef S, Allen SL, Pigneux A, Wetzler M, Stuart RK, Erba HP,
et al: Acute myeloid leukemia ontogeny is defined by distinct
somatic mutations. Blood. 125:1367–1376. 2015. View Article : Google Scholar : PubMed/NCBI
|
|
21
|
Cancer Genome Atlas Research Network, .
Ley TJ, Miller C, Ding L, Raphael BJ, Mungall AJ, Robertson A,
Hoadley K, Triche TJ Jr, Laird PW, et al: Genomic and epigenomic
landscapes of adult de novo acute myeloid leukemia. N Engl J Med.
368:2059–2074. 2013. View Article : Google Scholar : PubMed/NCBI
|
|
22
|
Marcucci G, Haferlach T and Döhner H:
Molecular genetics of adult acute myeloid leukemia: Prognostic and
therapeutic implications. J Clin Oncol. 29:475–486. 2011.
View Article : Google Scholar : PubMed/NCBI
|
|
23
|
Wu H, Li P, Shao N, Ma J, Ji M, Sun X, Ma
D and Ji C: Aberrant expression of Treg-associated cytokine IL-35
along with IL-10 and TGF-β in acute myeloid leukemia. Oncol Lett.
3:1119–1123. 2012. View Article : Google Scholar : PubMed/NCBI
|
|
24
|
Chen J, Mu Q, Li X, Yin X, Yu M, Jin J, Li
C, Zhou Y, Zhou J, Suo S, et al: Homoharringtonine targets Smad3
and TGF-β pathway to inhibit the proliferation of acute myeloid
leukemia cells. Oncotarget. 8:40318–40326. 2017. View Article : Google Scholar : PubMed/NCBI
|
|
25
|
De Visser KE and Kast WM: Effects of
TGF-beta on the immune system: Implications for cancer
immunotherapy. Leukemia. 13:1188–1199. 1999. View Article : Google Scholar : PubMed/NCBI
|
|
26
|
Lin HK, Bergmann S and Pandolfi PP:
Deregulated TGF-beta signaling in leukemogenesis. Oncogene.
24:5693–5700. 2005. View Article : Google Scholar : PubMed/NCBI
|
|
27
|
Massagué J: TGFβ signalling in context.
Nat Rev Mol Cell Biol. 13:616–630. 2012. View Article : Google Scholar : PubMed/NCBI
|
|
28
|
Massagué J: TGFbeta in cancer. Cell.
134:215–230. 2008. View Article : Google Scholar : PubMed/NCBI
|
|
29
|
Ruscetti FW, Akel S and Bartelmez SH:
Autocrine transforming growth factor-beta regulation of
hematopoiesis: Many outcomes that depend on the context. Oncogene.
24:5751–5763. 2005. View Article : Google Scholar : PubMed/NCBI
|
|
30
|
Matsunawa M, Ishii Y, Kasukabe T, Tomoyasu
S, Ota H and Honma Y: Cotylenin A-induced differentiation is
independent of the transforming growth factor-beta signaling system
in human myeloid leukemia HL-60 cells. Leuk Lymphoma. 47:733–740.
2006. View Article : Google Scholar : PubMed/NCBI
|
|
31
|
Macdonald D, Reiter A and Cross NC: The
8p11 myeloproliferative syndrome: A distinct clinical entity caused
by constitutive activation of FGFR1. Acta Haematol. 107:101–107.
2002. View Article : Google Scholar : PubMed/NCBI
|
|
32
|
Ren M, Li X and Cowell JK: Genetic
fingerprinting of the development and progression of T-cell
lymphoma in a murine model of atypical myeloproliferative disorder
initiated by the ZNF198-fibroblast growth factor receptor-1
chimeric tyrosine kinase. Blood. 114:1576–8154. 2009. View Article : Google Scholar : PubMed/NCBI
|
|
33
|
Jackson CC, Medeiros LJ and Miranda RN:
8p11 myeloproliferative syndrome: A review. Hum Pathol. 41:461–476.
2010. View Article : Google Scholar : PubMed/NCBI
|
|
34
|
Yu J, Chen L, Cui B, Widhopf GF II, Shen
Z, Wu R, Zhang L, Zhang S, Briggs SP and Kipps TJ: Wnt5a induces
ROR1/ROR2 heterooligomerization to enhance leukemia chemotaxis and
proliferation. J Clin Invest. 126:585–598. 2016. View Article : Google Scholar : PubMed/NCBI
|
|
35
|
Agarwal A, Das K, Lerner N, Sathe S, Cicek
M, Casey G and Sizemore N: The AKT/IκB kinase pathway promotes
angiogenic/metastatic gene expression in colorectal cancer by
activating nuclear factor-κB and β-catenin. Oncogene. 24:1021–1031.
2005. View Article : Google Scholar : PubMed/NCBIPubMed/NCBIPubMed/NCBIPubMed/NCBIPubMed/NCBIPubMed/NCBIPubMed/NCBIPubMed/NCBIPubMed/NCBIPubMed/NCBIPubMed/NCBIPubMed/NCBIPubMed/NCBIPubMed/NCBIPubMed/NCBIPubMed/NCBIPubMed/NCBIPubMed/NCBIPubMed/NCBIPubMed/NCBIPubMed/NCBIPubMed/NCBIPubMed/NCBIPubMed/NCBIPubMed/NCBIPubMed/NCBI
|