Introduction
Liver cancer is currently the sixth most common
cancer and the third leading cause of cancer-associated death
worldwide in 2013 (1,2). The number of liver cancer-associated
deaths increased from ~510,100 in 1993 to 818,000 in 2013 globally
(3,4). At present, surgery, liver
transplantation, radiofrequency ablation, interventional therapy,
gene therapy and immunotherapy are available for treatment of liver
cancer (5). Of these options,
surgical treatment, including partial liver tissue resection and
liver transplantation, is currently the best treatment option for
liver cancer with a 5-year overall survival rate of >70% for
early-stage liver cancer (6–8) and 25–39% for liver cancer of all stages
worldwide (9). However, surgical
resection is feasible in only 10–37% of liver cancer cases as
patients with liver cancer are typically diagnosed at an advanced
stage worldwide (10). Moreover, the
long-term overall survival rate following surgery remains
unsatisfactory due to the high recurrence and metastasis rates
(50-60%) (9,11). Therefore, diagnosis of liver cancer
during an early stage, and the ability to predict the prognosis,
recurrence and metastasis of liver cancer following treatment is
important for improving the survival of patients.
In contrast to traditional clinicopathological
indicators, biomarkers are more advantageous for identifying
patients with a higher risk of recurrence or metastasis (12). Although several biomarkers, such as
glypican-3 (13), CpG island
methylator phenotype (14),
neutrophil-lymphocyte ratio (10),
platelet-lymphocyte ratio (15) have
been reported to be prognostic markers for liver cancer recurrence
or progression after treatment, their clinical application remains
unsatisfactory because of their limited prognostic value,
especially in patients with advanced stage disease (10,12–15).
Therefore, identifying novel prognostic biomarkers for liver cancer
is important and maybe beneficial in adjuvant therapy and improving
patient survival.
Caprin-1 is a ubiquitously expressed, highly
conserved cytoplasmic phosphoprotein in vertebrates and is
associated with cell proliferation in all tissues except the brain
(16). Caprin-1 expression is
decreased when cells stop proliferating and begin differentiation
and is increased when cells proliferate again (17). A lack of caprin-1 in cells can lead
to a delay in the progression from G1 phase to the S
phase of the cell cycle (17). The
carboxy-terminal arginine/glycine (RGG)-rich region of caprin-1 can
selectively bind the mRNA encoding c-Myc and cyclin D2, which are
involved in the regulation of cell proliferation (18) and can also directly bind to
RasGTPase-activating protein-binding protein 1 to promote mammalian
stress particle formation (19). In
addition, overexpression of caprin-1 can lead to overall inhibition
of stress granule formation in cells (19). Caprin-1 and helicase colocalize in
the leading edge of migrating fibroblasts to promote cell migration
and spreading (20). Several studies
have reported that caprin-1 overexpression is associated with the
occurrence and development of tumors, such as osteosarcoma, breast
cancer and colon cancer (21–23).
The present study aimed to investigate the role of
caprin-1 in liver cancer and its association with the
clinicopathological features and prognosis in patients with liver
cancer, as well as the underlying mechanism of caprin-1 function in
liver cancer.
Materials and methods
Patients and tissue samples
A tissue microarray (TMA; n=70), including 40 liver
cancer samples (One liver cancer sample was excluded as the IHC
results revealed it was an interstitial tissue), 10 specimens of
paired adjacent normal liver tissue, the distance of which to the
tumor tissue was ~4 cm, and 20 specimens of normal liver tissue,
together with detailed clinical information were purchased from
Xi'an Alenabio Co., Ltd. (cat. no. BC03116a;) and used for
immunohistochemical analysis. The liver histology and morphology of
patients was observed using hematoxylin and eosin staining
performed by Pathology department of Guangzhou Red Cross Hospital
(Guangzhou, China). The inclusion criteria were patients
pathologically diagnosed with liver cancer. The exclusion criteria
included patients who had received chemotherapy or radiation
therapy before surgery. The clinical information of 134 patients
with liver cancer was also collected from The Cancer Genome Atlas
(TCGA) database downloaded from Cbioprotal (cbioportal.org/) to investigate the mRNA expression
levels of caprin-1 and to perform survival analysis. The clinical
stages of these patients were divided according to American Joint
Committee on Cancer staging manual (24).
Immunohistochemistry (IHC)
Specimens were fixed in 10% formalin at room
temperature for 48 h and subsequently embedded in paraffin. The
paraffin-embedded tissues were cut into 4-µm sections, then
deparaffinized with xylene and rehydrated using aDAKO
EnVisionsystem (Dako; Agilent Technologies, Inc.). IHC staining was
carried out using the UltraSensitive™ SP (mouse/rabbit) IHC kit
(catalog no. KIT-0305; MX Biotechnologies) which included
endogenous peroxidase blocking solution, serum, secondary antibody,
streptavidin-peroxidase and DAB substrate-chromogen. The tissue
slice was added with 50 µl peroxidase blocking solution to block
the activity of endogenous peroxidase, and incubated at room
temperature for 15 min. Rinsed with PBS 3 times with 3 min each
time. Blocking was performed with goat serum UltraSensitive™ SP
(mouse/rabbit) IHC kit for 30 min at room temperature. Then the
slides were incubated with Caprin-1 rabbit polyclonal antibody
(1:100 dilution; ab38859; Abcam) overnight at 4°C. After washing
with PBS, the slides were incubated with 50 µl streptomyces
antibiotin-peroxidase solution for 15 min at room temperature and
then soaked in the 100 µl diaminobenzidine for 2 min at room
temperature. One slide not incubated with caprin-1 antibody was
used as a negative control. The intensity of immunostaining was
scored independently by two experienced pathologists, who were
blinded to the patient's clinical pathology data and clinical
outcomes. The scores were determined and compared by the same
pathologist. Under the light microscope, the numbers of positively
stained cells in five representative regions at ×400 magnification
were counted and the mean percentage of positive cells was
calculated. Cytoplasmic staining was considered as a positive
signal according to the manufacturer's protocol. The staining
intensity was stratified and scored according to the following
criteria: No staining, 0 points; mild staining, 1 point; medium
staining, 2 points; and strong staining, 3 points. Scores for the
percentage of immunostaining tumor cells were defined as follows:
<5%, 0 Points; 6–25%, 1 point; 26–50%, 2 points; 51–75%, 3
points; and >75%, 4 points. The final immune response score
(IRS) for each case was calculated by multiplying the two scores
for the immunostaining intensity and the percentage of
immunostaining. The expression of caprin-1 was divided into two
groups: Low expression level (<mean expression levels of
caprin-1), and high expression level (>mean expression levels of
caprin-1).
Cells and plasmid
Human HepG2 liver cancer cell line (Guangzhou
Hunyuanyuan Medical Technology Co., Ltd.) was cultured in
Dulbecco's Modified Eagle's Medium (DMEM; Hyclone; GE Healthcare
Life Science) with 10% fetal bovine serum (FBS; Hyclone; GE
Healthcare Life Science). The caprin-1 knockout (KO) plasmids
PXC9-puro-KO-1 and PXC9-puro-KO-2 was constructed by inserting cDNA
of siRNA targeting caprin-1 5′-CACCGCGACAAGAAACTTCGGAACCGTTT-3′
(KO-1) or 5′-CACCGGTCCGGACCGCCACCGCCGTGTTT-3′ (KO-2) into the
BsmBI site of PXC9-puro (cat. no. 52961; Addgene, Inc.). The
recombinant plasmids were confirmed by sequencing (Synbio
Technologies LLC). The knockdown effect of the plasmids was
detected using western blot analysis and PXC9-puro-KO-2 was
selected for further experiments. The plasmid PXC9-puro-NC sequence
was 5′-GTAGGCGCGCCGCTCTCTAC-3′ and was a non-targeting control
guide used as a negative control.
Transfection using ultrasound
treatment
HepG2 cells were seeded in 24-well plates at
1×10⁴ cells/well and cultured in medium containing 10%
FBS until the cell confluence reached 60–70%. Transfection of the
recombinant plasmids was performed using ultrasonic irradiation
treatment. Cells were incubated with a mixture of 5% sulfur
hexafluoride microbubbles (Bracco Suisse SA, Switzerland) dissolved
in 0.9% NaCl with 2 µg plasmid in 300 µl serum-free DMEM and
irradiated with ultrasound [2.0 MHz, 0.37 (mechanical parameter)]
for 20 sec. At 24 h post transfection, the cells were cultured with
complete medium containing 10% FBS for an additional 48 h.
Reverse transcription-quantitative PCR
(RT-qPCR)
Total RNA was extracted from HepG2 cells transfected
with PXC9-puro-NC or PXC9-puro-KO using an RNA Extraction kit
(BioTeke Corporation) according to the manufacturer's protocol. RNA
was reverse transcribed into cDNA using a Reverse Transcriptase
M-MLV kit (FSQ-101; Toyobo Life Science) with the volume of 20 µl
containing 1 µl M-MLV, 1 µl oligonucleotide T, 2 µg RNA template
and 4 µl 5× RT buffer at 37°C for 15 min and then 95°C for 5 min.
RT-qPCR was performed using a SYBR-Green PCR mix (Toyobo Life
Science) and specific primers. The sequences of the primers were as
follows: Cyclin D1 forward, 5′-CAATGACCCCGCACGATTTC-3′ and reverse,
5′-GGCAGTCCGGGTCACACT-3′; cyclin D2 forward,
5′-GGGAAGTTGAAGTGGAACCTG-3′ and reverse,
5′-GATCATCGACGGTGGGTACAT-3′; β-actin forward,
5′-TGGCACCAGCACAATGAA-3′ and reverse,
5′-CTAAGTCATAGTCCGCCTAGAAGCA-3′. The qPCR were performed in
triplicate as follows: 94°C for 2 min; and 40 cycles of 94°C for 15
sec, 60°C for 20 sec, and 72°C for 20 sec. The data were analyzed
using the 2−ΔΔCq method (25).
Western blot analysis
Cells transfected with PXC9-puro-NC or PXC9-puro-KO
were collected and lysed using RIPA lysis buffer with 100 mM
phenylmethylsulfonyl fluoride (both Beyotime Institute of
Biotechnology). Protein samples (30 µg per lane) were separated
using 10% SDS-PAGE and subsequently transferred onto a
polyvinylidene difluoride membrane. The membrane was blocked with
5% skimmed milk in phosphate-buffered saline (PBS) and then
incubated with caprin-1 rabbit polyclonal antibody (1:1,000; cat.
no. ab38859; Abcam) and GAPDH rabbit polyclonal antibody (1:1,000;
cat. no. 10494-1-AP; ProteinTech Group, Inc.) overnight at 4°C.
After washing three times with TBS-Tween-20, the membrane was
incubated with horseradish peroxidase-labeled goat anti rabbit
secondary antibody (1:5,000; cat. no. BA1054; Wuhan Boster
Biological Technology, Ltd.) for 1 h at room temperature. After
washing three times with TBS-Tween-20, the membrane was incubated
with Tanon™ High-sig ECL western blotting substrate (cat. no.
180-5001) and the signal was measured using CCD (both Tanan Science
and Technology Co., Ltd.). The protein bands were quantified with
Image-Pro Plus version 6 software (Media Cybernetics).
Cell proliferation assay
HepG2 cells transfected with PXC9-puro-NC or
PXC9-puro-KO were seeded in triplicate in 96-well plates at
2×10³ cells/well. When cells attached to the wall, the
absorbance at 450 nm was determined by an enzyme marker (Thermo
Fisher Scientific, Inc.) after cell cultured for 0, 24, 48, or 72
h. Cell proliferation was determined using a Cell Counting Kit-8
(Beyotime Institute of Biotechnology) according to the
manufacturer's protocol at the indicated time points. The optical
density at 450 nm was measured using a multimode microplate reader
(Multiskan GO, Thermo Fisher Scientific, Inc.).
Flow cytometry
Cells transfected with PXC9-puro-NC or PXC9-puro-KO
were collected and washed twice with pre-cooled PBS. Subsequently
the cells were resuspended in pre-cooled 70% ethanol and fixed
overnight 4°C. After two washes with PBS, cells were stained with 5
µg/ml propidium iodide (dissolved in PBS with 100 µg/ml RNaseA and
0.2% Triton X-100) for 30 min at 4°C in darkness. After two washes
with PBS, the cells were subjected to flow cytometric analysis
using standard procedures. The results were analyzed using the cell
cycle fitting software FlowJoLLC version 10 (BD Biosciences).
Cell migration assay
HepG2 cells transfected with PXC9-puro-NC or
PXC9-puro-KO were seeded at 5×10⁴ cells/well and
cultured in triplicate in 200 µl serum-free DMEM in the upper
chambers of 24-well Transwell chambers (8-µm pores; Corning Inc.).
The lower chambers contained 800 µl DMEM containing 20% FBS. After
48 h, the HepG2 cells that had not migrated and remained on the
surface membrane of the upper chambers were removed using a cotton
swab, and the cells that had migrated to the bottom surface of the
upper chambers were fixed with 4% paraformaldehyde at room
temperature for 15 min and stained with 0.05% crystal violet for 15
min at room temperature. Images were captured under a light
microscope (MSHOT ML 31, Guangzhou, China) at ×400 magnification.
The number of cells that had migrated in 3–5 random fields were
counted in a blinded manner.
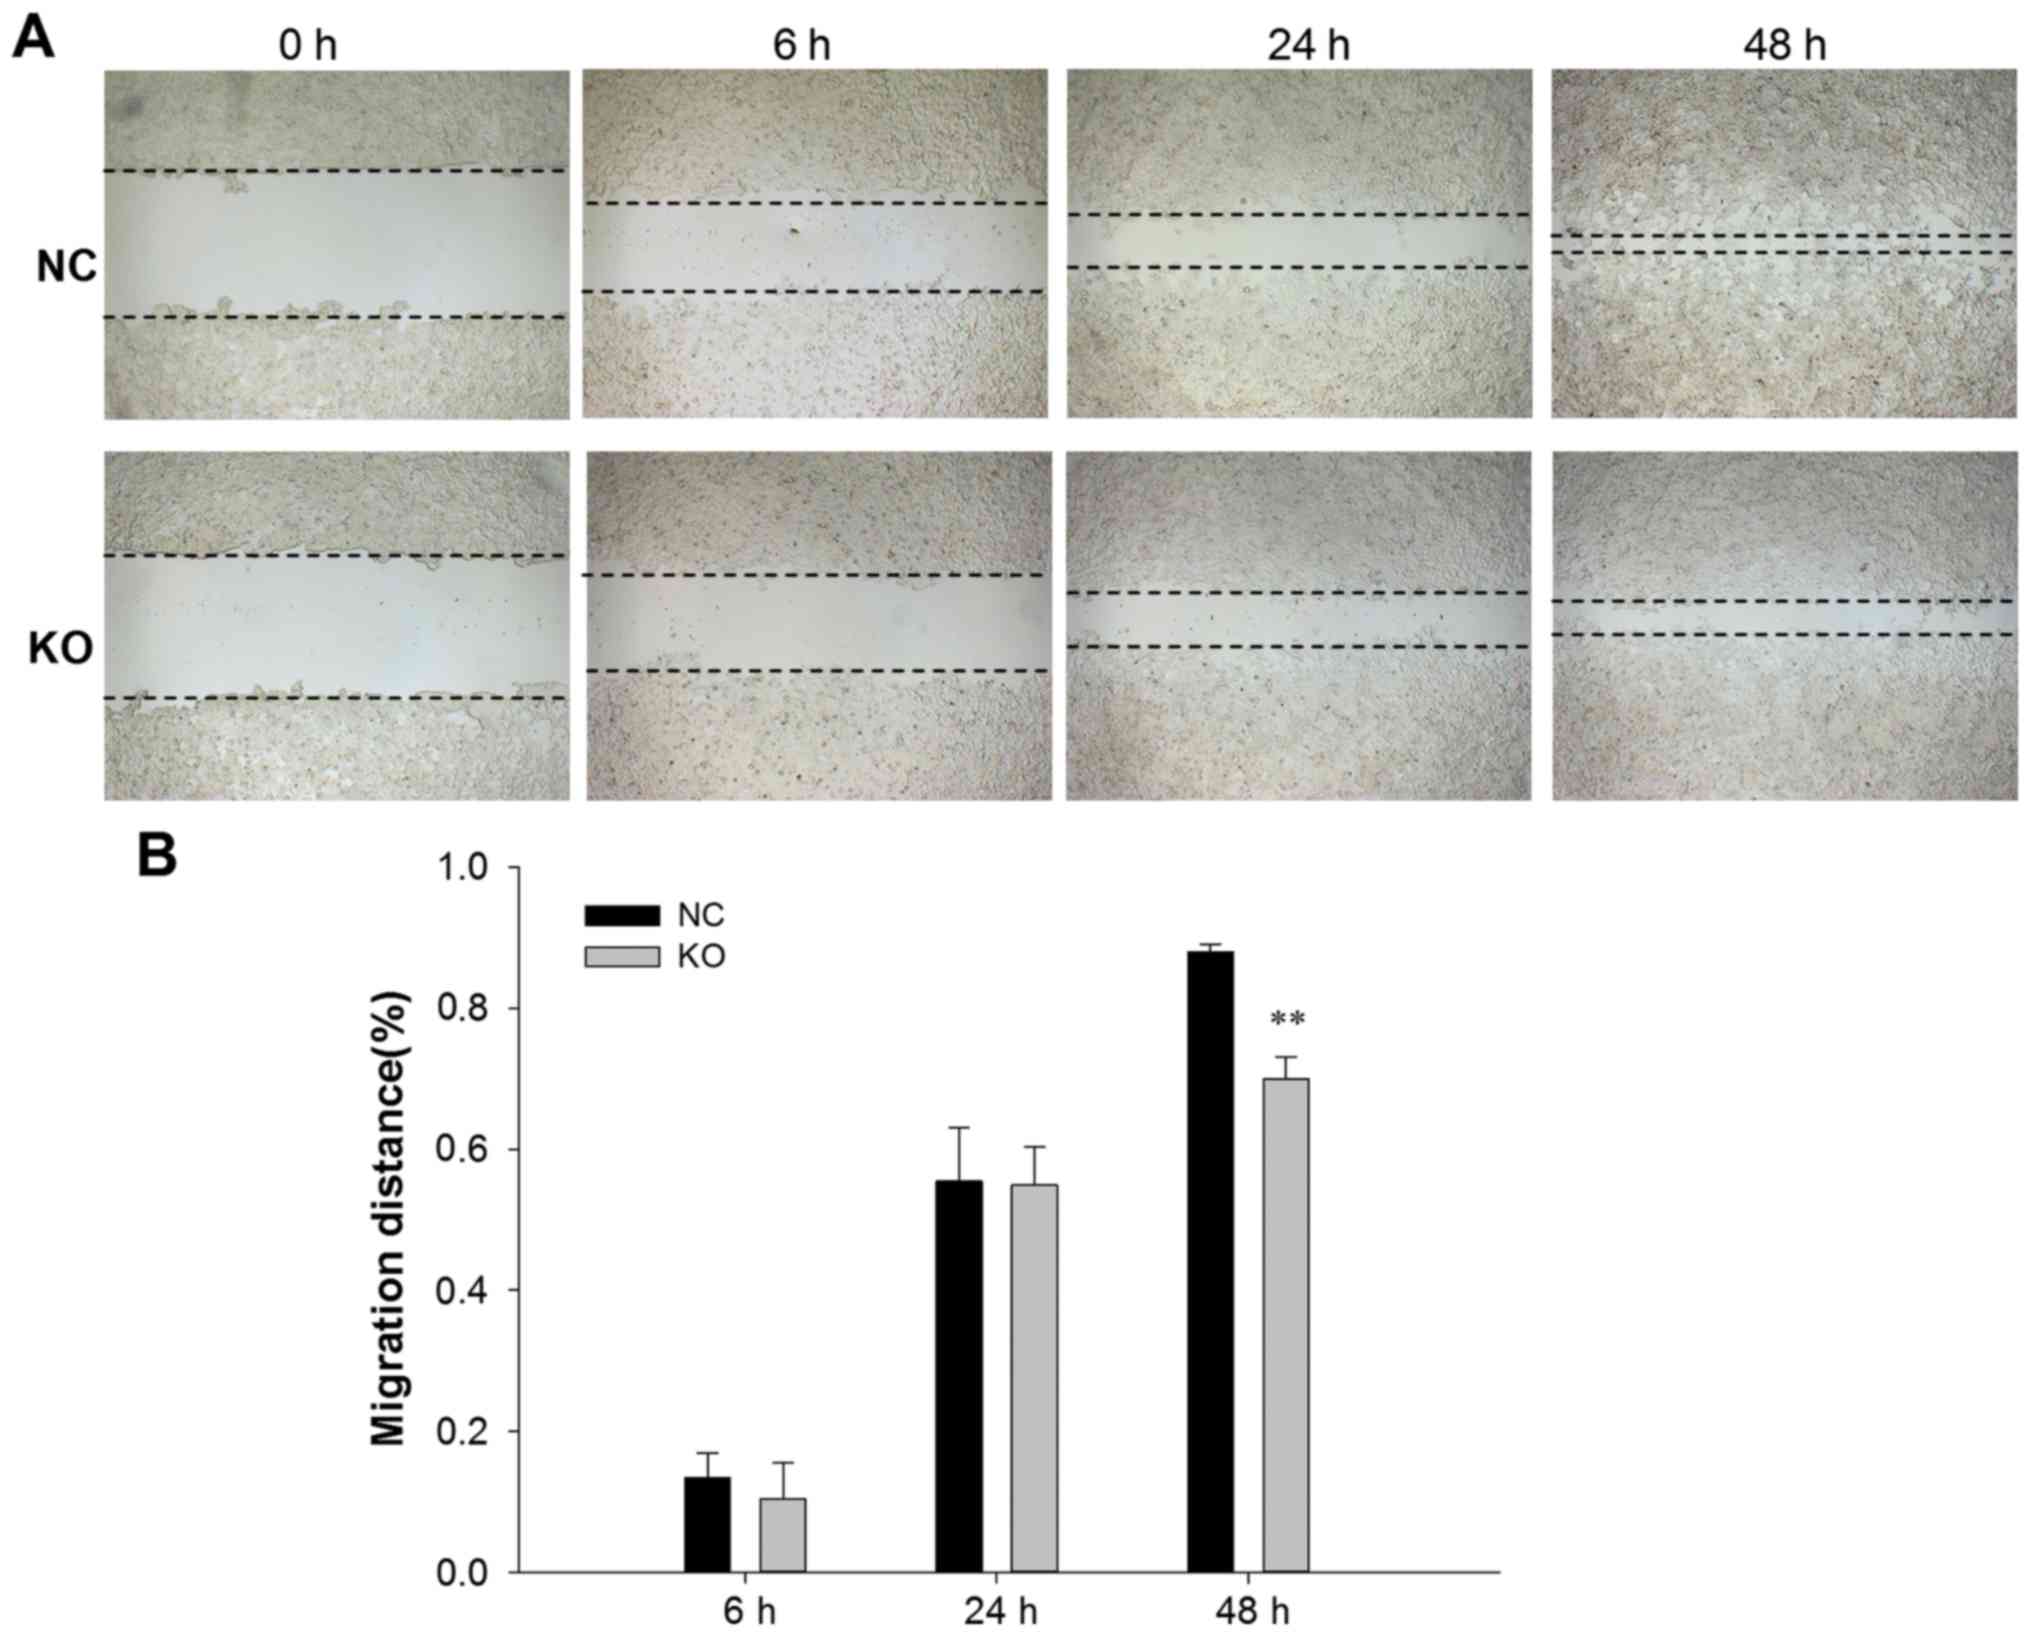
Wound healing assay
Cells transfected with PXC9-puro-NC or PXC9-puro-KO
were seeded in 24-well plates at 5×10⁴ cells/well and
cultured until the cells reached 100% confluency. Subsequently the
monolayer of cells was wounded using a micropipette tip with a
similar width in two groups. The plate was rinsed three times with
PBS to wash away the cell debris produced by the scratching. The
cells were cultured continuously with DMEM containing 2% FBS for
serum starvation and 4 µg/ml mitomycin (to inhibit cell division to
remove the effect of cell proliferation) and images were captured
at 0, 6, 24 and 48 h after scratching. Migration distance was
calculated by dividing the scratch area by the width of scratch,
which analyzed by with Image-Pro Plus version 6 software (Media
Cybernetics).
Statistical analysis
Statistical analysis was performed using SPSS
version 22.0 software (IBM Corp.). The differences between the two
groups were compared using Student's t-tests. The differences among
three groups were compared by one-way ANOVA with LSD post-hoc test.
The results are expressed as mean ± standard deviation. All
experiments were repeated three times. Pearson's χ2 test
and a Fisher's exact test were used to analyze the association
between caprin-1 protein expression levels and clinicopathological
features in the liver cancer cases. Overall survival was analyzed
using the Kaplan-Meier test and differences were assessed using a
log-rank test. Univariate analysis and multivariate survival
analysis were performed using the Cox proportional hazard
regression model. The relative risks of death are presented as
adjusted hazard ratios (HRs) and 95% confidence intervals (CIs).
P<0.05 was considered to indicate a statistically significant
difference.
Results
Caprin-1 is highly expressed in liver
cancer tissue
Detailed information on the clinical characteristics
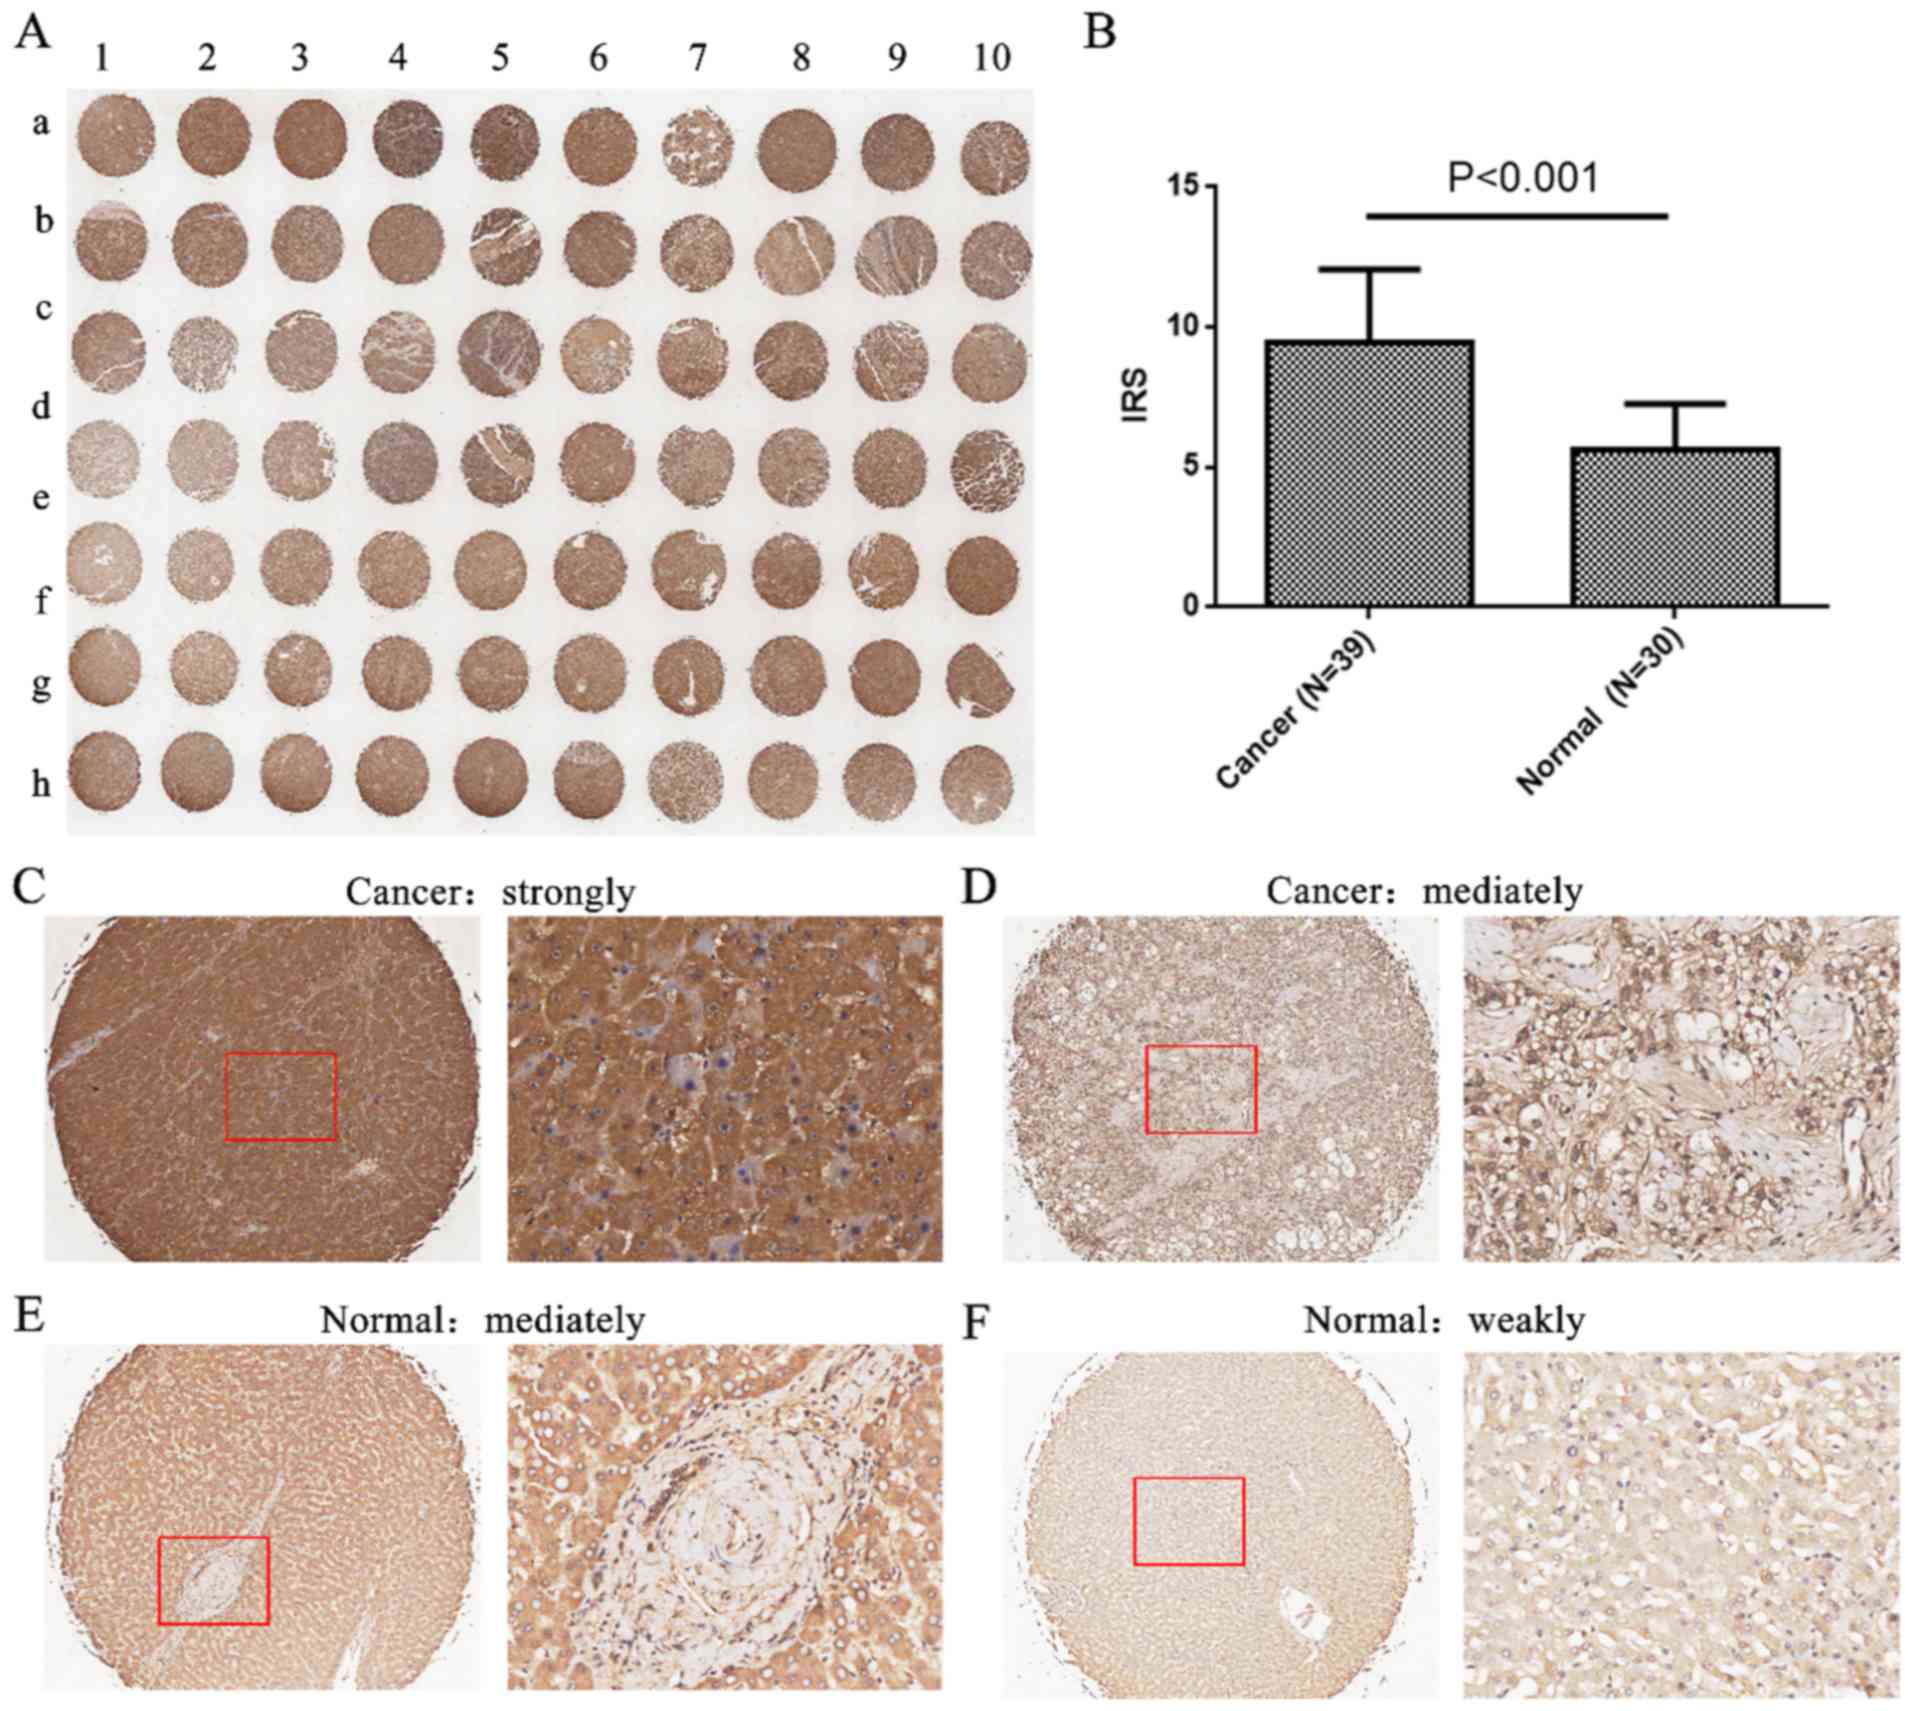
of all patients in the present study are shown in Table I. As shown in Fig. 1, caprin-1 expression was primarily
localized to the cytoplasm of liver cancer cells with high
expression levels, whereas caprin-1expression levels were weak in
normal liver tissue. Of the 39 liver cancer samples, 7 samples
(17.9%) showed low expression levels of caprin-1 (<mean
expression levels of caprin-1), whereas 32 samples (82.1%) showed
strong staining with high expression levels (>mean expression
levels of caprin-1). In addition, the expression levels of caprin-1
in liver cancer tissues were significantly higher compared with
that in normal liver tissues (IRS, 9.44±2.62 in liver cancer vs.
5.60±1.65 in normal tissue; P<0.001; Fig. 1B).
 | Table I.Association of caprin-1 protein and
mRNA expression levels with clinicopathological characteristics in
patients with liver cancer. |
Table I.
Association of caprin-1 protein and
mRNA expression levels with clinicopathological characteristics in
patients with liver cancer.
|
| Tissue
microarray | The Cancer Genome
Atlas database |
|---|
|
|
|
|
|---|
| Clinical
features | Number | Low, n (%) | High, n (%) | P-value | Number | Mean ± SD | P-value |
|---|
| Cancer | 39 | 7 (17.9) | 32 (82.1) |
<0.001a | 134 |
3,516.17±1,370.19 | – |
| Benign | 30 | 24 (80.0) | 6 (20.0) |
| – | – | – |
| Age, years |
|
|
|
|
|
|
|
|
<45 | 15 | 2 (13.3) | 13 (86.7) | 0.444 | 67 (<65) |
3,300.31±1,319.87 | 0.034b |
|
≤45 | 24 | 5 (20.8) | 19 (79.2) |
| 67 (≥65) |
3,784.58±1,299.38 |
|
| Sex |
|
|
|
|
|
|
|
|
Male | 8 | 1 (12.5) | 7 (87.5) | 0.554 | 80 |
3,407.94±1,228.09 | 0.154 |
|
Female | 31 | 6 (19.4) | 25 (80.6) |
| 54 |
3,741.71±1,450.62 |
|
| Pathological
grade |
|
|
|
|
|
|
|
| ≤2 | 29 | 3 (10.3) | 26 (89.7) | 0.131 | – | – | – |
|
>2 | 9 | 3 (33.3) | 6 (66.7) | – | – | – | – |
| Clinical stage |
|
|
|
|
|
|
|
|
I–II | 15 | 7 (46.7) | 8 (53.3) |
<0.001a | – | – | – |
|
III–IV | 24 | 0 (0.0) | 24 (100.0) |
| – | – | – |
| Tumor invasion |
|
|
|
|
|
|
|
|
T1-T2 | 15 | 7 (46.7) | 8 (53.3) |
<0.001a | 86 |
3,473.89±1,067.72 | 0.044b |
|
T3-T4 | 24 | 0 (0.0) | 24 (100.0) |
| 48 |
3,865.27±1,079.35 |
|
| Lymph node
metastasisc |
|
|
|
|
|
|
|
| N0 | – | – | – | – | 83 |
3,649.43±1,407.77 | 0.902 |
| N1 | – | – | – | – | 3 |
3,751.22±1,195.26 |
|
| Distant
metastasisd |
|
|
|
|
|
|
|
| M0 | – | – | – | – | 99 |
3,593.43±1,401.42 | 0.534 |
| M1 | – | – | – | – | 3 |
3,084.15±725.15 |
|
Association between caprin-1
expression and clinical characteristics of patients
When analyzing the relationship between caprin-1 and
clinical characteristics of the patients using TMA data, the
results revealed that caprin-1 protein overexpression was
associated with advanced clinical stage and tumor invasion (both
P<0.001) and enhanced tumor invasion (P<0.001). However, high
caprin-1 levels were not associated with age or sex (both
P>0.05; Table I). The results
from the TCGA database, which contained high-throughput sequencing
data for caprin-1 mRNA expression in 154 liver cancer tissues,
showed that caprin-1 mRNA expression was upregulated in older
patients (P=0.034) and tumor-infiltrating liver cancer tissues
(P=0.044; Table I).
Caprin-1 expression and prognosis of
liver cancer from TCGA data
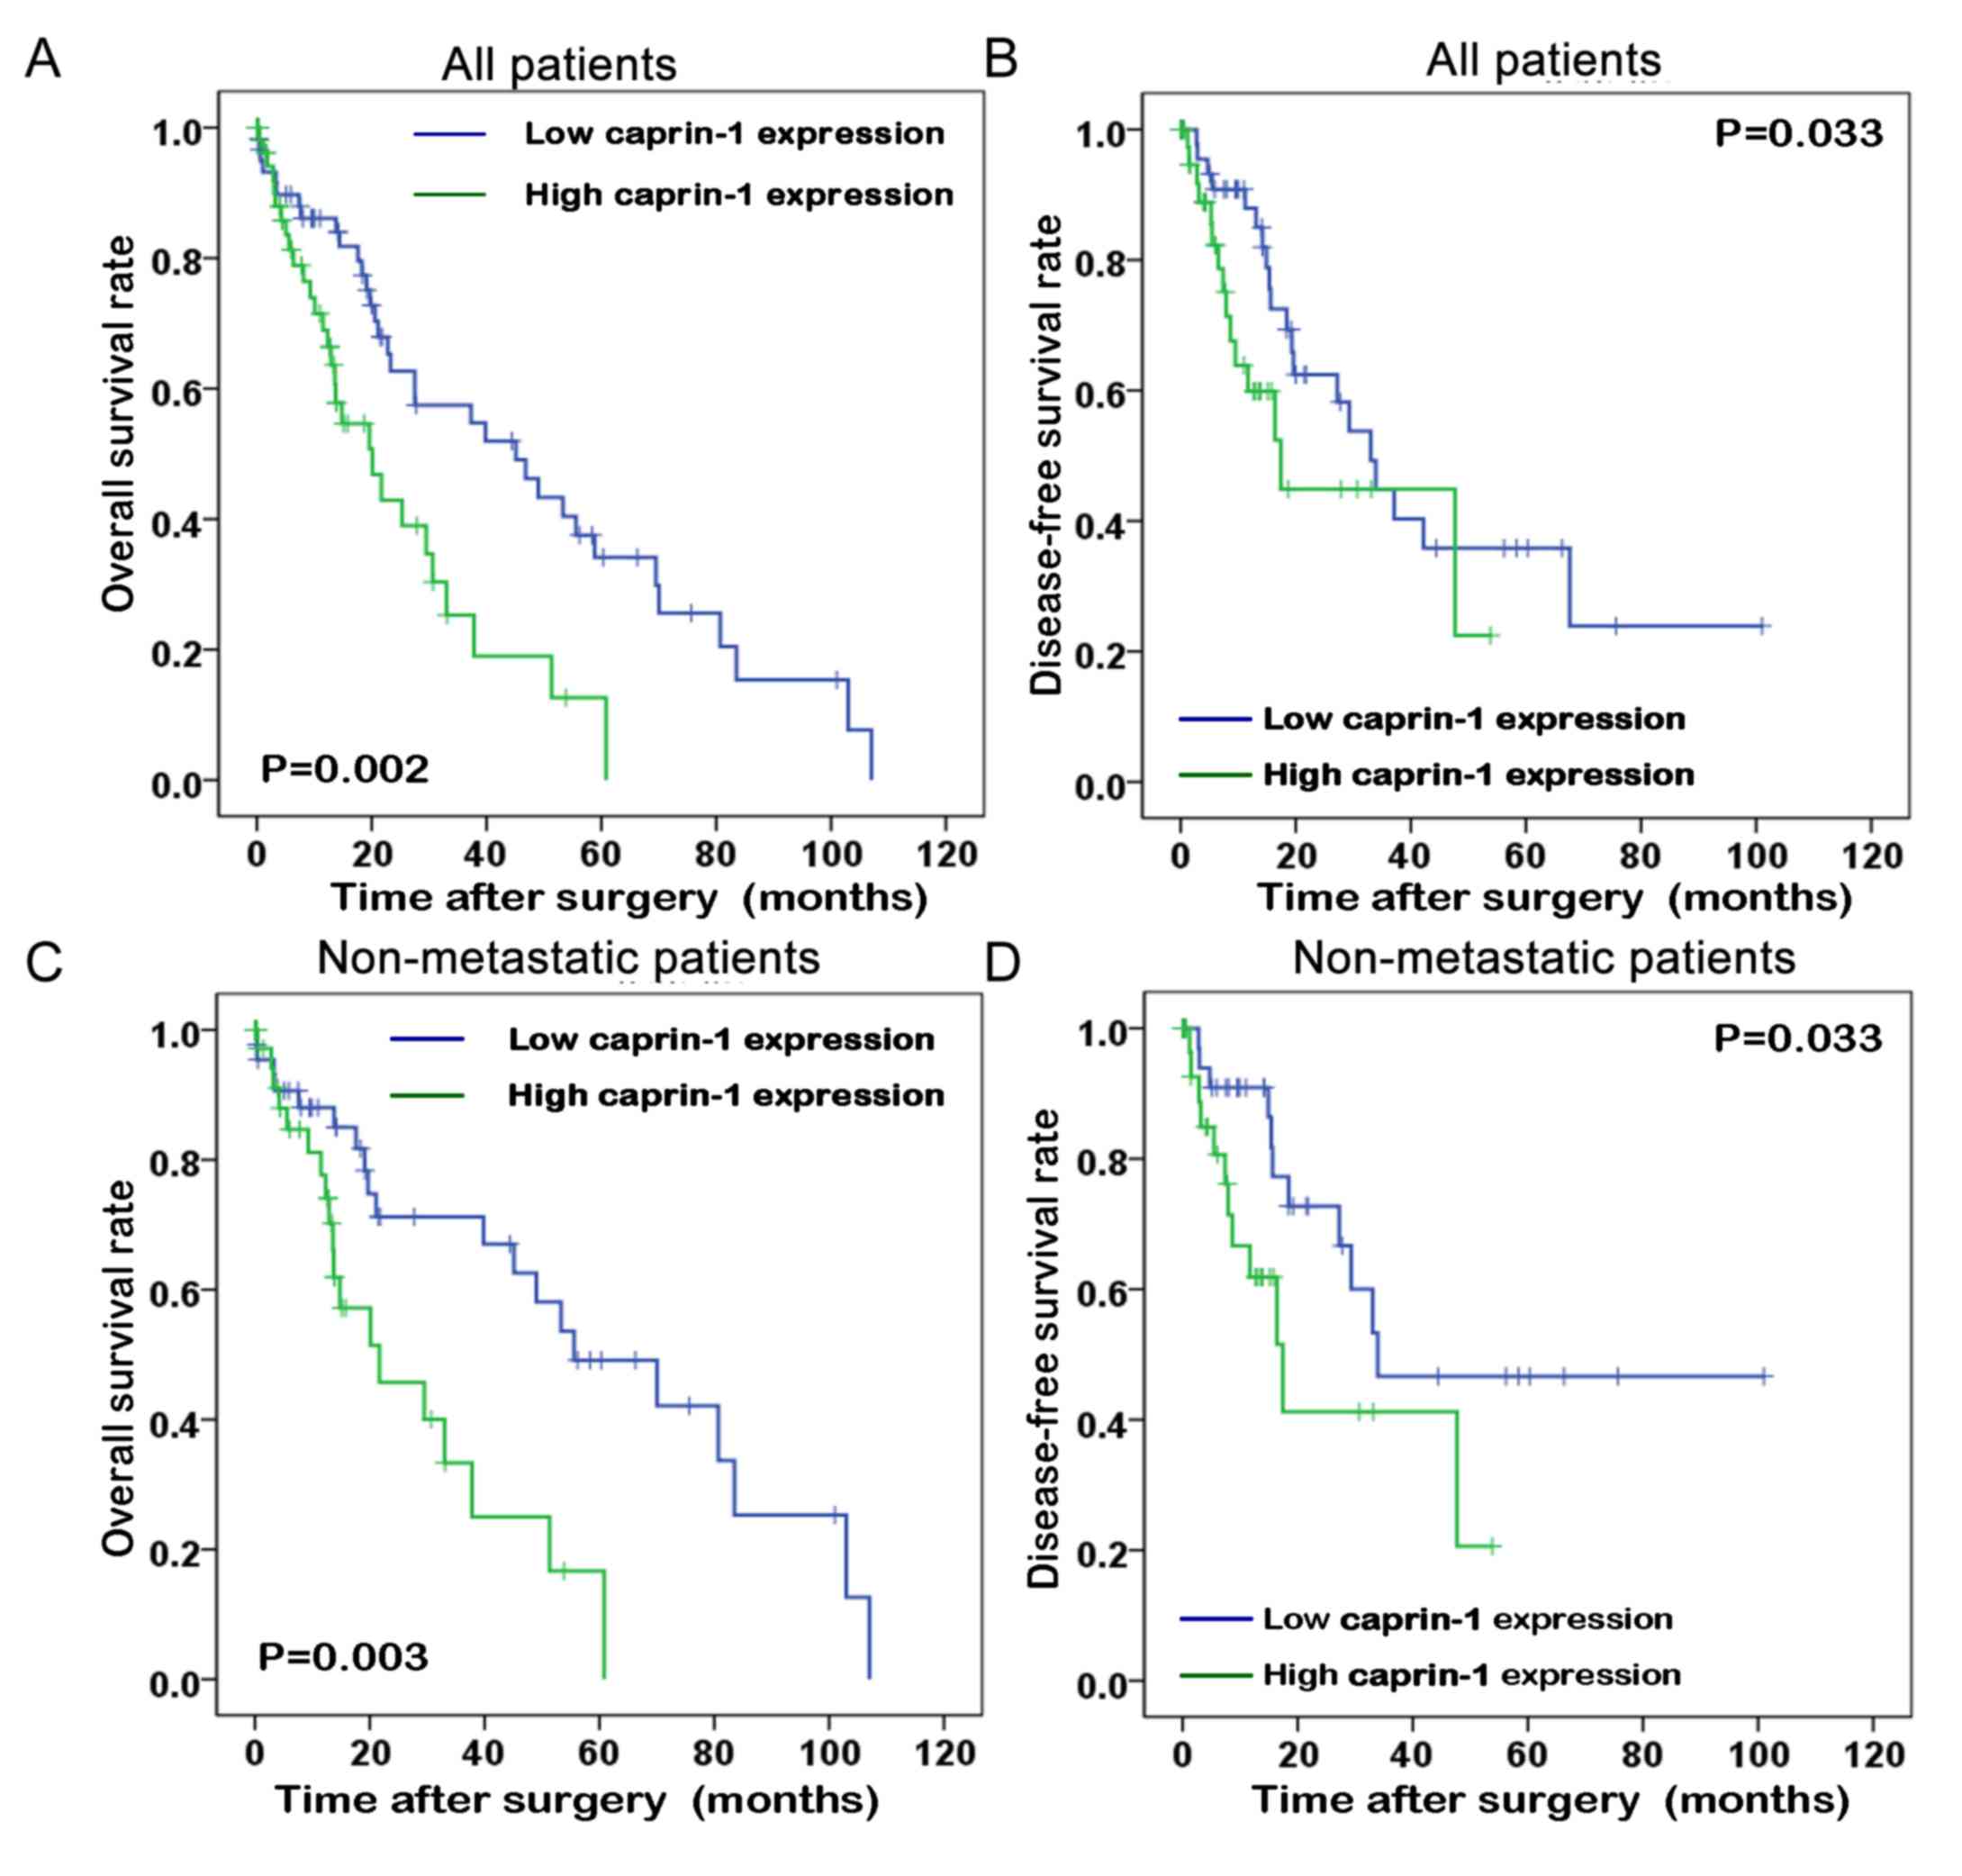
The association between caprin-1 expression levels
and survival time of patients with liver cancer was analyzed using
the Kaplan-Meier method from data downloaded from TCGA database. As
shown in Fig. 2, the overall
survival time and disease-free survival time of patients with liver
cancer with high caprin-1 expression levels were significantly
shorter compared with that in patients with liver cancer with low
caprin-1 expression levels (P=0.002 and P=0.033, respectively). In
patients without metastatic disease, the metastasis-free and
disease-free survival rates of patients with high caprin-1
expression levels were significantly lower compared with that in
patients with low caprin-1 expression levels (P=0.003 and P=0.033,
respectively).
Caprin-1 is an independent predictor
for liver cancer survival
Univariate analysis showed that besides person
neoplasm status (HR, 1.826; 95% CI, 1.060–3.146; P=0.030) and tumor
invasion (HR, 2.701; 95% CI, 1.203–6.061; P=0.016), caprin-1
expression was also a significant prognostic factor for
disease-free survival in patients with liver cancer (HR, 2.284; 95%
CI, 1.328–3.930; P=0.003; Table
II). Multivariate analysis using the Cox proportional hazard
model showed that besides person neoplasm status (HR,3.573; 95%
CI,1.421–8.938; P=0.007), sex (HR, 3.647; 95% CI,1.493–8.909;
P=0.005), tumor invasion(HR, 52.503; 95% CI, 6.706–411.079;
P<0.001), and distant metastasis (HR, 0.048; 95% CI,
0.004–0.574; P=0.048), high caprin-1 expression was also a
significant independent prognostic factor in patients with liver
cancer (HR, 7.299; 95% CI, 2.614–20.379; P<0.001; Table II).
| Table II.Prognostic value of caprin-1 mRNA
expression levels for overall survival based on Cox proportional
hazards model. |
Table II.
Prognostic value of caprin-1 mRNA
expression levels for overall survival based on Cox proportional
hazards model.
| A, Univariate
analysis |
|---|
|
|---|
|
| Overall
survival |
|---|
|
|
|
|---|
| Variable | HR (95%CI) | P-value |
|---|
| Tumor status, tumor
vs. tumor free | 1.826
(1.060–3.146) | 0.030a |
| Age, ≥65 vs. <65
years | 0.768
(0.463–1.276) | 0.309 |
| Sex, male vs.
female | 1.312
(0.782–2.201) | 0.304 |
| Clinical stage,
I–II vs. III–IV | 1.120
(0.646–1.943) | 0.686 |
| Tumor invasion,
T1-T2 vs. T3-T4 | 2.701
(1.203–6.061) | 0.016a |
| Lymph node stage,
N0 vs. N1 | 0.676
(0.091–5.005) | 0.676 |
| Distant metastasis,
M0 vs. M1 | 2.917
(0.879–9.674) | 0.080 |
| Caprin-1
expression, low vs. high | 2.284
(1.328–3.930) | 0.003b |
|
| B, Multivariate
analysis |
|
|
| Overall
survival |
|
|
|
|
Variable | HR
(95%CI) | P-value |
|
| Personal neoplasm
status, with tumor vs. tumor free | 3.573
(1.421–8.938) | 0.007b |
| Age, ≥65 vs. <65
years | 2.208
(0.934–5.218) | 0.071 |
| Sex, male vs.
female | 3.647
(1.493–8.909) | 0.005b |
| Clinical stage,
I–II vs. III–IV | 0.877
(0.369–2.084) | 0.766 |
| Tumor invasion,
T1-T2 vs. T3-T4 | 52.503
(6.706–411.079) |
<0.001c |
| Lymph node stage,
N0 vs. N1 | 0.407
(0.046–3.646) | 0.422 |
| Distant metastasis,
M0 vs. M1 | 0.048
(0.004–0.574) | 0.048a |
| Caprin-1
expression, low vs. high | 7.299
(2.614–20.379) |
<0.001c |
Caprin-1 knockdown inhibits cell
proliferation by arresting cells at G0/G1
phase
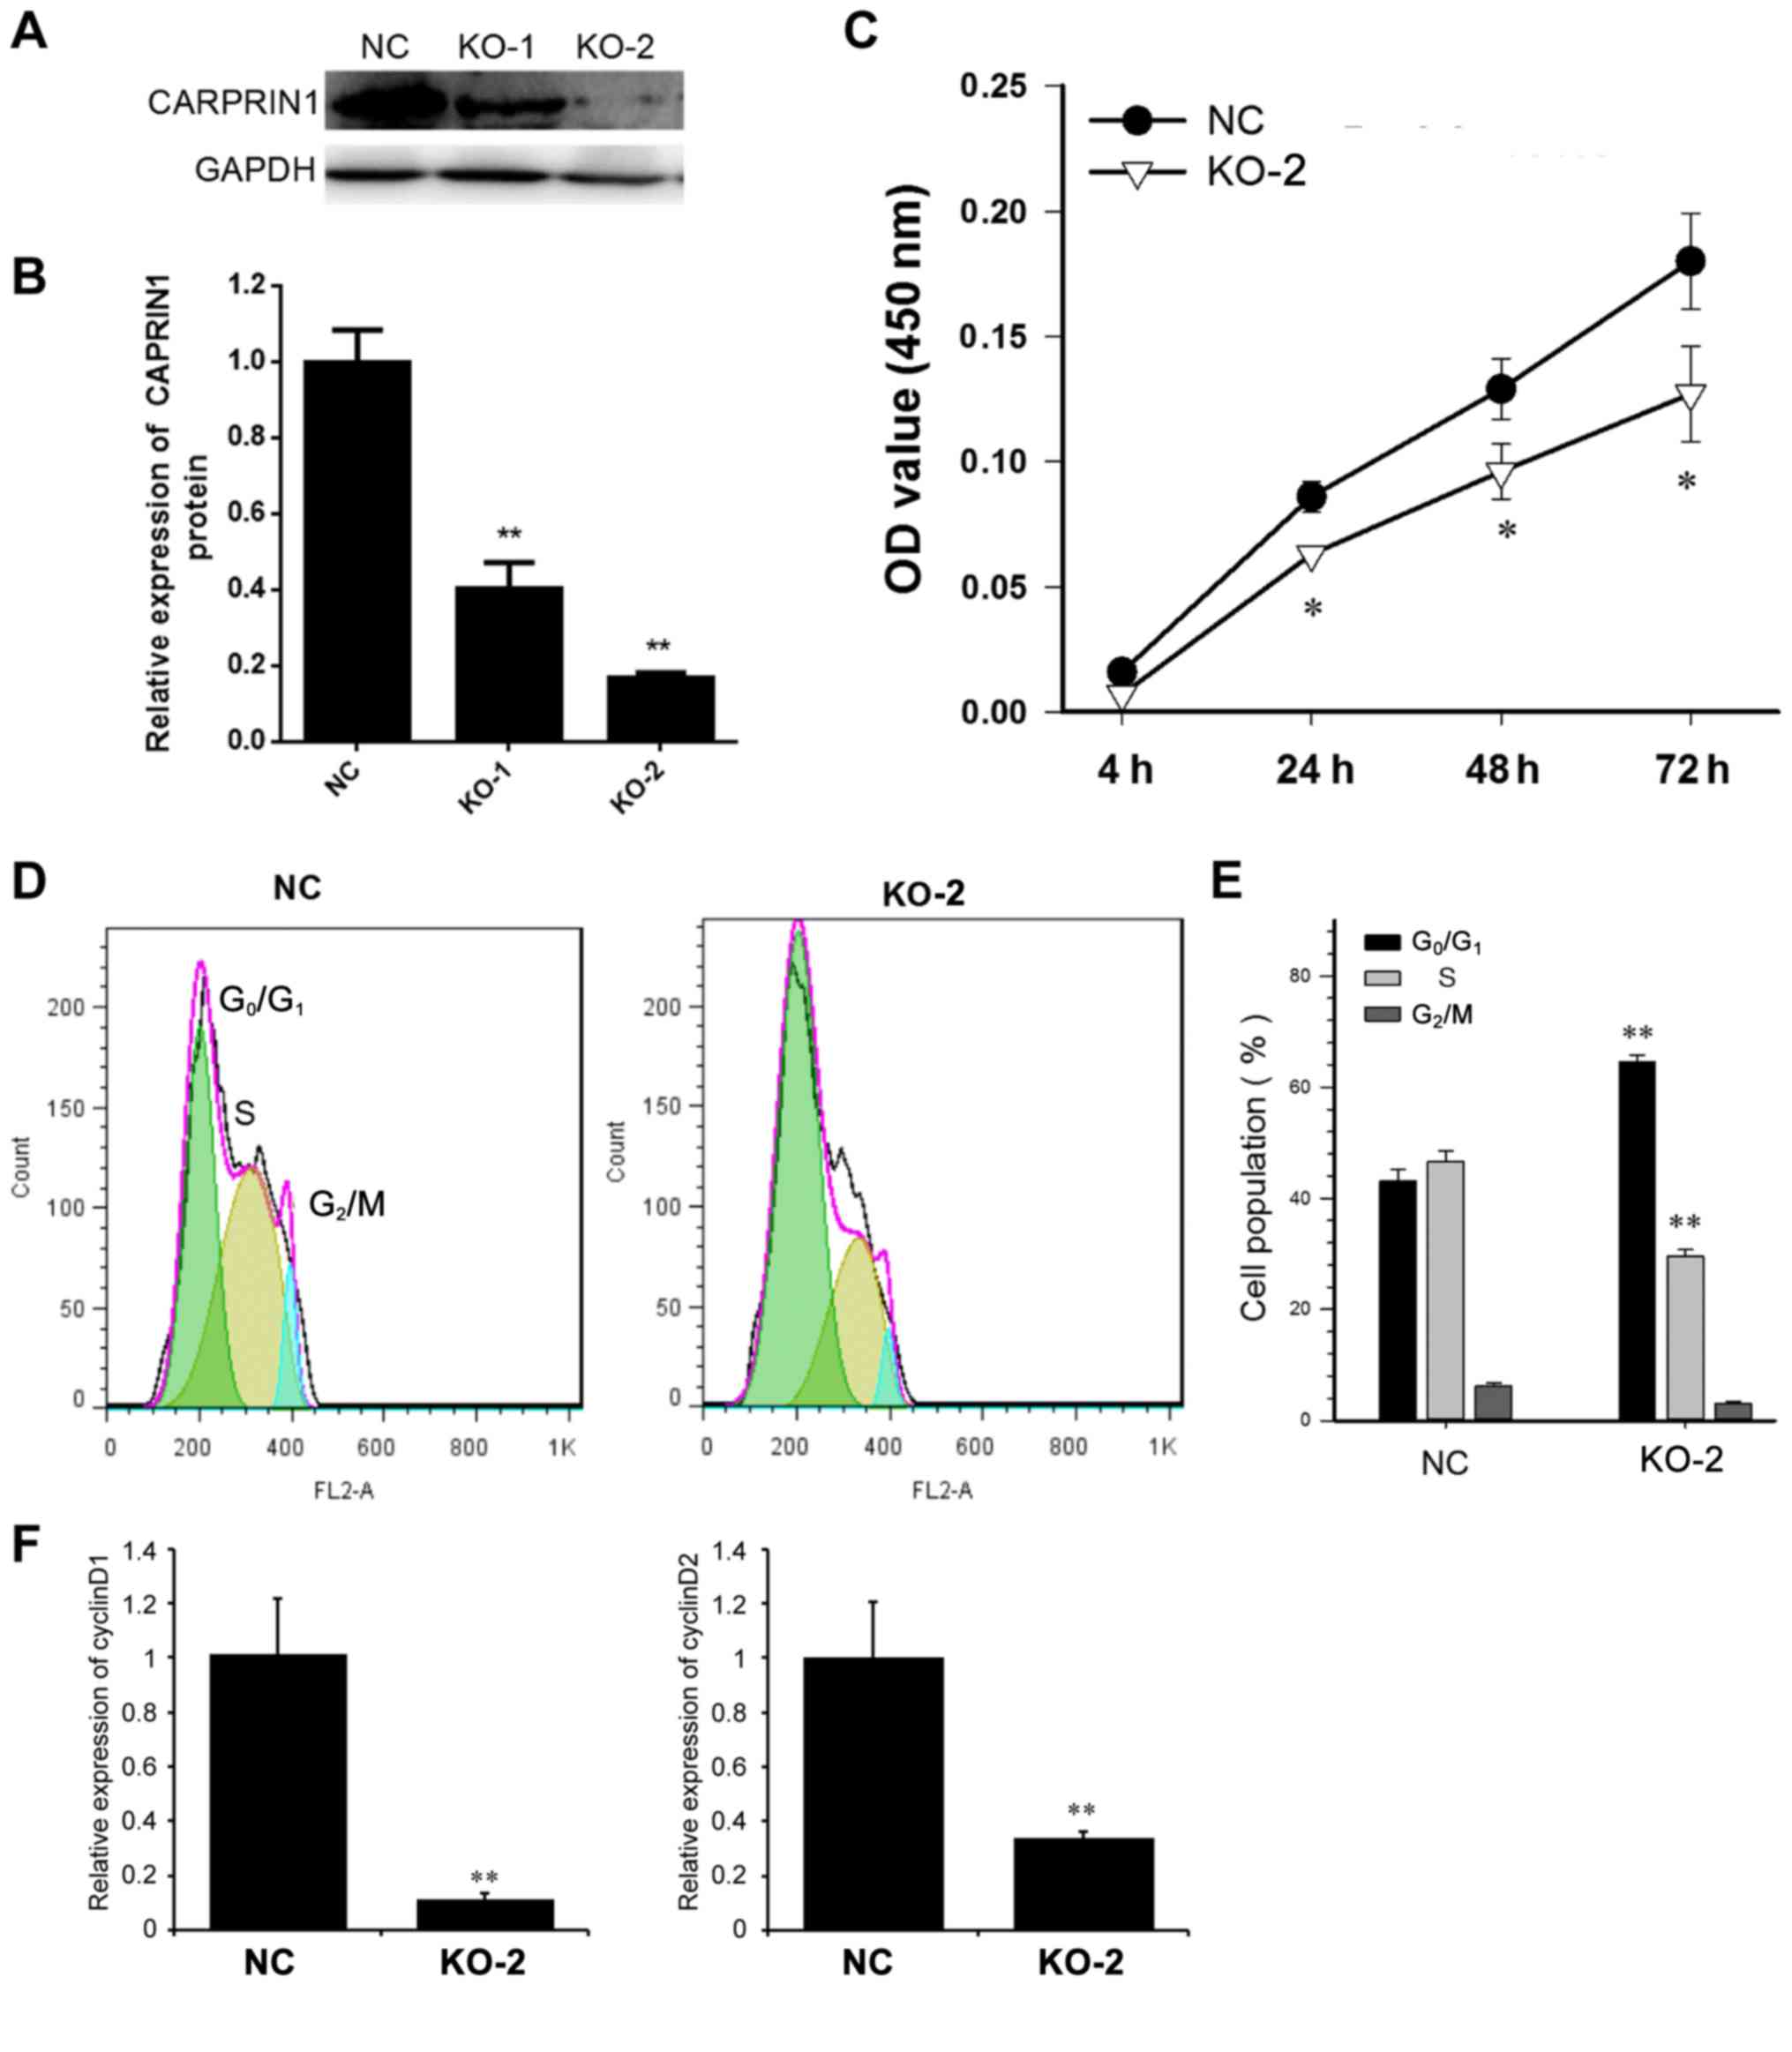
Next, the underlying mechanism of caprin-1 in liver
cancer was studied in human HepG2 liver cancer cells. A knockout
plasmid for caprin-1 was constructed to decrease the expression
levels of caprin-1 in cultured cells. As shown in Fig. 3A and B, after HepG2 cells were
transfected with either PXC9-puro-KO-1, PXC9-puro-KO-2 or
PXC9-puro-NC, the expression levels of caprin-1 were significantly
decreased, by 52% in cells treated with PXC9-puro-KO-1 and 67% in
cells treated with PXC9-puro-KO-2. PXC9-puro-KO-2 was used for
further experiments because of its higher knockout efficiency.
Downregulation of caprin-1 significantly inhibited the
proliferation of HepG2 cells (Fig.
3C) and the cells were arrested in G0/G1
phase (Fig. 3D and E). The mRNA
levels of cyclin D1 and D2 were both downregulated in caprin-1 KO
cells (Fig. 3F).
Caprin-1 knockdown inhibits cell
migration
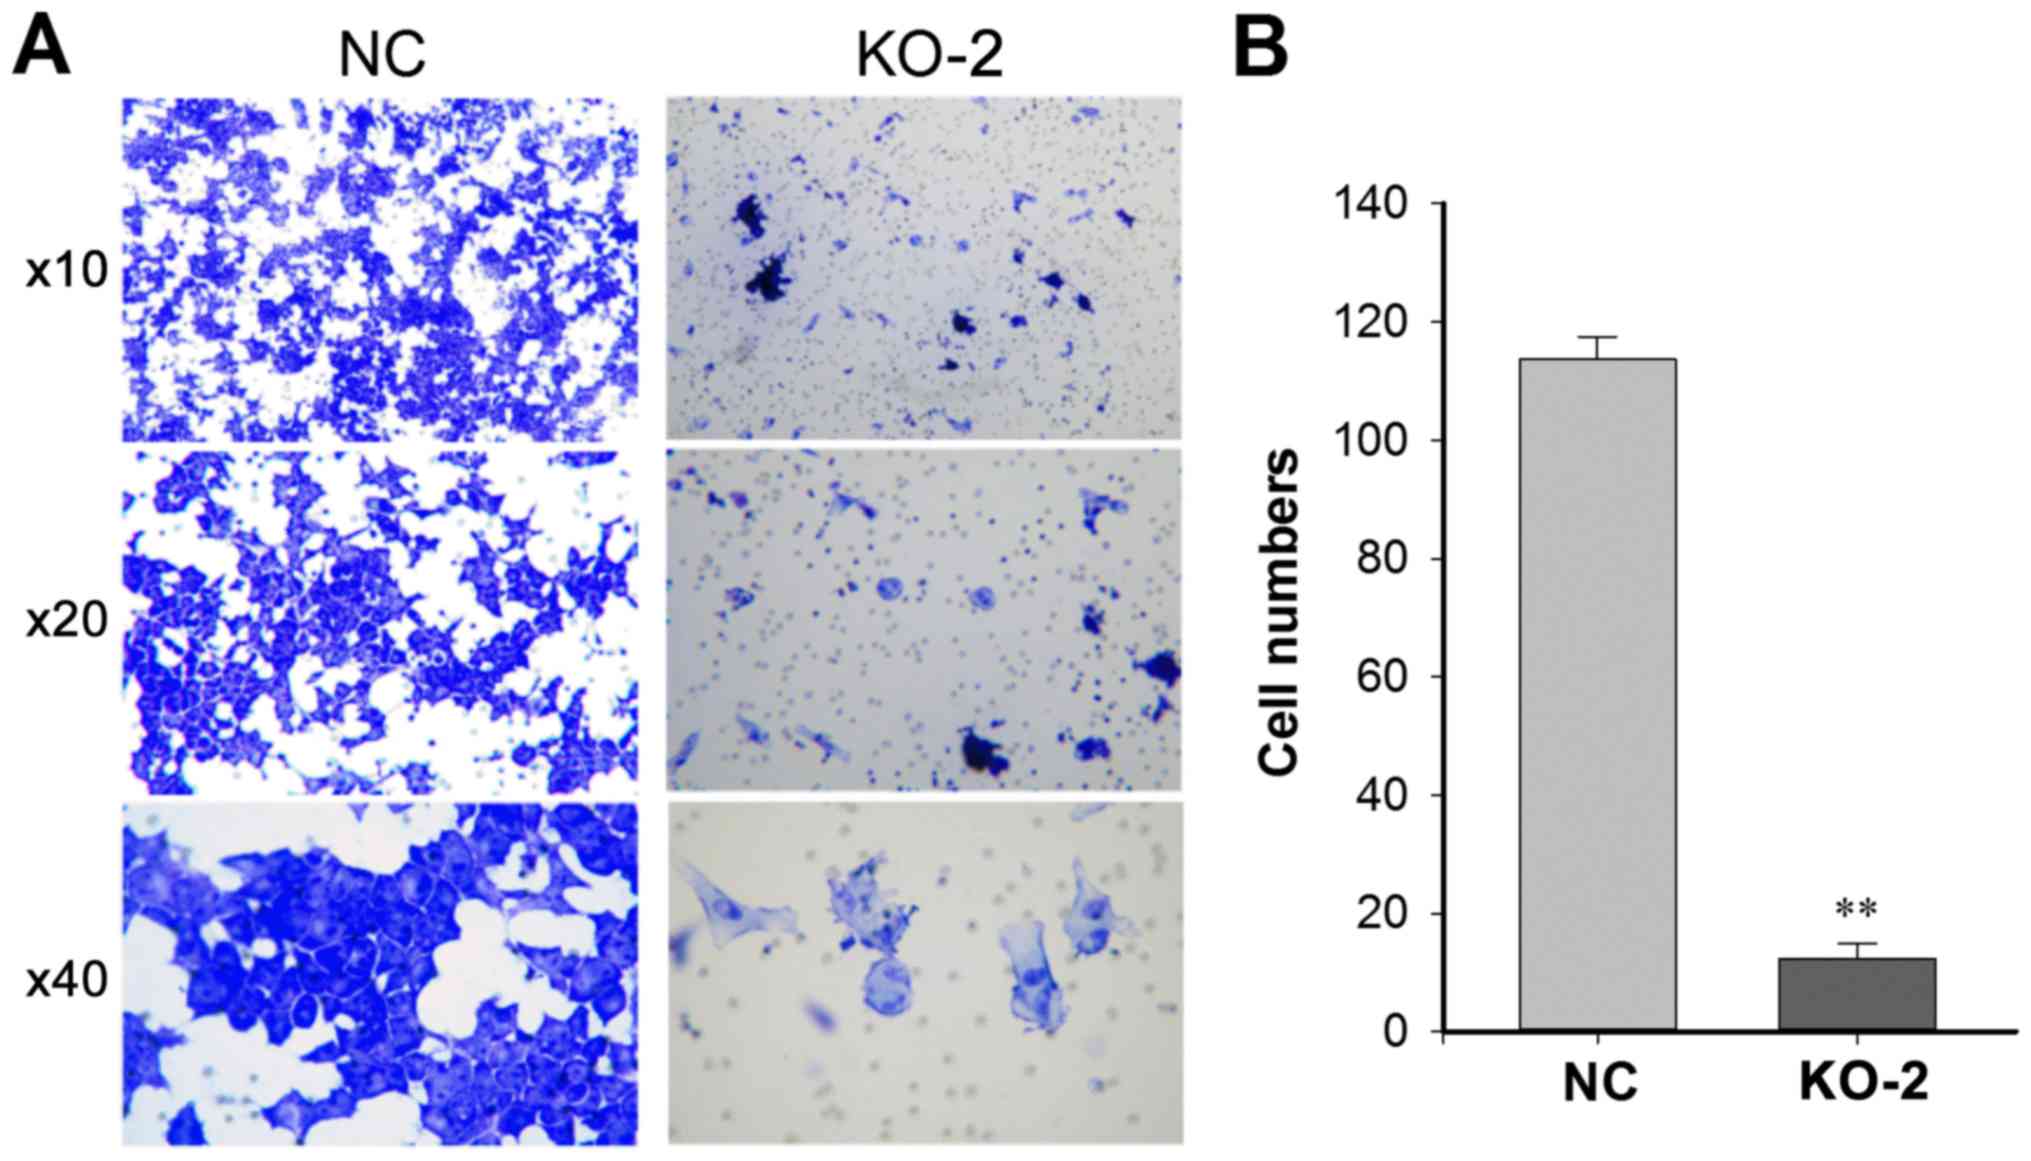
The effect of caprin-1 knockdown on cell invasion
was also analyzed. As shown in Figs.
4 and 5, after HepG2 cells were
transfected with either PXC9-puro-KO-2 or PXC9-puro-NC, the
migration ability of HepG2 cells were significantly inhibited in
the cells transfected with PXC9-puro-KO-2, indicating that
downregulation of caprin-1 inhibited the migration of HepG2
cells.
Discussion
In the present study, caprin-1 expression levels in
liver cancer tissues and HepG2 cells were significantly higher
compared with that in normal liver tissues and cells. Higher
expression levels of caprin-1 were associated with advanced stage
and enhanced tumor invasion, independent of age or sex. Using TCGA
data, it was found that the overall survival time and disease-free
survival time of patients with high expression levels of caprin-1
were significantly shorter compared with that in patients with low
expression levels. Multivariate analysis showed that high
expression levels of caprin-1 were a significant independent
prognostic factor in patients with liver cancer. The aforementioned
results suggested that the expression levels of caprin-1 are
associated with the occurrence, development and prognosis of liver
cancer. Further experiments in HepG2 cells showed that knockdown of
caprin-1 downregulated the expression of cyclin D1 and D2, and
inhibited cell proliferation as well as cell migration.
Caprin-1 consists of 709 amino acids and contains an
RGG sequence unique to RNA-binding proteins (16). Lack of caprin-1 may delay
G1 to S phase progression within the cell cycle
(17). Sabile et al (21) found that caprin-1 overexpression can
significantly promote the growth and lung metastasis of mouse
osteosarcoma. The present study showed that high caprin-1
expression levels were associated with specific advanced
clinicopathological features in liver cancer, which is in
accordance with the growth promotion function of caprin-1 in
osteosarcoma (21). Together, these
studies suggest that caprin-1 serves an important role in the
regulation of malignant tumors.
Next, the mechanism underlying the association of
caprin-1 and liver cancer prognosis was explored. The present study
showed that knockdown of caprin-1 inhibited proliferation by
arresting cells at G0/G1 phase and
downregulated the expression of cyclin D1 and D2. Cyclin D1 and D2
are proteins that couple with extracellular signals to the
biochemical machinery governing progression through G1
phase of the mammalian cell division cycle (26). These proteins are frequently
deregulated in cancer and are biomarkers of cancer phenotype and
disease progression (27). The data
of the present study also showed that caprin-1 knockdown inhibited
the migration of HepG2 cells. Thus, downregulation of caprin-1
expression inhibited proliferation and migration in tumor cells and
was associated with poor prognosis in patients with liver cancer.
This is consistent with previous reports; for example, caprin-1 was
reported to be essential for the proliferation of B lymphocyte
cells (17). In addition, in
osteosarcoma cells, caprin-1 overexpression can activate the
MAPK/ERK and PI3K/Akt signaling pathways, which are involved in the
regulation of cell proliferation, apoptosis and survival (21). Overexpression of caprin-1 promotes
the proliferation and invasion of breast cancer cells and microRNA
(miR)-223 inhibits cancer cell proliferation by targeting the
3′untranslated region of caprin-1; thus, downregulation of caprin-1
expression can inhibit cancer cell proliferation and invasion
(22). miR-193a, which is highly
expressed in colon tumor cells, causes cell cycle G1
arrest and inhibits cell proliferation by inhibiting Caprin-1
expression (23). The effect of
miR-193a-mediated disruption of the caprin-1/G3BP-1/c-MYC/Cyclin D2
complex may be a potential target for anticancer therapeutic
applications (23). The data of the
present study indicates that caprin-1 can regulate the development
of liver cancer through its effects on cell proliferation and
migration.
In a previous study, the predictive value of
caprin-1 in liver cancer was reported (28). It was found that upregulation of
caprin-1 expression is associated with poor prognosis in liver
cancer, which is consistent with the conclusion of the present
study. However, the relationship between caprin-1 and metastasis in
the previous study (28) was not
investigated, although both lymph node metastasis and distant
metastasis showed no difference with the level of caprin-1
expression. Moreover, the present study explored the underlying
mechanism, demonstrating that the predictive value of caprin-1 for
the prognosis of liver cancer may be associated with its function
in cancer cell proliferation and migration.
The present study had several limitations. First,
the TMA cancer tissue and the control tissue samples were not all
compared or were they from the same patients in the present study,
and only 10 adjacent samples were collected, which may affect the
comparison of caprin-1 expression between two groups due to
possible genetic differences between cancer tissues and those
un-paired samples. However, the present data are consistent with
the findings of a previous report (28), indicating that the impact of no
paired samples on the results was small. Secondly, a preliminary
study was conducted to investigate the mechanism of caprin-1 in
liver cancer and further research is required to investigate the
underlying molecular mechanisms.
In conclusion, the present study showed that
caprin-1 is overexpressed in liver cancer tissues and is associated
with the clinicopathological features of liver cancer. Moreover,
high caprin-1 expression levels are associated with poor prognosis
in liver cancer. Caprin-1 knockdown inhibits the proliferation and
migration of liver cancer cells. Caprin-1 may serve as a novel
prognostic biomarker for liver cancer, assisting in liver cancer
treatment and prediction of patient prognosis.
Acknowledgements
Not applicable.
Funding
This study was supported by Science and Technology
Planning Project of Guangdong Province, China (grant no.
2016A020215015).
Availability of data and materials
The datasets generated and/or analyzed during the
present study are available from the corresponding author on
reasonable request.
Authors' contributions
XMG, JCS, FFZ and LWP conceived and designed the
study. XMG, FFZ, LWP and JLC collected data and conducted the
research. JLC, JCL and HXW analyzed and interpreted the data. FFZ
and JLC wrote the initial manuscript. XMG and JCS revised the
manuscript. XMG had primary responsibility for final content. All
authors read and approved the final manuscript.
Ethics approval and consent to
participate
The company that provided the clinical samples had
no individual Ethics Committee, thus the present study was approved
by the Ethics Committee of Guangzhou Red Cross Hospital (Guangzhou,
China; approval no. 2017-047-01). All procedures performed in
studies involving human participants were in accordance with the
ethics standards of the institutional and national research
committee and with the 1964 Declaration of Helsinki and its later
amendments or comparable ethics standards. Written informed consent
was provided by all individual participants included in the present
study.
Patient consent for publication
Not applicable.
Competing interests
The authors declare that they have no competing
interests.
References
|
1
|
Global Burden of Disease Cancer
Collaboration, . Fitzmaurice C, Dicker D, Pain A, Hamavid H,
Moradi-Lakeh M, MacIntyre MF, Allen C, Hansen G, Woodbrook R, et
al: The global burden of cancer 2013. JAMA Oncol. 1:505–527. 2015.
View Article : Google Scholar : PubMed/NCBI
|
|
2
|
Ferlay J, Soerjomataram I, Dikshit R, Eser
S, Mathers C, Rebelo M, Parkin DM, Forman D and Bray F: Cancer
incidence and mortality worldwide: Sources, methods and major
patterns in GLOBOCAN 2012. Int J Cancer. 136:E359–E386. 2015.
View Article : Google Scholar : PubMed/NCBI
|
|
3
|
Torre LA, Bray F, Siegel RL, Ferlay J,
Lortet-Tieulent J and Jemal A: Global cancer statistics, 2012. CA
Cancer J Clin. 65:87–108. 2015. View Article : Google Scholar : PubMed/NCBI
|
|
4
|
GBD 2013 Mortality and Causes of Death
Collaborators, . Global, regional, and national age-sex specific
all-cause and cause-specific mortality for 240 causes of death,
1990–2013: A systematic analysis for the Global Burden of Disease
Study 2013. Lancet. 385:117–171. 2015. View Article : Google Scholar : PubMed/NCBI
|
|
5
|
Daher S, Massarwa M, Benson AA and Khoury
T: Current and future treatment of hepatocellular carcinoma: An
updated comprehensive review. J Clin Transl Hepatol. 6:69–78. 2018.
View Article : Google Scholar : PubMed/NCBI
|
|
6
|
Llovet JM and Bruix J: Early diagnosis and
treatment of hepatocellular carcinoma. Baillieres Best Pract Res
Clin Gastroenterol. 14:991–1008. 2000. View Article : Google Scholar : PubMed/NCBI
|
|
7
|
Huang TS, Shyu YC, Turner R, Chen HY and
Chen PJ: Diagnostic performance of alpha-fetoprotein, lens
culinaris agglutinin-reactive alpha-fetoprotein, des-gamma
carboxyprothrombin, and glypican-3 for the detection of
hepatocellular carcinoma: A systematic review and meta-analysis
protocol. Syst Rev. 2:372013. View Article : Google Scholar : PubMed/NCBI
|
|
8
|
Ioannou GN, Perkins JD and Carithers RL
Jr: Liver transplantation for hepatocellular carcinoma: Impact of
the MELD allocation system and predictors of survival.
Gastroenterology. 134:1342–1351. 2008. View Article : Google Scholar : PubMed/NCBI
|
|
9
|
Li J, Gao JZ, Du JL and Wei LX: Prognostic
and clinicopathological significance of glypican-3 overexpression
in hepatocellular carcinoma: A meta-analysis. World J
Gastroenterol. 20:6336–6344. 2014. View Article : Google Scholar : PubMed/NCBI
|
|
10
|
Wang Y, Peng C, Cheng Z, Wang X, Wu L, Li
J, Huang C, Guo Q and Cai H: The prognostic significance of
preoperative neutrophil-lymphocyte ratio in patients with
hepatocellular carcinoma receiving hepatectomy: A systematic review
and meta-analysis. Int J Surg. 55:73–80. 2018. View Article : Google Scholar : PubMed/NCBI
|
|
11
|
Zhou Y, Sui C, Li B, Yin Z, Tan Y, Yang J
and Liu Z: Repeat hepatectomy for recurrent hepatocellular
carcinoma: A local experience and a systematic review. World J Surg
Oncol. 8:552010. View Article : Google Scholar : PubMed/NCBI
|
|
12
|
Ludwig JA and Weinstein JN: Biomarkers in
cancer staging, prognosis and treatment selection. Nat Rev Cancer.
5:845–856. 2005. View
Article : Google Scholar : PubMed/NCBI
|
|
13
|
Zhang J, Zhang M, Ma H, Song X, He L, Ye X
and Li X: Overexpression of glypican-3 is a predictor of poor
prognosis in hepatocellular carcinoma: An updated meta-analysis.
Medicine (Baltimore). 97:e111302018. View Article : Google Scholar : PubMed/NCBI
|
|
14
|
Wang Q, Wang G, Liu C and He X: Prognostic
value of CpG island methylator phenotype among hepatocellular
carcinoma patients: A systematic review and meta-analysis. Int J
Surg. 54:92–99. 2018. View Article : Google Scholar : PubMed/NCBI
|
|
15
|
Zheng J, Cai J, Li H, Zeng K, He L, Fu H,
Zhang J, Chen L, Yao J, Zhang Y, et al: Neutrophil to lymphocyte
ratio and platelet to lymphocyte ratio as prognostic predictors for
hepatocellular carcinoma patients with various treatments: A
meta-analysis and systematic review. Cell Physiol Biochem.
44:967–981. 2017. View Article : Google Scholar : PubMed/NCBI
|
|
16
|
Grill B, Wilson GM, Zhang KX, Wang B,
Doyonnas R, Quadroni M and Schrader JW: Activation/division of
lymphocytes results in increased levels of cytoplasmic
activation/proliferation-associated protein-1: Prototype of a new
family of proteins. J Immunol. 172:2389–2400. 2004. View Article : Google Scholar : PubMed/NCBI
|
|
17
|
Wang B, David MD and Schrader JW: Absence
of caprin-1 results in defects in cellular proliferation. J
Immunol. 175:4274–4282. 2005. View Article : Google Scholar : PubMed/NCBI
|
|
18
|
Solomon S, Xu Y, Wang B, David MD,
Schubert P, Kennedy D and Schrader JW: Distinct structural features
of caprin-1 mediate its interaction with G3BP-1 and its induction
of phosphorylation of eukaryotic translation initiation factor 2
alpha, entry to cytoplasmic stress granules, and selective
interaction with a subset of mRNAs. Mol Cell Biol. 27:2324–2342.
2007. View Article : Google Scholar : PubMed/NCBI
|
|
19
|
Kedersha N, Panas MD, Achorn CA, Lyons S,
Tisdale S, Hickman T, Thomas M, Lieberman J, McInerney GM, Ivanov
P, et al: G3BP-Caprin1-USP10 complexes mediate stress granule
condensation and associate with 40S subunits. J Cell Biol.
212:845–860. 2016. View Article : Google Scholar : PubMed/NCBI
|
|
20
|
Copsey AC, Cooper S, Parker R, Lineham E,
Lapworth C, Jallad D, Sweet S and Morley SJ: The helicase, DDX3X,
interacts with poly(A)-binding protein 1 (PABP1) and caprin-1 at
the leading edge of migrating fibroblasts and is required for
efficient cell spreading. Biochem J. 474:3109–3120. 2017.
View Article : Google Scholar : PubMed/NCBI
|
|
21
|
Sabile AA, Arlt MJ, Muff R, Husmann K,
Hess D, Bertz J, Langsam B, Aemisegger C, Ziegler U, Born W, et al:
Caprin-1, a novel Cyr61-interacting protein, promotes osteosarcoma
tumor growth and lung metastasis in mice. Biochim Biophys Acta.
1832:1173–1182. 2013. View Article : Google Scholar : PubMed/NCBI
|
|
22
|
Gong B, Hu H, Chen J, Cao S, Yu J, Xue J,
Chen F, Cai Y, He H and Zhang L: Caprin-1 is a novel microRNA-223
target for regulating the proliferation and invasion of human
breast cancer cells. Biomed Pharmacother. 67:629–636. 2013.
View Article : Google Scholar : PubMed/NCBI
|
|
23
|
Teng Y, Ren Y, Hu X, Mu J, Samykutty A,
Zhuang X, Deng Z, Kumar A, Zhang L, Merchant ML, et al:
MVP-mediated exosomal sorting of miR-193a promotes colon cancer
progression. Nat Commun. 8:144482017. View Article : Google Scholar : PubMed/NCBI
|
|
24
|
Edge SB: American Joint Committee on
Cancer: AJCC cancer staging manual. (7th). (New York). Springer.
2010.
|
|
25
|
Livak KJ and Schmittgen TD: Analysis of
relative gene expression data using real-time quantitative PCR and
the 2(-Delta Delta C(T)) method. Methods. 25:402–408. 2001.
View Article : Google Scholar : PubMed/NCBI
|
|
26
|
Sherr CJ: D-type cyclins. Trends Biochem
Sci. 20:187–190. 1995. View Article : Google Scholar : PubMed/NCBI
|
|
27
|
Musgrove EA, Caldon CE, Barraclough J,
Stone A and Sutherland RL: Cyclin D as a therapeutic target in
cancer. Nat Rev Cancer. 11:558–572. 2011. View Article : Google Scholar : PubMed/NCBI
|
|
28
|
Tan N, Dai L, Liu X, Pan G, Chen H, Huang
J and Xu Q: Upregulation of caprin1 expression is associated with
poor prognosis in hepatocellular carcinoma. Pathol Res Pract.
213:1563–1567. 2017. View Article : Google Scholar : PubMed/NCBI
|