Introduction
Preeclampsia (PE) occurs during pregnancy, and
seriously affects the health of pregnant women and fetuses. PE is
the leading cause of increased maternal and fetal mortality
worldwide (1). The incidence rate of
PE is 9.4% in China and 7–12% abroad (2). The pathogenesis of PE is complicated
and has not yet been fully elucidated. In addition, PE is
associated with multiple risk factors. Previous studies have
demonstrated that PE is associated with diabetes (3), obesity (4) and hypertension (5). It is difficult to prevent and treat PE
as there are currently no effective drugs available. PE shares
several pathophysiological mechanisms with cardiovascular diseases
(6), which suggests that statins may
be useful in prevention and early management of PE. Nevertheless,
clinical evidence for the effectiveness of statins in the treatment
of PE is mainly limited to animal models (7). It is generally recognized that the main
clinical manifestations of PE are hypertension and proteinuria;
however, the organs of pregnant women and fetuses may be impaired
to varying degrees, and the majority of pregnant women do not
exhibit clinical symptoms until 20 weeks of gestation (8). Accumulating evidence has confirmed that
the occurrence and development of PE are associated with multiple
genes and cellular pathways; no single factor can explain the
pathogenesis and mechanism of PE (9,10). Due
to the high mortality rates in PE, revealing the causes, underlying
molecular mechanisms, identifying molecular biomarkers and
exploring effective medicine for early diagnosis, prevention and
personalized treatment, are extremely important.
High-throughput sequencing and microarray technology
play critical roles in revealing the pathogenesis of disease, and
the structure and function of the genome (11). High-throughput analysis platforms
combined with bioinformatics analysis can be used to discover key
genes and search for effective drugs for therapy. Luo et al
(12) identified 10 key genes in
patients with PE compared with healthy donors. In addition, a study
by Zhu et al (13) indicated
that there were 11 upregulated microRNAs (miRNAs) and 23
downregulated miRNAs in patients with PE. However, the majority of
previous studies focused on the significance of individual
differentially expressed genes (DEGs) and did not investigate the
association between the DEGs and PE as a whole. Therefore, previous
studies may have missed biologically significant information about
genes and their functions. In addition, few studies focused on
screening of drugs for PE therapy.
In the present study, a gene expression profile
dataset was obtained from the Gene Expression Omnibus (GEO)
database (14). Gene set enrichment
analysis (GSEA) was used to detect whether gene expression in
defined functional groups is a common expression trend, which can
link the microarray data with biological meaning (15). Furthermore, potential drugs for PE
therapy were screened using connectivity map (CMAP) analysis. A
number of studies have applied the CMAP database to disease
treatment and drug development (16–18). The
occurrence of PE is determined by changes in multiple genes.
Therefore, the CMAP can indicate the structure of small molecule
drugs for the treatment of PE. Recently, studies have focused on
the role of gene expression and regulation in the development of PE
(19–23). Therefore, the present study
investigated novel key genes involved in the onset of PE. The aim
of this study was to provide a novel perspective for further
exploring the pathogenesis, treatment and prevention of PE.
Materials and methods
Data source
Transcriptome expression profiles of normotensive
pregnant woman and patients with PE were obtained from the
microarray dataset GSE60438 (24)
from the GEO database (http://www.ncbi.nlm.nih.gov/geo/). The dataset was
based on the GPL6884 platform (Illumina HumanWG-6 v3.0 Gene
Expression BeadChip; Illumina, Inc.), which contains probe
information, including cDNAs, oligonucleotides and open reading
frames. The dataset consists of 48 human samples, including 23
normotensive samples and 25 PE samples. The Bioconductor limma
package (version 3.11) for R (version 4.0; http://www.bioconductor.org/packages/release/bioc/html/limma.html)
was used to standardize, clean and convert the matrix data.
Finally, the limma package was also used to identify DEGs (25). P<0.05 and |fold-change| ≥1.2 were
applied to screen DEGs in PE. The gplots package (version 3.0.3)
was used to analyze the data and draw a heatmap plot (https://github.com/talgalili/gplots).
Functional annotation of DEGs
Functional annotation of DEGs consisted of Gene
Ontology (GO) analysis of biological process (BP) terms (26) and Kyoto Encyclopedia of Genes and
Genomes (KEGG) pathway enrichment analysis (27). GO and KEGG pathway databases were
extensively used in analyzing the BPs and cellular signaling
pathways that DEGs were involved in. The Database for Annotation
Visualization and Integrated Discovery online tool (version 6.8;
http://david.ncifcrf.gov/) was used to
perform analysis of GO BP terms and KEGG pathway enrichment of DEGs
in PE (28). Significantly enriched
pathways and GO-BP terms with P<0.01 were focused on in the
present study.
GSEA analysis of DEGs
GSEA is a tool for genome-wide expression profile
data analysis that detects gene sets rather than individual gene
expression changes. Therefore, GSEA could identify genes with small
differences in expression and important functions, making the
analysis more accurate and comprehensive (15). GSEA (version 2; http://software.broadinstitute.org/gsea/index.jsp) was
used to determine whether an a priori defined set of genes
enriched in GO BP terms and KEGG pathways shows significant
differences between gene expression data of normotensive patients
and patients with PE (29).
Protein-protein interaction (PPI)
network analysis
STRING (version 11.0; http://string-db.org/) is a database for searching
interactions of known and predicted proteins, which was used to
study the molecular mechanism of disease and investigate novel drug
targets. In the present study, a PPI network of DEGs was extracted
using the STRING tool. The PPI network was constructed using
Cytoscape (version 3.4.0; http://cytoscape.org/). Only experimentally validated
PPIs with a combined score >0.4 were selected to construct the
PPI network. Next, the hub genes associated with PE were identified
in networks using CytoHubba (version 0.1; http://www.cytoscape.org) (30). CytoHubba provided a user-friendly
interface to explore important nodes in biological networks. The
Molecular Complex Detection (MCODE; version 1.4.2) (31) plugin in Cytoscape was then utilized
to screen the top three modules in the PPI network. Parameters were
set as follows: Degree cutoff, 2; node score cutoff, 0.2; k-core,
2; and maximum depth, 100.
CMAP analysis
CMAP (http://www.broadinstitute.org/cmap/) is a database of
small molecule drugs, gene expression and disease-related
biological applications (32). CMAP
contains the gene expression profiles of breast cancer MCF7 cells,
prostate carcinoma PC3 cells and acute myeloid leukemia HL60 cells
treated with different drugs. The CMAP database contains 1,309
small molecule drugs and >7,000 gene expression profiles. Each
small molecule drug treated different cells at different
concentrations and time points. The gene expression profiles were
analyzed to distinguish positive and negative regulatory gene
groups. The score was based on the similarity of gene expression
profiles between cells treated with small molecule drugs and
disease gene expression profiles. Using CMAP analysis, gene
expression profiles were compared to identify the drugs that were
highly related to diseases, to deduce the main chemical structures
of most drug molecules, and to summarize the possible mechanisms of
drug molecules. Through CMAP analysis of DEGs in PE, small molecule
drugs that could be used to treat PE were investigated. The cut-off
value was defined as |connectivity score| >0.7 to identify
candidate small molecule drugs associated with PE.
Extraction of tissue RNA and detection
of expression of key genes by reverse transcription-quantitative
(RT-q)PCR
A total of 38 placenta specimens were collected
between March 2018 and December 2018, including 28 specimens from
patients with PE and 10 from healthy pregnant women at the
Department of Gynecology and Obstetrics, Affiliated Hospital of
Jiangsu University (Zhenjiang, China). The diagnosis of PE was
given according to the guidelines for the diagnosis and treatment
of hypertensive disorders in pregnancy (2015) from the Group of
Hypertensive Diseases in Pregnancy, the Society of Obstetrics and
Gynecology of the Chinese Medical Association (33). The patients with PE did not suffer
from any other disease. The age range of patients with PE and
healthy controls was 20–45 years old. The researchers obtained
verbal informed consent before collecting patient samples. Written
informed consent was waived by the Ethics Committee of the
Affiliated Hospital of Jiangsu University. The experiment was
approved by the Ethics Committee of the Affiliated Hospital of
Jiangsu University (approval no. 20170415). For evaluation of the
expression of key genes in the placenta of patients and healthy
women, tissue RNA was extracted using TRIzol®
(Invitrogen; Thermo Fisher Scientific, Inc.). Total RNA was reverse
transcribed into cDNA using PrimeScript™ RT Master Mix (Takara
Biotechnology Co., Ltd.) at 42°C for 30 min. qPCR was carried out
using TB Green™ Fast qPCR mix on a CFX96™ Real-Time PCR Detection
system (Bio-Rad Laboratories, Inc.). For the analysis of gene
expression, quantification of relative mRNA levels was carried out
using the 2−ΔΔCq method (34). Values were normalized to endogenous
β-actin expression. Each experiment was independently repeated
three times. All primers used for RT-qPCR are listed in Table I. The thermocycling conditions were
as follows: 95°C for 30 sec, followed by 40 cycles of 95°C for 5
sec and 60°C for 30 sec.
 | Table I.Primer sequences of hub genes and the
annealing temperature used for reverse transcription-quantitative
PCR. |
Table I.
Primer sequences of hub genes and the
annealing temperature used for reverse transcription-quantitative
PCR.
| Primer | Primer sequence
(5′-3′) | Annealing
temperature (°C) |
|---|
| PSMD14 | F:
CAGATGCTCCTGCAGTGGAC | 61.5 |
|
| R:
AACAACCATCTCCGGCCTTC |
|
| PTGES3 | F:
ACGTTCATTCTCCGTCCTCG | 56.7 |
|
| R:
AAGCAGGCTGCATTGTGAAC |
|
| UQCRC2 | F:
ACGCAAAAAGCAGTGACGTA | 60.3 |
|
| R:
CCGGCTCTGGTTAGTAGCTT |
|
| SUMO2 | F:
GCGGACCTGGTACCTCTTTT | 53.6 |
|
| R:
TCCAACTGTGCAGGTGTGTC |
|
| ACTR3 | F:
TTCTTGCTACTGCTTCGGCTT | 61.1 |
|
| R:
AGCTTGATCACCCACTTTTGC |
|
| β-actin | F:
AGCGAGCATCCCCCAAAGTT | 56 |
|
| R:
GGGCACGAAGGCTCATCATT |
|
Statistical analysis
In this experiment, the expression of genes in
patients with PE and healthy controls of the GSE60438 dataset were
analyzed with unpaired Student's t-test using the limma package for
R. GO and KEGG pathway analyses were compared using Fisher's exact
test. The false discovery rate was controlled within the
appropriate range using the Benjamini-Hochberg method. Differences
in the mRNA expression of proteasome 26S subunit, non-ATPase 14
(PSMD14), ubiquinol-cytochrome c reductase core protein 2
(UQCRC2) and prostaglandin E synthase 3 (PTGES3) between PE and
healthy controls were compared using unpaired Student's t-test.
Data were presented as mean ± SD. P<0.05 was considered to
indicate a statistically significant difference. The software used
for analysis was GraphPad Prism 7 (GraphPad Software, Inc.).
Results
Identification of DEGs involved in
PE
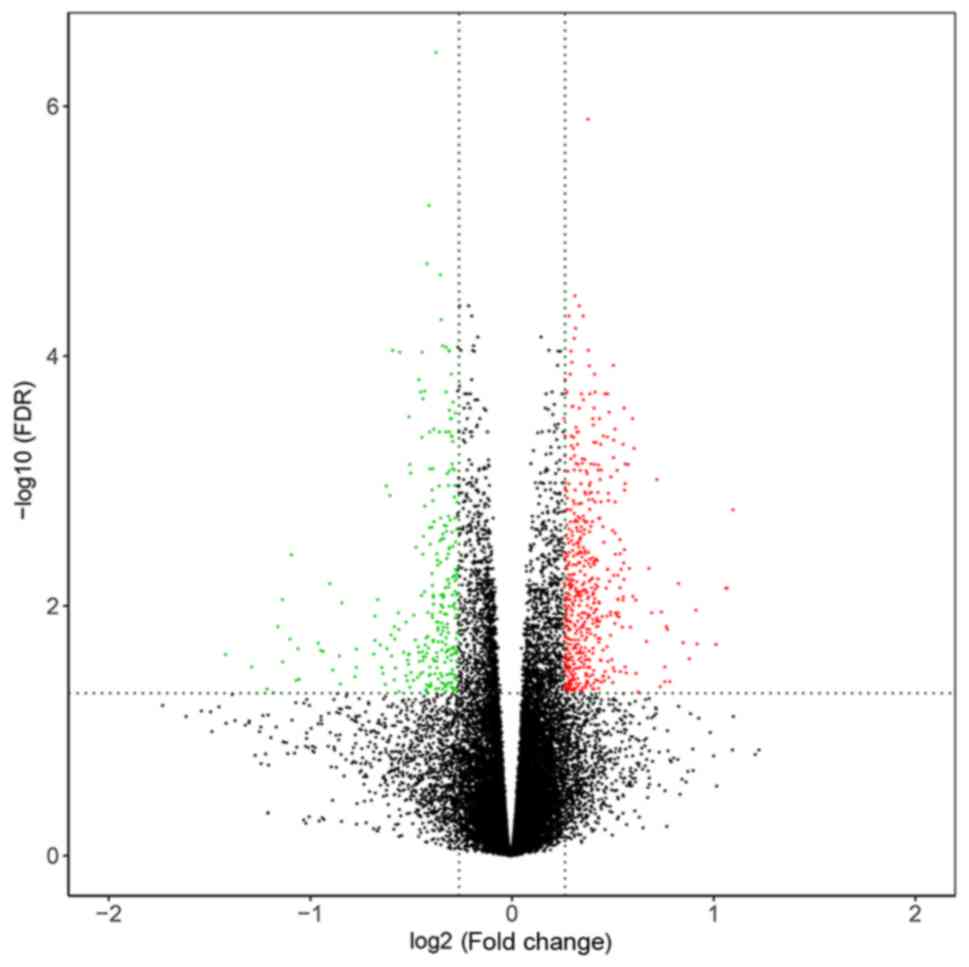
By performing data normalization and comparison, 441
DEGs were identified in PE based on the cut-off values (P<0.05
and |fold-change| ≥1.2). A volcano plot of DEGs could significantly
discriminate between patients with PE and normotensive pregnant
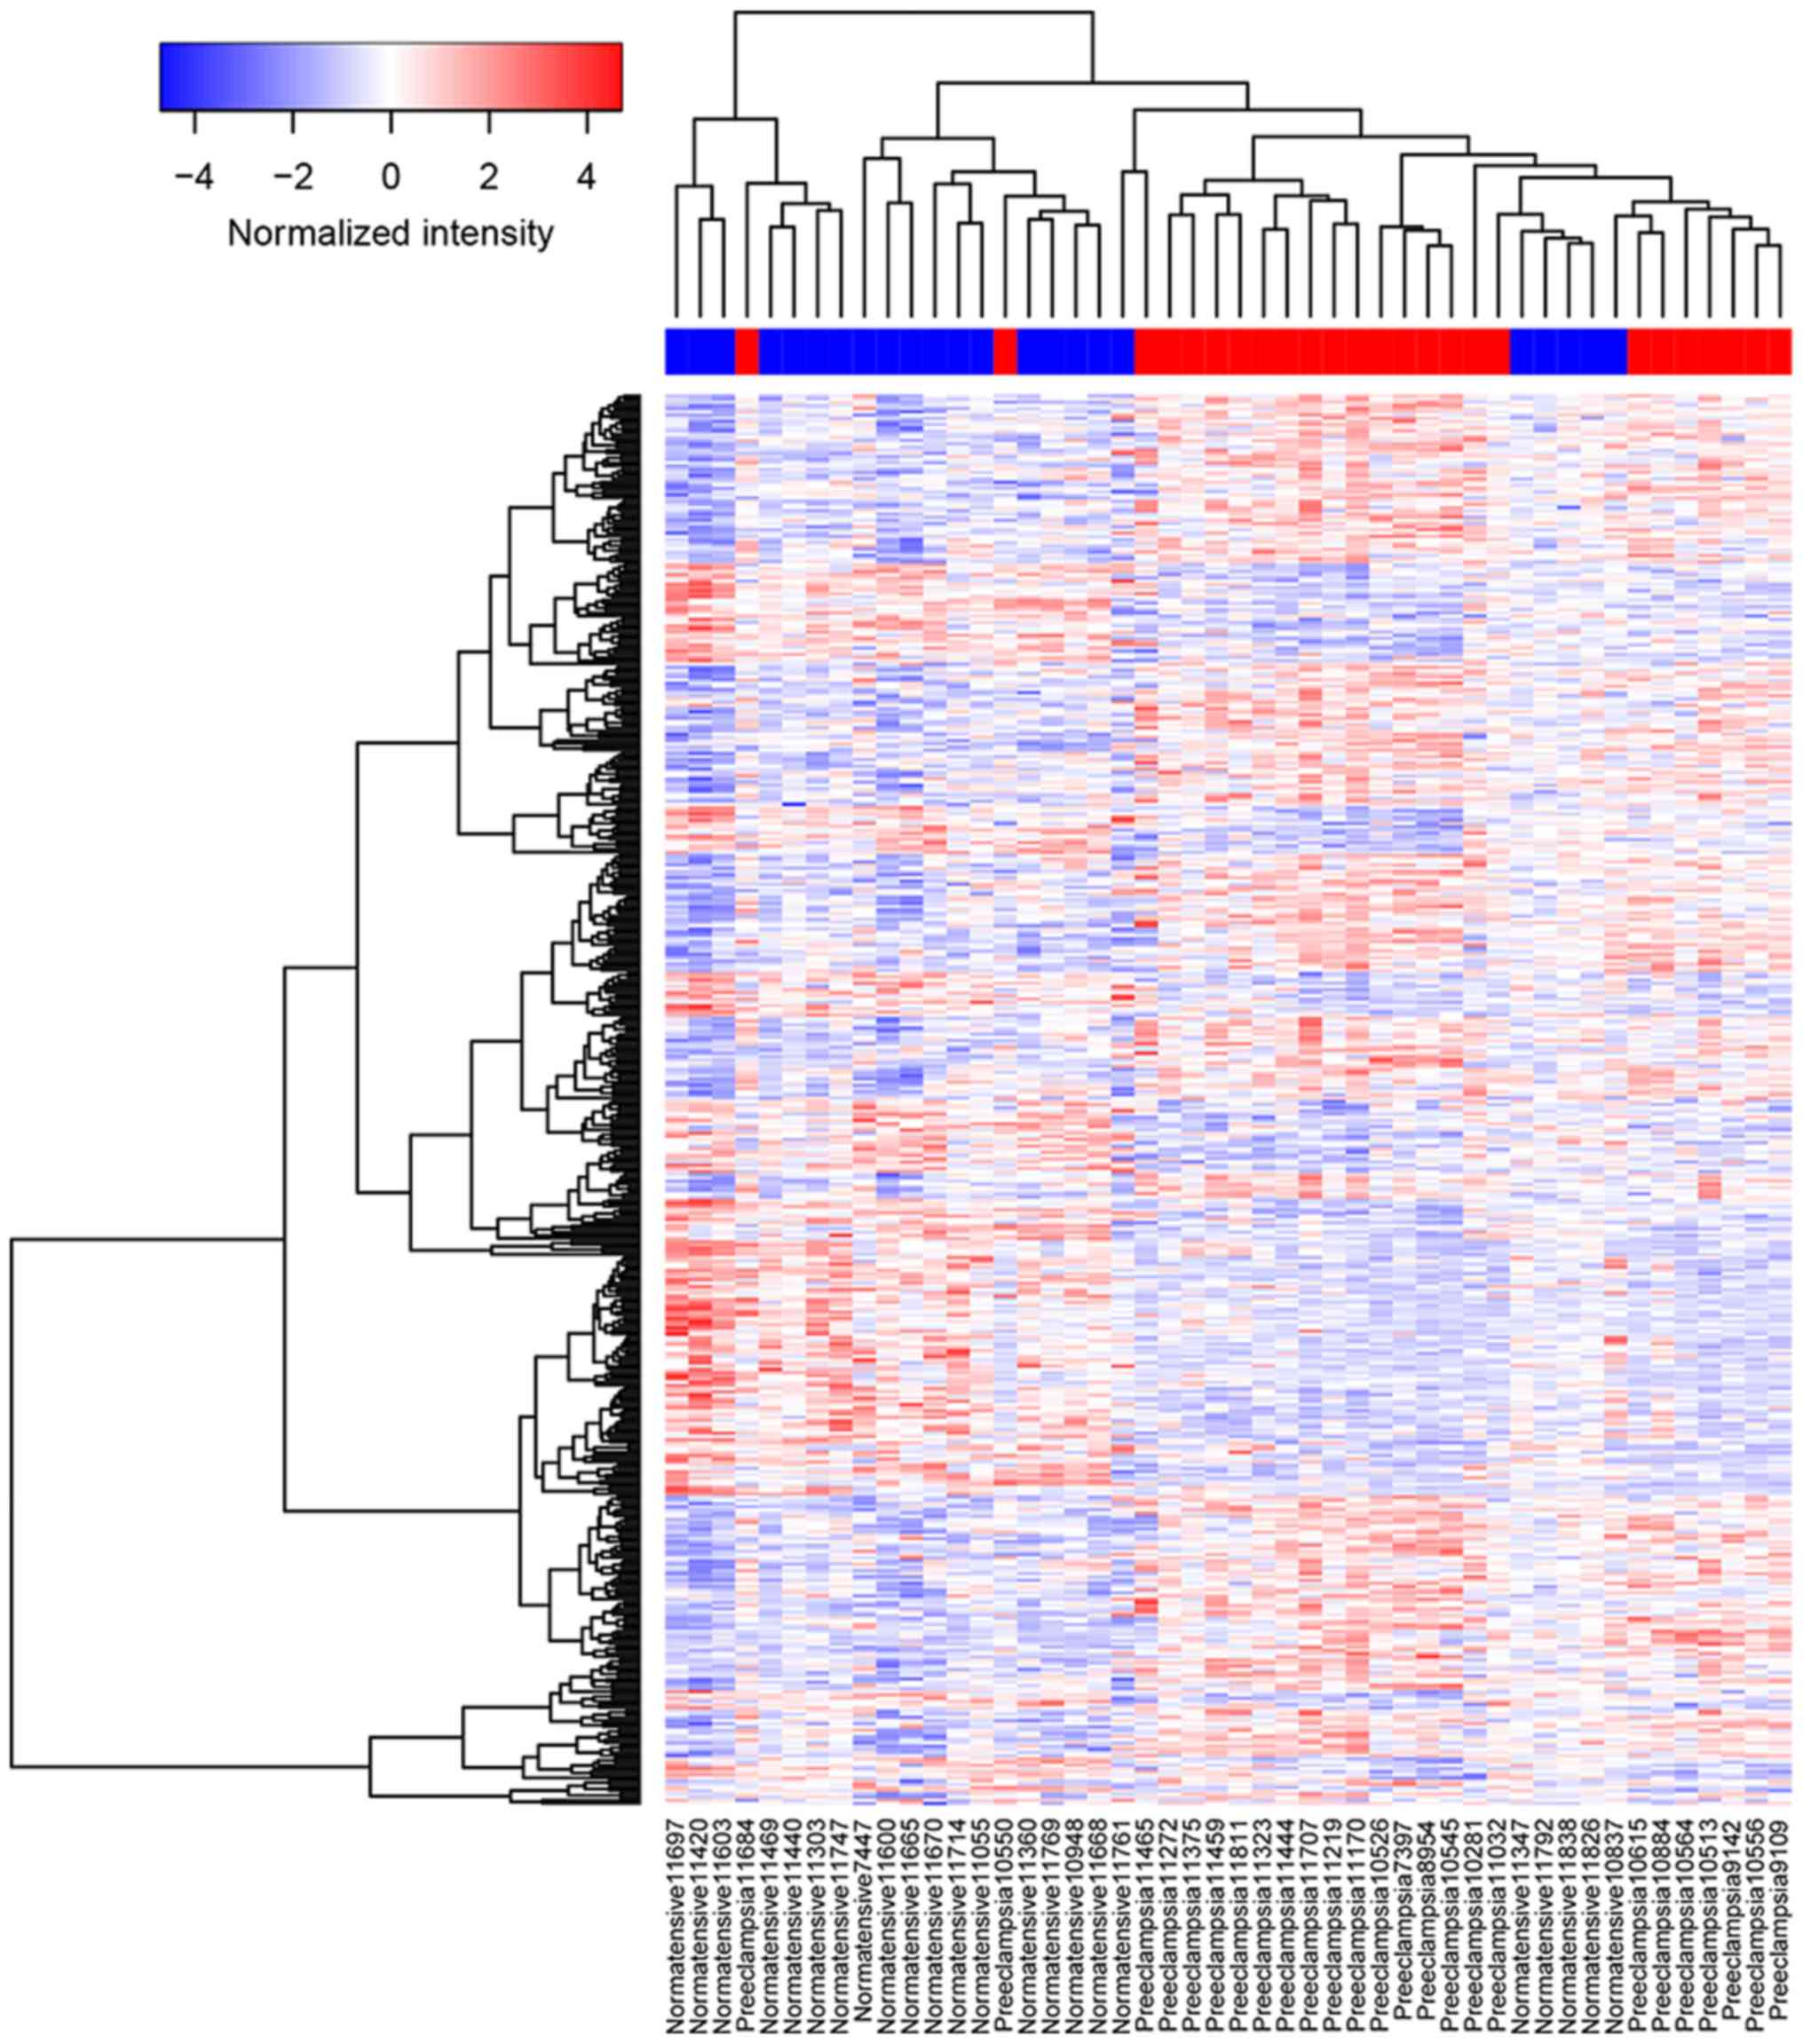
woman (Fig. 1). A heatmap plot
showed the clustering of DEGs in PE and normotensive pregnant woman
(Fig. 2).
GO BP and KEGG pathway enrichment
analysis of the DEGs
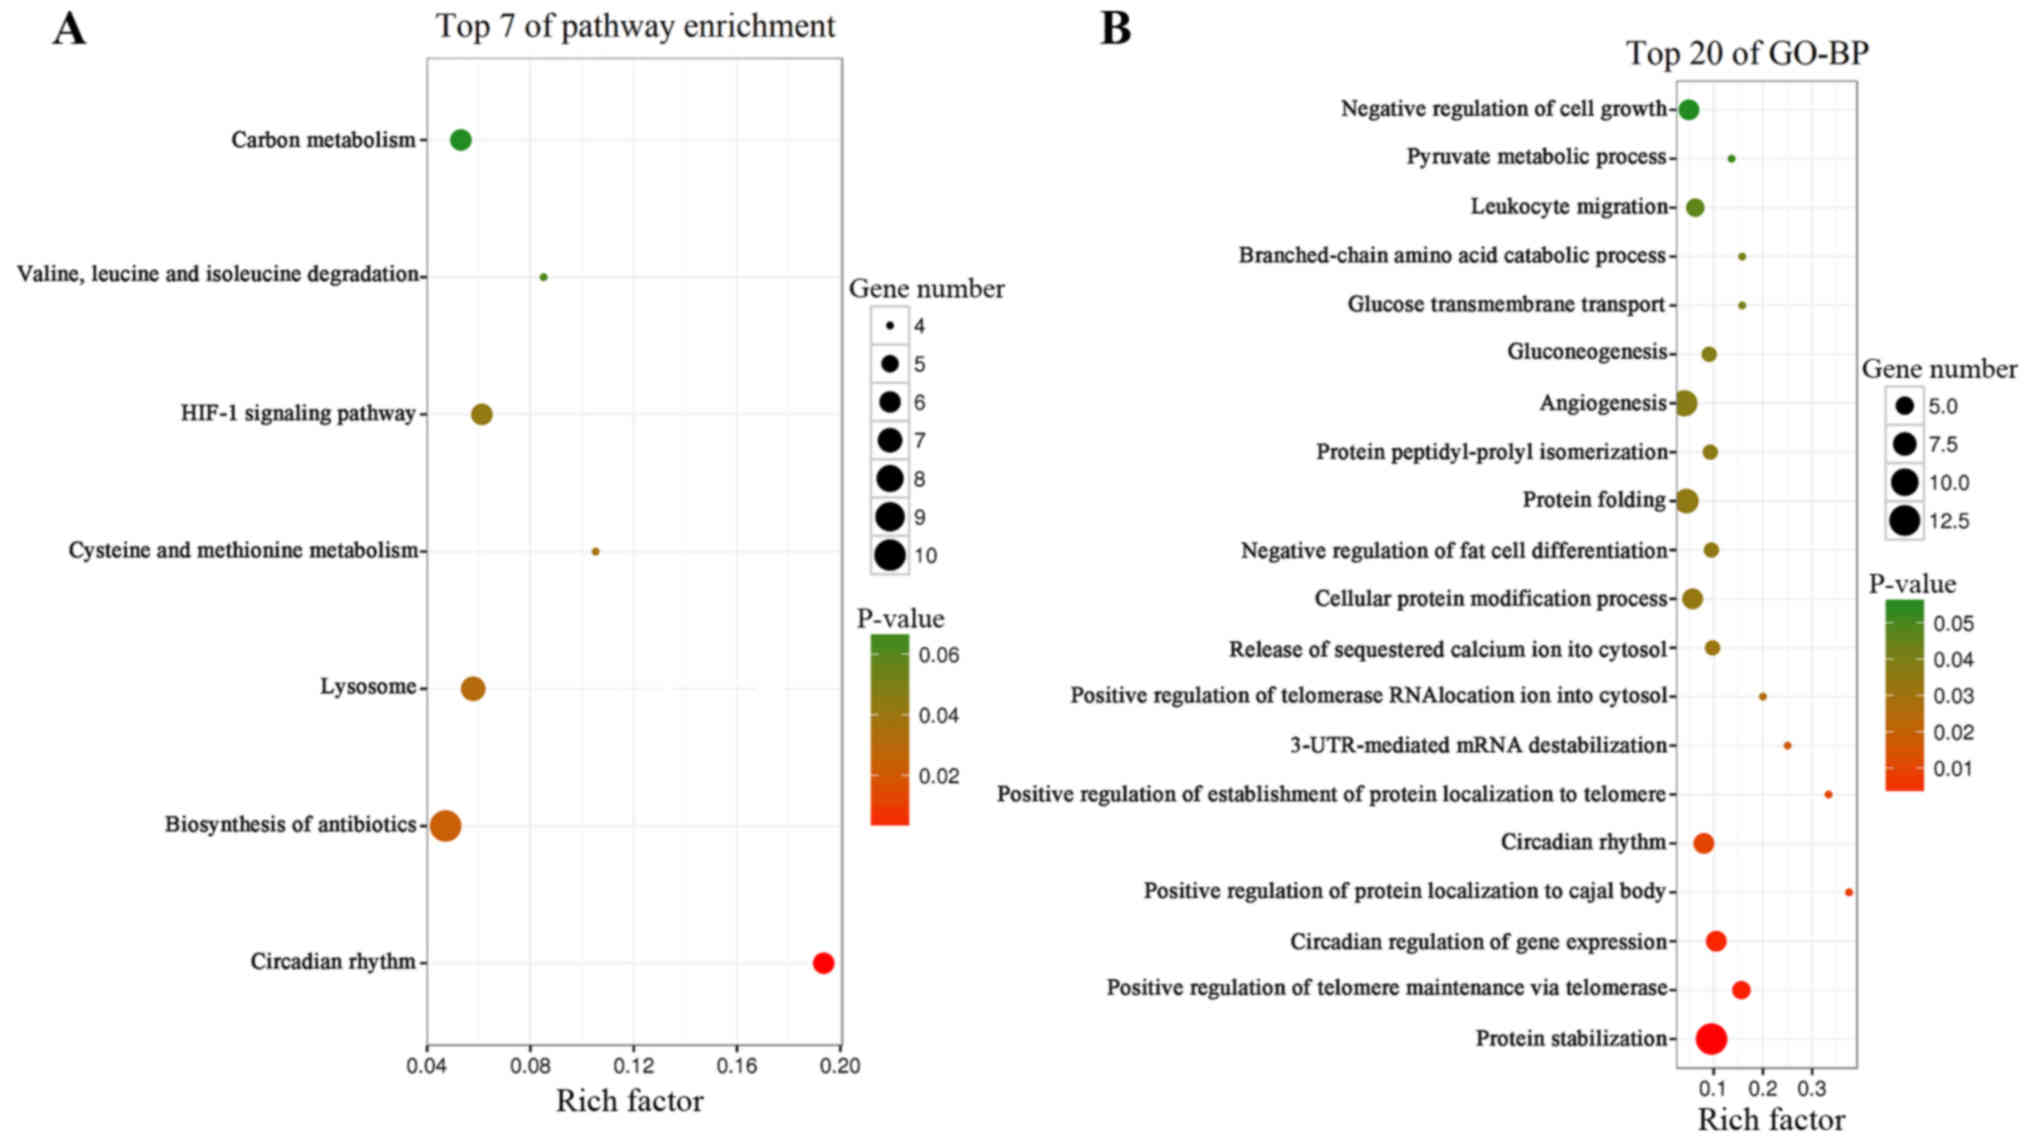
The top seven KEGG pathways enriched with DEGs in PE
are presented in Fig. 3A. The DEGs
were enriched in ‘circadian rhythm’. BP terms that were enriched
with DEGs were ‘protein stabilization’, ‘positive regulation of
telomere maintenance via telomerase,’ ‘circadian regulation of gene
expression’ and ‘circadian rhythm’ (Fig.
3B).
GSEA in PE
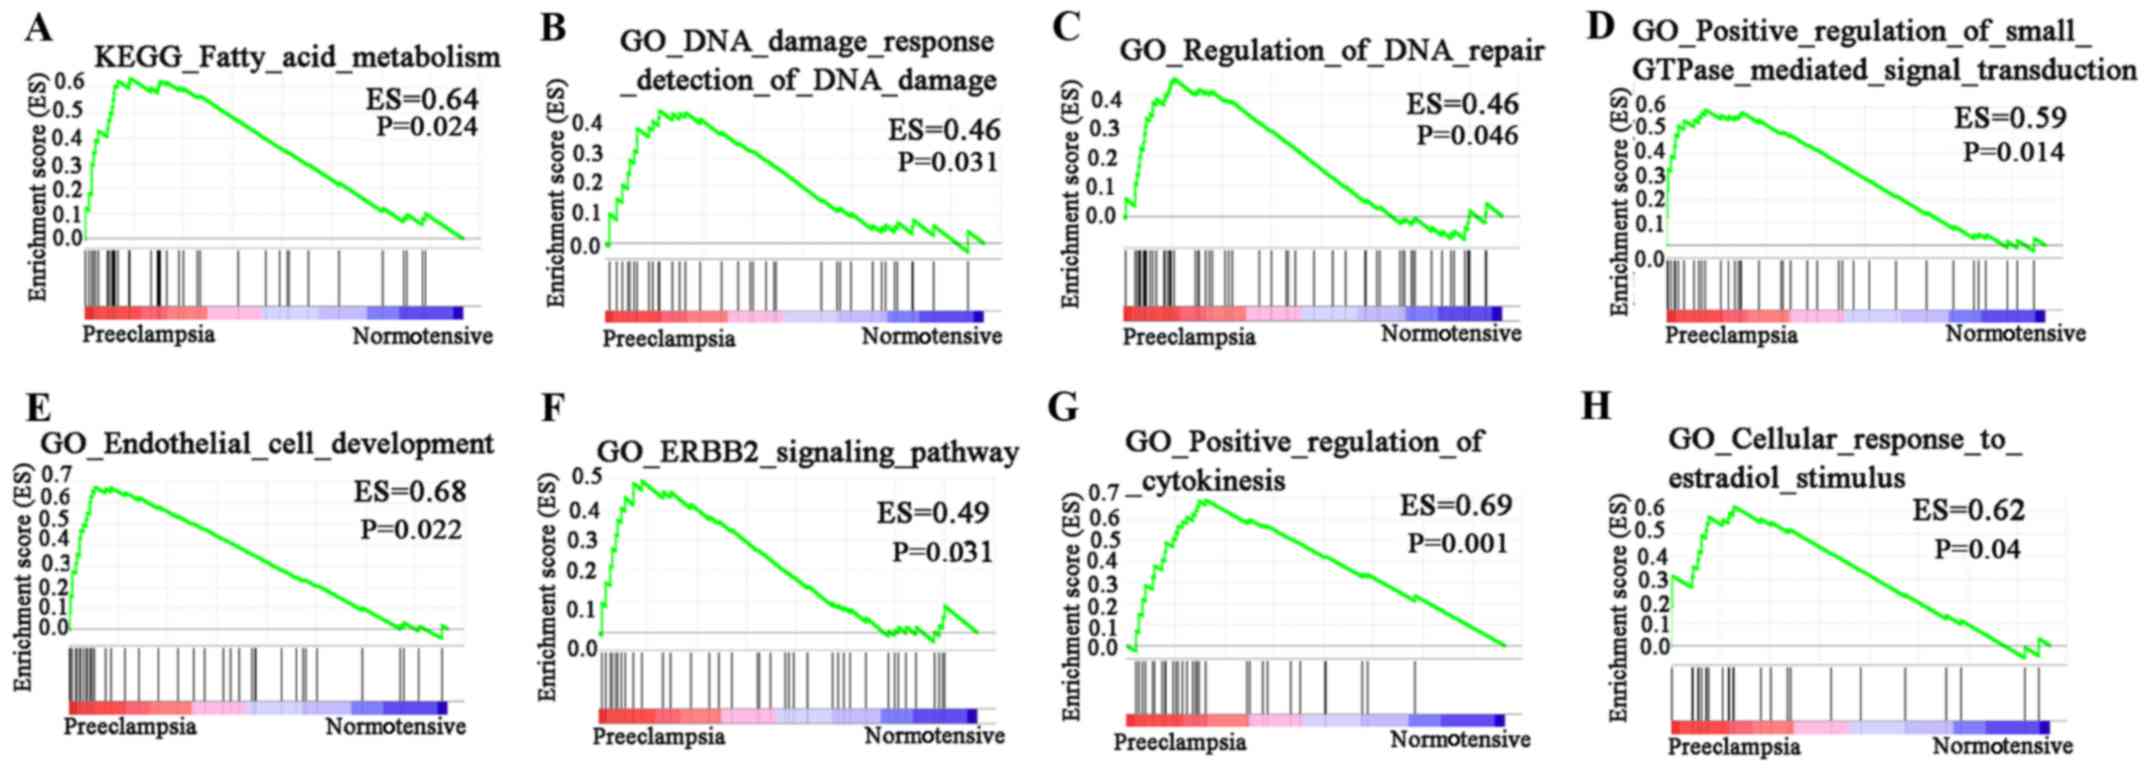
In GO BP analysis of the dataset, 1,706 signaling
pathways were upregulated. There were 57 signaling pathways with
P<0.05. Of these, four had P<0.01. In KEGG pathway analysis
of the dataset, 96 signaling pathways were upregulated. Of these,
one had P<0.01 (Fig. 4). KEGG
results revealed that DEGs were significantly enriched in ‘fatty
acid metabolism’. GO results revealed that DEGs were enriched in
‘DNA damage response detection of DNA damage’, ‘regulation of DNA
repair’, ‘positive regulation of small GTPase mediated signal
transduction’, ‘endothelial cell development’, ‘ERBB2 signaling
pathway’, ‘positive regulation of cytokinesis’ and ‘cellular
response to estradiol stimulus’.
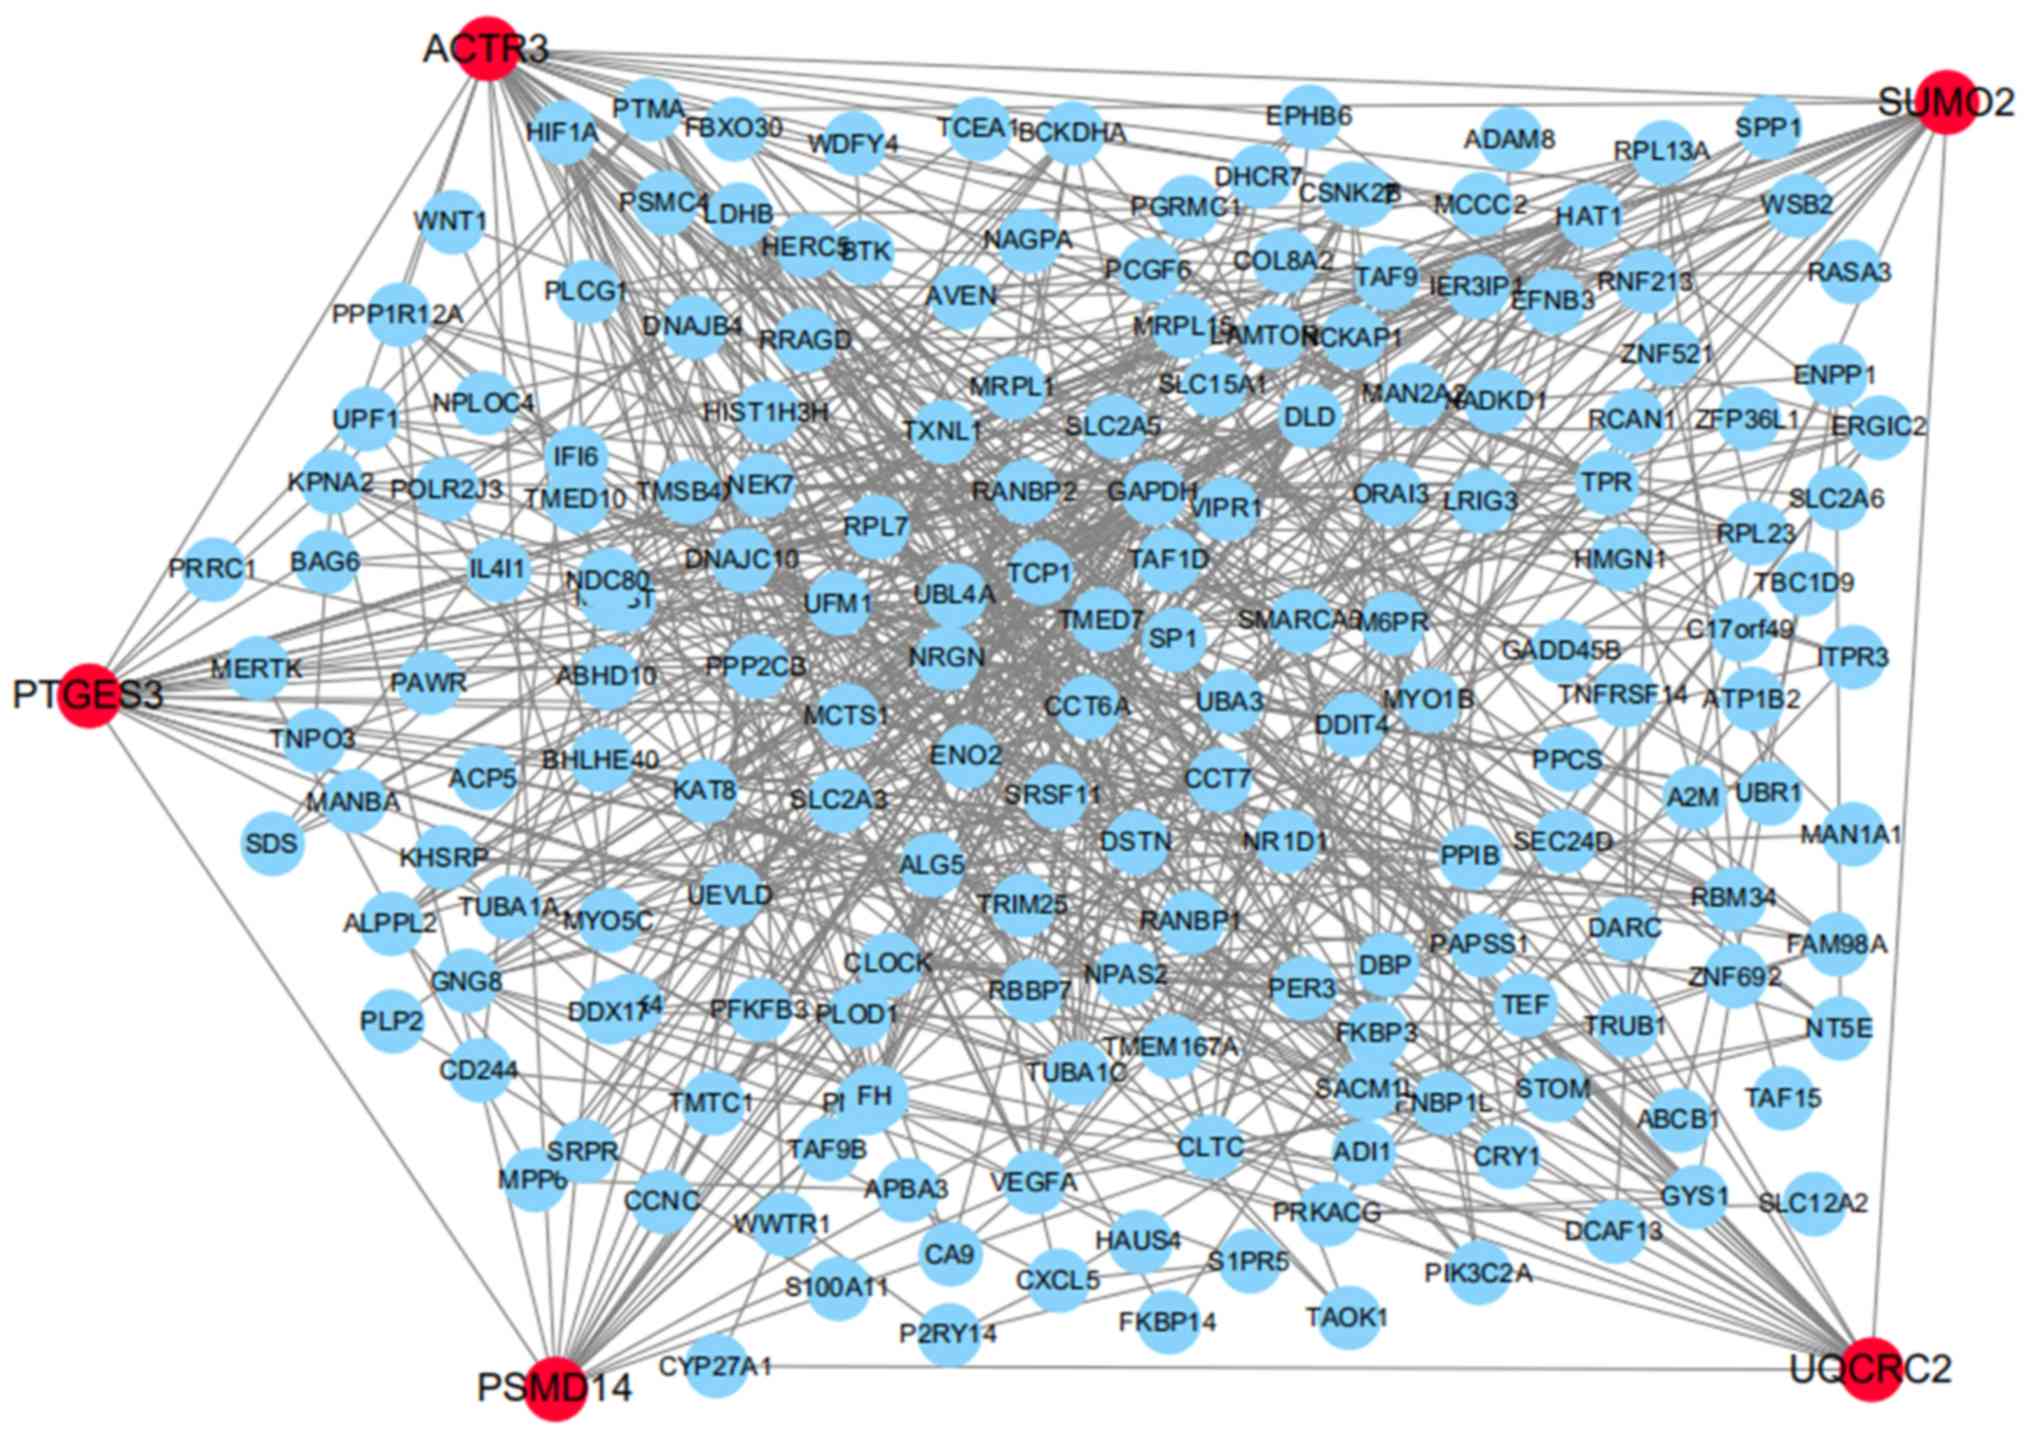
Identification of key genes of PE
The PPI network presented 590 experimentally
validated interactions with a combined score >0.4. In the
present study, the top five genes with higher degrees were screened
as hub genes in the PPI network using CytoHubba, including PSMD14,
PTGES3, UQCRC2, small ubiquitin like modifier 2 and actin-related
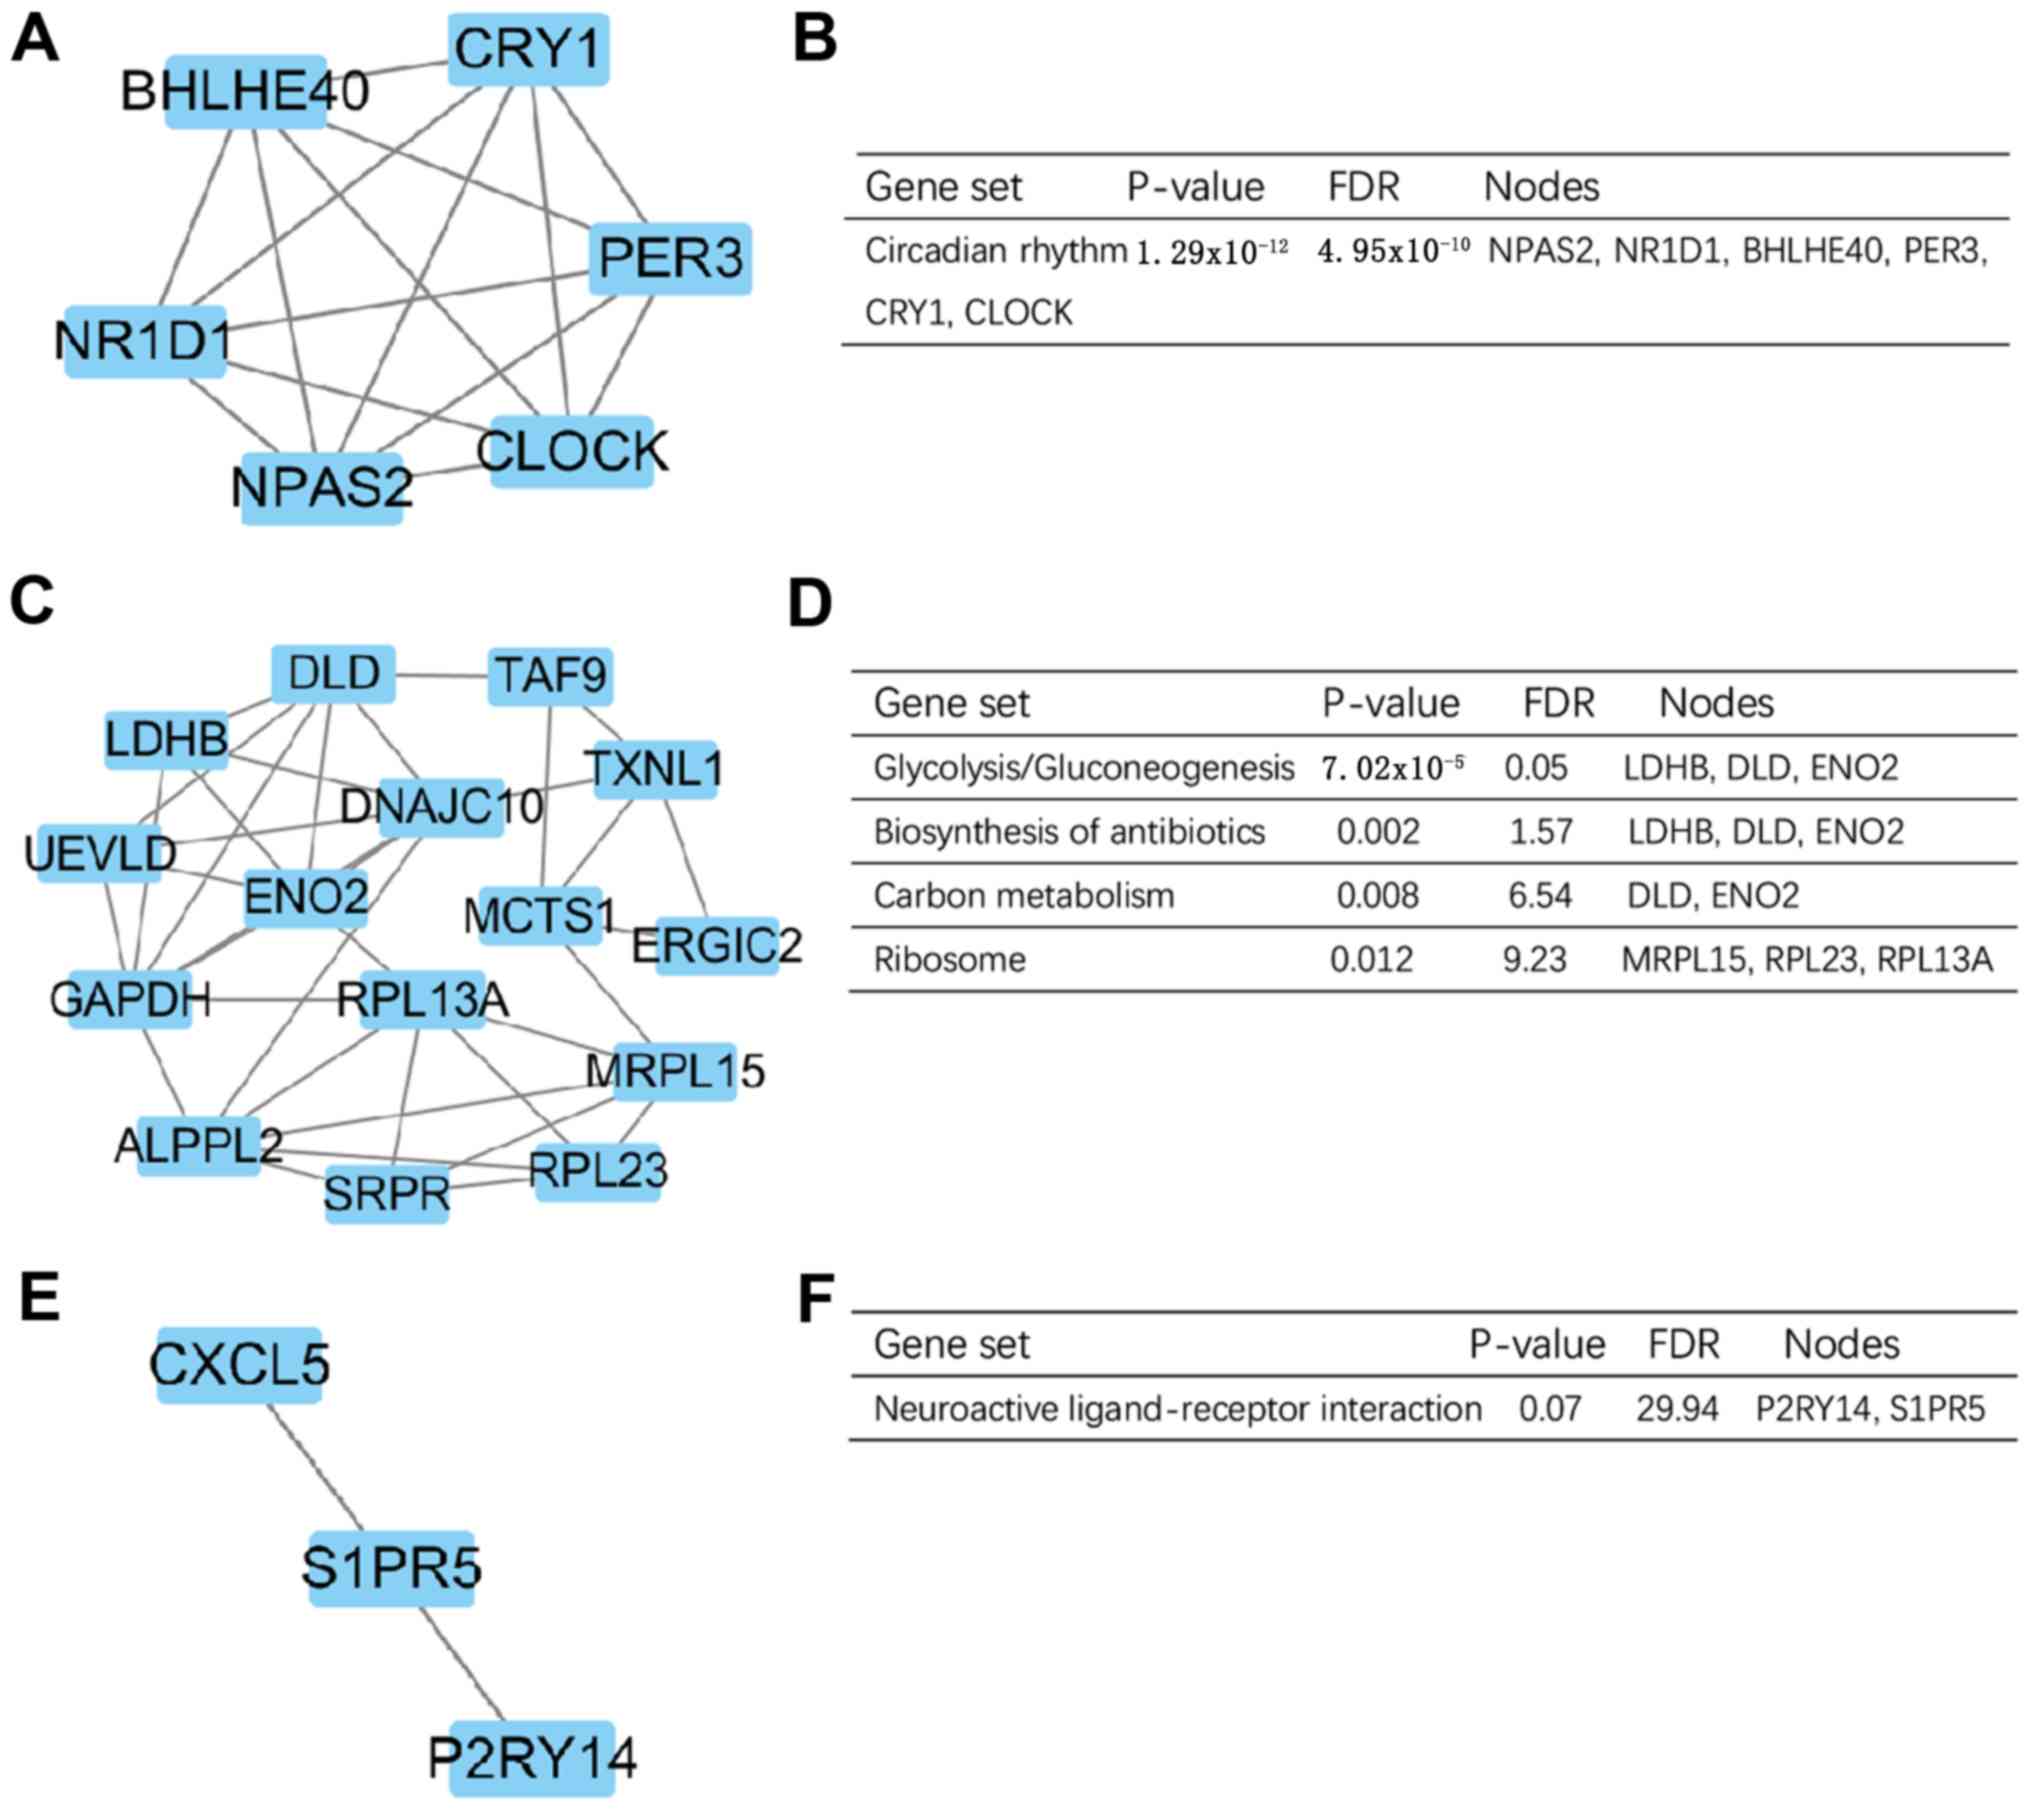
protein 3 (Fig. 5). On the basis of
the degree of importance, the three most significant modules were
screened from the PPI network using MCODE (Fig. 6A, C and E). The KEGG pathway
enrichment analysis demonstrated that the most significant modules
were primarily associated with ‘circadian rhythm’,
‘glycolysis/gluconeogenesis’, ‘carbon metabolism’ and ‘neuroactive
ligand-receptor interaction’ (Fig. 6B, D
and F).
CMAP analysis of the DEGs
The gene expression profiles of MCF7 breast cancer
cells, PC3 prostate carcinoma cells and HL60 acute myeloid leukemia
cells treated with drugs were divided into positive and negative
regulatory gene groups. After eliminating the invalid probes
(|connectivity score| <0.7), 169 positive regulatory genes and
253 negative regulatory genes were identified. Additionally, drug
predictive results similar to and opposite to PE in gene expression
after drug treatment were obtained. According to drug prediction,
20 drugs produced similar gene expression patterns to PE. In
Table II, drugs that may aggravate
PE are presented. There were also 20 antipsychotic drugs,
hypotensor and diuretics identified that may induce gene expression
contrary to PE and may have improved effects on the treatment of PE
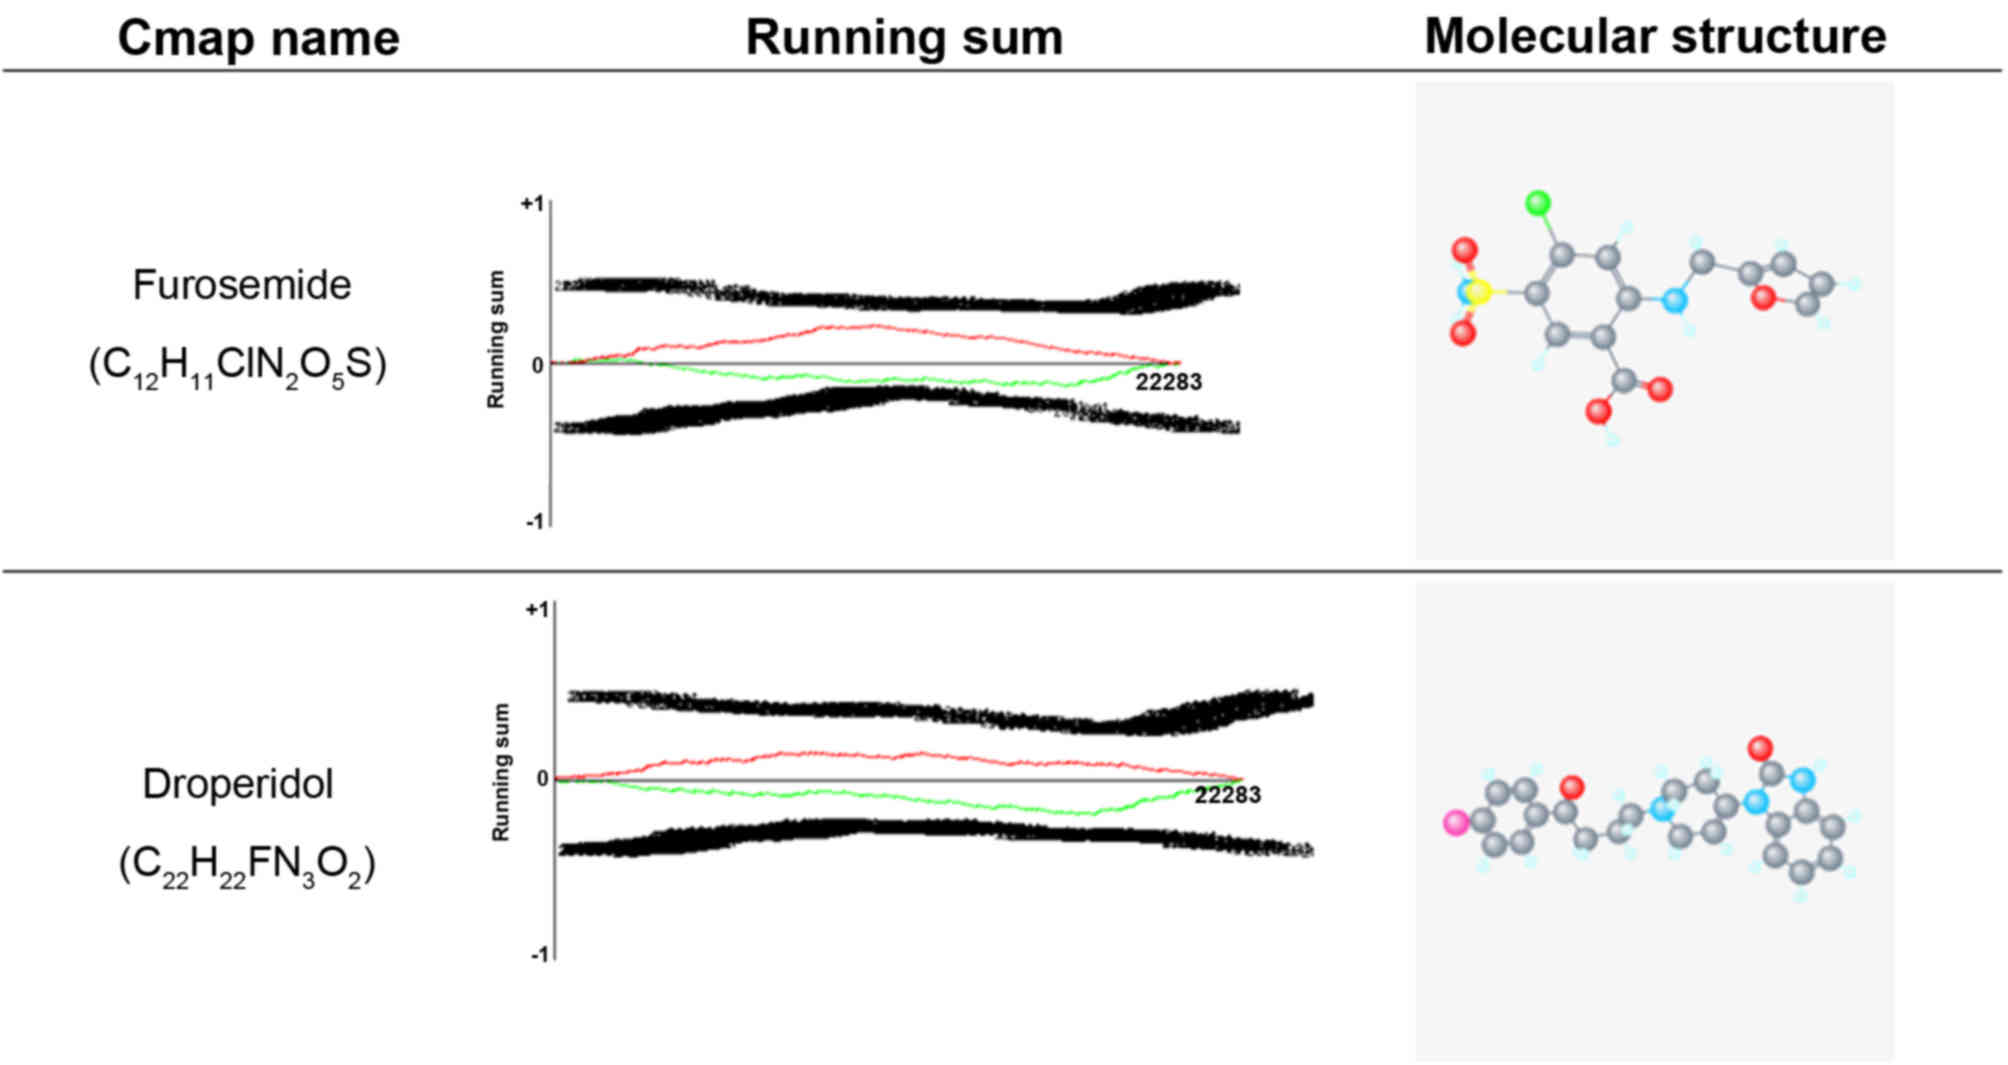
(Table III). Excluding prohibited
medicines for pregnant women, furosemide and droperidol were
selected based on higher negative scores. The molecular structures
and running sums of furosemide and droperidol are shown in Fig. 7. The running sum was based on the
genomic expression profile of a drug, with which all the CMAP
genomic expression profiles were compared. Finally, the drugs with
the highest score of positive association (closest to +1) were
considered to be potentially associated with the reference drug at
the downstream gene regulation and clinical drug response
levels.
| Table II.Drug prediction results similar to
preeclampsia in gene expression after drug treatment. |
Table II.
Drug prediction results similar to
preeclampsia in gene expression after drug treatment.
| Rank | Batch | CMAP name | Dose (µM) | Cell | Score | Up | Down | Instance_ID |
|---|
| 1 | 694 | Nystatin | 4 | MCF7 | 1 | 0.236 | −0.254 | 4807 |
| 2 | 1,068 | 0198306-0000 | 10 | MCF7 | 0.922 | 0.193 | −0.259 | 7064 |
| 3 | 743 | Nocodazole | 13 | MCF7 | 0.919 | 0.212 | −0.239 | 6793 |
| 4 | 693 | R-atenolol | 15 | PC3 | 0.894 | 0.17 | −0.268 | 4259 |
| 5 | 695 |
Cyclopenthiazide | 11 | MCF7 | 0.879 | 0.183 | −0.248 | 4813 |
| 6 | 704 | Sulpiride | 12 | PC3 | 0.865 | 0.143 | −0.281 | 4566 |
| 7 | 756 | Nomegestrol | 11 | MCF7 | 0.846 | 0.196 | −0.219 | 6525 |
| 8 | 745 | Dizocilpine | 12 | MCF7 | 0.844 | 0.153 | −0.261 | 6223 |
| 9 | 1,082 | Irinotecan | 100 | MCF7 | 0.843 | 0.191 | −0.222 | 7498 |
| 10 | 744 | Clobetasol | 9 | MCF7 | 0.84 | 0.198 | −0.214 | 6835 |
| 11 | 702 | Eucatropine | 12 | PC3 | 0.838 | 0.171 | −0.24 | 4316 |
| 12 | 693 | Picrotoxinin | 14 | PC3 | 0.836 | 0.182 | −0.229 | 4260 |
| 13 | 695 | Simvastatin | 10 | MCF7 | 0.828 | 0.158 | −0.248 | 4828 |
| 14 | 701 | Phenformin | 17 | PC3 | 0.823 | 0.19 | −0.213 | 4283 |
| 15 | 702 | Promazine | 12 | PC3 | 0.814 | 0.157 | −0.243 | 4308 |
| 16 | 694 | Benperidol | 10 | MCF7 | 0.813 | 0.13 | −0.269 | 4781 |
| 17 | 718 | Allantoin | 25 | PC3 | 0.807 | 0.175 | −0.221 | 5052 |
| 18 | 693 | Sulfaguanidine | 19 | PC3 | 0.806 | 0.213 | −0.183 | 4257 |
| 19 | 694 | Mestranol | 13 | MCF7 | 0.801 | 0.126 | −0.267 | 4792 |
| 20 | 756 | Alfaxalone | 12 | MCF7 | 0.801 | 0.172 | −0.22 | 6514 |
| Table III.Drug prediction results opposite to
preeclampsia in gene expression after drug treatment. |
Table III.
Drug prediction results opposite to
preeclampsia in gene expression after drug treatment.
| Rank | Batch | CMAP name | Dose (µM) | Cell | Score | Up | Down | Instance_ID |
|---|
| 1 | 731 |
Tetrahydroalstonine | 11 | PC3 | −0.763 | −0.135 | 0.246 | 5728 |
| 2 | 694 | Zardaverine | 15 | MCF7 | −0.768 | −0.137 | 0.246 | 4793 |
| 3 | 692 | Idoxuridine | 11 | PC3 | −0.769 | −0.168 | 0.216 | 4200 |
| 4 | 1,059 | PF-00562151-00 | 10 | MCF7 | −0.773 | −0.154 | 0.232 | 6912 |
| 5 | 694 | Pyrimethamine | 16 | MCF7 | −0.781 | −0.14 | 0.249 | 4779 |
| 6 | 692 | Epitiostanol | 13 | PC3 | −0.782 | −0.141 | 0.248 | 4204 |
| 7 | 706 | Prestwick-984 | 9 | MCF7 | −0.782 | −0.174 | 0.216 | 4948 |
| 8 | 706 | Retrorsine | 11 | MCF7 | −0.783 | −0.175 | 0.215 | 4946 |
| 9 | 694 | Gabexate | 10 | MCF7 | −0.784 | −0.176 | 0.215 | 4804 |
| 10 | 692 | Naftopidil | 9 | PC3 | −0.788 | −0.165 | 0.228 | 4193 |
| 11 | 1,059 | SB-202190 | 1 | MCF7 | −0.791 | −0.145 | 0.25 | 6909 |
| 12 | 630 | Droperidol | 11 | HL60 | −0.791 | −0.221 | 0.173 | 1290 |
| 13 | 690 | Boldine | 12 | MCF7 | −0.807 | −0.165 | 0.238 | 4122 |
| 14 | 694 | Zalcitabine | 19 | MCF7 | −0.817 | −0.161 | 0.247 | 4799 |
| 15 | 677 | Iopanoic acid | 7 | MCF7 | −0.818 | −0.174 | 0.234 | 3527 |
| 16 | 692 | Molindone | 13 | PC3 | −0.838 | −0.192 | 0.226 | 4199 |
| 17 | 693 | Amprolium | 13 | PC3 | −0.855 | −0.193 | 0.233 | 4241 |
| 18 | 702 | 0317956-0000 | 10 | PC3 | −0.859 | −0.222 | 0.206 | 4331 |
| 19 | 728 | Furosemide | 12 | PC3 | −0.86 | −0.162 | 0.267 | 4503 |
| 20 | 694 | Meptazinol | 15 | MCF7 | −1 | −0.245 | 0.254 | 4774 |
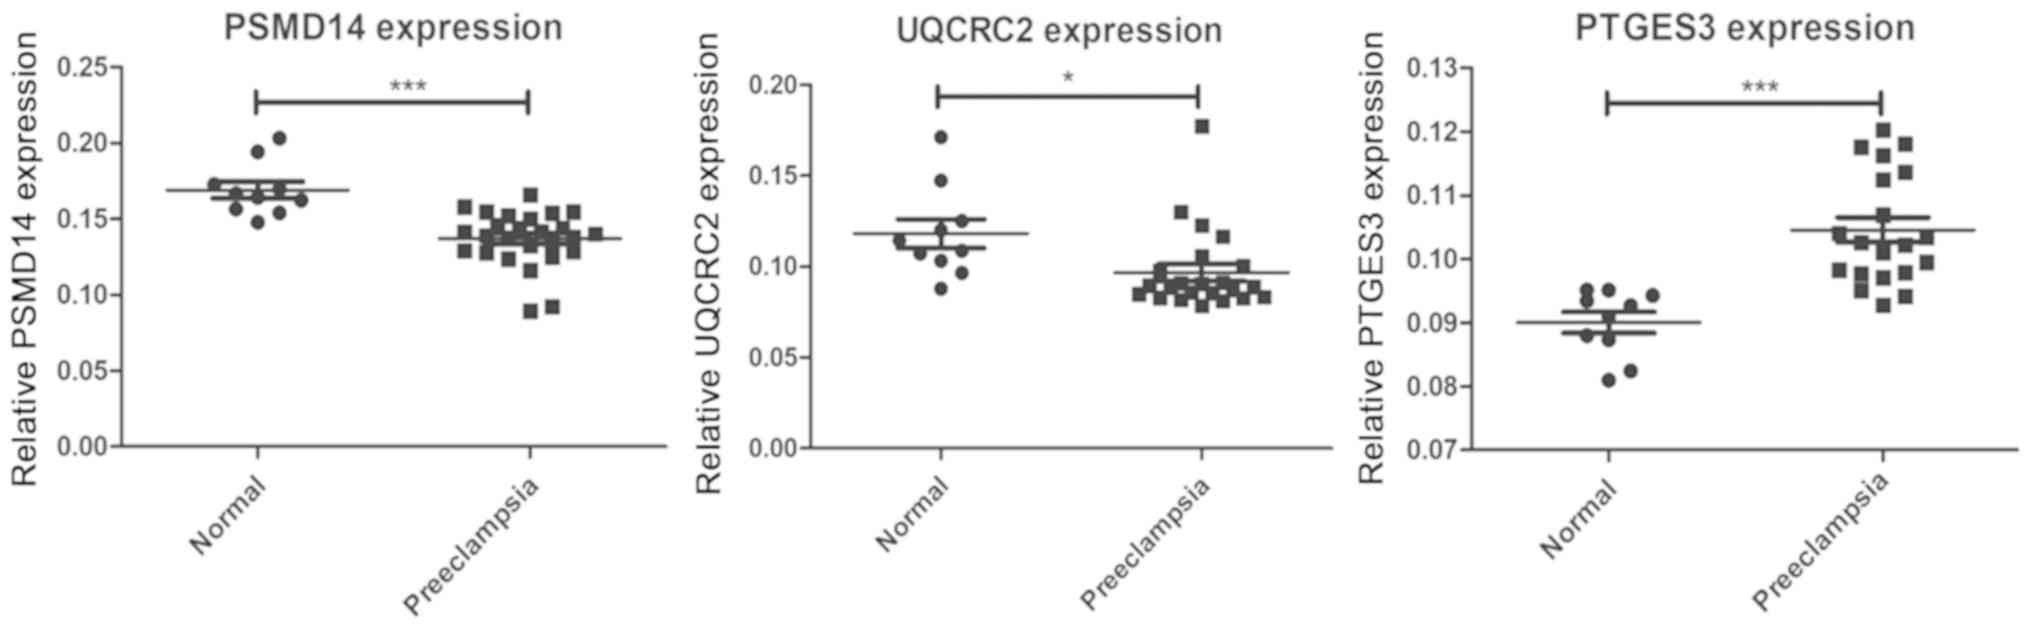
Verification of key genes in PE using
RT-qPCR
A total of 38 placenta specimens were analyzed, 28
placenta specimens from patients with PE and 10 placenta specimens
from healthy pregnant women, to confirm the results of the
bioinformatics screening. The primer specificity and the optimal
annealing temperatures for five pairs of primers were used for
RT-qPCR (Table I). The mRNA
expression of five genes were detected by RT-qPCR. The expression
levels of PSMD14 and UQCRC2 were confirmed to be lower in the
placenta of patients with PE compared with normotensive pregnant
woman, while the expression levels of PTGES3 were higher in
placentas of patients with PE compared with normotensive pregnant
woman (Fig. 8). The expression
levels of ACTR3 and SUMO2 in the placenta of patients with PE
presented no marked difference compared with normotensive pregnant
women (data not shown). These findings indicated that the DEGs may
be associated with the pathogenesis of PE.
Discussion
PE is a multi-organ disease characterized by
hypertension and proteinuria during pregnancy, which is one of the
main causes of morbidity and mortality of pregnant women and
perinatal infants. At present, the pathological mechanism of PE has
not been elucidated. However, studies have indicated that the
symptoms and signs of PE are caused by multiple factors, mechanisms
and pathways.
Based on GO and KEGG analysis in the current study,
a significant portion of DEGs were enriched in the circadian rhythm
pathway. However, there are a limited number of studies on the
association between alterations of the circadian rhythm and PE
(35–37). The circadian rhythm of blood pressure
has been explored in relation to the severity and progression of PE
(38). Van den Berg et al
(39) also indicated that the DNA
methylation status of circadian clock and clock-controlled genes in
placental tissue was different between patients with PE and healthy
controls.
The KEGG result of GSEA in the current study
suggested that DEGs may affect the progression of PE via the fatty
acid metabolism pathway. Increased blood lipids and free fatty
acids, caused by abnormal lipid and fatty acid metabolism, could
enhance oxidative stress, inflammation, endothelial dysfunction and
promote the occurrence of PE (40).
The GO results of GSEA in the present study indicated that the
incidence of PE was related to ‘DNA damage response detection of
DNA damage’, ‘regulation of DNA repair’ and ‘endothelial cell
development’, which is closely related to oxidative stress. Small
artery spasms, low perfusion of organs and tissue hypoxia during PE
have been reported to lead to excessive production of oxygen free
radicals, which can result in protein oxidation, DNA mutation and
breakage, and endothelial cell damage (41–44).
According to the results of the present study, positive regulation
of GTPase-mediated signal transduction may serve a key role in the
occurrence of PE. The Rho family of GTPases are small molecule
guanosine-binding proteins. Activation of the Rho/Rho-associated
coiled-coil containing protein kinase (ROCK) pathway can lead to
injury of vascular endothelial cells, small vessel spasms and
eventually PE symptoms (45). In
addition, according to the present study the occurrence of PE may
be associated with the Erb-B2 receptor tyrosine kinase 2 signaling
pathway, positive regulation of cytokines and cellular response to
estradiol stimulus.
In the present study, CMAP analysis revealed the
association between PE and certain drugs. Furosemide and droperidol
induced gene expression that was contrary to PE. Furosemide is a
diuretic that is used to treat eclampsia complicated with
intracranial hypertension (46).
Droperidol has strong antipsychotic effects that are mainly related
to its antagonism to dopamine receptors; it promotes the
transformation of dopamine in the brain (47). These two drugs may prove to have
therapeutic benefits in preventing the development or progression
of PE.
Through the construction of a PPI network, five hub
genes with higher degrees were identified. However, only PSMD14,
PTGES3 and UQCRC2 were verified to be significantly different
between placenta samples from patients with PE and normotensive
pregnant woman. PSMD14 is one of the 19 essential subunits of a
completely assembled 19S proteasome complex (48). In the current study, the expression
of PSMD14 was significantly lower in the placenta of patients with
PE compared with normotensive pregnant woman. Therefore, the
activity and function of the proteasome may be decreased in
patients with PE. A previous study demonstrated that proteasomal
activity and function was decreased by ~30% in PE placenta
(49). Proteasomes degrade oxidative
stress proteins that destroy cells and tissues. Previous studies
have shown that the oxidative stress-associated proteins were
increased by ~30% in the placenta of patients with PE compared with
the placenta of healthy pregnant women (50–52).
Oxidative stress-associated proteins mainly refer to the products
of oxidative stress, such as damaged DNA bases, protein oxidation
products and lipid peroxidation products. These findings suggested
that decreased proteasomal activity due to reduced expression of
PSMD14 could lead to the accumulation of oxidatively damaged
proteins in PE.
UQCRC2, a member of the peptidase M16 family, is an
indispensable component of mitochondrial complex III, which is a
part of the mitochondrial respiratory chain (53,54). In
the present study, the expression of UQCRC2 was lower in placenta
samples from patients with PE compared with in healthy placenta
samples. According to a previous study, UQCRC2 may be involved in
the production of intracellular reactive oxygen species (ROS) and
oxidative stress (53). In addition,
decreased expression of UQCRC2 led to increased cellular ROS level
(53). PTGES3 is a molecular
chaperone located in genomic response elements that may break down
transcriptional regulatory complexes and destroy receptor-mediated
transcriptional activation (55).
PTGES3 is essential for the normal physiological function of the
glucocorticoid receptor and other steroid receptors. Disordered
steroid synthesis and metabolism is an important factor leading to
PE (56). PSMD14, PTGES3 and UQCRC2
are all involved in oxidative stress, carcinoma, and steroid
synthesis and metabolism (57–59). The
changes in mRNA expression of PSMD14, PTGES3 and UQCRC2 detected in
the present study suggested that carcinoma and oxidative stress
signals may be involved in the occurrence and development of PE. In
the current study, patients with PE exhibited decreased expression
of PSMD14 and UQCRC2. Previous studies have shown that PSMD14 and
UQCRC2 are involved in oxidative stress signals; decreased
expression of PSMD14 and UQCRC2 is associated with oxidative damage
to vascular endothelial cells (49,53). In
the present study, PTGES3 exhibited increased expression in
patients with PE. It has been reported that PTGES3 may be involved
in steroid synthesis and metabolism signals; abnormal expression of
PTGES3 can lead to disordered steroid synthesis and metabolism, and
thus to the development of PE (56).
In addition, it has been reported that UQCRC2 is involved in
carcinoma cell signaling; it is of note that carcinoma signaling
pathways, such as Notch, RhoA/ROCK and NF-κB, are also related to
PE (60–62). Abnormal expression of UQCRC2 can
result in disorders of carcinoma signaling and also possibly the
occurrence of PE.
In conclusion, the pathogenesis of PE has been found
to involve multiple cellular signaling pathways and BPs. The
present study indicated that furosemide and droperidol may have
beneficial effects as PE treatments. Furthermore, the
downregulation of PSMD14 and UQCRC2 expression may induce increased
oxidative stress in PE, whereas the upregulation of PTGES3
expression may lead to disordered steroid synthesis and metabolism,
which could participate in the development of PE. Therefore, these
three hub genes may be biomarkers or therapeutic targets in PE.
Acknowledgements
Not applicable.
Funding
The present study was supported by the Chinese
National Natural Science Foundation Grant (grant nos. 81671541,
81273202 and 81701545), the Special Program for Key Technology of
the Health and Family Planning of Zhenjiang City, Jiangsu, P.R.
China (grant no. SHW2017003), Clinical Medicine Science &
Technology Project of Jiangsu province of China (grant no.
BL2013024), Key Research and Development Programs Social
Development Project of Science and Technology Commission Foundation
of Jiangsu Province (grant no. BE2016721), Jiangsu Undergraduate
Training Program for Innovation & Entrepreneurship (grant no.
201710299063Y) and Advance Research Fund Project of The Second
Affiliated Hospital of Soochow University (grant no.
SDFEYQN1910).
Availability of data and materials
The datasets used and/or analyzed during the current
study are available from the corresponding author on reasonable
request. The dataset GSE60438 is available from https://www.ncbi.nlm.nih.gov/geo/query/acc.cgi?acc=GSE60438.
Authors' contributions
ZX and CW performed the experiment and wrote the
manuscript. YL and NW analyzed and interpreted the patient data
regarding preeclampsia. SG, SQ, ZW, JD, LZ, HW and WW collected the
placenta of patients with PE and normotensive pregnant woman. BW,
JY, JF and PY performed the bioinformatics analyses. NW and QS
funded the experiment and designed this research. All authors read
and approved the final version of the manuscript.
Ethics approval and consent to
participate
The researchers obtained verbal informed consent
before collecting patient samples. Written informed consent was
waived by the Ethics Committee of the Affiliated Hospital of
Jiangsu University. The experiment was approved by the Ethics
Committee of the Affiliated Hospital of Jiangsu University
(approval no. 20170415).
Patient consent for publication
Not applicable.
Competing interests
The authors declare that they have no competing
interests.
References
|
1
|
Sánchez-Aranguren LC, Prada CE,
Riaño-Medina CE and Lopez M: Endothelial dysfunction and
preeclampsia: Role of oxidative stress. Front Physiol. 5:3722014.
View Article : Google Scholar : PubMed/NCBI
|
|
2
|
Wang Y, Zhang X, Cheng GM and Ren CC:
Expression of transforming growth factor-beta 1, vascular cell
adhesion molecule 1 and E-selectin in placenta of patients with
pre-clampsia. Zhonghua Fu Chan Ke Za Zhi. 41:514–517. 2006.(In
Chinese). PubMed/NCBI
|
|
3
|
Weissgerber TL and Mudd LM: Preeclampsia
and diabetes. Curr Diab Rep. 15:92015. View Article : Google Scholar : PubMed/NCBI
|
|
4
|
Spradley FT: Metabolic abnormalities and
obesity's impact on the risk for developing preeclampsia. Am J
Physiol Regul Integr Comp Physiol. 312:R5–R12. 2017. View Article : Google Scholar : PubMed/NCBI
|
|
5
|
Karumanchi SA and Granger JP: Preeclampsia
and pregnancy-related hypertensive disorders. Hypertension.
67:238–242. 2016. View Article : Google Scholar : PubMed/NCBI
|
|
6
|
Facca TA, Kirsztajn GM and Sass N:
Preeclampsia (marker of chronic kidney disease): From genesis to
future risks. J Bras Nefrol. 34:87–93. 2012.(In English,
Portuguese). View Article : Google Scholar : PubMed/NCBI
|
|
7
|
Kumasawa K, Ikawa M, Kidoya H, Hasuwa H,
Saito-Fujita T, Morioka Y, Takakura N, Kimura T and Okabe M:
Pravastatin induces placental growth factor (PGF) and ameliorates
preeclampsia in a mouse model. Proc Natl Acad Sci USA.
108:1451–1455. 2011. View Article : Google Scholar : PubMed/NCBI
|
|
8
|
Filipek A and Jurewicz E: Preeclampsia - a
disease of pregnant women. Postepy Biochem. 64:232–229. 2018.
View Article : Google Scholar : PubMed/NCBI
|
|
9
|
Jiang J and Zhao ZM: LncRNA HOXD-AS1
promotes preeclampsia progression via MAPK pathway. Eur Rev Med
Pharmacol Sci. 22:8561–8568. 2018.PubMed/NCBI
|
|
10
|
Zhang XM, Xiong X, Tong C, Li Q, Huang S,
Li QS, Liu YM, Li HY, Baker P, Shan N and Qi HB: Down-regulation of
laminin (LN)-α5 is associated with preeclampsia and impairs
trophoblast cell viability and invasiveness through PI3K signaling
pathway. Cell Physiol Biochem. 51:2030–2040. 2018. View Article : Google Scholar : PubMed/NCBI
|
|
11
|
Pan Q, Shai O, Lee LJ, Frey BJ and
Blencowe BJ: Deep surveying of alternative splicing complexity in
the human transcriptome by high-throughput sequencing. Nat Genet.
40:1413–1415. 2008. View
Article : Google Scholar : PubMed/NCBI
|
|
12
|
Luo S, Cao N, Tang Y and Gu W:
Identification of key microRNAs and genes in preeclampsia by
bioinformatics analysis. PLoS One. 12:e01785492017. View Article : Google Scholar : PubMed/NCBI
|
|
13
|
Zhu X, Yang Y, Han T, Yin G, Gao P, Ni Y,
Su X, Liu Y and Yao Y: Suppression of microRNA-18a expression
inhibits invasion and promotes apoptosis of human trophoblast cells
by targeting the estrogen receptor alpha gene. Mol Med Rep.
12:2701–2706. 2015. View Article : Google Scholar : PubMed/NCBI
|
|
14
|
Barrett T, Troup DB, Wilhite SE, Ledoux P,
Rudnev D, Evangelista C, Kim IF, Soboleva A, Tomashevsky M,
Marshall KA, et al: NCBI GEO: Archive for high-throughput
functional genomic data. Nucleic Acids Res. 37:(Database Issue).
D885–D890. 2009. View Article : Google Scholar : PubMed/NCBI
|
|
15
|
Subramanian A, Tamayo P, Mootha VK,
Mukherjee S, Ebert BL, Gillette MA, Paulovich A, Pomeroy SL, Golub
TR, Lander ES and Mesirov JP: Gene set enrichment analysis: A
knowledge-based approach for interpreting genome-wide expression
profiles. Proc Natl Acad Sci USA. 102:15545–15550. 2005. View Article : Google Scholar : PubMed/NCBI
|
|
16
|
Lamb J, Crawford ED, Peck D, Modell JW,
Blat IC, Wrobel MJ, Lerner J, Brunet JP, Subramanian A, Ross KN, et
al: The connectivitiy map: Using gene-expression signatures to
connect small molecules, genes, and disease. Scinece.
313:1929–1935. 2006. View Article : Google Scholar
|
|
17
|
Huang HL, Peng CY, Lai MJ, Chen CH, Lee
HY, Wang JC, Liou JP, Pan SL and Teng CM: Novel oral histone
deacetylase inhibitor, MPT0E028, displays potent growth-inhibitory
activity against human B-cell lymphoma in vitro and in vivo.
Oncotarget. 6:4976–4991. 2015. View Article : Google Scholar : PubMed/NCBI
|
|
18
|
Wen Z, Wang Z, Wang S, Ravula R, Yang L,
Xu J, Wang C, Zuo Z, Chow MS, Shi L and Huang Y: Discovery of
molecular mechanisms of traditional Chinese medicinal formula
Si-Wu-Tang using gene expression microarray and connectivity map.
PLoS One. 6:e182782011. View Article : Google Scholar : PubMed/NCBI
|
|
19
|
Wei LL, Pan YS, Tang Q, Yang ZJ, Song WQ,
Gao YF, Li J, Zhang L and Liu SG: Decreased ALCAM expression and
promoter hypermethylation is associated with preeclampsia.
Hypertens Res. 43:13–22. 2020. View Article : Google Scholar : PubMed/NCBI
|
|
20
|
Wang Q, Lu X, Li C, Zhang W, Lv Y, Wang L,
Wu L, Meng L, Fan Y, Ding H, et al: Down-regulated long non-coding
RNA PVT1 contributes to gestational diabetes mellitus and
preeclampsia via regulation of human trophoblast cells. Biomed
Pharmacother. 120:1095012019. View Article : Google Scholar : PubMed/NCBI
|
|
21
|
Hu S, Li J, Tong M, Li Q, Chen Y, Lu H,
Wang Y and Min L: MicroRNA-144-3p may participate in the
pathogenesis of preeclampsia by targeting Cox-2. Mol Med Rep.
19:4655–4662. 2019.PubMed/NCBI
|
|
22
|
Dong K, Zhang X, Ma L, Gao N, Tang H, Jian
F and Ma Y: Downregulations of circulating miR-31 and miR-21 are
associated with preeclampsia. Pregnancy Hypertens. 17:59–63. 2019.
View Article : Google Scholar : PubMed/NCBI
|
|
23
|
Wang Y, Cheng K, Zhou W, Liu H, Yang T,
Hou P and Li X: miR-141-5p regulate ATF2 via effecting MAPK1/ERK2
signaling to promote preeclampsia. Biomed Pharmacother.
115:1089532019. View Article : Google Scholar : PubMed/NCBI
|
|
24
|
Yong HE, Melton PE, Johnson MP, Freed KA,
Kalionis B, Murthi P, Brennecke SP, Keogh RJ and Moses EK:
Genome-wide transcriptome directed pathway analysis of maternal
pre-eclampsia susceptibility genes. PLoS One. 10:e01282302015.
View Article : Google Scholar : PubMed/NCBI
|
|
25
|
Cao C, Chen J, Lyu C, Yu J, Zhao W, Wang Y
and Zou D: Bioinformatics analysis of the effects of tobacco smoke
on gene expression. PLoS One. 10:e01433772015. View Article : Google Scholar : PubMed/NCBI
|
|
26
|
Ashburner M, Ball CA, Blake JA, Botstein
D, Butler H, Cherry JM, Davis AP, Dolinski K, Dwight SS, Eppig JT,
et al: Gene ontology: Tool for the unification of biology. The gene
ontology consortium. Nat Genet. 25:25–29. 2000. View Article : Google Scholar : PubMed/NCBI
|
|
27
|
Kanehisa M and Goto S: KEGG: Kyoto
encyclopedia of genes and genomes. Nucleic Acids Res. 28:27–30.
2000. View Article : Google Scholar : PubMed/NCBI
|
|
28
|
Huang da W, Sherman BT and Lempicki RA:
Systematic and integrative analysis of large gene lists using DAVID
bioinformatics resources. Nat Protoc. 4:44–57. 2009. View Article : Google Scholar
|
|
29
|
Mootha VK, Lindgren CM, Eriksson KF,
Subramanian A, Sihag S, Lehar J, Puigserver P, Carlsson E,
Ridderstråle M, Laurila E, et al: PGC-1alpha-responsive genes
involved in oxidative phosphorylation are coordinately
downregulated in human diabetes. Nat Genet. 34:267–273. 2003.
View Article : Google Scholar : PubMed/NCBI
|
|
30
|
Chin CH, Chen SH, Wu HH, Ho CW, Ko MT and
Lin CY: cytoHubba: Identifying hub objects and sub-networks from
complex interactome. BMC Syst Biol. 4 (Suppl 4):S112014. View Article : Google Scholar
|
|
31
|
Bader GD and Hogue CW: An automated method
for finding molecular complexes in large protein interaction
networks. BMC Bioinformatics. 4:22003. View Article : Google Scholar : PubMed/NCBI
|
|
32
|
Lamb J, Crawford ED, Peck D, Modell JW,
Blat IC, Wrobel MJ, Lerner J, Brunet JP, Subramanian A, Ross KN, et
al: The connectivity map: Using gene-expression signatures to
connect small molecules, genes, and disease. Science.
313:1929–1935. 2006. View Article : Google Scholar : PubMed/NCBI
|
|
33
|
Group of hypertensive disorders of
pregnancy, branch of Obstetrics and Gynecology, Chinese Medical
Association. Chin J Obst Gynecol. 10:2015.
|
|
34
|
Livak KJ and Schmittgen TD: Analysis of
relative gene expression data using real-time quantitative PCR and
the 2(-Delta Delta C(T)) method. Methods. 25:402–408. 2001.
View Article : Google Scholar : PubMed/NCBI
|
|
35
|
Ditisheim AJ, Dibner C, Philippe J and
Pechère-Bertschi A: Biological rhythms and preeclampsia. Front
Endocrinol (Lausanne). 4:472013. View Article : Google Scholar : PubMed/NCBI
|
|
36
|
Haelterman E, Marcoux S, Croteau A and
Dramaix M: Population-based study on occupational risk factors for
preeclampsia and gestational hypertension. Scand J Work Environ
Health. 33:304–317. 2007. View Article : Google Scholar : PubMed/NCBI
|
|
37
|
Mozurkewich EL, Luke B, Avni M and Wolf
FM: Working conditions and adverse pregnancy outcome: A
meta-analysis. Obstet Gynecol. 95:623–635. 2000. View Article : Google Scholar : PubMed/NCBI
|
|
38
|
Munz W, Seufert R, Steiner E, Pollow K and
Brockerhoff P: Circadian blood pressure rhythm in preeclampsia as a
predictor of maternal and obstetrical outcome. Z Geburtshilfe
Neonatol. 207:132–136. 2003.(In German). PubMed/NCBI
|
|
39
|
van den Berg CB, Chaves I, Herzog EM,
Willemsen SP, van der Horst GTJ and Steegers-Theunissen RPM: Early-
and late-onset preeclampsia and the DNA methylation of circadian
clock and clock-controlled genes in placental and newborn tissues.
Chronobiol Int. 34:921–932. 2017. View Article : Google Scholar
|
|
40
|
Ding X, Yang Z, Han Y and Yu H: Fatty acid
oxidation changes and the correlation with oxidative stress in
different preeclampsia-like mouse models. PLoS One. 9:e1095542014.
View Article : Google Scholar : PubMed/NCBI
|
|
41
|
Wata S, Lee JW, Okada K, Lee JK, Iwata M,
Rasmussen B, Link TA, Ramaswamy S and Jap BK: Complete structure of
the 11-subunit bovine mitochondrial cytochrome bc1 complex.
Science. 281:64–71. 1998. View Article : Google Scholar : PubMed/NCBI
|
|
42
|
Aouache R, Biquard L, Vaiman D and
Miralles F: Oxidative stress in preeclampsia and placental
diseases. Int J Mol Sci. 19(pii): E14962018. View Article : Google Scholar : PubMed/NCBI
|
|
43
|
Elliot MG: Oxidative stress and the
evolutionary origins of preeclampsia. J Reprod Immunol. 114:75–80.
2016. View Article : Google Scholar : PubMed/NCBI
|
|
44
|
Chiarello DI, Abad C, Rojas D, Toledo F,
Vázquez CM, Mate A, Sobrevia L and Marín R: Oxidative stress:
Normal pregnancy versus preeclampsia. Biochim Biophys Acta Mol
Basis Dis. 1866:1653542020. View Article : Google Scholar : PubMed/NCBI
|
|
45
|
Heneweer C, Kruse LH, Kindhauser F,
Schmidt M, Jakobs KH, Denker HW and Thie M: Adhesiveness of human
uterine epithelial RL95-2 cells to trophoblast: Rho protein
regulation. Mol Hum Reprod. 8:1014–1022. 2002. View Article : Google Scholar : PubMed/NCBI
|
|
46
|
Tamás P, Hantosi E, Farkas B, Ifi Z,
Betlehem J and Bódis J: Preliminary study of the effects of
furosemide on blood pressure during late-onset pre-eclampsia in
patients with high cardiac output. Int J Gynaecol Obstet.
136:87–90. 2017. View Article : Google Scholar : PubMed/NCBI
|
|
47
|
Adamantidis MM, Kerram P, Caron JF and
Dupuis BA: Droperidol exerts dual effects on repolarization and
induces early afterdepolarizations and triggered activity in rabbit
Purkinje fibers. J Pharmacol Exp Ther. 266:884–893. 1993.PubMed/NCBI
|
|
48
|
Gu ZC and Enenkel C: Proteasome assembly.
Cell Mol Life Sci. 71:4729–4745. 2014. View Article : Google Scholar : PubMed/NCBI
|
|
49
|
Hass R and Sohn C: Increased oxidative
stress in pre-eclamptic placenta is associated with altered
proteasome activity and protein patterns. Placenta. 24:979–984.
2003. View Article : Google Scholar : PubMed/NCBI
|
|
50
|
Zhou JF, Wang XY, Shangguan XJ, Gao ZM,
Zhang SM, Xiao WQ and Chen CG: Increased oxidative stress in women
with pregnancy-induced hypertension. Biomed Environ Sci.
18:419–426. 2005.PubMed/NCBI
|
|
51
|
Mistry HD, Wilso V, Ramsay MM, Symonds ME
and Broughton Pipkin F: Reduced selenium concentrations and
glutathione peroxidase activity in preeclamptic pregnancies.
Hypertension. 52:881–888. 2008. View Article : Google Scholar : PubMed/NCBI
|
|
52
|
Vanderlelie J, Venardos K, Clifton VL,
Gude NM, Clarke FM and Perkins AV: Increased biological oxidation
and reduced anti-oxidant enzyme activity in pre-eclamptic placenta.
Placenta. 26:53–58. 2005. View Article : Google Scholar : PubMed/NCBI
|
|
53
|
Miyake N, Yano S, Sakai C, Hatakeyama H,
Matsushima Y, Shiina M, Watanabe Y, Bartley J, Abdenur JE, Wang RY,
et al: Mitochondrial complex III deficiency caused by a homozygous
UQCRC2 mutation presenting with neonatal-onset recurrent metabolic
decompensation. Hum Mutat. 34:446–452. 2013. View Article : Google Scholar : PubMed/NCBI
|
|
54
|
Gaignard P, Eyer D, Lebigot E, Oliveira C,
Therond P, Boutron A and Slama A: UQCRC2 mutation in a patient with
mitochondrial complex III deficiency causing recurrent liver
failure, lactic acidosis and hypoglycemia. J Hum Genet. 62:729–731.
2017. View Article : Google Scholar : PubMed/NCBI
|
|
55
|
Freeman BC and Yamamoto KR: Disassembly of
transcriptional regulatory complexes by molecular chaperones.
Science. 296:2232–2235. 2002. View Article : Google Scholar : PubMed/NCBI
|
|
56
|
Sinclair D, Fillman SG, Webster MJ and
Weickert CS: Dysregulation of glucocorticoid receptor co-factors
FKBP5, BAG1 and PTGES3 in prefrontal cortex in psychotic illness.
Sci Rep. 3:35392013. View Article : Google Scholar : PubMed/NCBI
|
|
57
|
Lv J, Zhang S, Wu H, Lu J, Lu Y, Wang F,
Zhao W, Zhan P, Lu J, Fang Q, et al: Deubiquitinase PSMD14 enhances
hepatocellular carcinoma growth and metastasis by stabilizing GRB2.
Cancer Lett. 469:22–34. 2020. View Article : Google Scholar : PubMed/NCBI
|
|
58
|
Song B, Du J, Feng Y, Gao YJ and Zhao JS:
Co-expressed differentially expressed genes and long non-coding
RNAs involved in the celecoxib treatment of gastric cancer: An RNA
sequencing analysis. Exp Ther Med. 12:2455–2468. 2016. View Article : Google Scholar : PubMed/NCBI
|
|
59
|
Gu Y, Chen G and Du Y: Screening of
prognosis-related genes in primary breast carcinoma using genomic
expression data. J Comput Biol. Nov 13–2019.(Epub ahead of print).
View Article : Google Scholar
|
|
60
|
Cao W, Wang X, Chen T, Zhu H, Xu W, Zhao
S, Cheng X and Xia L: The expression of Notch/Notch ligand, IL-35,
IL-17, and Th17/Treg in preeclampsia. Dis Markers. 2015:3161822015.
View Article : Google Scholar
|
|
61
|
Gu Y, Feng Y, Yu J, Yuan H, Yin Y, Ding J,
Zhao J, Xu Y, Xu J and Che H: Fasudil attenuates soluble fms-like
tyrosine kinase-1 (sFlt-1)-induced hypertension in pregnant mice
through RhoA/ROCK pathway. Oncotarget. 8:104104–104112. 2017.
View Article : Google Scholar : PubMed/NCBI
|
|
62
|
Zheng L, Shi L, Zhou Z, Chen X, Wang L, Lu
Z and Tang R: Placental expression of AChE, α7nAChR and NF-κB in
patients with preeclampsia. Ginekol Pol. 89:249–255. 2018.
View Article : Google Scholar : PubMed/NCBI
|