Introduction
As one of the most common malignant tumors in China,
new cases of hepatocellular carcinoma (HCC) and associated deaths
accounted for ~50% of the global total in 2012 (1). The cause of HCC in 80% of Chinese
patients can be attributed to hepatitis B virus (HBV) infection
(2), which may further increase the
mortality rate of HCC and decrease the 5-year survival rate after
surgical treatment (3). Early
diagnosis is effective to improve therapeutic effects (4). At present, the diagnosis of HCC is
mainly dependent on clinical data, imaging tests of the liver and
measurement of serum α-fetoprotein (AFP) levels. Although AFP is
the most widely used serum marker for diagnosing and monitoring
HCC, >40% of patients with HCC may exhibit normal AFP levels,
particularly in the early stages (5,6). Due to
the low sensitivity of measuring AFP levels, false-positive results
constitute another problem, as benign liver tumors may also cause a
rise in the AFP serum levels. Therefore, the sensitivity and
specificity of AFP in HCC diagnosis is questionable (7).
AFP can specifically bind to Lens culinaris
agglutinin (LCA), referred to as AFP-L3, and this has been reported
to be a specific marker for diagnosing HCC (8). Since LCA can further bind to fucose,
AFP-L3 is also referred to as fucosylated AFP (9). In 2005, the United States Food and Drug
Administration officially approved AFP-L3 as a marker for
diagnosing HCC (10).
However, the application of AFP or AFP-L3 alone
cannot meet the clinical requirements of patients with AFP-negative
HCC. To date, research in patients with HCC with abnormal serum AFP
levels has revealed that fucosylation may not be restricted to AFP,
and a previous study confirmed its presence in other proteins
(11). Although the molecular
mechanism of abnormal fucosylation in HCC has not been fully
clarified, previous research identified multiple proteins with
differential fucosylation, including the Golgi protein 73 (12), haptoglobin (13), α-1-acid glycoprotein (14) and kininogen (15), which may be used as potential markers
for HCC diagnosis. However, none of these markers could be applied
as widely as AFP-L3 in clinical practice.
Abnormal fucosylation of different glycoproteins
provides a novel insight into the diagnosis of HCC, but no
effective method has been presented to compare and analyze all
fucosylated glycoproteins in patients with HCC. In our previous
study (16), matrix-assisted laser
desorption/ionization time-of-flight mass spectrometry (MALDI-TOF
MS) was used to capture serum-associated fucosylated glycoproteins
using LCA-coated magnetic beads. By using MALDI-TOF MS, a salivary
protein fingerprint model was established to assist the diagnosis
of HCC. Since MALDI-TOF MS is mainly utilized to detect proteins
<10 kD, our previous study used trypsin to digest all proteins
captured by the magnetic beads. However, since protein
fractionation required complex operation and blinded test results
were unsatisfactory, the aforementioned model may not be
appropriate for use in clinical practice.
The present study was designed to fragment all
captured proteins and to only detect those that were <10 kD,
including peptides produced by the natural degradation of some
proteins. Therefore, the present study aimed to provide a novel and
more appropriate method for use in clinical practice, and discussed
its potential in HCC diagnosis.
Patients and methods
Patients
Serum samples (n=425) from patients (n=339) and
healthy controls (n=86) were collected at Fuzhou General Hospital
of Nanjing Command (Fuzhou, China) between November 2007 and
December 2017. The present study was approved by the Ethics
Committee of Fuzhou General Hospital of Nanjing Military Command,
and written informed consent was obtained from all participants.
Demographic and clinical data were obtained, and a blood sample was
collected from each study subject. The HBV infection status was
assessed using a Hepatitis B Virus Surface Antigen Diagnostic kit
(enzyme-linked immunoassay) (Livzon Pharmaceutical Group Inc.;
http://en.livzon.com.cn/). Hepatitis C virus
(HCV) infection status was assessed using a Hepatitis C Virus
Antibody Diagnostic kit (enzyme-linked immunoassay) (Livzon
Pharmaceutical Group Inc.). HBV-DNA was detected using a Hepatitis
B Virus Nucleic Acid Detection kit (Sun Yat-Sen University Daan
Gene Co., Ltd.). (PCR-fluorescent probe method). These kits were
used according to the manufacturer's protocols.
Four groups of patients were enrolled in the present
study (Table I). The first group
(n=86) included subjects with no history of liver disease and
normal liver biochemistry, no risk factors for viral hepatitis and
an alcohol consumption <40 g/week. The second group (n=86)
consisted of patients with chronic hepatitis B (CHB) who were
positive for HBsAg, hepatitis B e-antigen and HBV DNA, and negative
for HCsAg and abnormal liver biochemistry. The third group (n=97)
consisted of patients with HBV-infected cirrhosis (HBV-cirrhosis).
Diagnosis of cirrhosis was based on liver histology or on clinical,
laboratory and imaging evidence of hepatic decompensation or portal
hypertension (17). Patients with
cirrhosis without a suspected or malignant nodule were assessed by
B-ultrasound (US). If the serum AFP level was elevated, CT or
magnetic resonance imaging scans of the liver within 3 months
before enrollment and 6 months after enrollment had to exhibit no
liver mass. The fourth group (n=141) included patients with
HBV-infected HCC (HBV-HCC). The diagnosis of HCC was carried out by
histopathology (18). Tumor staging
was determined via the United Network of Organ Sharing that uses
the modified TNM staging system for HCC (19).
 | Table I.Numbers of serum samples used in
training and blinded test cohorts. |
Table I.
Numbers of serum samples used in
training and blinded test cohorts.
| Group | Training cohort,
n | Blinded test cohort,
n | Total, n |
|---|
| Healthy | 26 | 60 | 86 |
| Chronic hepatitis
B | 21 | 65 | 86 |
| HBV-infected
cirrhosis | 32 | 65 | 97 |
| HBV-infected
hepatocellular carcinoma | 32 | 109 | 141 |
| Total | 111 | 299 | 410 |
All patients were randomly divided into two cohorts.
The training cohort was composed of 26 healthy volunteers, 21
patients with CHB, 32 patients with HBV-cirrhosis and 32 patients
with HBV-HCC. The blinded test cohort was composed of 60, 65, 65
and 109 patients, respectively. Demographic data and etiology of
liver diseases of all patients and healthy volunteers are presented
in Table II.
| Table II.Patient characteristics in training
and blinded test cohorts. |
Table II.
Patient characteristics in training
and blinded test cohorts.
| Cohorts and
characteristics | Healthy | Chronic hepatitis
B | HBV-infected
cirrhosis | HBV-infected
hepatocellular carcinoma |
|---|
| Training cohort |
|
|
|
|
| No. | 26 | 21 | 32 | 32 |
|
Male/Female | 16/10 | 17/4 | 29/3 | 28/4 |
| Age,
years |
46.8±11.6 | 40.3±6.9 | 48.5±11.4 | 52.0±10.4 |
| ALT,
U/l | 20.2±6.7 | 112.5±78.8 |
54.7±104.2 | 70.6±71.0 |
| AST,
U/l | 18.0±4.8 |
98.5±75.4 | 62.4±67.8 | 72.8±52.1 |
| AFP,
ng/ml |
2.5±1.0 |
17.0±27.9 | 25.4±57.8 |
13,810.6±26,999.7 |
|
<20 | 26 | 17 | 26 | 4 |
|
20-200 | 0 | 4 | 5 | 5 |
|
>200 | 0 | 0 | 1 | 23 |
| TNM
stage (I/II/III/IV) | NA | NA | NA | 12/14/4/2 |
| Blinded test
cohort |
|
|
|
|
|
No. | 60 | 65 | 65 | 109 |
|
Male/Female | 36/24 | 56/9 | 56/9 | 97/12 |
| Age,
years |
45.1±15.3 | 40.6±8.5 | 47.9±12.2 | 51.3±11.7 |
| ALT,
U/l | 19.3±5.2 | 116.3±76.8 | 48.8±99.4 | 70.1±58.7 |
| AST,
U/l | 17.2±4.4 |
96.4±67.5 | 58.6±53.0 | 76.5±60.9 |
| AFP,
ng/ml |
2.8±1.5 |
19.5±58.6 | 26.6±72.4 |
4652.9±11,463.0 |
|
<20 | 60 | 54 | 52 | 32 |
|
20-200 | 0 | 9 | 10 | 16 |
|
>200 | 0 | 2 | 3 | 61 |
| TNM
stage, I/II/III/IV | NA | NA | NA | 53/40/12/4 |
In conjunction with an ongoing cohort study,
prediagnostic sera from 9 patients with HBV-cirrhosis who developed
HBV-HCC within 1 year of US screening and 6 patients with
HBV-cirrhosis who remained free of HBV-HCC for the subsequent 3
years were also obtained. These subjects constituted the third
analysis cohort (Table III).
| Table III.Patient characteristics in the third
analysis cohort. |
Table III.
Patient characteristics in the third
analysis cohort.
|
Characteristics | HBV-HCC occurrence
within 1 year | No HBV-HCC
occurrence within 3 years |
|---|
| No. | 9 | 6 |
| Male/Female | 8/1 | 5/1 |
| Age, years | 58.3±4.1 | 50.3±5.6 |
| ALT, U/l |
70.0±44.9 |
59.0±34.3 |
| AST, U/l |
72.3±61.5 |
52.6±49.4 |
| AFP, ng/ml |
95.2±122.8 |
23.4±22.4 |
| <20 | 6 | 5 |
| 20-200 | 2 | 1 |
| >200 | 1 | 0 |
Preparation of blood samples
Blood from patients was collected from an elbow vein
3–5 days before surgery in glass tubes without additive (BD
Vacutainer®; BD Diagnostics) and was allowed to clot at
room temperature for 40 min. Serum was separated by centrifugation
at 912 × g for 15 min at room temperature, immediately split into
200-µl aliquots and frozen at −80°C until analysis. The time
between collection and frozen storage was <60 min.
The processing, collection and storage protocols
were the same for all individuals. Each sample used for proteomic
profiling had not been thawed more than once. Blood samples from
patients were drawn before commencement of treatment.
Serum protein fractionation
Serum samples were thawed and purified using a LCA
magnetic beads kit (Bruker Corporation). A total of 10 µl serum was
mixed with 2 µl beads and the samples were purified by binding,
washing and elution according to the manufacturer's protocol. Each
incubation (at room temperature) step lasted 1 min. Elution was
carried out with 10 µl elution buffer and the purified material was
8-fold diluted with the elution solution prior to MS analysis.
MALDI-TOF MS
For MALDI-TOF MS analysis, 1 µl of the
aforementioned diluted purified sample was mixed with 0.5 µl matrix
solution (0.4 mg/ml α-cyano-4-hydroxycinnamic acid in
ethanol:acetone 2:1) and allowed to dry onto the MALDI sample plate
(600-µm AnchorChip™; Bruker Daltonics; Bruker Corporation). Laser
desorption was targeted randomly on the sample plate and samples
were measured using an Autoflex II MALDI-TOF mass spectrometer
(Bruker Daltonics; Bruker Corporation) operated in positive ion
linear (reflection) mode. Ionization was achieved by irradiation
with a 50 Hz nitrogen laser (λ=337 nm). Spectra were the mean of
100 ionizations with fixed laser power in linear geometry mode, and
mass maps were obtained in reflectron mode. The spectra were
calibrated externally with a mixture of protein/peptide standards
in the range of 1,000-10,000 Da (Bruker Daltonics; Bruker
Corporation). Three MALDI preparations (MALDI spots) were measured
from each sample. For each MALDI spot, 400 spectra were acquired
(50 laser shots at eight different spot positions). The spectra
from all samples (training cohort) were imported into the CLINPROT™
software (Bruker Daltonics; Bruker Corporation) for spectra
processing, model building, model recognition and internal model
validation. CLINPROT™ software is composed of data acquisition
software FlexControl 2.2, viewing software FlexAnalysis 3.0 and
analysis software ClinProTools 2.1. The spectra were processed in
the following order: i) Spectra normalization to total ion current;
ii) spectra recalibration using prominent peaks; iii) baseline
subtraction, peak smoothing (Savitsky-Golay algorithm) and peak
detection; and iv) calculation of peak areas for each spectrum.
Peak detection was performed using S/N≥5 and peak areas were
calculated using a zero level integration type.
All MALDI-TOF MS spectra were analyzed using
flexAnalysis™ version 3.0 to detect the peak intensities of
interest and CLINPROT™ software (both Bruker Daltonics; Bruker
Corporation) to compile the peaks across the spectra obtained from
all samples of the training set. This analysis allowed for
discrimination between HCC and control samples. The Supervised
Neural Network (SNN) contained within this software suite was used
to select clusters of signals for the model to discriminate between
the two populations. A leave-20%-out cross-validation was
calculated to avoid over-fitting of pattern recognitions. The
spectra from all samples of the blinded test cohort were processed
according to the same method. The spectra data of two sets (the
training cohort and the blinded test cohort) were used for internal
and external model validation.
Sample processing and MALDI
analysis
Each serum sample from the training cohort was
analyzed using LCA magnetic beads enriched with fucosylated
glycoproteins. The MALDI-TOF approach was applied to exhibit
spectral peaks in the 1,000-10,000 m/z range, as well as the effect
of pre-processing and normalization. Each serum sample was tested
in duplicate. ClinprotTools v2.1 (Bruker Daltonics; Bruker
Corporation) was used to statistically analyze the differences in
peak positions and intensities.
Blinding
The analysts were blinded to the origin of the
samples. Initially, the established model was used to distinguish
HCC samples from all serum samples. Subsequently, healthy samples
were excluded, and the analysts attempted to distinguish HCC
samples from samples with HBV-associated diseases. Finally, the
analysts attempted to exclude CHB, and distinguish HCC from all
cirrhosis samples. At the same time, in the third analysis cohort,
the analysts attempted to distinguish HCC from all cirrhosis
samples.
Nano-liquid chromatography
(LC)-electrospray ionization (ESI)-tandem mass spectrometry (MS/MS)
analysis
All fucosylated proteins in serum samples purified
and enriched by LCA magnetic beads in the eluent were directly used
for Nano LC-ESI-MS/MS analysis. The enriched proteins dried using
vacuum centrifugation (at room temperature, 2,000 × g for ~3 h),
and re-suspended in the solution containing 5% ACN and 0.1% formic
acid. Peptides were separated by nano-LC and analyzed using a mass
spectrometer. The experiments were performed on an LC-20AD system
(Shimadzu Corporation) connected to an LTQ Orbitrap mass
spectrometer (Thermo Fisher Scientific, Inc.) equipped with an
online nanoelectrospray ion source (Bruker-Michrom, Inc.). In
total, 5 µl peptide sample was loaded onto the trap-column with a
flow rate of 60 µl/min, eluted with a gradient of 5–45% solvent B
(95% ACN in 0.1% formic acid) over 60 min and then injected into
the mass spectrometer at a constant column-tip flow rate of ~500
nl/min. The electrospray voltage of 2.2 kV vs. the inlet of the
mass spectrometer was used. The Orbitrap mass spectrometer was
operated in the data-dependent mode to switch automatically between
MS and MS/MS acquisition. Survey full-scan MS spectra were acquired
in Orbitrap with a mass resolution of 60,000 at 400 m/z followed by
eight sequential MS/MS. The AGC target was set to 1,000,000, and
the maximum injection time was 300 ms. MS/MS acquisition was
performed in Orbitrap with the resolution was 15,000 at 400 m/z.
The intensity threshold was 50,000, and the maximum injection time
was 100 ms. The AGC target was set to 100,000, and the isolation
window was 2.0 m/z. Ions with charge states 2+, 3+ and 4+ were
fragmented by collisional induced dissociation with a normalized
collision energy of 30%. In all cases, one microscan was recorded
using dynamic exclusion of 30 sec (20).
Database searching
Mass spectra were searched against the human
International Protein Index (IPI) database (ftp://ftp.ebi.ac.uk/pub/databases/IPI/last_release/old/HUMAN/ipi.HUMAN.v3.35.fasta.gz.)
(IPI human v3.35 fasta with 68,348 entries) using the Bioworks
software (v3.3.1; Thermo Fisher Scientific, Inc.) based on the
Sequest algorithm. The search parameters included the following: i)
Precursor ion mass tolerance <10 ppm; ii) fragment ion mass
tolerance <1 Da; and iii) digestion mode was unspecific. The
corresponding reversed sequence database was used to generate score
criteria that yielded an estimated false positive rate of 1%
(precision of 0.99). To minimize false positives, all output
results were combined together using a homemade software to
generate score criteria: The cross-correlation scores (Xcorr) of
matches were >2.81, 3.22 and 3.41 for charged state 2, 3 and 4
peptide ions, respectively. To obtain reliable protein
identification, only peptides with a ΔCn score >0.1 were used,
and the ranks of the primary scores were 1, and the posterior error
probability (PEP) <0.001.
Statistical analysis
The processed spectra were analyzed using an
unpaired Student's t-test and Wilcoxon tests. All the results were
expressed as mean ± standard deviation (SD) and P<0.05 was
considered to indicate a statistically significant difference.
Results
MALDI analysis
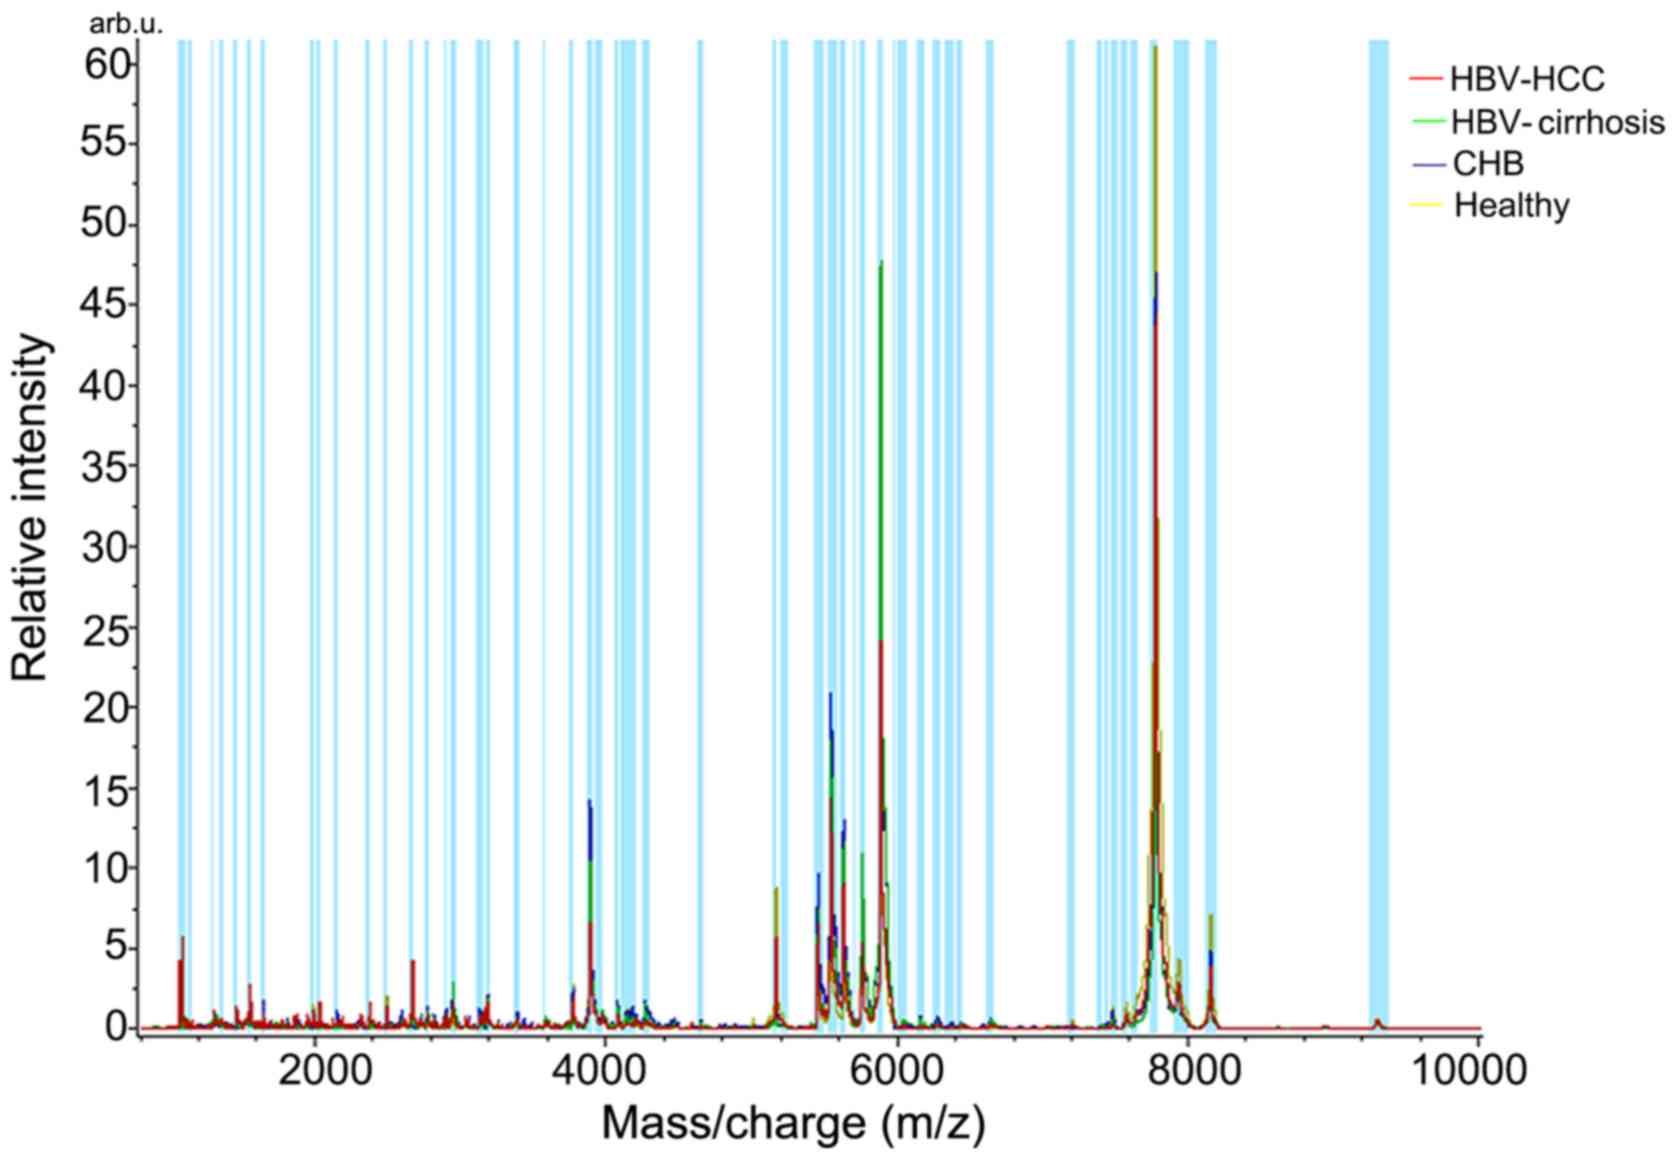
Spectra of serum samples from healthy controls and
patients with CHB, HBV-cirrhosis and HBV-HCC were imported into the
CLINPROT™ software to calculate the average spectrum (Fig. 1). A total of 48 peaks exhibited
differential expression (P<0.05; data not shown), and Table IV lists 14 peaks of those with
significant difference (P<0.002).
| Table IV.Mass spectral characteristics of
proteins with differential expression (P<0.002) among four
cohorts. |
Table IV.
Mass spectral characteristics of
proteins with differential expression (P<0.002) among four
cohorts.
| m/z | D Avea |
P-valueb | Ave1c | Ave2 | Ave3 | Ave4 | SD1d | SD2 | SD3 | SD4 |
|---|
| 7,640.48 | 55.99 | 0.00000226 | 48.86 | 28.66 | 44.11 | 84.65 | 21.70 | 8.21 | 21.01 | 32.43 |
| 2,660.05 | 46.62 | 0.00004990 | 66.87 | 43.13 | 20.25 | 30.52 | 28.27 | 27.82 | 6.36 | 15.85 |
| 7,566.59 | 33.07 | 0.00004990 | 37.92 | 27.73 | 35.34 | 60.80 | 13.17 | 9.16 | 16.64 | 21.45 |
| 5,976.55 | 9.68 | 0.00058200 | 14.99 | 19.00 | 12.17 | 9.31 | 8.40 | 5.13 | 2.81 | 4.43 |
| 2,937.65 | 42.39 | 0.00088600 | 57.73 | 76.85 | 66.34 | 34.45 | 28.98 | 34.06 | 22.27 | 17.12 |
| 7,766.86 | 1,262.36 | 0.00096300 | 1,239.76 | 828.43 | 1,169.62 | 2,090.79 | 749.16 | 634.90 | 928.54 | 777.18 |
| 1,058.64 | 31.95 | 0.00096300 | 35.85 | 9.12 | 3.90 | 28.29 | 42.83 | 6.32 | 1.67 | 33.54 |
| 5,565.33 | 98.45 | 0.00122000 | 83.87 | 122.32 | 154.94 | 56.49 | 65.32 | 70.08 | 84.19 | 55.09 |
| 2,368.23 | 20.91 | 0.00122000 | 42.39 | 26.12 | 21.47 | 29.93 | 17.54 | 10.19 | 6.76 | 13.75 |
| 6,050.56 | 10.16 | 0.00122000 | 15.66 | 22.27 | 14.05 | 12.12 | 5.69 | 10.15 | 4.82 | 4.51 |
| 5,750.52 | 146.73 | 0.00143000 | 124.86 | 241.56 | 220.51 | 94.82 | 90.33 | 168.06 | 96.76 | 99.01 |
| 8,143.45 | 127.58 | 0.00187000 | 127.14 | 100.15 | 137.06 | 227.73 | 82.10 | 81.36 | 90.53 | 96.91 |
| 5,447.78 | 124.68 | 0.00187000 | 129.59 | 144.22 | 200.11 | 75.43 | 146.64 | 85.24 | 124.50 | 78.80 |
| 6,023.21 | 8.10 | 0.00187000 | 14.76 | 18.78 | 12.82 | 10.68 | 6.00 | 7.40 | 6.00 | 3.56 |
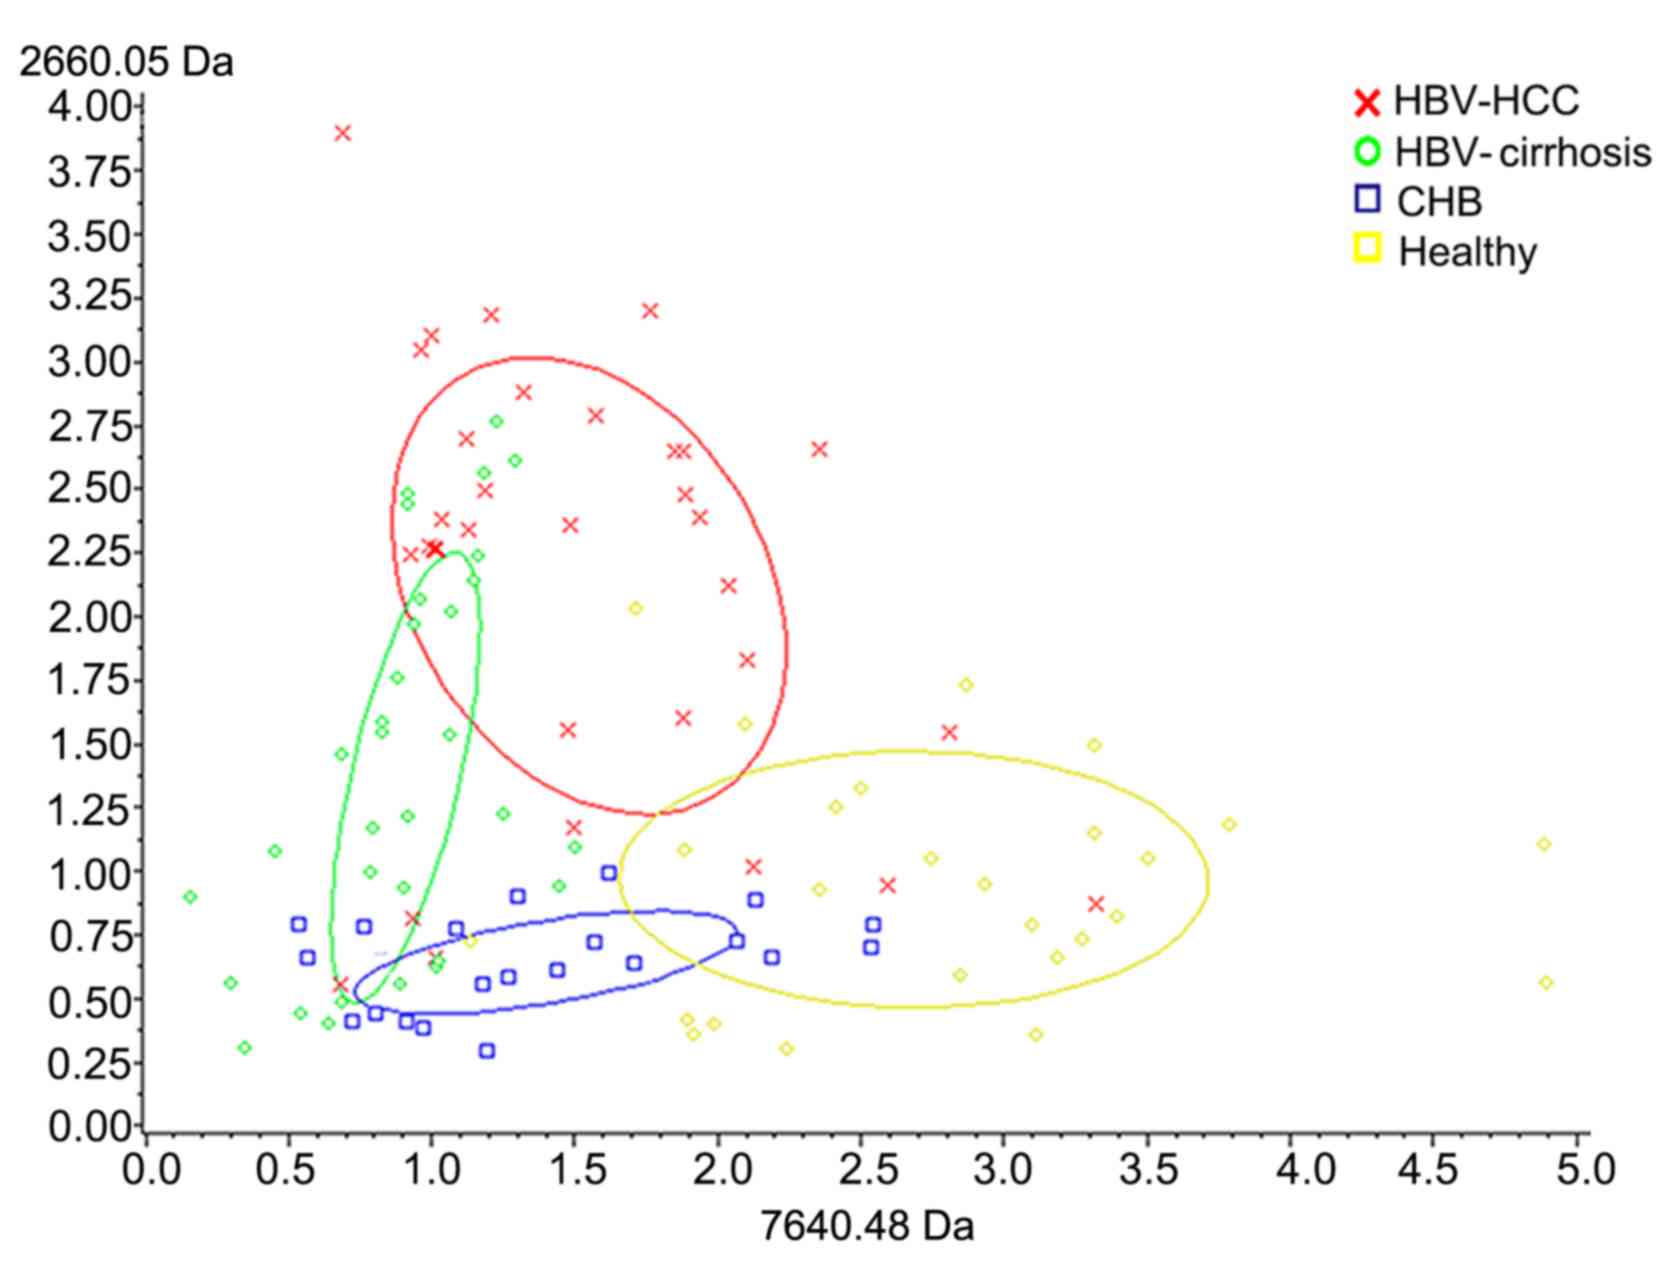
To assess the classification efficiency, the mean ±
SD of the mass of the 14 peak values was calculated. Among them,
2,660.05 and 7,640.48 Da demonstrated the most significant
differential expression (P<0.0001; Fig. 2 presents their average peak values
and relative concentrations in the four groups). Notably, the peak
values of 2,660.05 Da in healthy controls and patients with CHB
were similar, and the intensity level was increased in patients
with HBV-cirrhosis and was increased even further in patients with
HBV-HCC. The current data indicated that the degree of fucosylation
may increase with the development of HCC. On the other hand, the
peak value of 7,640.48 Da was the highest in healthy controls,
suggesting a decreasing degree of fucosylation during disease
progression. Overall, the two peptides appeared to have
discriminatory potential (Fig.
3).
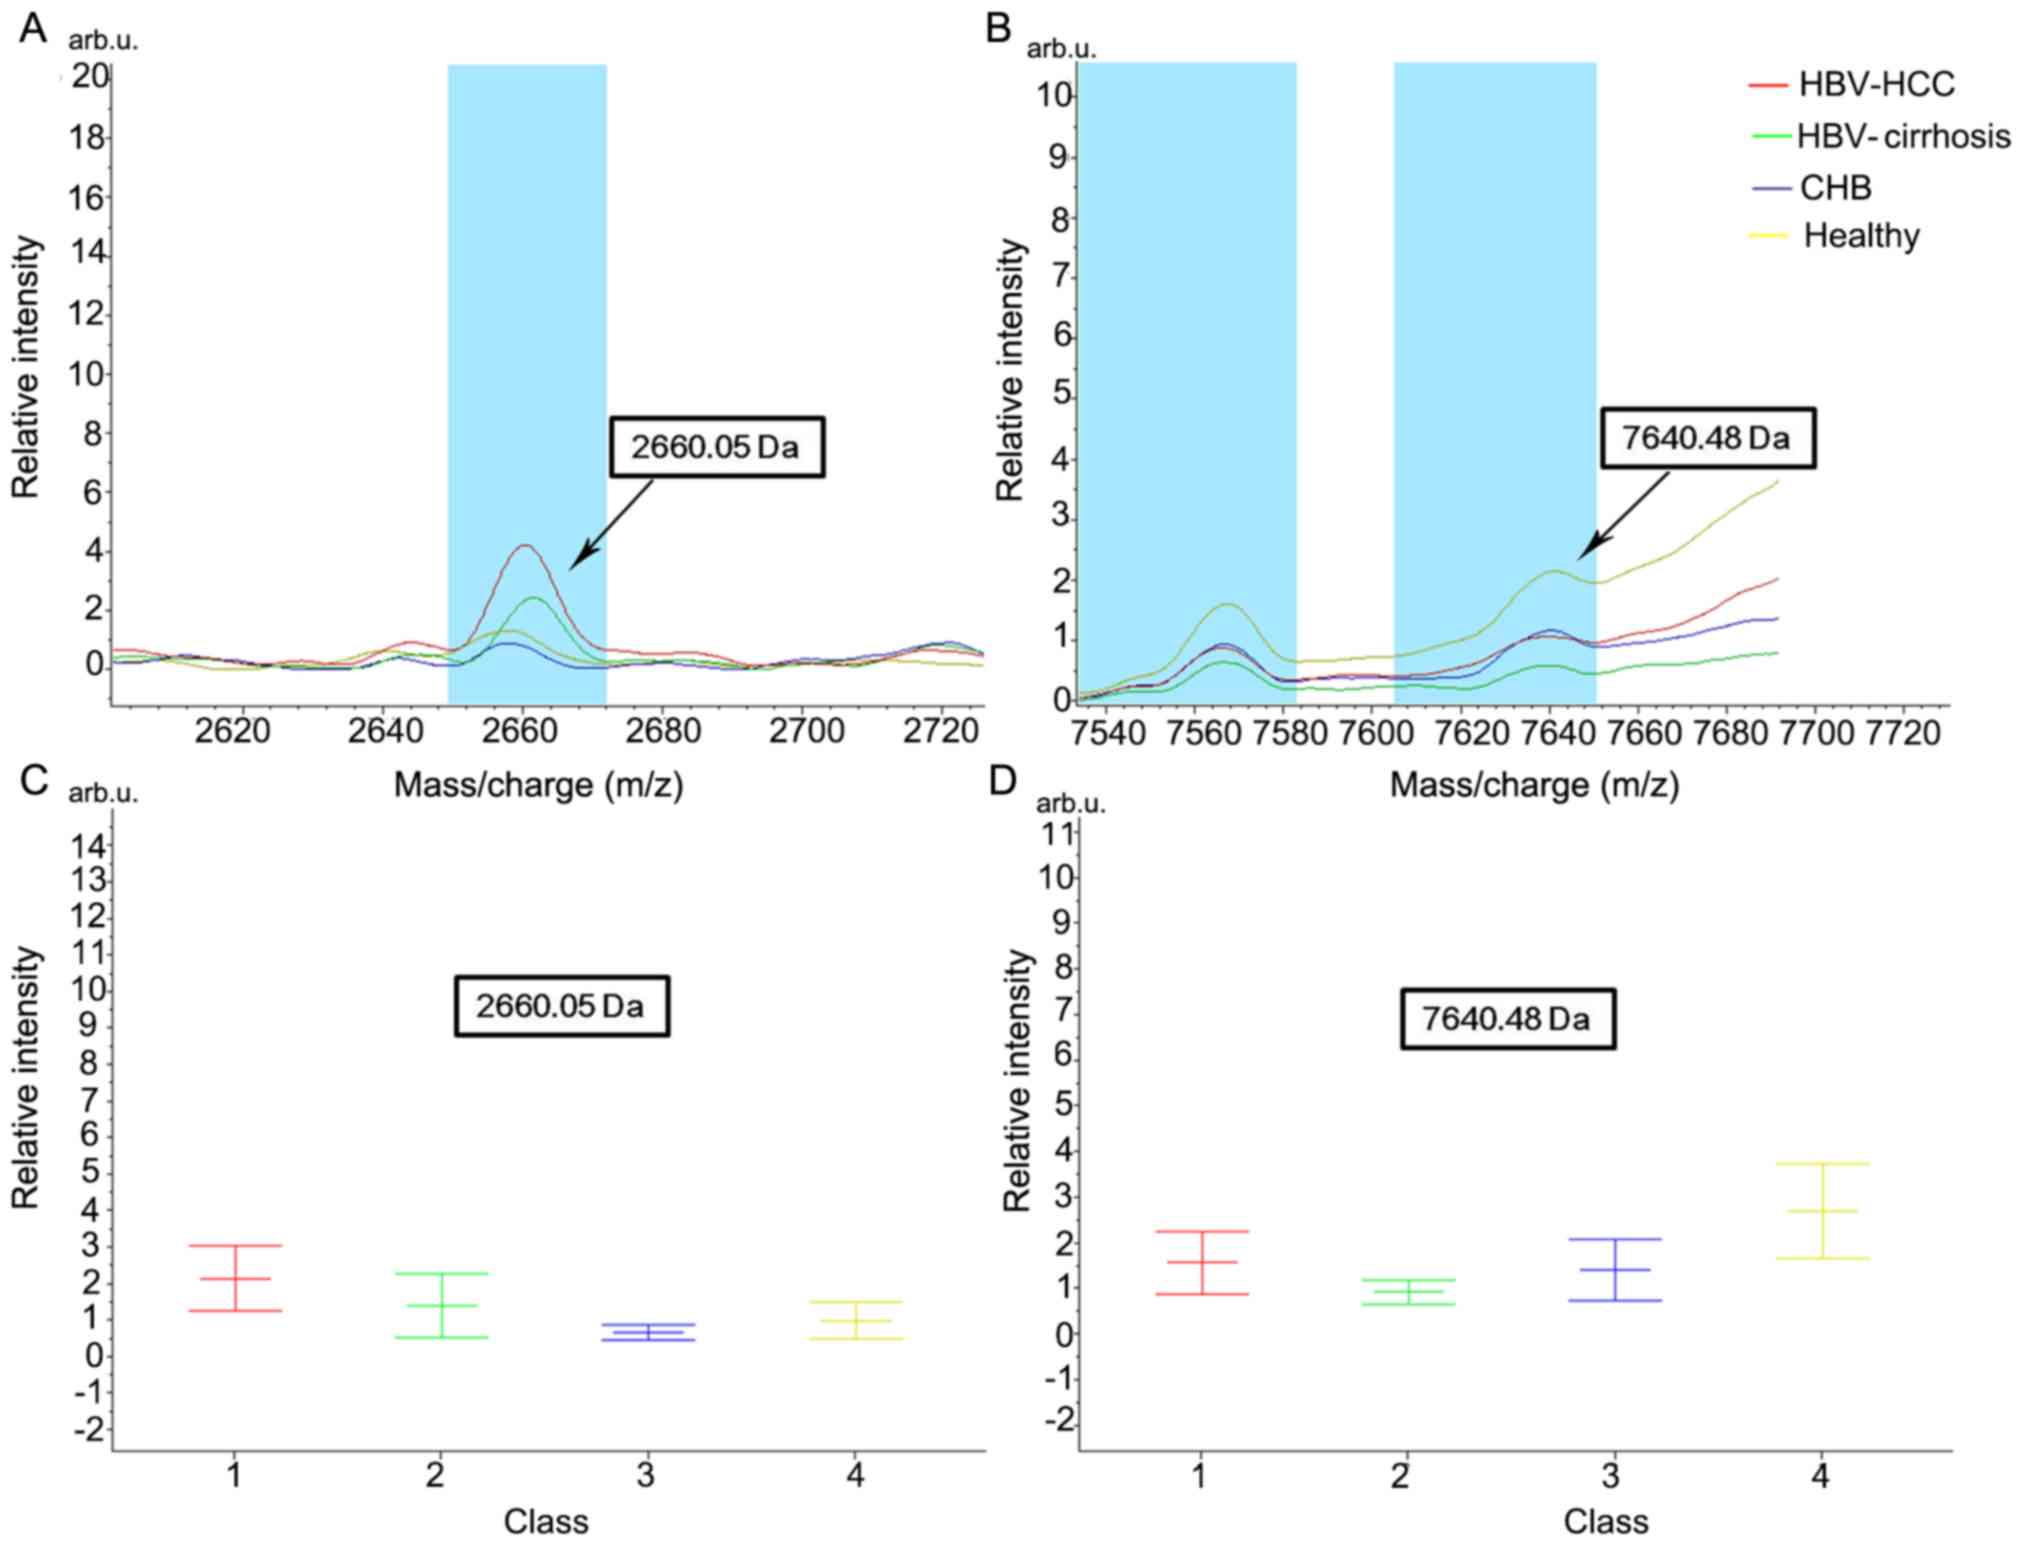 | Figure 2.Average peak values and relative
concentrations in the four groups of protein 2,660.05 and 7,640.48
Da. Sample spectrum indicating the average peak value for proteins
of (A) 2,660.05 and (B) 7,640.48 Da in healthy individuals and
patients with CHB, HBV-cirrhosis and HBV-HCC, with corresponding
relative intensity (mean ± standard deviation) for (C) 2,660.05 and
(D) 7,640.48 Da. HBV, hepatitis B virus; CHB, chronic hepatitis B;
HBV-cirrhosis, HBV-infected cirrhosis; HBV-HCC, HBV-infected
hepatocellular carcinoma. |
Analysis of classification models and
blind testing
Peak values obtained from the training cohort were
processed using the SNN algorithm in CLINPROT™ software to
establish classification models for cross-validation. Using this
method, three models were established to distinguish HCC from all
serum samples (HBV-HCC vs. HBV-cirrhosis + CHB + healthy controls),
from HBV-associated chronic liver diseases (HBV-HCC vs.
HBV-cirrhosis + CHB) and from HBV-associated cirrhosis (HBV-HCC vs.
HBV-cirrhosis). Table V presents the
peak values, constituting three classification models.
| Table V.Peaks of the HCC diagnostic
classification models. |
Table V.
Peaks of the HCC diagnostic
classification models.
| Condition | Peaks of the
classification model (m/z) |
|---|
| HBV-HCC vs.
HBV-cirrhosis + CHB + healthy controls | 9,290.06, 2,660.05,
2,368.23, 1,862.71, 4,282.99, 3,963.52, 6,023.31 |
| HBV-HCC vs.
HBV-cirrhosis + CHB | 3,963.79, 2,368.23,
5,565.53, 2,660.05, 4,133.59, 3,377.94 |
| HBV-HCC vs.
HBV-cirrhosis | 4,645.24, 2,660.05,
1,097.92, 3,916.84, 6,181.58, 3,023.25, 2,368.23 |
By using serum samples collected from the blinded
test cohort, the accuracy of the established classification models
was examined. According to the present results, the models had a
sensitivity and specificity of 74.31 and 76.32%, respectively, to
distinguish HCC from all serum samples, 81.65 and 83.08%,
respectively, to distinguish HCC from HBV-associated cirrhosis and
chronic hepatitis B, and 88.99 and 84.62%, respectively, to
distinguish HCC from HBV-associated cirrhosis (Table VI). When these models were combined
with AFP measurement (AFP >20 ng/ml), the sensitivity and
specificity were elevated to 80.73 and 87.37%, 87.16 and 90.00%,
and 92.66 and 93.84%, respectively (Table VI).
| Table VI.Blind test results of HCC diagnostic
classification models and the results of joint AFP detection. |
Table VI.
Blind test results of HCC diagnostic
classification models and the results of joint AFP detection.
| Condition | Sensitivity, % | Specificity, % |
|---|
| HBV-HCC vs.
HBV-cirrhosis + CHB + healthy controls | 74.31 (81/109) | 76.32
(145/190) |
| HBV-HCC vs.
HBV-cirrhosis + CHB + healthy controls (+ AFP >20 ng/ml) | 80.73 (88/109) | 87.37
(166/190) |
| HBV-HCC vs.
HBV-cirrhosis + CHB | 81.65 (89/109) | 83.08
(108/130) |
| HBV-HCC vs.
HBV-cirrhosis + CHB (+ AFP >20 ng/ml) | 87.16 (95/109) | 90.00
(117/130) |
| HBV-HCC vs.
HBV-cirrhosis | 88.99 (97/109) | 84.62 (55/65) |
| HBV-HCC vs.
HBV-cirrhosis (+ AFP >20 ng/ml) | 92.66
(101/109) | 93.85 (61/65) |
In addition, serum samples from 9 patients with
cirrhosis 1 year before HCC diagnosis and from 6 patients with
cirrhosis exhibiting no signs of HCC for 3 years were collected.
The HBV-HCC vs. HBV-cirrhosis model was applied to analyze their
data; 7/9 (77.78%) patients with HCC were classified into the HCC
group, and all 6 patients without HCC were classified into the
cirrhosis group (Table VII). The
present results suggest that the aforementioned classification
models may be useful for early HCC diagnosis.
| Table VII.Blinded test results of the third
analysis cohort. |
Table VII.
Blinded test results of the third
analysis cohort.
| Occurrence of
HCC | HBV-infected
cirrhosis, n | HBV-infected HCC,
n |
|---|
| HCC occurrence
within 1 year | 2 | 7 |
| No HCC occurrence
within 3 years | 6 | 0 |
Identification of candidate
biomarkers
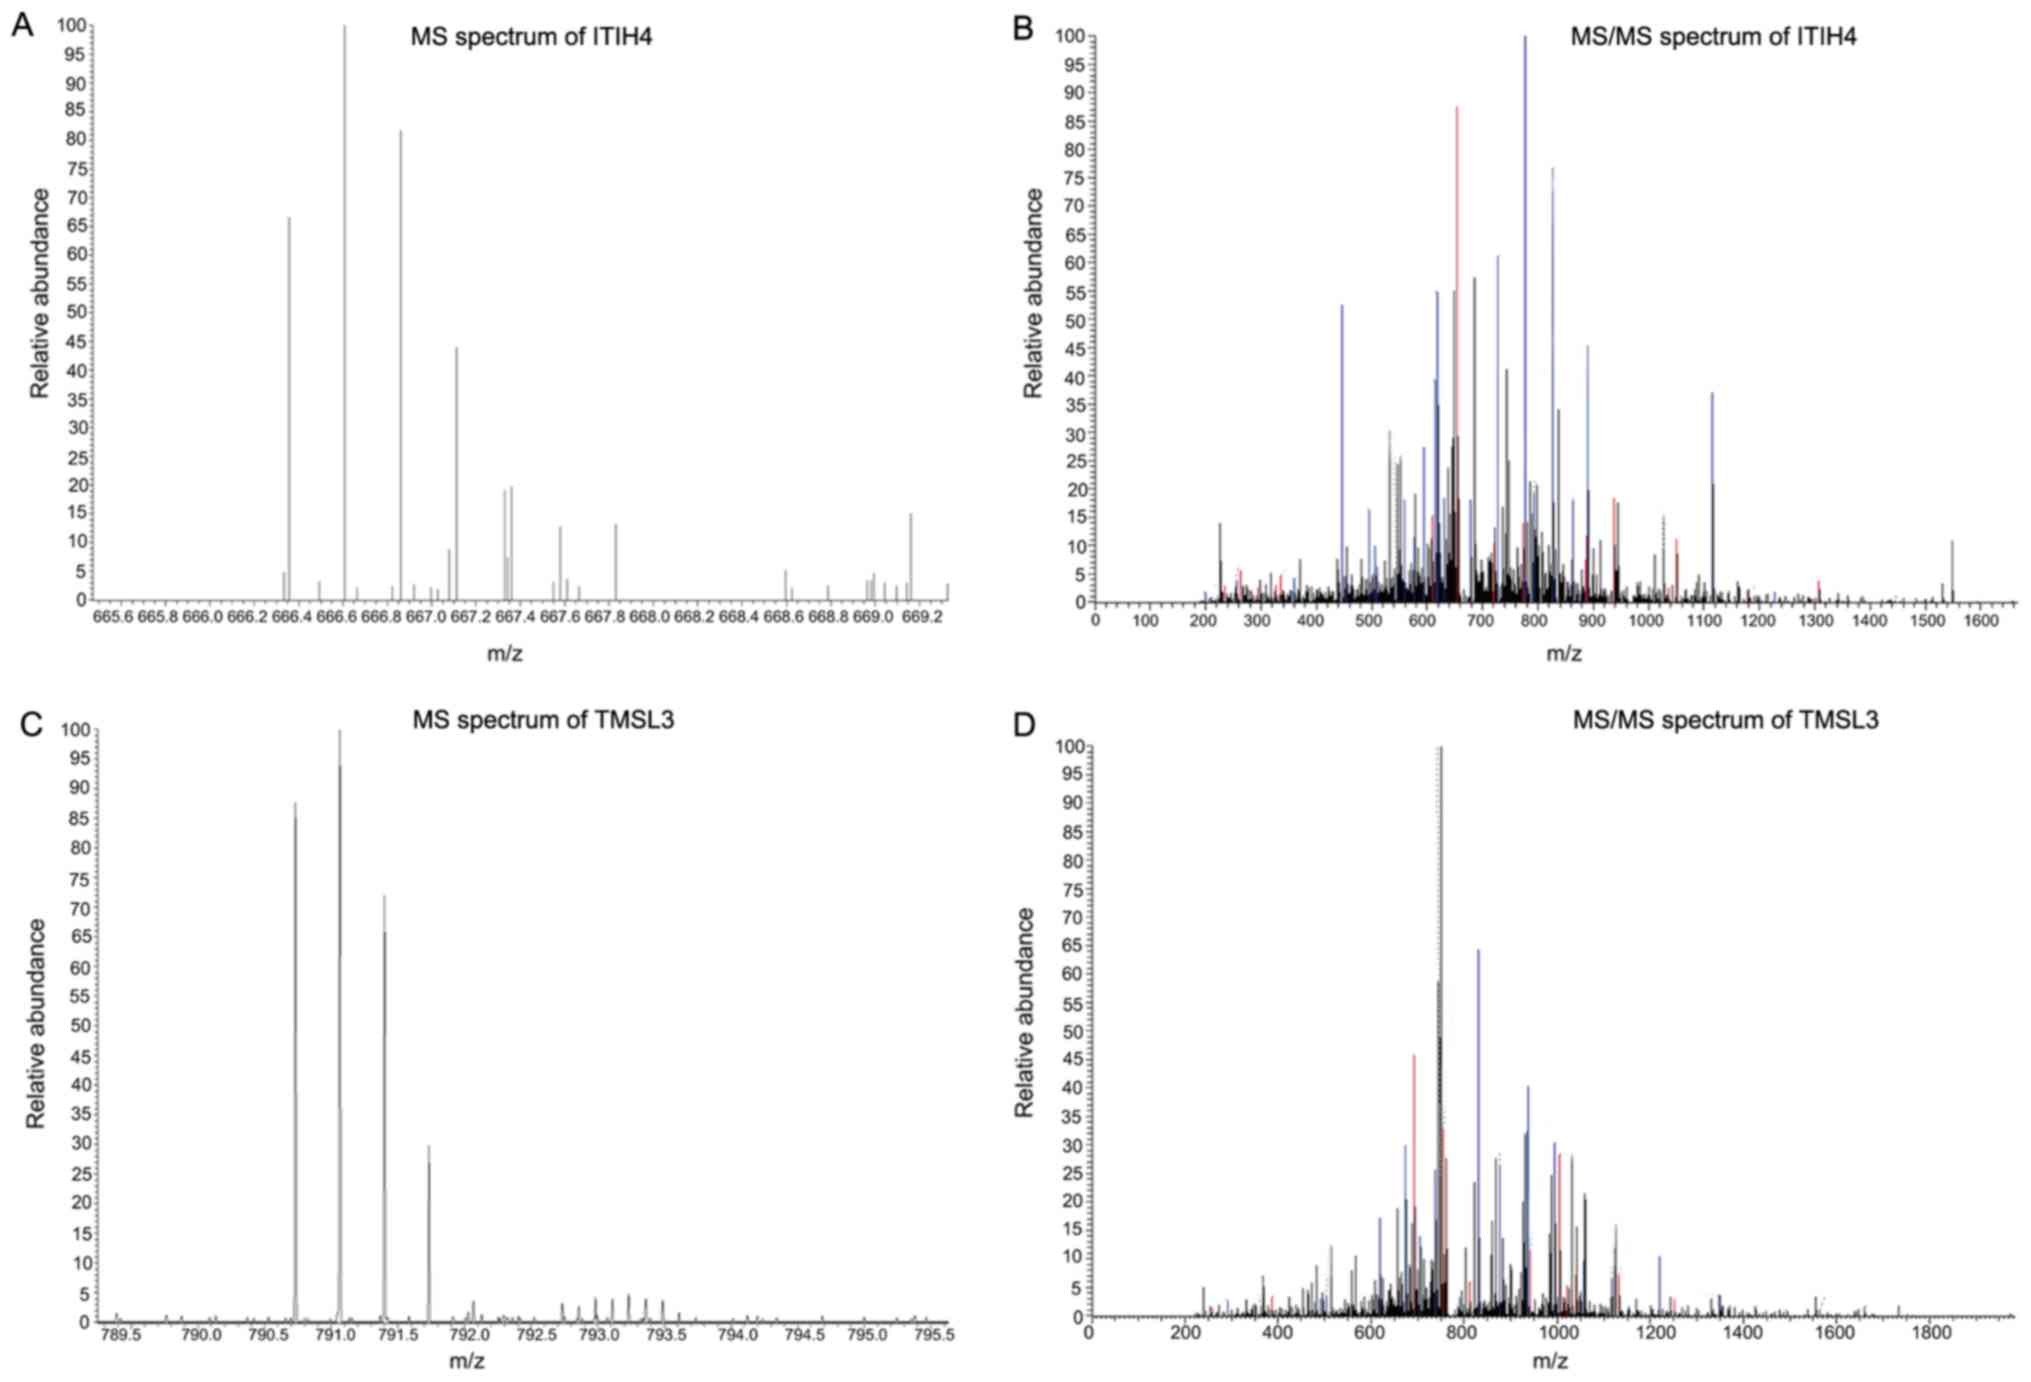
Two peptides (2,660.05 and 2,368.23 Da) were
included in the peak values with differential expression (Table IV) and in the peak values
constituting the classification models (Table V). Therefore, nano-LC-ESI-MS/MS
analysis was performed for their isolation and identification. This
revealed that the 2,660.05 Da peptide was isoform 1 of
inter-α-trypsin inhibitor heavy chain 4 precursor (ITIH4), while
the 2,368.23 Da peptide was thymosin β-4-like protein 3 (TMSL3;
Fig. 4).
Discussion
In our previous study (16), an LCA-based fucosylated glycoprotein
spectrum was established for differentiating HCC diagnosis;
however, the ultimate goal is to develop a novel method that is
more useful in clinical practice. MALDI-TOF MS could detect peak
values with a mass-to-charge ratio between 1,000 and 10,000 m/z,
which are peptides with a molecular weight <10 kD. Previously,
trypsin was used to digest all fucosylated glycoproteins that were
captured by LCA-coated beads (16);
however, this complex operation, together with the unsatisfactory
results in blinded validation, resulted in this model being less
appropriate for clinical application. In the present study, the
captured proteins were used directly for MALDI-TOF MS. Therefore,
only proteins <10 kD, including peptides produced from natural
degradation of some proteins, were measured. In comparison with our
previous study, the model established in the present study
presented some advantages: i) It identified more differentially
expressed peak values (while in the previous study 89 peak values
with differential expression were detected and only 36 were of
statistical significance, the present study identified 48/64
detected peak values to be statistically significant); ii) it
exhibited a stronger predictive ability (data not shown); and iii)
it obtained improved blinded test results (the sensitivity and
specificity of the HBV-HCC vs. HBV-cirrhosis model were 81.00 and
82.00%, respectively, in our previous study, while they were
increased to 88.99 and 84.62%, respectively, in the present study).
The main reason for these differences may be due to our previous
study analyzing the peptides after protein digestion, while the
present peptides included not only glycopeptides, but also other
peptides. Furthermore, the majority of these peptides had a
molecular weight <5,000 Da, indicating that numerous peptide
segments with the same or similar size may mask the differential
expression of glycopeptides (21).
The sample size for blind testing was increased to
299 in the present study, thus the results were more reliable.
Additionally, the HBV-HCC vs. HBV-cirrhosis classification model
was used to analyze serum samples collected from patients with
cirrhosis 1 year before being diagnosed with HCC. The model
identified 7/9 (77.78%) patients as HCC, suggesting that the model
is able to identify HCC prior to diagnostic imaging. Indeed, when
HCC is diagnosed by imaging, it is often too late to miss the
optimal treatment time. The potential of the HBV-HCC vs.
HBV-cirrhosis model established in the present study may require
further examination by expanding the sample size for blinded
testing, as well as investigating differential peak values involved
in the model. However, the ability of the present model to diagnose
HCC early suggests that it may be able to assist in the clinical
staging of HCC and cirrhosis. Since ClinprotTools v2.1 is mainly
suitable for analysis between two groups of samples, the
simultaneous analysis of multiple groups of samples requires
improvement, which limits the development of studies on
classification models and clinical stages of HCC and cirrhosis.
Therefore, upon setting up the experimental group, patients with
liver cancer were not divided into subgroups according to their
stage, and patients with cirrhosis were not graded for liver
function tests.
The present results indicate that the protein peaks
of the three diagnostic classification models in Table V were not the same, and that they
were also different from the protein peaks listed in Table IV. There are two main reasons for
this discrepancy. The first reason is that the model established in
the present study used the SNN algorithm. The most important
consideration of this algorithm is the ability to classify the
combination of protein peaks, not the classification ability of a
single protein peak (22).
Therefore, when establishing a diagnostic classification model, it
is important not to select the protein peaks that have the most
significant differences, but to consider which protein peaks are
most powerful when combined. This is why the differential protein
peaks used in the classification of the HCC group and the different
control groups in Table V were
different. The second reason is that Table IV lists only the 14 protein peaks
with the most significant differences when the analysis software
analyzed four groups of samples simultaneously (P<0.002).
However, a total of 48 proteins were identified as differentially
expressed (P<0.05) and only 14 protein peaks with the most
significant differences (P<0.002) were presented due to space
limitations, which does not indicate that these 14 protein peaks
were more important than others when building the classification
diagnosis model. For the purpose of the present study, only some
examples of proteins with different expression patterns in the
occurrence and development of HCC were presented (Fig. 2). Additionally, an example was
provided to illustrate the ability of two differential protein
peaks to classify four groups of samples (Fig. 3). The present study tried to
establish a classification model to diagnose four groups of samples
simultaneously, but the results were unsatisfactory (data not
shown). The three diagnostic classification models in Table V were used to distinguish between the
HCC group and the different control groups, not to distinguish
among the four groups of samples simultaneously, hence why they are
different from the protein peaks listed in Table IV.
Despite these differences, the 2,660.05 and 2,368.23
Da peak values were identified in both calculations (Tables IV and V). Therefore, these peptides were purified
and identified as ITIH4 and TMSL3. Since ITIH4, TMSL3 and their
respective antibodies are not sold commercially, and our laboratory
does not have the technology for recombinant protein expression,
follow-up experiments, such as western blotting, investigating
these two proteins were not performed in the present study. Future
research should focus on indicating whether these two proteins may
be used as novel biomarkers for HCC diagnosis.
Notably, our previous study (16) reported defucosylation of some
glycoproteins during the development and progression of HCC.
Although this finding was inconsistent with the majority of
existing studies (9–14), it was re-observed in the present
study. The 7,640.48 Da peptide had the highest expression in
healthy controls, suggesting that the degree of fucosylation may
decrease during HCC progression. Therefore, fucosylation of serum
glycoproteins is a complex and variable process during HCC
development, and its mechanism requires more in-depth investigation
in the future.
In conclusion, the present study focused on
fucosylated glycoproteins with a molecular weight <10 kD and
established a classification model of low-molecular-weight
fucosylated glycoproteins for early diagnosis of HCC. The proposed
diagnostic model underwent preliminary clinical validation and
exhibited great potential in the early diagnosis of HCC. However,
the present study was only a single-center study. Additionally,
cases were not divided into subgroups, data for comparison with
other types of cancer were lacking and there were various
limitations for its practical application in the clinic. In the
future, the number of samples should be increased, cases should be
subdivided, and multi-center studies should be conducted to make
the current model more appropriate for use in clinical
practice.
Acknowledgements
Not applicable.
Funding
The present study was supported by the Natural
Science Foundation of Fujian (grant nos. 2017J01326 and
2017J01219), Science and Technology Plan Project of Longhai (grant
no. 201811) and the Key Project of Science and Technology of Fujian
(grant no. 2012Y0058).
Availability of data and materials
The datasets used and/or analyzed during the current
study are available from the corresponding author on reasonable
request.
Authors' contributions
JL and MC conceived and supervised the present
study. JL and KW designed the experiments. WY, YJ and ZH performed
the experiments. HY and SH collected the blood samples. WY and YH
analyzed the data. WY and YJ wrote the manuscript. MC and JL
revised the manuscript. All authors reviewed the results and all
authors read and approved the final manuscript.
Ethics approval and consent to
participate
The present study was reviewed and approved by the
Ethics Committee of Fuzhou General Hospital of Nanjing Command
(Fuzhou, China), and written informed consent was obtained from all
participants.
Patient consent for publication
Not applicable.
Competing interests
The authors declare that they have no competing
interests.
Glossary
Abbreviations
Abbreviations:
|
MALDI-TOF MS
|
matrix-assisted laser
desorption/ionization time-of-flight mass spectrometry
|
|
AFP
|
α-fetoprotein
|
|
ITIH4
|
inter-α-trypsin inhibitor heavy chain
4 precursor
|
|
TMSL3
|
thymosin β-4-like protein 3
|
|
HCC
|
hepatocellular carcinoma
|
|
HBV
|
hepatitis B virus
|
|
LCA
|
Lens culinaris agglutinin
|
|
CHB
|
chronic hepatitis B
|
|
US
|
ultrasound
|
|
CT
|
computed tomography
|
|
SNN
|
Supervised Neural Network
|
References
|
1
|
Torre LA, Bray F, Siegel RL, Ferlay J,
Lortet-Tieulent J and Jemal A: Global cancer statistics, 2012. CA
Cancer J Clin. 65:87–108. 2015. View Article : Google Scholar : PubMed/NCBI
|
|
2
|
Marrero JA: Hepatocellular carcinoma. Curr
Opin Gastroenterol. 22:248–253. 2006. View Article : Google Scholar : PubMed/NCBI
|
|
3
|
El-Serag HB, Mason AC and Key C: Trends in
survival of patients with hepatocellular carcinoma between 1977 and
1996 in the United States. Hepatology. 33:62–65. 2001. View Article : Google Scholar : PubMed/NCBI
|
|
4
|
Hoofnagle JH and di Bisceglie AM: The
treatment of chronic viral hepatitis. N Engl J Med. 336:347–356.
1997. View Article : Google Scholar : PubMed/NCBI
|
|
5
|
Di Bisceglie AM and Hoofnagle JH:
Elevations in serum alpha-fetoprotein levels in patients with
chronic hepatitis B. Cancer. 64:2117–2120. 1989. View Article : Google Scholar : PubMed/NCBI
|
|
6
|
Sherman M, Peltekian KM and Lee C:
Screening for hepatocellular carcinoma in chronic carriers of
hepatitis B virus: Incidence and prevalence of hepatocellular
carcinoma in a North American urban population. Hepatology.
22:432–438. 1995. View Article : Google Scholar : PubMed/NCBI
|
|
7
|
Buamah PK, Gibb I, Bates G and Ward AM:
Serum alpha fetoprotein heterogeneity as a means of differentiating
between primary hepatocellular carcinoma and hepatic secondaries.
Clin Chim Acta. 139:313–316. 1984. View Article : Google Scholar : PubMed/NCBI
|
|
8
|
Taketa K, Okada S, Win N, Hlaing NK and
Wind KM: Evaluation of tumor markers for the detection of
hepatocellular carcinoma in Yangon General Hospital, Myanmar. Acta
Med Okayama. 56:317–320. 2002.PubMed/NCBI
|
|
9
|
Mita Y, Aoyagi Y, Suda T and Asakura H:
Plasma fucosyltransferase activity in patients with hepatocellular
carcinoma, with special reference to correlation with fucosylated
species of alpha-fetoprotein. J Hepatol. 32:946–954. 2000.
View Article : Google Scholar : PubMed/NCBI
|
|
10
|
Mehta A and Block TM: Fucosylated
glycoproteins as markers of liver disease. Dis Markers. 25:259–265.
2008. View Article : Google Scholar : PubMed/NCBI
|
|
11
|
Comunale MA, Lowman M, Long RE, Krakover
J, Philip R, Seeholzer S, Evans AA, Hann HW, Block TM and Mehta AS:
Proteomic analysis of serum associated fucosylated glycoproteins in
the development of primary hepatocellular carcinoma. J Proteome
Res. 5:308–315. 2006. View Article : Google Scholar : PubMed/NCBI
|
|
12
|
Jiang K, Shang S, Li W, Guo K, Qin X,
Zhang S and Liu Y: Multiple lectin assays for detecting
glyco-alteration of serum GP73 in liver diseases. Glycoconj J.
32:657–664. 2015. View Article : Google Scholar : PubMed/NCBI
|
|
13
|
Shang S, Li W, Qin X, Zhang S and Liu Y:
Aided diagnosis of hepatocellular carcinoma using serum fucosylated
haptoglobin ratios. J Cancer. 8:887–893. 2017. View Article : Google Scholar : PubMed/NCBI
|
|
14
|
Tanabe K, Kitagawa K, Kojima N and Iijima
S: Multifucosylated alpha-1-acid glycoprotein as a novel marker for
hepatocellular carcinoma. J Proteome Res. 15:2935–2944. 2016.
View Article : Google Scholar : PubMed/NCBI
|
|
15
|
Wang M, Shen J, Herrera H, Singal A,
Swindell C, Renquan L and Mehta A: Biomarker analysis of
fucosylated kininogen through depletion of lectin reactive
heterophilic antibodies in hepatocellular carcinoma. J Immunol
Methods. 462:59–64. 2018. View Article : Google Scholar : PubMed/NCBI
|
|
16
|
Liao J, Zhang R, Qian H, Cao L, Zhang Y,
Xu W, Li J, Wu M and Yin Z: Serum profiling based on fucosylated
glycoproteins for differentiating between chronic hepatitis B and
hepatocellular carcinoma. Biochem Biophys Res Commun. 420:308–314.
2012. View Article : Google Scholar : PubMed/NCBI
|
|
17
|
Marrero JA, Fontana RJ, Fu S, Conjeevaram
HS, Su GL and Lok AS: Alcohol, tobacco and obesity are synergistic
risk factors for hepatocellular carcinoma. J Hepatol. 42:218–224.
2005. View Article : Google Scholar : PubMed/NCBI
|
|
18
|
Bruix J, Sherman M, Llovet JM, Beaugrand
M, Lencioni R, Burroughs AK, Christensen E, Pagliaro L, Colombo M
and Rodés J; EASL Panel of Experts on HCC, : Clinical management of
hepatocellular carcinoma. Conclusions of the Barcelona-2000 EASL
conference. European Association for the Study of the Liver. J
Hepatol. 35:421–430. 2001. View Article : Google Scholar : PubMed/NCBI
|
|
19
|
Faria SC, Szklaruk J, Kaseb AO, Hassabo HM
and Elsayes KM: TNM/Okuda/Barcelona/UNOS/CLIP International
Multidisciplinary Classification of hepatocellular carcinoma:
Concepts, perspectives, and radiologic implications. Abdom Imaging.
39:1070–1087. 2014. View Article : Google Scholar : PubMed/NCBI
|
|
20
|
Cao J, Hu Y, Shen C, Yao J, Wei L, Yang F,
Nie A, Wang H, Shen H, Liu Y, et al: Nanozeolite-driven approach
for enrichment of secretory proteins in human hepatocellular
carcinoma cells. Proteomics. 9:4881–4888. 2009. View Article : Google Scholar : PubMed/NCBI
|
|
21
|
Sparbier K, Asperger A, Resemann A,
Kessler I, Koch S, Wenzel T, Stein G, Vorwerg L, Suckau D and
Kostrzewa M: Analysis of glycoproteins in human serum by means of
glycospecific magnetic bead separation and LC-MALDI-TOF/TOF
analysis with automated glycopeptide detection. J Biomol Tech.
18:252–258. 2007.PubMed/NCBI
|
|
22
|
Baggerly KA, Morris JS, Wang J, Gold D,
Xiao LC and Coombes KR: A comprehensive approach to the analysis of
matrix-assisted laser desorption/ionization-time of flight
proteomics spectra from serum samples. Proteomics. 3:1667–1672.
2003. View Article : Google Scholar : PubMed/NCBI
|