Introduction
Hepatocellular carcinoma (HCC) is one of the few
cancer types associated with a rising incidence in recent years,
with the incidence in Mongolia being as high as 93.7 per 100,000
individuals (1). Certain aspects of
the etiology and development of HCC have been reported, and it is
speculated that the complex pathogenesis of HCC is associated with
cirrhosis, viral hepatitis, aflatoxins, specific chemical
carcinogens and abnormal regulation of hormones (2,3). Among
these, chronic liver disease is the most important factor leading
to the occurrence of liver cancer (4). The infection of hepatitis B virus (HBV)
accounts for 60% of HCC cases in developing countries and for 23%
of cases in developed countries, while infection of hepatitis C
virus (HCV) accounts for 23% of HCC cases in developing countries
and 20% of cases in developed countries (5). Moreover, sub-Saharan Africa, East Asia
and Southeast Asia are the regions with the highest incidence of
HBV, while USA, Europe and Japan have high incidences of HCV
(4). The incidence of non-alcoholic
fatty liver disease (NAFLD) is increasing with the rise in obesity
and other metabolic syndromes, which seriously affects the health
of the affected individual (6).
According to data generated from a cross-sectional study, 25–30% of
people with a Western lifestyle have a fat content in their liver
that exceeds the normal level; of these, 2–5% suffer from NAFLD,
and 1–2% of the affected adults may be at risk of developing
non-alcoholic steatohepatitis cirrhosis (7).
The incidence of HCC is increasing worldwide;
however, early diagnoses and treatment of HCC remain an issue
(4). Due to the low-level medical
and healthcare in developing countries, the incidence of HCC is
rising, with an estimated global incidence of liver cancer per
100,000 individuals being 9.3 in 2018 (1), and the prognosis is poor (8). For patients without liver cirrhosis and
distant metastasis of the tumor, hepatic resection is currently the
first treatment choice and the most effective way to treat HCC
(4). However, for patients with
liver cirrhosis, surgical resection is a contraindication, and
liver transplantation should be performed to achieve a favorable
prognosis (4). The size of the tumor
is not the definite limiting factor for surgery; the presence or
absence of distant metastasis and vascular invasion are the main
factors considered for surgical resection (9). In recent years, laparoscopic
hepatectomy has become a major surgical method of radical resection
of tumors (10). Furthermore,
compared with traditional open surgery, laparoscopic surgery is
minimally invasive, which has the advantages of small trauma, fewer
perioperative complications and quick postoperative recovery, while
having a similar prognosis to open surgery (10). For patients without indications for
surgical resection, minimally invasive treatment can be applied
according to a variety of factors such as tumor characteristics,
complications, tumor site and performance status (4). Local treatment methods include
radiofrequency ablation and microwave ablation, while other
therapeutic methods are locoregional therapies such as
chemoembolization and radioembolization (11). Moreover, systemic chemotherapy is a
feasible method to improve the survival rate of patients with
advanced liver cancer (3,4). Sorafenib is a first-line drug for the
treatment of advanced HCC (12).
With the development of sorafenib derivatives, additional
satisfactory antitumor drugs are expected to be developed (12). In addition, gene chip technology for
the study of liver cancer can accurately depict the molecular
expression profile of HCC and identify the specific genes
associated with HCC (13–15).
Microarray technology, which is a highly efficient
and accurate transcriptional expression technology, has been
successfully applied in the screening of molecular markers of
almost all human malignant tumors, particularly liver cancer. The
present study obtained GSE112790, GSE84402 and GSE74656 microarray
datasets from the Gene Expression Omnibus (GEO) database. In
addition, RNA-sequence (seq) data were downloaded from The Cancer
Genome Atlas (TCGA) database and further analyzed via
bioinformatics methods. These analyses resulted in the
identification of a series of hub genes that may be associated with
HCC, which might be used as molecular markers in the early
diagnosis and treatment targets of HCC.
Materials and methods
Data source
The present study downloaded three datasets, namely
GSE112790 (16), GSE84402 (17) and GSE74656 (https://www.ncbi.nlm.nih.gov/geo/query/acc.cgi?acc=GSE74656),
from the GEO database (http://www.ncbi.nlm.nih.gov/geo/), and the following
conditions were met for each set of samples: i) Samples were
obtained from human liver tissue; ii) chips contain both healthy
samples and tumor tissue of HCC; iii) the total number of samples
≥10.
GSE112790 and GSE84402 datasets were based on GPL570
(Affymetrix Human Genome U133 Plus 2.0 Array; Affymetrix; Thermo
Fisher Scientific, Inc.; http://www.affymetrix.com/index.affx), while GSE74656
was based on GPL16043 (GeneChip® PrimeView™ Human Gene
Expression Array with external spike-in RNAs; Affymetrix; Thermo
Fisher Scientific, Inc.; http://www.affymetrix.com/index.affx). The GSE112790
dataset contained 15 healthy liver tissues and 183 tumor samples,
while the GSE84402 dataset contained 14 healthy liver samples and
14 malignant tissues. Moreover, the GSE74656 dataset contained five
healthy liver and five malignant liver tissues. The RNA-seq of HCC
consists of 374 tumor liver samples and 50 healthy tissues that
were downloaded from TCGA database (https://cancergenome.nih.gov/).
Screening for differentially expressed
genes (DEGs)
The raw data of the gene expression profiles were
analyzed using R software v3.5.2 (https://www.r-project.org) and the Bioconductor
package ‘Limma’ v3.36.5 (https://bioconductor.org/packages/limma/) (18). The robust multi-array average method
(19) was used to complete
background correction and normalization of all original microarray
data. Subsequently, the present study used the combat function of
the ‘sva’ package v3.30.1 (https://bioconductor.org/packages/sva/) (20) of R to remove any batch effect. DEGs
were screened using the ‘Limma’ package, and the Bioconductor
package ‘edgeR’ v3.24.3 (21) was
used to analyze and process the data downloaded from TCGA database.
The screening criteria for DEGs were both adjusted to P<0.01 and
|log fold-change| >2.0.
Functional enrichment analysis of
DEGs
In order to perform Kyoto Encyclopedia of Genes and
Genomes (KEGG; http://www.kegg.jp) pathway and Gene
Ontology (GO; http://geneontology.org) function
analyses, DEGs were submitted to the Database for Annotation,
Visualization and Integrated Discovery (DAVID; http://david.ncifcrf.gov/). Biological annotations
were considered to be significantly enriched when P<0.05. DAVID
bioinformatics resources include an integrated biological knowledge
base and analytical tools designed to systematically extract
biological significance from large gene lists (22). The results were visualized using the
GOChord and GOCircle functions of ‘GOplot’ package v1.0.2
(https://CRAN.R-project.org/package=GOplot) (23).
Construction of protein-protein
interaction (PPI) network and analysis of modules
The Search Tool for the Retrieval of Interacting
Genes (STRING; http://string-db.org/) online
software (24) and Cytoscape tools
were utilized to construct a PPI regulatory network of DEGs.
Cytoscape 3.6.0 (https://cytoscape.org/) is a free software that
graphically displays PPI networks, and performs analysis and
editing. Moreover, Cytoscape is an application that runs on a
personal computer rather than on a web browser (25). Medium confidence (0.400) was implied
in the STRING tool. The present study utilized the plug-in
Molecular Complex Detection (MCODE 1.5.1) (26), an application of Cytoscape, to mine
the core modules of PPI networks that were significantly associated
with liver cancer, and further investigate the biological functions
of the module. The criteria for screening are as follows: Degree
cut-off=2; node score cut-off=0.2; maximum depth=100; and
k-score=2. Hub proteins were selected based on their associations
with other proteins, which were sorted by the degree value in the
network.
Selection and analysis of hub
genes
The numbers of nodes and edges in the PPI network
were counted in order to screen for hub genes. The present study
used the Kaplan-Meier curve to determinate the overall and
disease-free survival of the hub genes in the Liver Hepatocellular
Carcinoma (TCGA, Firehose Legacy; http://www.cbioportal.org/study/summary?id=lihc_tcga)
database of the cBioPortal for cancer genomics (v3.0.2; http://www.cbioportal.org/) (27,28). The
study downloaded the original data of hub genes and used the Renyi
test to determine if there is a significant difference in survival
rate between two groups when their survival curves cross each other
using SAS software v9.4 (SAS Institute, Inc.) (29).
For the purpose of assessing the expression levels
of hub genes in different datasets, these were submitted to the
Oncomine (https://www.oncomine.org/) database
(30), which was also used to
analyze the association between gene expression and tumor grade,
hepatitis virus infection status, satellites and vascular invasion
by analyzing the Wurmbach Liver dataset (31). The clinical data of HCC from TCGA
database was then obtained, and the ‘survival’ package (v3.1–8;
http://CRAN.R-project.org/package=survival) of R
software was used to perform a univariate analysis and construct
the multivariable Cox regression models on BUB1B and UBE2C, and
other clinicopathological parameters, and calculated hazard ratios
and corresponding 95% confidence intervals.
Gene set enrichment analysis
(GSEA)
In order to investigate the biological functions and
pathways of different expression levels of core genes, GSEA was
performed using GSEA software (v4.0.2; http://software.broadinstitute.org/gsea/index.jsp)
(32) with gene set c2
(cp.kegg.v7.0.symbols.gmt) from the Molecular Signatures Database
(MSigDB; http://www.gsea-msigdb.org/gsea/msigdb). The MSigDB of
c2 is a pathway gene set, which was curated from published
canonical pathways and experimental signatures (33). P<0.05 and false discovery rate
(FDR) <0.25 were considered to indicate a statistically
significant difference.
Results
Screening for DEGs
In total, 126 genes that met the differential
threshold were screened by bioinformatics methods. Overall, 83
genes were upregulated and 93 genes were downregulated in the GEO
datasets, which contained a total of 34 healthy samples and 202
cancer samples. In total, 374 tumors and 50 healthy liver tissues
were analyzed in TCGA database using the same bioinformatics
methods, and 3,297 upregulated and 300 downregulated genes were
identified. Hub genes were identified according to the adjusted
P<0.01 and a |log fold-change| of >2.0.
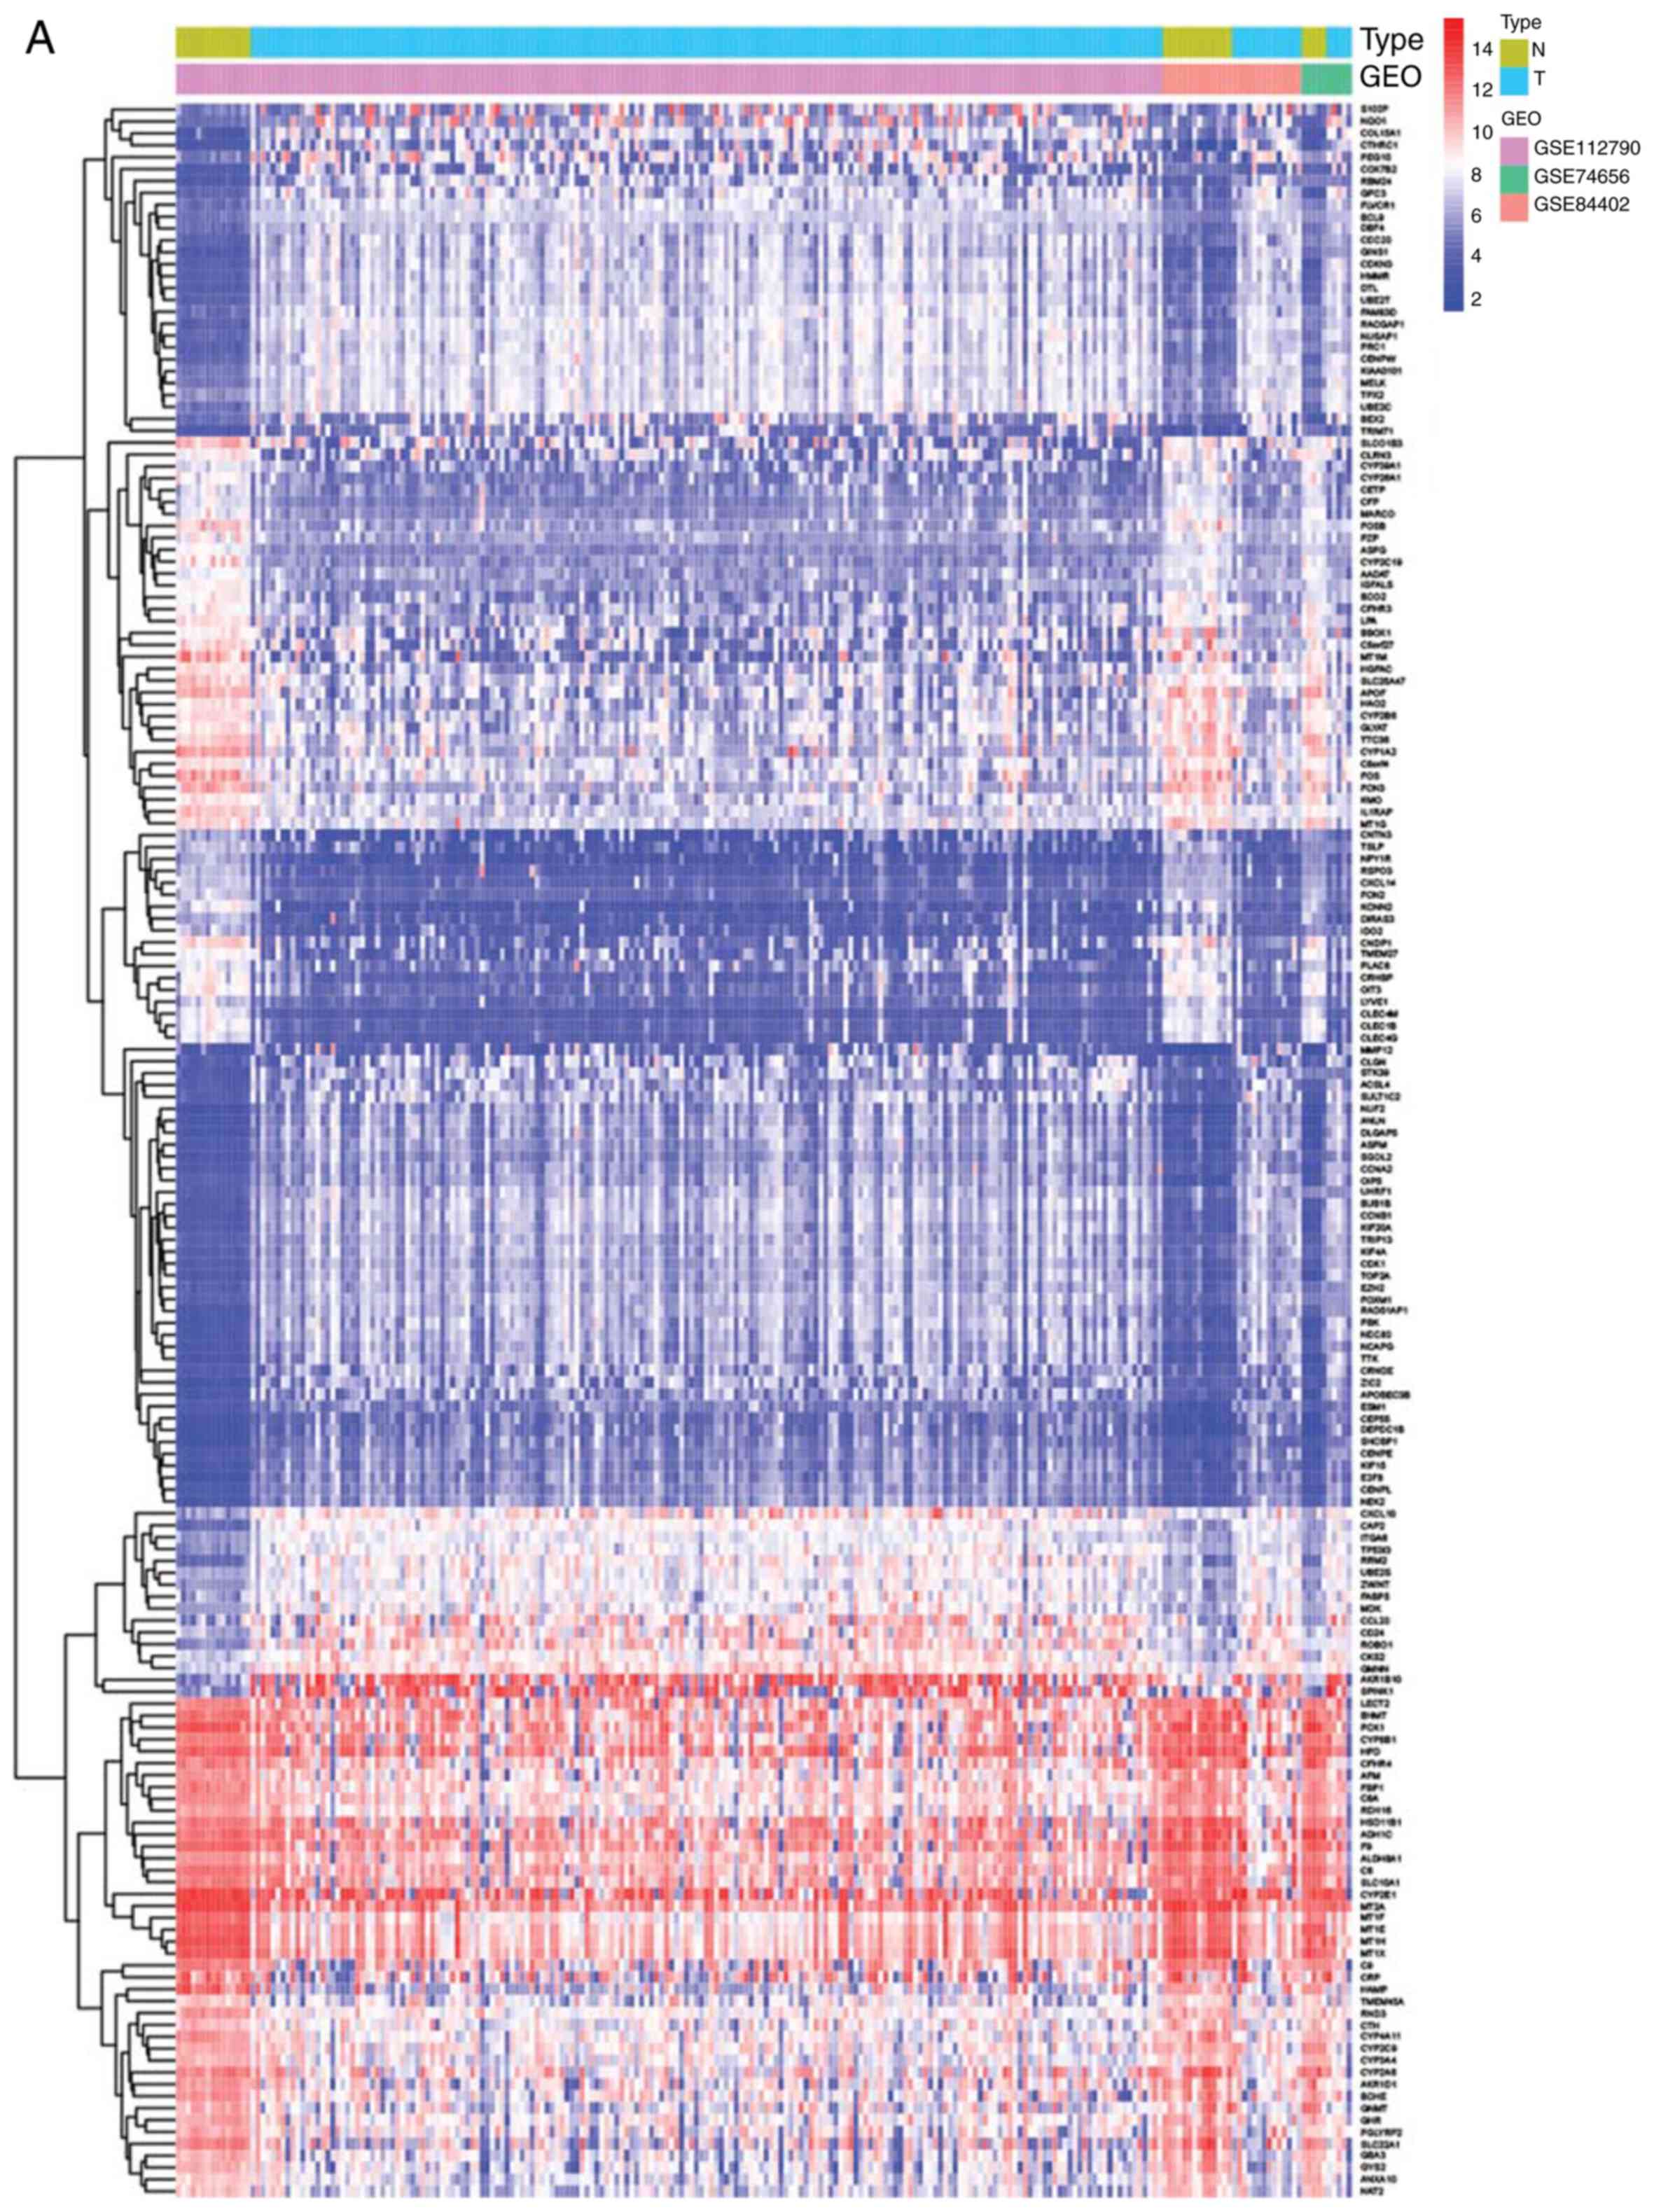
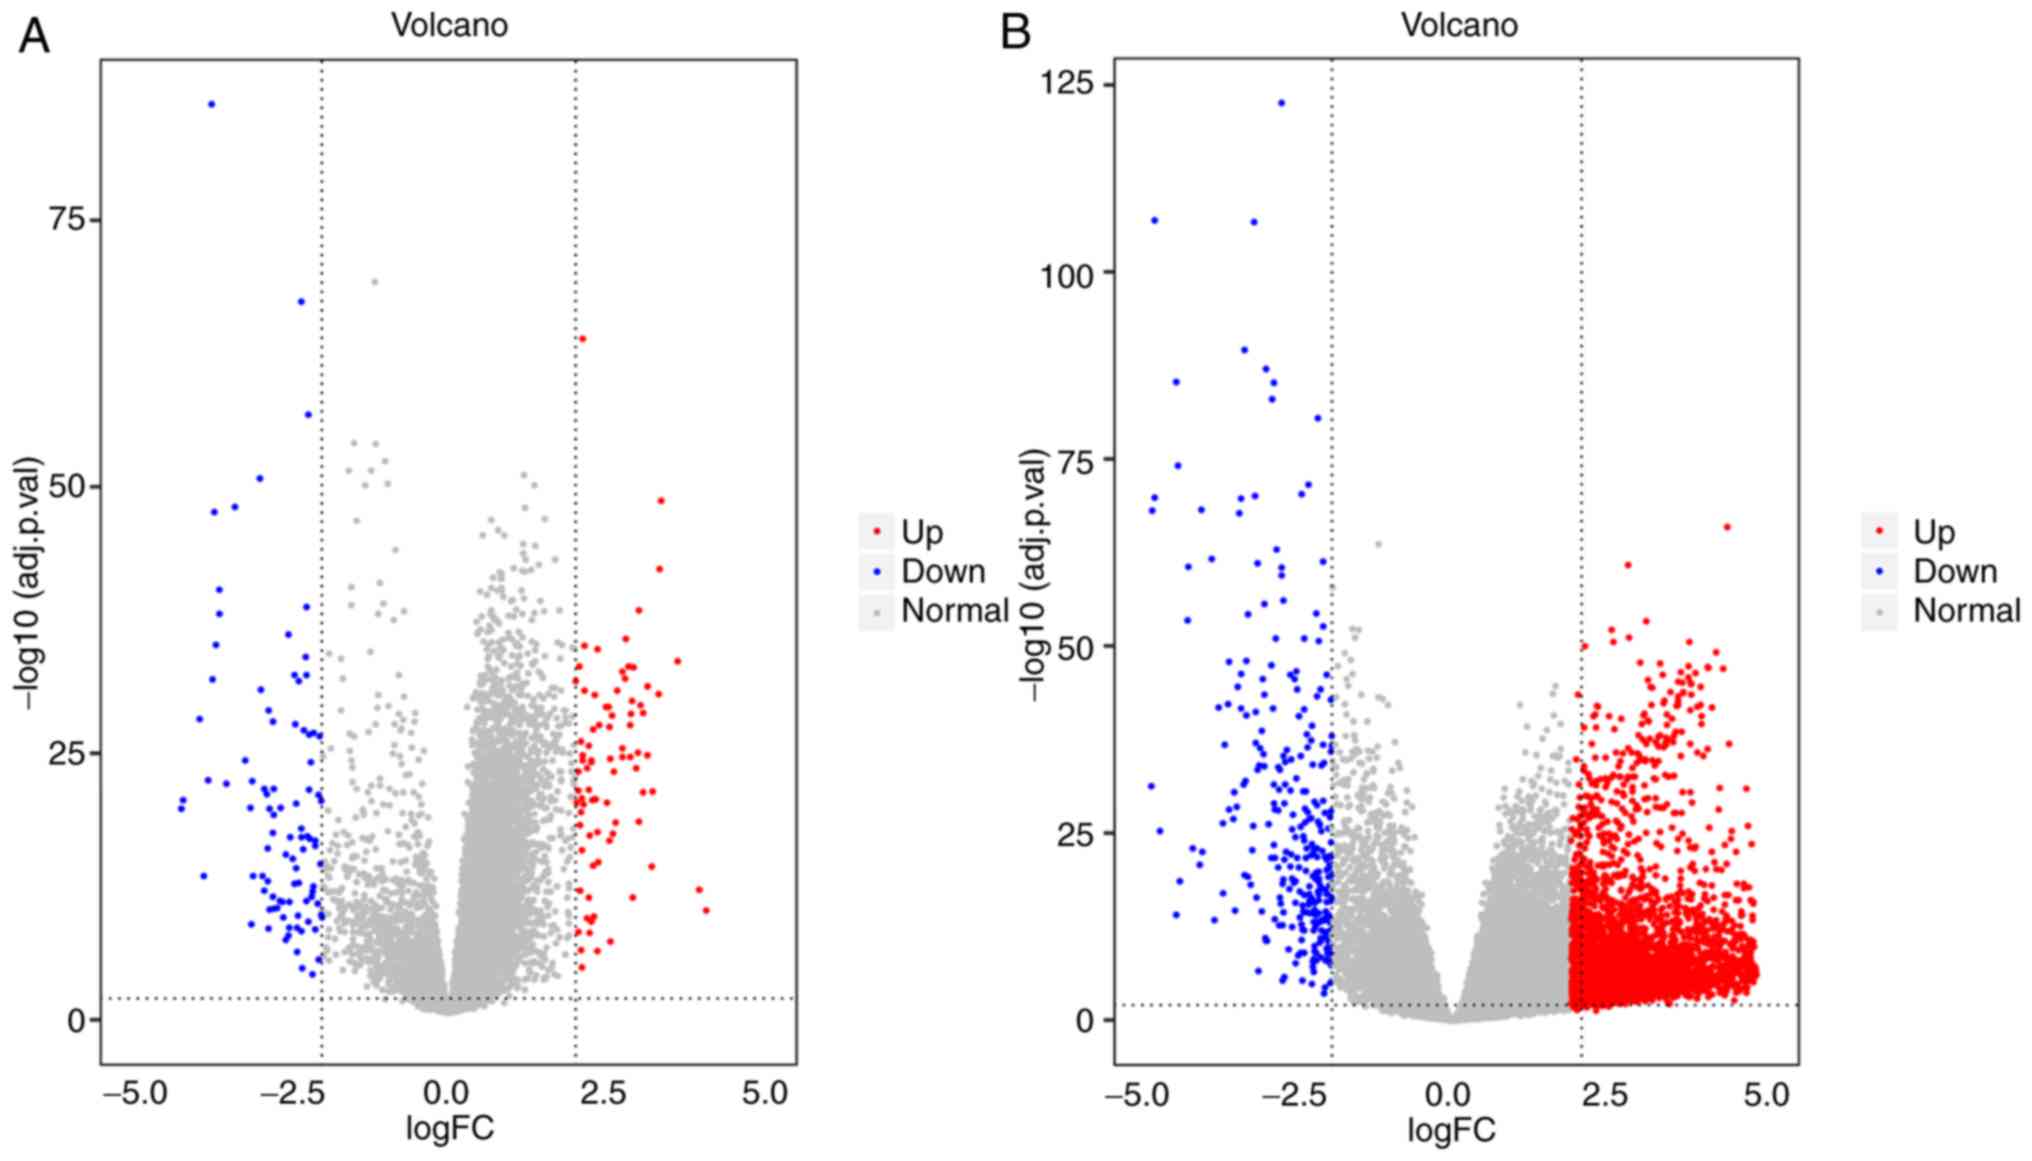
The heatmaps and volcano plots of the DEGs obtained
from the GEO and TCGA databases are shown in Figs. 1 and 2. Heatmaps were created to visualize the
expression values of DEGs in the different samples, while volcano
plots were plotted to present the distribution of each gene based
on the criteria of an adjusted P<0.01 and a |log fold-change| of
>2.0. Via comprehensive bioinformatics analysis of these DEGs,
126 DEGs that existed in both the GEO and TCGA databases were
identified, including 70 upregulated and 56 downregulated genes
(Table I).
 | Table I.DEGs (n=151) in The Cancer Genome
Atlas and Gene Expression Omnibus databases. |
Table I.
DEGs (n=151) in The Cancer Genome
Atlas and Gene Expression Omnibus databases.
| DEGs | Genes |
|---|
| Downregulated | MT1M, HAMP, CNDP1,
SLC22A1, APOF, CLEC4M, FCN3, CLEC1B, CRHBP, KCNN2, OIT3, CYP1A2,
CLEC4G, FOS, C9, MT1F, GYS2, CYP2C19, FOSB, TTC36, MT1H, HAO2,
GBA3, SLCO1B3, CYP26A1, MT1E, NAT2, CYP2B6, PCK1, BCO2, MT1X, LPA,
MARCO, CYP4A11, NPY1R, MT1G, SLC25A47, GHR LYVE1, ASPG PLAC8,
CXCL14, IGFALS, CFP, TSLP, FCN2, IL1RAP, FBP1, DIRAS3, RDH16, PZP,
MT2A, RND3, AADAT, CYP39A1, CETP |
| Upregulated | KIF15, SHCBP1,
MMP12, ESM1, STK39, UHRF1, CENPE, CEP55, COX7B2, TPX2, S100P, GMNN,
ZWINT, CENPL, TRIM71, EZH2, BEX2, MDK, E2F8, TRIP13, CCNA2, CRNDE,
NEK2, CD24, CDK1, KIF4A, DEPDC1B, PEG10, ACSL4, FOXM1, MELK, CDC20,
FLVCR1, ZIC2, OIP5, FAM83D, NQO1, NUSAP1, RBM24, ANLN, SULT1C2,
ASPM, NCAPG, NDC80, UBE2T, UBE2C, RAD51AP1, TOP2A, PRC1, DLGAP5,
KIF20A, DTL, HMMR, TTK, NUF2, ROBO1, CENPW, BUB1B, GPC3, GINS1,
PBK, CCNB1, CTHRC1, COL15A1, CDKN3, RACGAP1, CAP2, RRM2, AKR1B10,
SPINK1 |
Functional enrichment analyses of
DEGS
The present study used DAVID and R software to
perform functional and pathway enrichment analyses for identifying
the biological classification of DEGs. The following conclusions
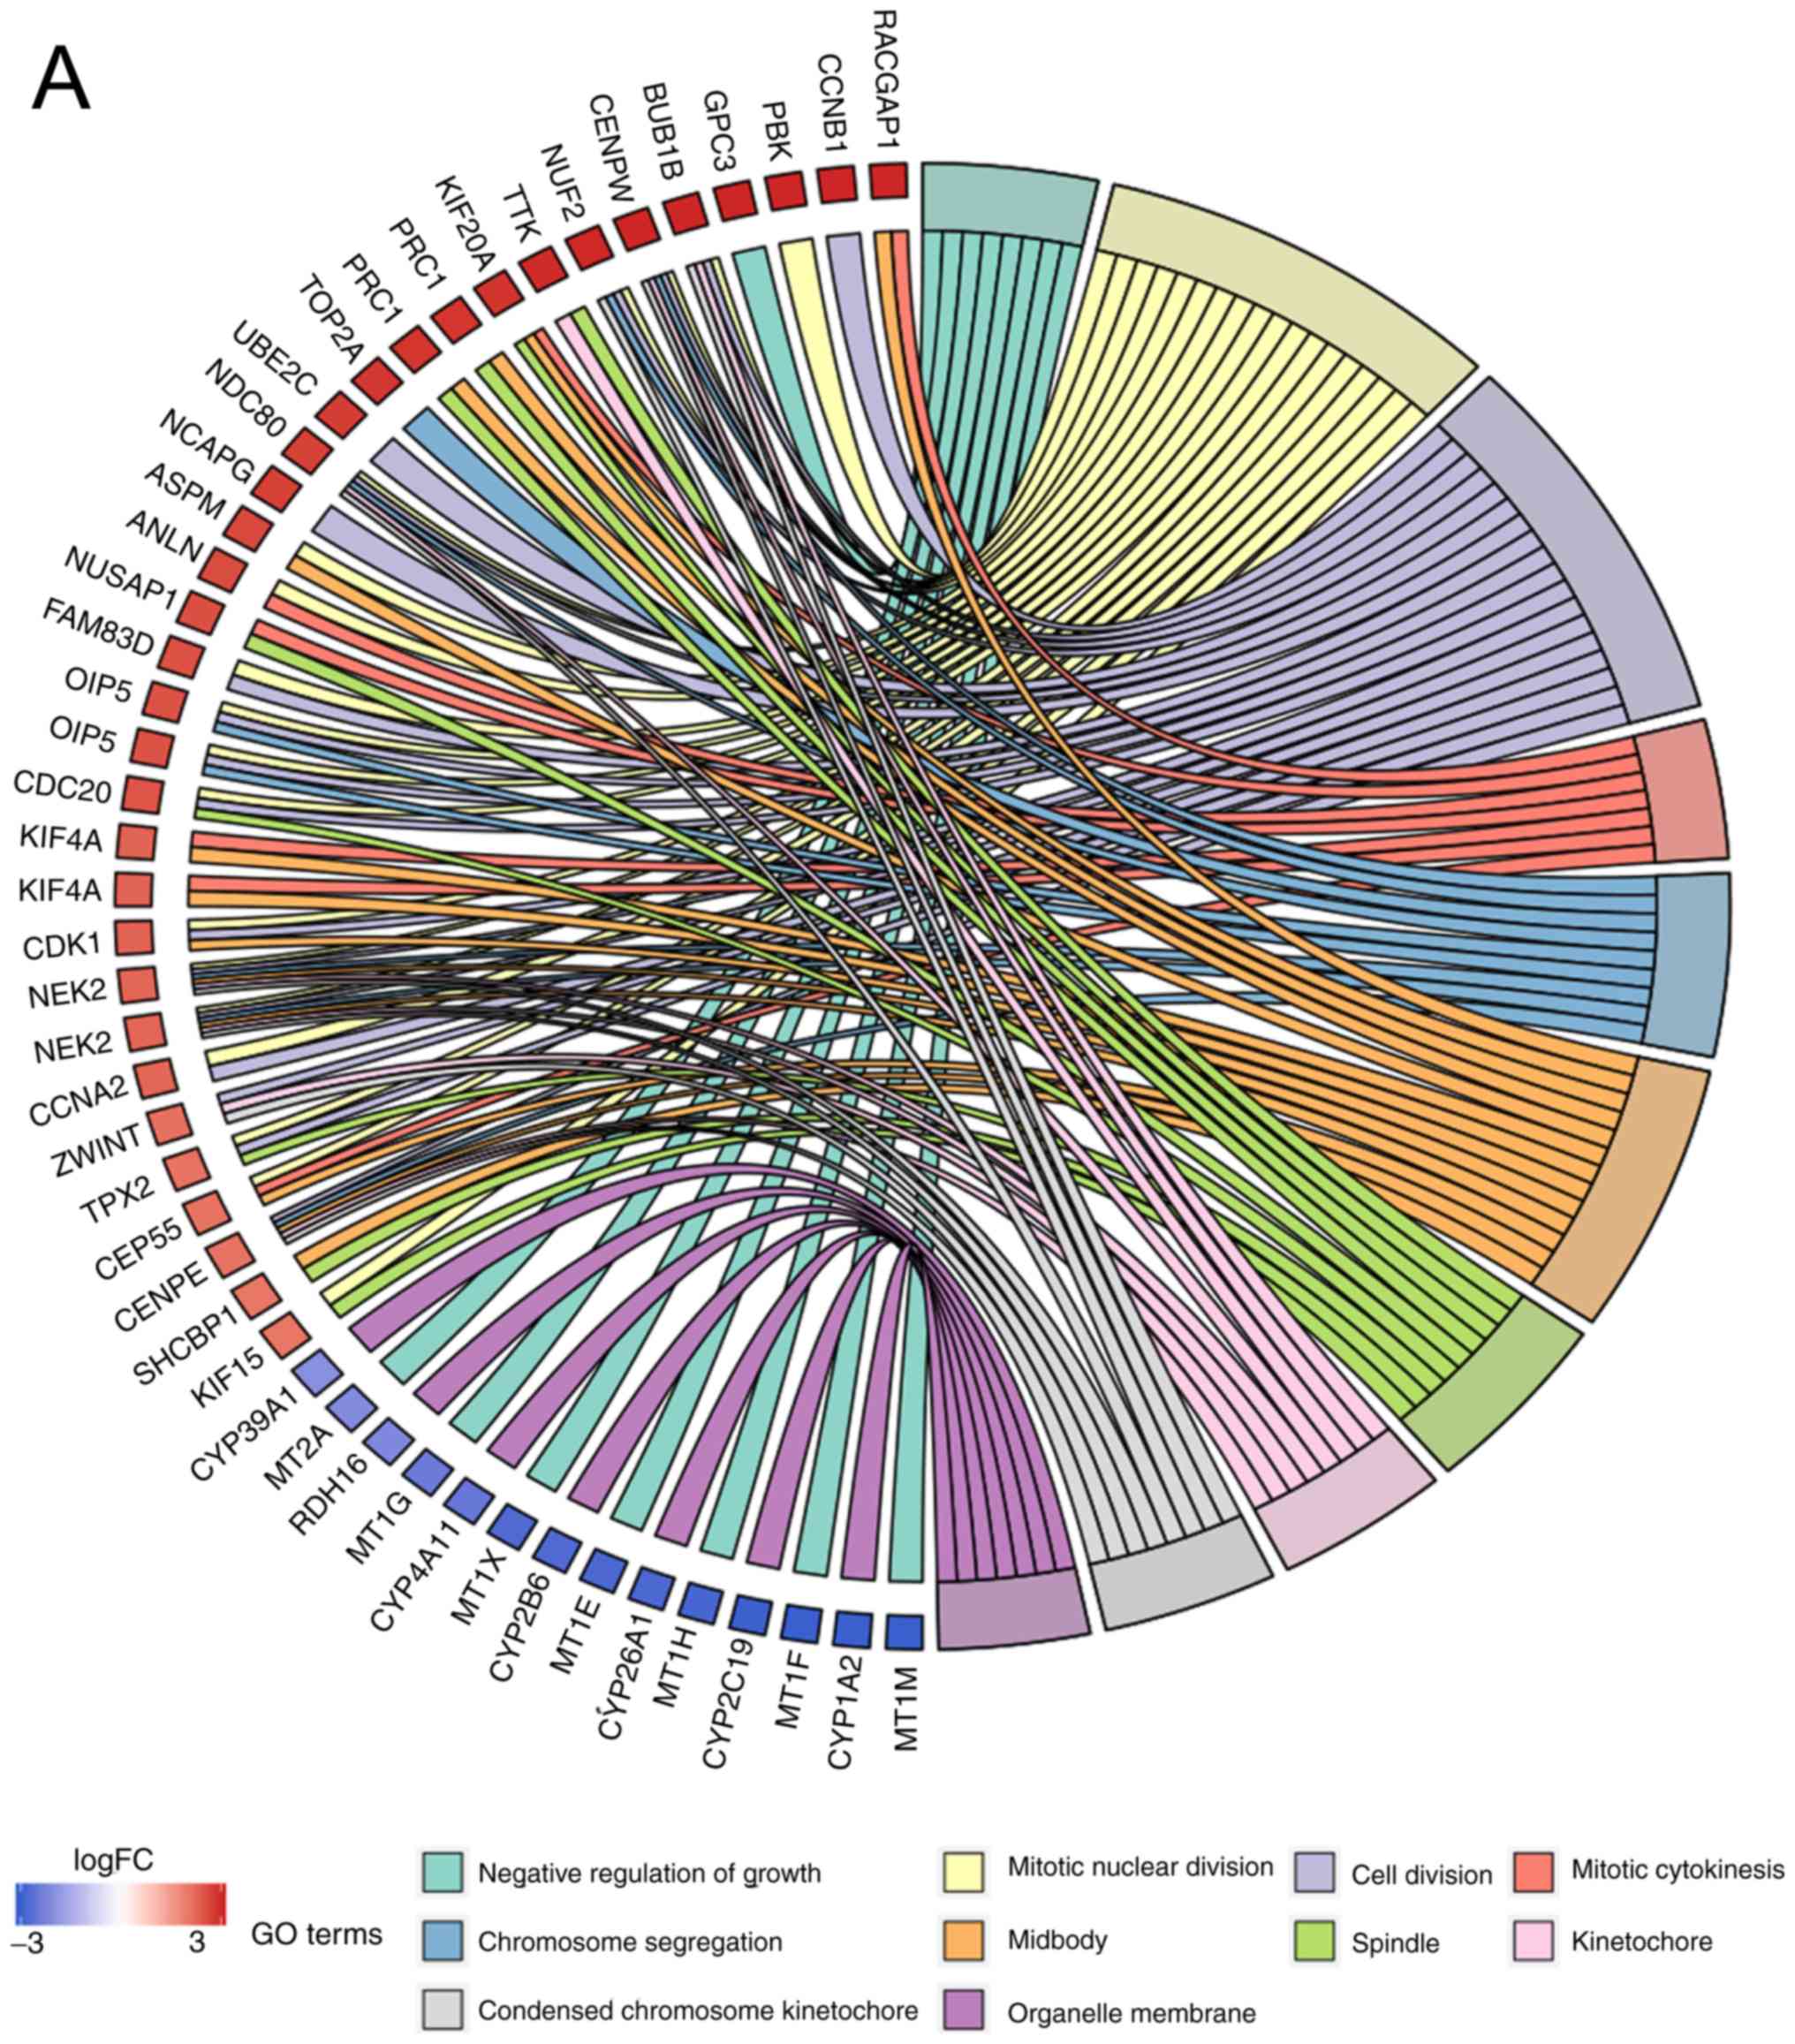
were drawn: i) The DEGs were enriched in 83 GO terms; ii) the
biological processes (BP) of DEGs were primarily enriched in
‘negative regulation of growth’, ‘cell division’, ‘cell
proliferation’, ‘cell migration’ and ‘cell cycle’; iii) molecular
function (MF) was mainly enriched in ‘oxygen binding’,
‘monooxygenase activity’ and ‘protein binding’; and iv) the
‘midbody’, ‘cytosol’ and ‘nucleus’ were primarily enriched in the
cell components (CC) function (Table
SI). The top ten GO terms are presented in (Fig. 3A). The results of the KEGG pathway
enrichment analysis indicated that DEGs were primarily enriched in
18 pathways, with the top six being ‘p53 signaling pathway’
(hsa04115), ‘cell cycle’ (hsa04110), ‘cellular senescence’
(hsa04218), ‘5’ AMP-activated protein kinase (AMPK) signaling
pathway’ (hsa04152), ‘peroxisome proliferator-activated receptors
(PPARs) signaling pathway’ (hsa03320) and ‘chemical carcinogenesis’
(hsa05204) (Fig. 3B).
Construction of PPI network and
analysis of modules
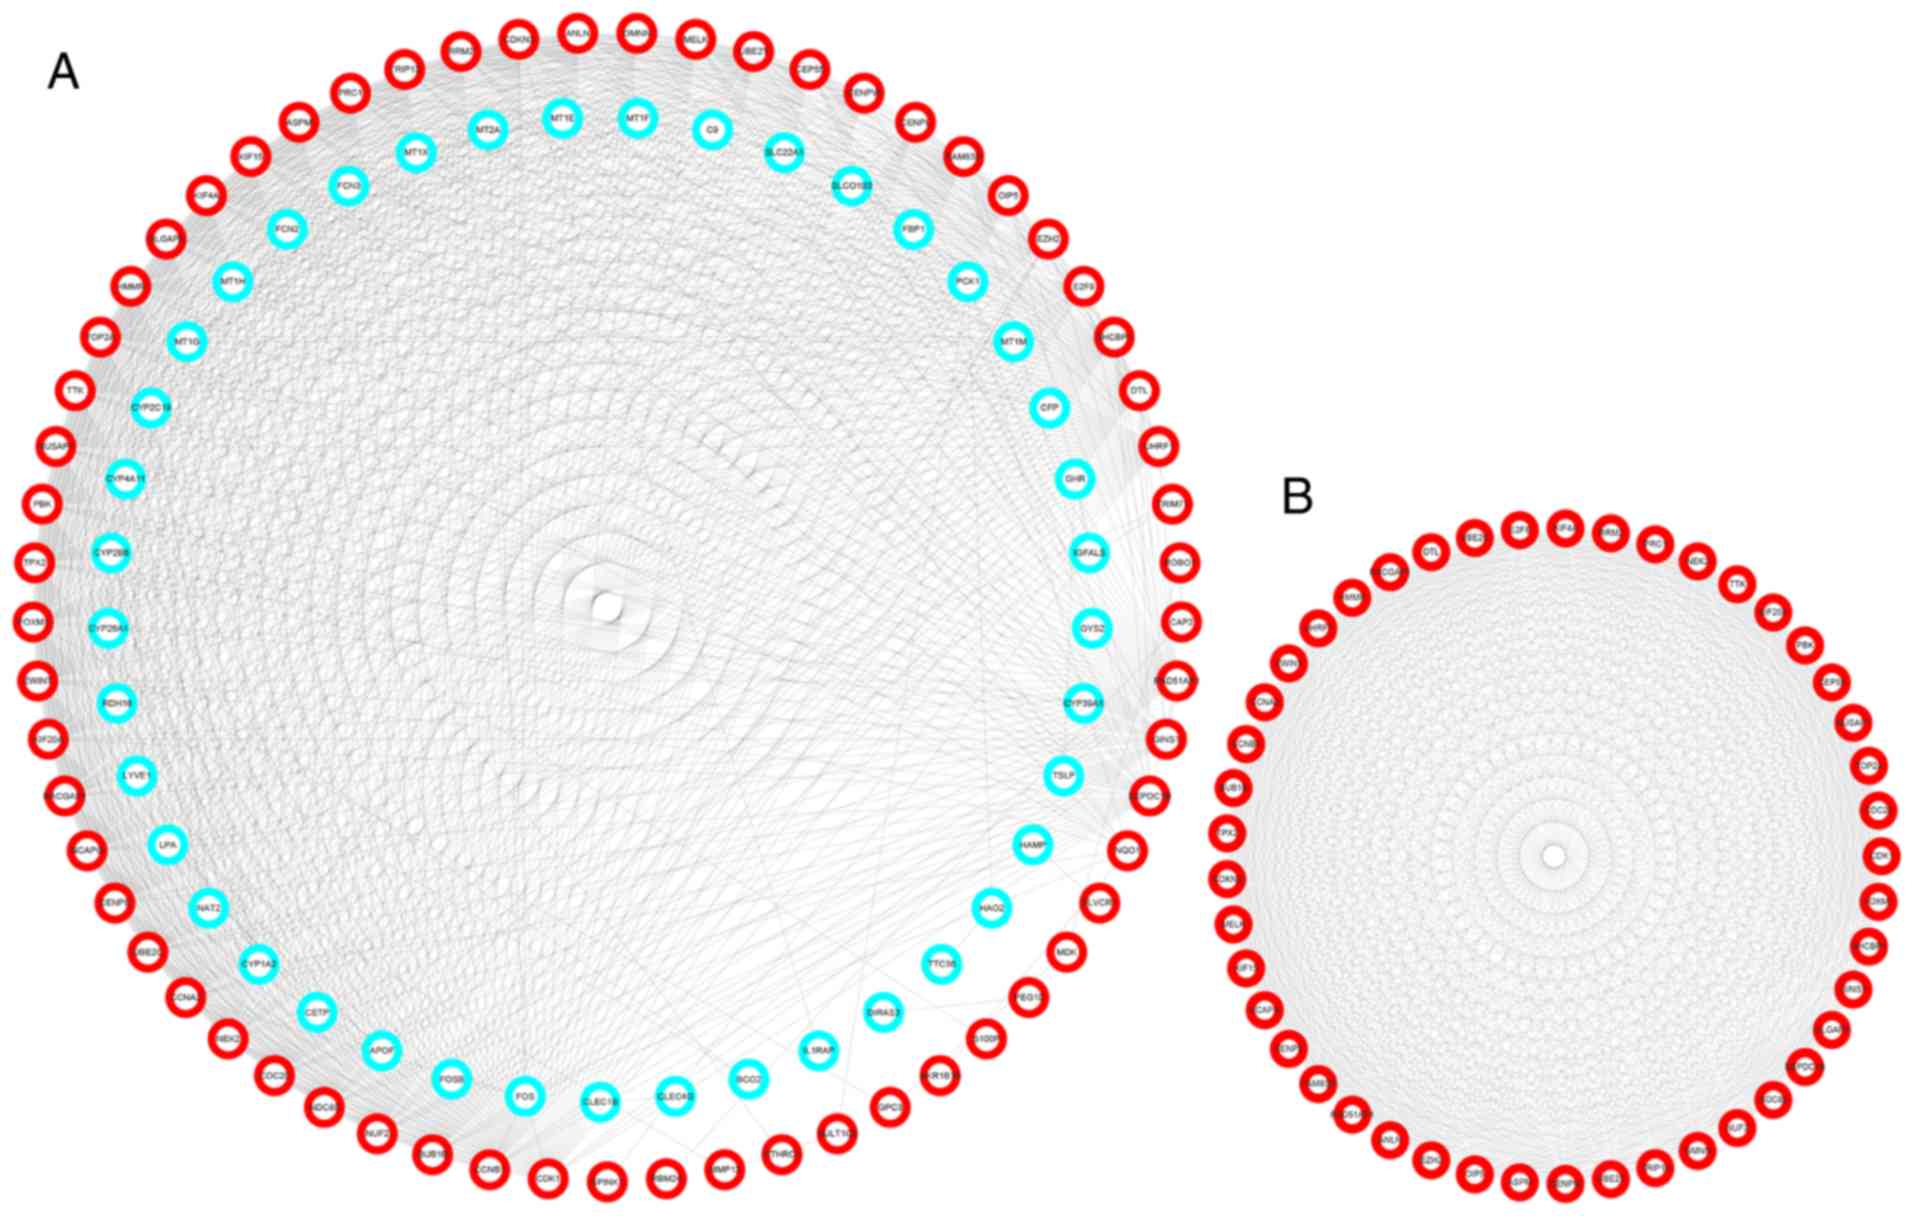
The PPI network of hub genes, which was composed of
102 nodes and 1,023 edges, was constructed using the STRING website
and visualized by Cytoscape (Fig.
4A). The most essential module was obtained using MCODE, a
Cytoscape plugin, and is presented in (Fig. 4B). DAVID was used to identify GO
items of modules that were significant (P<0.05). Moreover, it
was demonstrated that ‘cell division’, ‘cell cycle’, ‘cell
division’, ‘DNA repair’ and ‘regulation of cell cycle’ were the
five most significantly enriched BP of the module (data not
shown).
Selection and analysis of hub
genes
The top eight genes that had >44 nodes in the PPI
network were selected as hub genes. The names, coded proteins and
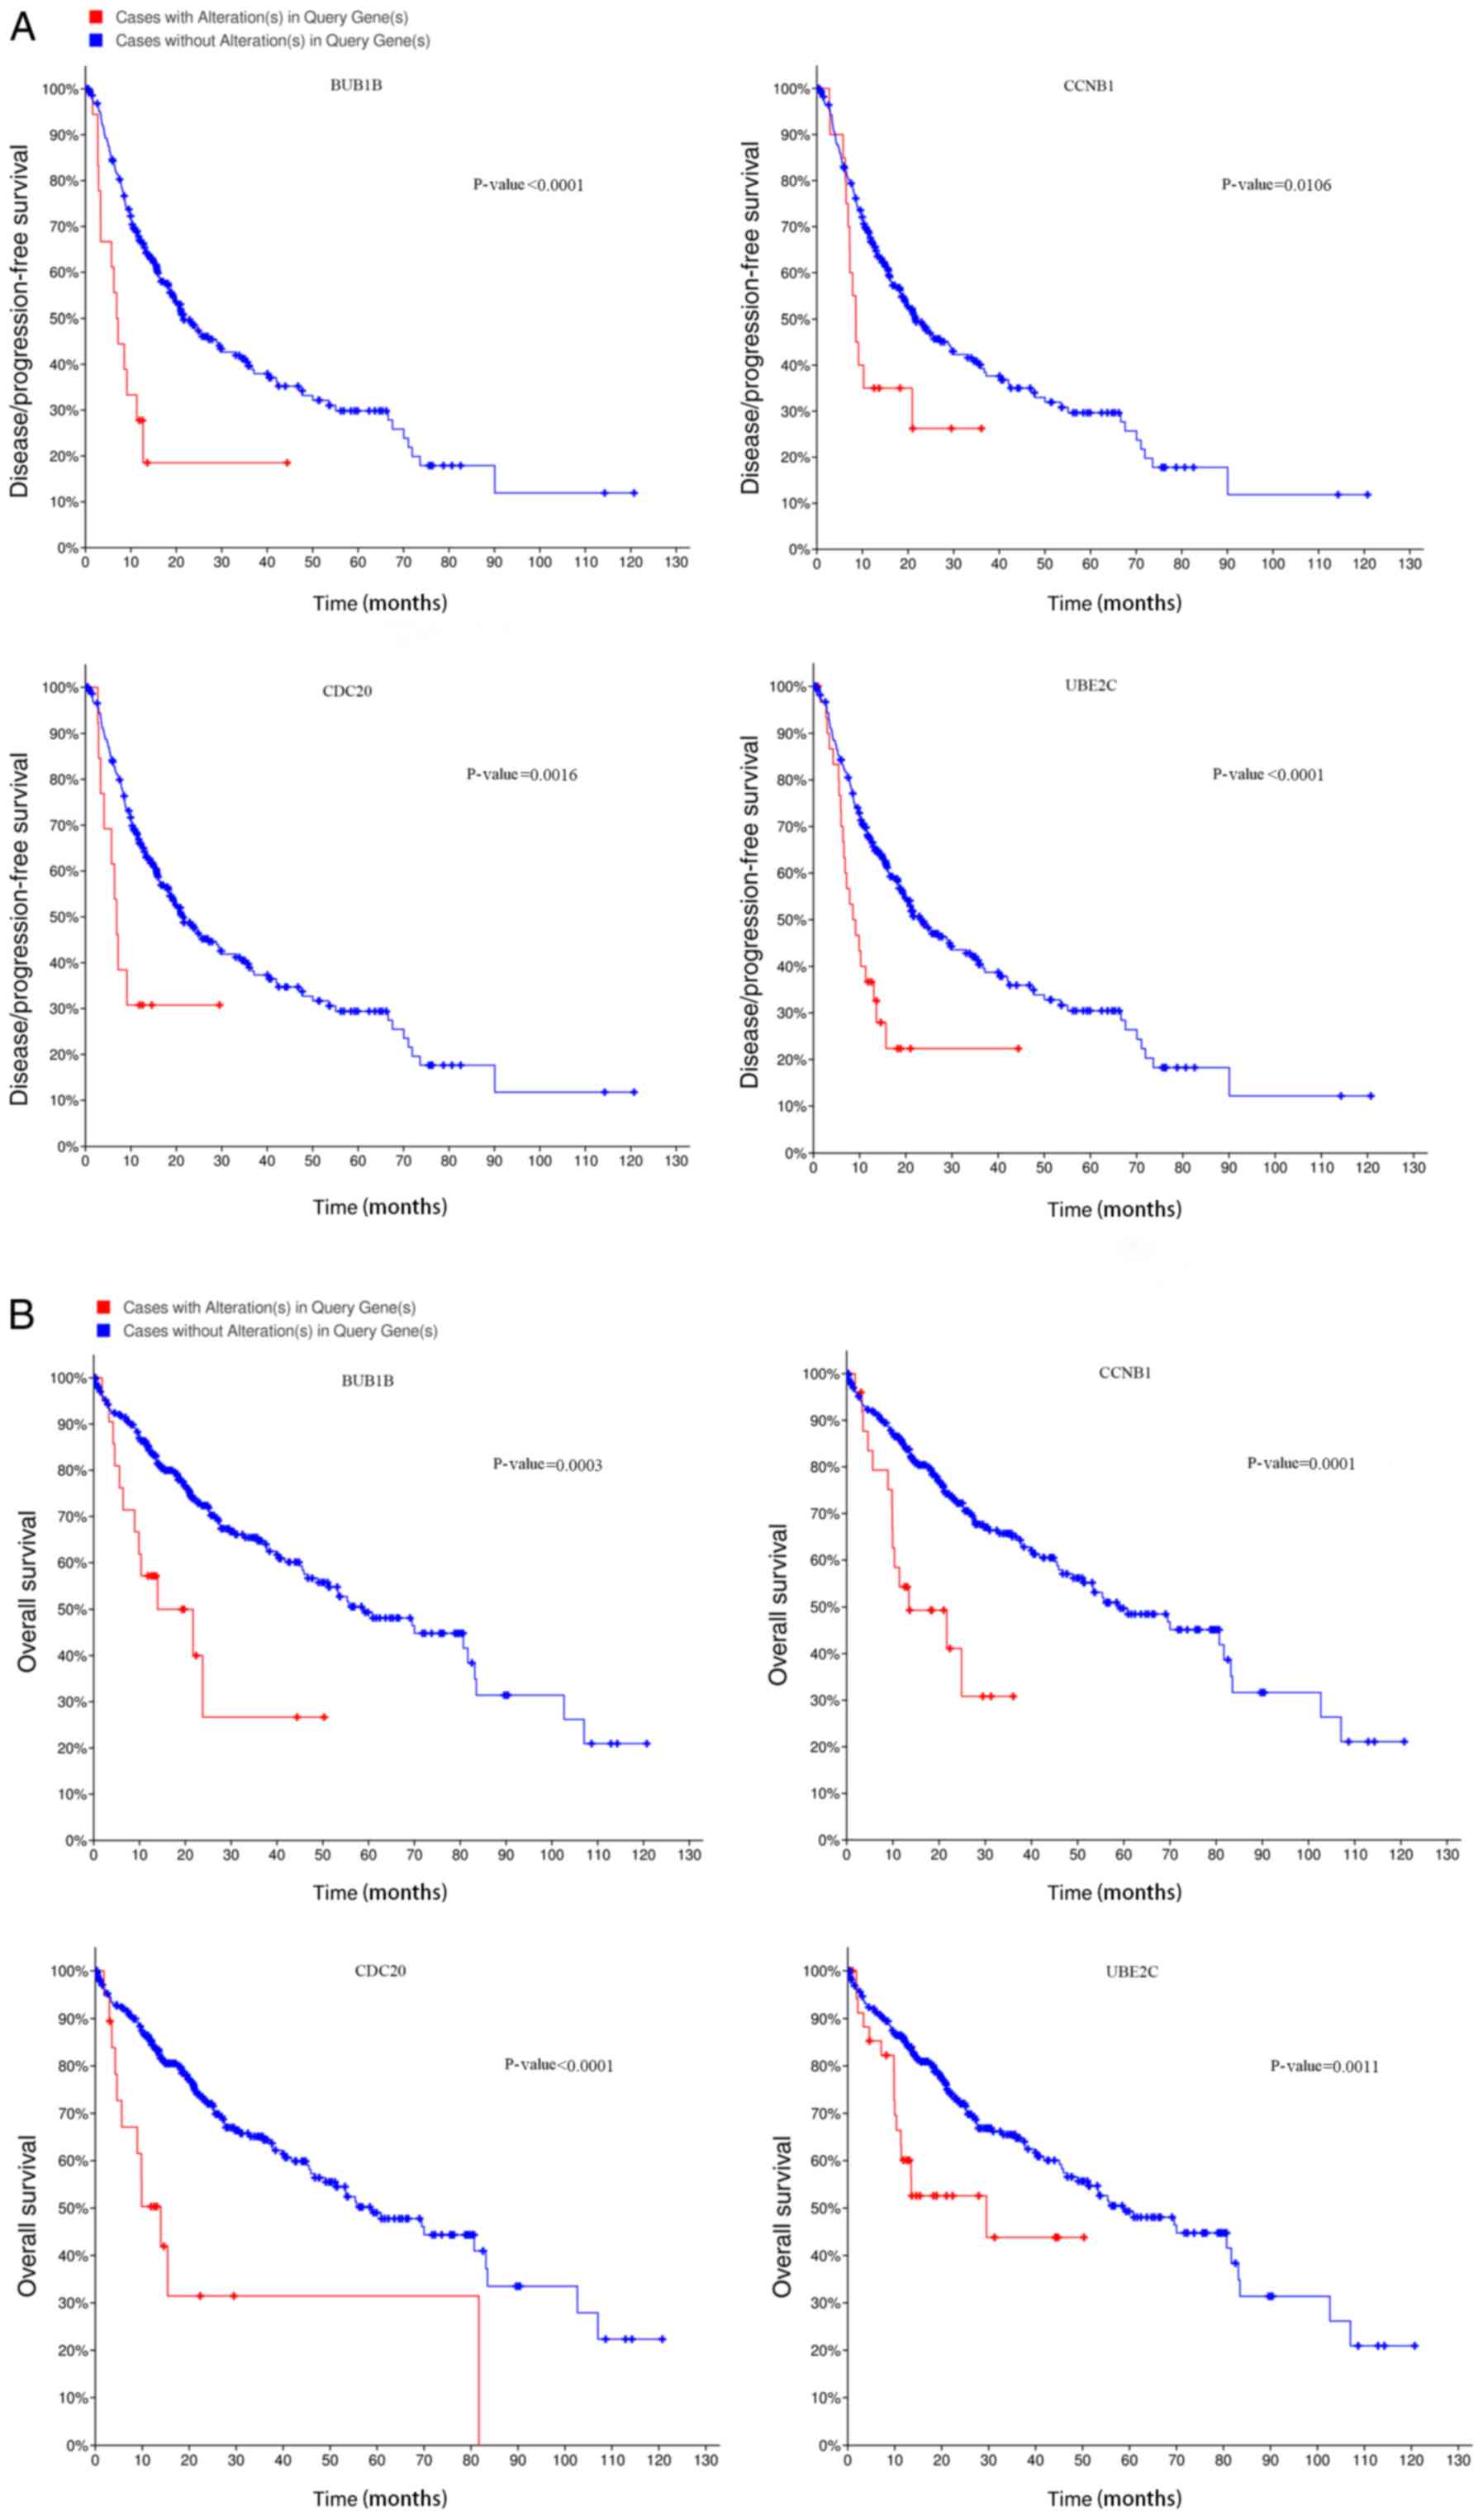
functions of these hub genes are presented in Table II. A Kaplan-Meier curve for these
eight hub genes was constructed in cBioPortal, and it was
demonstrated that patients with alterations in cyclin B1 (CCNB1),
cell-division cycle protein 20 (CDC20), BUB1 mitotic checkpoint
serine/threonine kinase β (BUB1B) and ubiquitin-conjugating enzyme
E2C (UBE2C) exhibited worse disease-free survival (Fig. 5A) and overall survival rate (Fig. 5B). Subsequently, the results of the
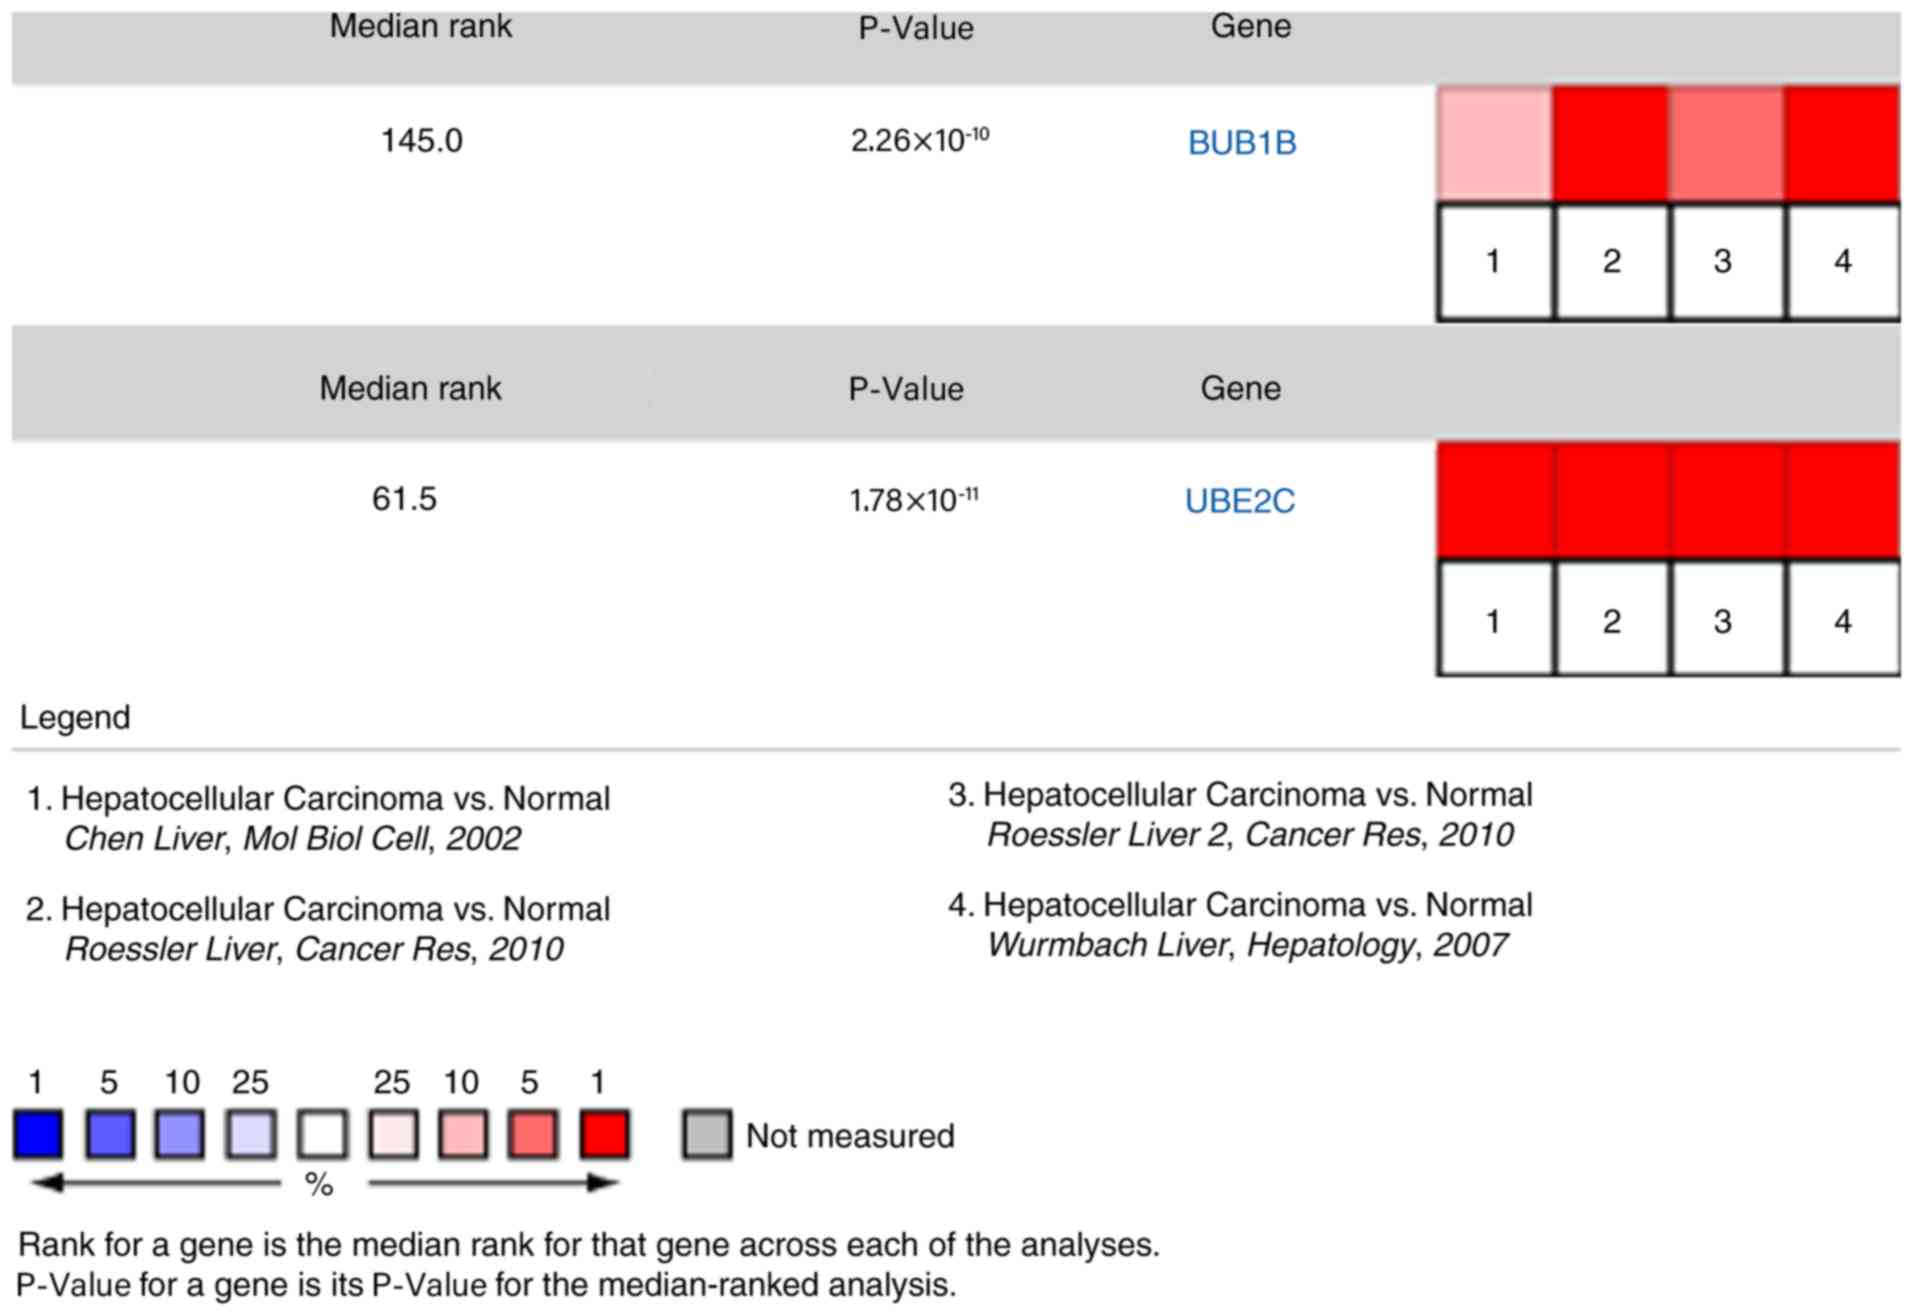
expression of these four genes were validated in the Oncomine
database, and it was indicated that BUB1B and UBE2C were
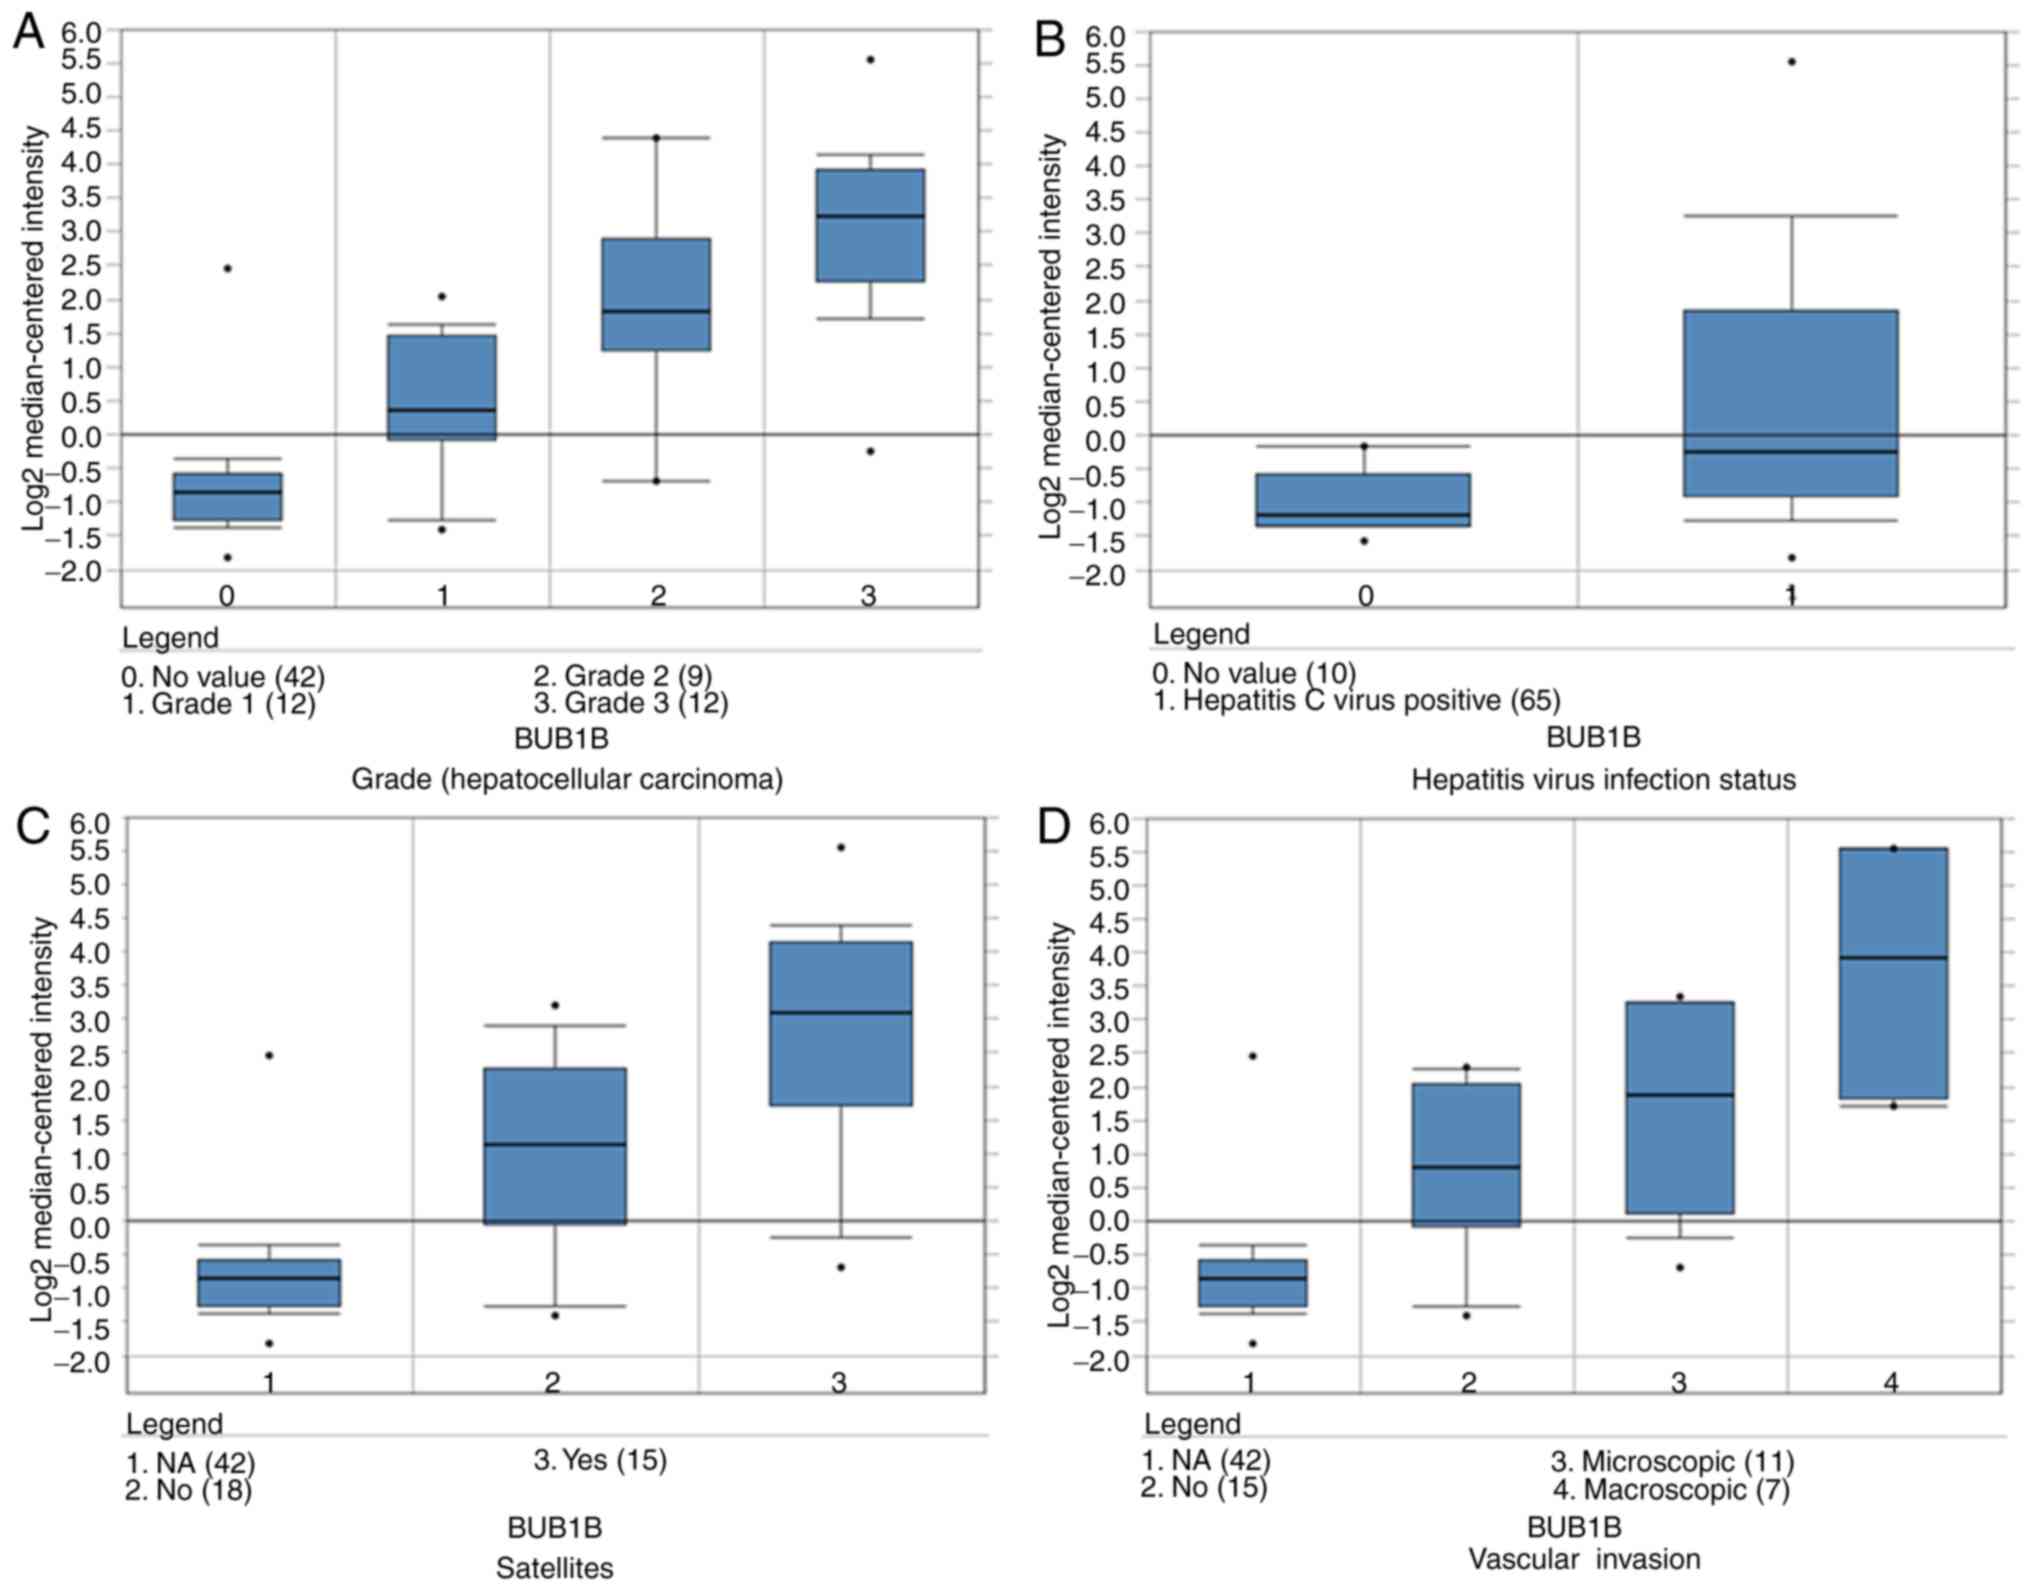
significantly upregulated in HCC in different datasets (Fig. 6). By analyzing the Wurmbach liver
dataset, it was speculated that high expression of these two genes
is associated with tumor grade, hepatitis virus infection status,
satellites and vascular invasion (Fig.
7).
| Table II.Function of eight hub genes. |
Table II.
Function of eight hub genes.
| No. | Gene symbol | Protein | Function | (Refs) |
|---|
| 1 | CCNB1 | G2/mitotic-specific
cyclin-B1 | Control of the cell
cycle at the G2/M (mitosis) transition | Brown et al,
2007 (58); Petri et al, 2007
(56). |
| 2 | CDK1 | Cyclin-dependent
kinase 1 | Regulation of cell
cycle progression, apoptosis and carcinogenesis of tumor cells | Qiao et al,
2006 (59); Wang et al, 2011
(55). |
| 3 | BUB1B | BUB1 mitotic
checkpoint serine/ threonine kinase β | Essential component
of the mitotic checkpoint; mutated in colorectal cancer and other
tumors | Shin et al,
2003 (38); Yamamoto et al,
2007 (40); Liu et al, 2009
(41); Fu et al, 2016
(42). |
| 4 | CDC20 | Cell division cycle
20 | Regulatory protein
that participates in cell cycle processes | Zhang et al,
2019 (36); Cheng et al, 2019
(37). |
| 5 | CCNA2 | Cyclin-A2 | Controls the
G1/S and the G2/M transition phases of the
cell cycle | Pagano et
al, 1992 (60). |
| 6 | UBE2C |
Ubiquitin-conjugating enzyme E2 C | Involved in
ubiquitination during protein modification | Williamson et
al, 2009 (45); David et
al, 2010 (61). |
| 7 | ZWINT | ZW10
interactor | Member of the MIS12
complex; participates in biological processes such as cell cycle
and cell division | Lin et al,
2006 (50). |
| 8 | NUSAP1 | Nucleolar and
spindle- associated protein 1 | High expression may
be associated with prostate, colon and liver cancer | Gordon et
al, 2017 (53); Liu et
al, 2018 (54); Zhou et
al, 2018 (34) |
After deleting the incomplete sample information of
the clinical data, a univariate analysis was performed. The results
suggested that high expression levels of BUB1B and UBE2C, tumor
stage, T classification and metastasis predicted poorer survival,
and multivariate Cox analyses demonstrated that BUB1B and UBE2C
were independent prognostic factors for HCC (Tables III and IV). Collectively, the results suggested
that the alteration of BUB1B and UBE2C may be a potential target
for the diagnosis and treatment of HCC.
| Table III.Univariate and multivariate analyses
of the correlation of BUB1B expression with overall survival. |
Table III.
Univariate and multivariate analyses
of the correlation of BUB1B expression with overall survival.
|
| Univariate
analysis | Multivariate
analysis |
|---|
|
|
|
|
|---|
| Parameter | HR | 95% CI | P-value | HR | 95% CI | P-value |
|---|
| Age | 1.005 | 0.987–1.023 | 0.5912 | 1.013 | 0.993–1.033 | 0.2144 |
| Sex | 0.780 | 0.487–1.249 | 0.3012 | 1.105 | 0.654–1.869 | 0.7088 |
| Histological
grade | 1.017 | 0.746–1.387 | 0.9143 | 1.003 | 0.715–1.406 | 0.9871 |
| TNM stage | 1.865 | 1.456–2.388 | <0.0001 | 0.961 | 0.361–2.556 | 0.9366 |
| T
classification | 1.804 | 1.434–2.270 | <0.0001 | 1.690 | 0.702–4.066 | 0.2414 |
| M
classification | 3.850 | 1.207–12.281 | 0.0228 | 2.313 | 0.580–9.220 | 0.2346 |
| N
classification | 2.022 | 0.494–8.276 | 0.3276 | 1.690 | 0.266–10.728 | 0.5779 |
| BUB1B | 1.329 | 1.157–1.527 | <0.0001 | 1.295 | 1.111–1.508 | <0.0001 |
| Table IV.Univariate and multivariate analyses
of the correlation of UBE2C expression with overall survival. |
Table IV.
Univariate and multivariate analyses
of the correlation of UBE2C expression with overall survival.
|
| Univariate
analysis | Multivariate
analysis |
|---|
|
|
|
|
|---|
| Parameter | HR | 95% CI | P-value | HR | 95% CI | P-value |
|---|
| Age | 1.005 | 0.987–1.023 | 0.5912 | 1.014 | 0.994–1.035 | 0.1755 |
| Sex | 0.780 | 0.487–1.249 | 0.3012 | 1.123 | 0.666–1.894 | 0.6628 |
| Histological
grade | 1.017 | 0.746–1.387 | 0.9143 | 0.983 | 0.703–1.375 | 0.9189 |
| TNM stage | 1.865 | 1.456–2.388 | <0.0001 | 0.941 | 0.360–2.462 | 0.9011 |
| T
classification | 1.804 | 1.434–2.270 | <0.0001 | 1.728 | 0.729–4.093 | 0.2138 |
| M
classification | 3.850 | 1.207–12.281 | 0.0227 | 1.970 | 0.507–7.656 | 0.3277 |
| N
classification | 2.022 | 0.494–8.276 | 0.3275 | 1.904 | 0.314–11.554 | 0.4840 |
| UBE2C | 1.374 | 1.194–1.582 | <0.0001 | 1.332 | 1.145–1.550 | <0.0001 |
GSEA
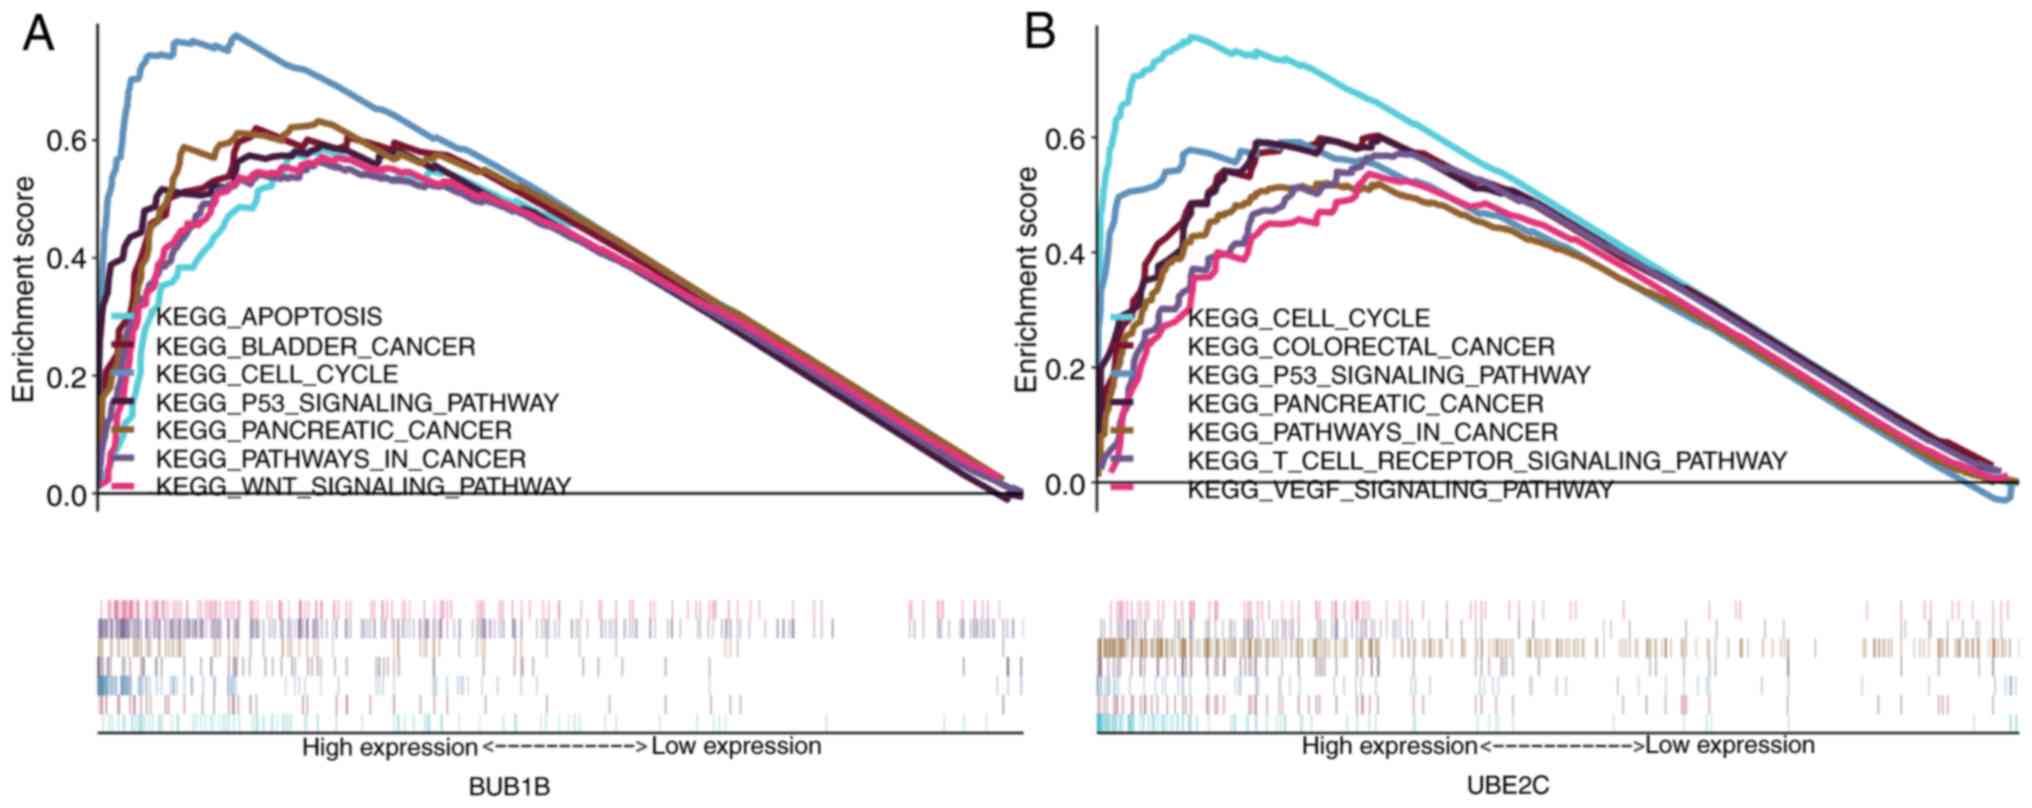
The GSEA results indicated that the high-expression
phenotypes of BUB1B and UBE2C were significantly associated with
tumor-associated pathways (P<0.05; FDR<0.25; Fig. 8), including ‘p53 signaling pathway’,
‘cell cycle’, ‘WNT signaling pathway’, ‘T-cell receptor signaling
pathway’, ‘vascular endothelial growth factor (VEGF) signaling
pathway’ and other pathways associated with malignant tumors.
Discussion
Recently, with the improvement of genome sequencing,
biochips and high-throughput sequencing technology, an increasing
number of studies have used bioinformatics methods for chip
datasets analysis, which provides a novel and effective way to
identify promising markers for HCC diagnosis and treatment
(13–15,34,35). In
contrast to previous studies, in the present study three datasets
(GSE112790, GSE84402 and GSE74656) were downloaded from GEO and
RNA-seq data from TCGA, and were combined to determine the DEGs of
tumor and healthy tissues via comprehensive bioinformatics analysis
methods. A total of 126 hub genes were selected, including 56
downregulated and 70 upregulated genes. Subsequently, the present
study performed GO and KEGG pathway analyses for these DEGs. It was
found that BPs were mainly involved in ‘negative regulation of
growth’, ‘cell division’, ‘cell proliferation’, ‘cell migration’
and ‘cell cycle,’ while CC primarily contained the ‘midbody’,
‘cytosol’ and ‘nucleus’. Moreover, MF of DEGs were primarily
enriched in ‘oxygen binding’, ‘monooxygenase activity’ and ‘protein
binding’. In addition, KEGG were mainly enriched in ‘p53 signaling
pathway’, ‘cell cycle’, ‘cellular senescence’ and ‘AMPK signaling
pathway’.
Among the 126 DEGs that were identified, a total of
eight hub genes were screened, including CCNB1, CDC20,
cyclin-dependent kinase 1 (CDK1), BUB1B, cyclin A2 (CCNA2),
nucleolar and spindle-associated protein 1 (NUSAP1), UBE2C and ZW10
interactor (ZWINT). A survival analysis was performed on these hub
genes, and it was demonstrated that alterations in CCNB1, CDC20,
BUB1B and UBE2C indicated poor outcomes, while alterations in CDK1,
CCNA2, NUSAP1 and ZWINT did not result in meaningful differences
(data not shown). In addition, the present study compared four
different groups of experimental results in Oncomine, and analysis
of tumoral and healthy tissue identified that BUB1B and UBE2C were
significantly upregulated and highly associated with tumor grade,
hepatitis virus infection status, satellites and vascular invasion,
thus suggesting that these selected genes may play a critical role
in the initiation of HCC. Furthermore, univariate and multivariate
Cox analysis results suggested that BUB1B and UBE2C were
independent prognostic factors for HCC. In addition, GSEA analysis
identified the pathways via which these two genes may function,
including t ‘p53 signaling pathway’, ‘cell cycle’, ‘WNT signaling
pathway’, ‘T-cell receptor’, ‘VEGF signaling pathway’ and other
pathways associated with malignant tumors.
In the present study, CDC20 was primarily involved
in ‘mitotic nuclear division’ and ‘cell division’ of BPs and the
‘spindle’ and ‘cytoplasm’ (data not shown) of the cell. Zhang et
al (36), reported that high
expression of CDC20 in prostate cancer often indicates a poor
prognosis. Moreover, a previous study revealed that CDC20 is
associated with tumor metastasis (37); thus, future research should focus on
CDC20 target inhibitors to develop new drugs to inhibit tumor
metastasis.
As a significant checkpoint of cell mitosis, BUB1B
is involved in the normal process of cell mitosis (38), and upregulation of BUB1B is observed
in various human malignancies, which are associated with the
development and progression of the tumor, as well as aggressive
biological features (39–42). However, low expression of BUB1B in
colon adenocarcinoma (43) and lung
tumor (44) causes metastasis and
poorer survival.
UBE2C is a protein in the UBE2 family, which is
involved in ubiquitination during protein modification, and
degrades anaphase promoting complex/cyclosome substrates via
proteasomes and promotes mitotic exit (45). Zhang et al (46), revealed that UBE2C is highly
expressed in gastric cancer, which could lead to the occurrence and
development of malignant tumors, and this upregulation is
significantly associated with lymph node metastasis and tumor
stage. In addition, high expression of UBE2C is also closely
associated with breast cancer, colon cancer and other malignant
tumors (47–49).
ZWINT is a member of the MIS12 kinetochore complex
component, which is necessary for spindle checkpoint activity. It
also participates in biological processes such as cell cycle and
cell division (50), and may be a
promising target for tumor therapy. Previous studies have reported
that CCNA2 expression is elevated in human breast cancer and
pancreatic ductal adenocarcinoma (35,51).
Moreover, NUSAP1 may be involved in the regulation of chromosome
alignment (52), and several studies
have revealed that its expression in high levels is associated with
prostate, colon and liver cancer (34,53,54). In
addition, CDK1 may be an underlying therapeutic target for the
treatment of cancer, as it is a principal regulatory agent for the
cell cycle, and functions by controlling the centrosome cycle and
the initiation of mitosis (55). The
protein CCNB1 plays a pivotal role in tumor aggressiveness by
modulating the cell cycle at the G2/M (mitosis)
transition (56). Zhuang et
al (57) also indicated that
upregulation of CCNB1 may predict poor prognosis in patients with
HCC.
In conclusion, the present study performed
preliminary examinations to identify the mechanism underlying the
initiation of cancer formation, as well as the development and
progression of HCC. Comprehensive bioinformatics analyses were
performed in order to identify 126 DEGs and eight hub genes.
Furthermore, the results demonstrated that BUB1B and UBE2C may be
potential targets for the diagnosis and treatment of HCC. However,
the main limitation of the present study is the lack of
quantitative PCR analysis to verify the expression levels of BUB1B
and UBE2C. Collectively, the present study provides a new direction
for further studies on HCC. The DEGs identified in HCC tissues may
be involved in carcinogenesis and progression. Particularly, BUB1B
and UBE2C, may serve as potential candidate biomarkers and
therapeutic targets for HCC. Future studies should focus on the
verification of the present findings in clinical practice and on
identifying the molecular mechanisms involved in HCC.
Supplementary Material
Supporting Data
Acknowledgements
Not applicable.
Funding
This study was funded by the National Natural
Science Foundation of China (grant no. 81872036) and The First
Hospital of Lanzhou University Fund 2017 (grant no.
ldyyyn2017-04).
Availability of data and materials
The datasets analyzed during the present study are
available in the GEO (https://www.ncbi.nlm.nih.gov/geo/) and TCGA
repositories (https://cancergenome.nih.gov/).
Authors' contributions
NM and JC designed the study and wrote the initial
draft of the manuscript. JZ, WF, CH and LG contributed to the
analysis and interpretation of data. PY and BB helped to design the
study and acquire data, YL, WM and XL participated in interpreting
the results and revised the writing of manuscript. All authors have
reviewed and approved the final manuscript.
Ethics approval and consent to
participate
Not applicable.
Patient consent for publication
Not applicable.
Competing interests
The authors declare that they have no competing
interests.
References
|
1
|
McGlynn KA, Petrick JL and El-Serag HB:
Epidemiology of hepatocellular carcinoma. Hepatology. Apr
22–2020.(Epub ahead of print). View Article : Google Scholar : PubMed/NCBI
|
|
2
|
Bray F, Ferlay J, Soerjomataram I, Siegel
RL, Torre LA and Jemal A: Global cancer statistics 2018: GLOBOCAN
estimates of incidence and mortality worldwide for 36 cancers in
185 countries. CA Cancer J Clin. 68:394–424. 2018. View Article : Google Scholar : PubMed/NCBI
|
|
3
|
Maluccio M and Covey A: Recent progress in
understanding, diagnosing, and treating hepatocellular carcinoma.
CA Cancer J Clin. 62:394–399. 2012. View Article : Google Scholar : PubMed/NCBI
|
|
4
|
Forner A, Reig M and Bruix J:
Hepatocellular carcinoma. Lancet. 391:1301–1314. 2018. View Article : Google Scholar : PubMed/NCBI
|
|
5
|
Parkin DM: The global health burden of
infection-associated cancers in the year 2002. Int J Cancer.
118:3030–3044. 2006. View Article : Google Scholar : PubMed/NCBI
|
|
6
|
Rinella ME: Nonalcoholic fatty liver
disease: A systematic review. JAMA. 313:2263–2273. 2015. View Article : Google Scholar : PubMed/NCBI
|
|
7
|
Mirizzi A, Franco I, Leone CM, Bonfiglio
C, Cozzolongo R, Notarnicola M, Giannuzzi V, Tutino V, De Nunzio V,
Bruno I, et al: Effects of some food components on non-alcoholic
fatty liver disease severity: Results from a cross-sectional study.
Nutrients. 11:27442019. View Article : Google Scholar
|
|
8
|
Dimitroulis D, Damaskos C, Valsami S,
Davakis S, Garmpis N, Spartalis E, Athanasiou A, Moris D,
Sakellariou S, Kykalos S, et al: From diagnosis to treatment of
hepatocellular carcinoma: An epidemic problem for both developed
and developing world. World J Gastroentero. 23:5282–5294. 2017.
View Article : Google Scholar
|
|
9
|
Fuks D, Dokmak S, Paradis V, Diouf M,
Durand F and Belghiti J: Benefit of initial resection of
hepatocellular carcinoma followed by transplantation in case of
recurrence: An intention-to-treat analysis. Hepatology. 55:132–140.
2012. View Article : Google Scholar : PubMed/NCBI
|
|
10
|
Han HS, Shehta A, Ahn S, Yoon YS, Cho JY
and Choi Y: Laparoscopic versus open liver resection for
hepatocellular carcinoma: Case-matched study with propensity score
matching. J Hepatol. 63:643–650. 2015. View Article : Google Scholar : PubMed/NCBI
|
|
11
|
Hartke J, Johnson M and Ghabril M: The
diagnosis and treatment of hepatocellular carcinoma. Semin Diagn
Pathol. 34:153–159. 2017. View Article : Google Scholar : PubMed/NCBI
|
|
12
|
Zhang P, Yang Y, Wen F, He X, Tang R, Du
Z, Zhou J, Zhang J and Li Q: Cost-effectiveness of sorafenib as a
first-line treatment for advanced hepatocellular carcinoma. Eur J
Gastroenterol Hepatol. 27:853–859. 2015. View Article : Google Scholar : PubMed/NCBI
|
|
13
|
Li L, Lei Q, Zhang S, Kong L and Qin B:
Screening and identification of key biomarkers in hepatocellular
carcinoma: Evidence from bioinformatic analysis. Oncol Rep.
38:2607–2618. 2017. View Article : Google Scholar : PubMed/NCBI
|
|
14
|
Zhang R, Ye J, Huang H and Du X: Mining
featured biomarkers associated with vascular invasion in HCC by
bioinformatics analysis with TCGA RNA sequencing data. Biomed
Pharmacother. 118:1092742019. View Article : Google Scholar : PubMed/NCBI
|
|
15
|
Zhang C, Peng L, Zhang Y, Liu Z, Li W,
Chen S and Li G: The identification of key genes and pathways in
hepatocellular carcinoma by bioinformatics analysis of
high-throughput data. Med Oncol. 34:1012017. View Article : Google Scholar : PubMed/NCBI
|
|
16
|
Shimada S, Mogushi K, Akiyama Y, Furuyama
T, Watanabe S, Ogura T, Ogawa K, Ono H, Mitsunori Y, Ban D, et al:
Comprehensive molecular and immunological characterization of
hepatocellular carcinoma. EBioMedicine. 40:457–470. 2019.
View Article : Google Scholar : PubMed/NCBI
|
|
17
|
Wang H, Huo X, Yang XR, He J, Cheng L,
Wang N, Deng X, Jin H, Wang N, Wang C, et al: STAT3-mediated
upregulation of lncRNA HOXD-AS1 as a ceRNA facilitates liver cancer
metastasis by regulating SOX4. Mol Cancer. 16:1362017. View Article : Google Scholar : PubMed/NCBI
|
|
18
|
Ritchie ME, Phipson B, Wu D, Hu Y, Law CW,
Shi W and Smyth GK: Limma powers differential expression analyses
for RNA-sequencing and microarray studies. Nucleic Acids Res.
43:e472015. View Article : Google Scholar : PubMed/NCBI
|
|
19
|
Bolstad BM, Irizarry RA, Astrand M and
Speed TP: A comparison of normalization methods for high density
oligonucleotide array data based on variance and bias.
Bioinformatics. 19:185–193. 2003. View Article : Google Scholar : PubMed/NCBI
|
|
20
|
Leek JT, Johnson WE, Parker HS, Jaffe AE
and Storey JD: The sva package for removing batch effects and other
unwanted variation in high-throughput experiments. Bioinformatics.
28:882–883. 2012. View Article : Google Scholar : PubMed/NCBI
|
|
21
|
Robinson MD, McCarthy DJ and Smyth GK:
EdgeR: A Bioconductor package for differential expression analysis
of digital gene expression data. Bioinformatics. 26:139–140. 2010.
View Article : Google Scholar : PubMed/NCBI
|
|
22
|
Huang da W, Sherman BT and Lempicki RA:
Systematic and integrative analysis of large gene lists using DAVID
bioinformatics resources. Nat Protoc. 4:44–57. 2009. View Article : Google Scholar : PubMed/NCBI
|
|
23
|
Walter W, Sánchez-Cabo F and Ricote M:
GOplot: An R package for visually combining expression data with
functional analysis. Bioinformatics. 31:2912–2914. 2015. View Article : Google Scholar : PubMed/NCBI
|
|
24
|
Szklarczyk D, Gable AL, Lyon D, Junge A,
Wyder S, Huerta-Cepas J, Simonovic M, Doncheva NT, Morris JH, Bork
P, et al: STRING v11: Protein-protein association networks with
increased coverage, supporting functional discovery in genome-wide
experimental datasets. Nucleic Acids Res. 47:D607–D613. 2019.
View Article : Google Scholar : PubMed/NCBI
|
|
25
|
Demchak B, Hull T, Reich M, Liefeld T,
Smoot M, Ideker T and Mesirov JP: Cytoscape: The network
visualization tool for GenomeSpace workflows. F1000Res. 3:1512014.
View Article : Google Scholar : PubMed/NCBI
|
|
26
|
Bader GD and Hogue CW: An automated method
for finding molecular complexes in large protein interaction
networks. BMC Bioinformatics. 4:22003. View Article : Google Scholar : PubMed/NCBI
|
|
27
|
Gao J, Aksoy BA, Dogrusoz U, Dresdner G,
Gross B, Sumer SO, Sun Y, Jacobsen A, Sinha R, Larsson E, et al:
Integrative analysis of complex cancer genomics and clinical
profiles using the cBioPortal. Sci Signal. 6:pl12013. View Article : Google Scholar : PubMed/NCBI
|
|
28
|
Cerami E, Gao J, Dogrusoz U, Gross BE,
Sumer SO, Aksoy BA, Jacobsen A, Byrne CJ, Heuer ML, Larsson E, et
al: The cBio cancer genomics portal: An open platform for exploring
multidimensional cancer genomics data. Cancer Discov. 2:401–404.
2012. View Article : Google Scholar : PubMed/NCBI
|
|
29
|
Li H, Han D, Hou Y, Chen H and Chen Z:
Statistical inference methods for two crossing survival curves: A
comparison of methods. PLoS One. 10:e01167742015. View Article : Google Scholar : PubMed/NCBI
|
|
30
|
Rhodes DR, Kalyana-Sundaram S, Mahavisno
V, Varambally R, Yu J, Briggs BB, Barrette TR, Anstet MJ,
Kincead-Beal C, Kulkarni P, et al: Oncomine 3.0: Genes, pathways,
and networks in a collection of 18,000 cancer gene expression
profiles. Neoplasia. 9:166–180. 2007. View Article : Google Scholar : PubMed/NCBI
|
|
31
|
Wurmbach E, Chen YB, Khitrov G, Zhang W,
Roayaie S, Schwartz M, Fiel I, Thung S, Mazzaferro V, Bruix J, et
al: Genome-wide molecular profiles of HCV-induced dysplasia and
hepatocellular carcinoma. Hepatology. 45:938–947. 2007. View Article : Google Scholar : PubMed/NCBI
|
|
32
|
Subramanian A, Tamayo P, Mootha VK,
Mukherjee S, Ebert BL, Gillette MA, Paulovich A, Pomeroy SL, Golub
TR, Lander ES and Mesirov JP: Gene set enrichment analysis: A
knowledge-based approach for interpreting genome-wide expression
profiles. Proc Natl Acad Sci USA. 102:15545–15550. 2005. View Article : Google Scholar : PubMed/NCBI
|
|
33
|
Liberzon A, Birger C, Thorvaldsdóttir H,
Ghandi M, Mesirov JP and Tamayo P: The Molecular Signatures
Database (MSigDB) hallmark gene set collection. Cell Syst.
1:417–425. 2015. View Article : Google Scholar : PubMed/NCBI
|
|
34
|
Zhou L, Du Y, Kong L, Zhang X and Chen Q:
Identification of molecular target genes and key pathways in
hepatocellular carcinoma by bioinformatics analysis. Onco Targets
Ther. 11:1861–1869. 2018. View Article : Google Scholar : PubMed/NCBI
|
|
35
|
Dong S, Huang F, Zhang H and Chen Q:
Overexpression of BUB1B, CCNA2, CDC20 and CDK1 in tumor tissues
predicts poor survival in pancreatic ductal adenocarcinoma. Biosci
Rep. 39:BSR201823062019. View Article : Google Scholar : PubMed/NCBI
|
|
36
|
Zhang Q, Huang H, Liu A, Li J, Liu C, Sun
B, Chen L, Gao Y, Xu D and Su C: Cell division Cycle 20 (CDC20)
drives prostate cancer progression via stabilization of β-catenin
in cancer stem-like cells. EBioMedicine. 42:397–407. 2019.
View Article : Google Scholar : PubMed/NCBI
|
|
37
|
Cheng S, Castillo V and Sliva D: CDC20
associated with cancer metastasis and novel mushroom-derived CDC20
inhibitors with antimetastatic activity. Int J Oncol. 54:2250–2256.
2019.PubMed/NCBI
|
|
38
|
Shin HJ, Baek KH, Jeon AH, Park MT, Lee
SJ, Kang CM, Lee HS, Yoo SH, Chung DH, Sung YC, et al: Dual roles
of human BubR1, a mitotic checkpoint kinase, in the monitoring of
chromosomal instability. Cancer Cell. 4:483–497. 2003. View Article : Google Scholar : PubMed/NCBI
|
|
39
|
Ando K, Kakeji Y, Kitao H, Iimori M, Zhao
Y, Yoshida R, Oki E, Yoshinaga K, Matumoto T, Morita M, et al: High
expression of BUBR1 is one of the factors for inducing DNA
aneuploidy and progression in gastric cancer. Cancer Sci.
101:639–645. 2010. View Article : Google Scholar : PubMed/NCBI
|
|
40
|
Yamamoto Y, Matsuyama H, Chochi Y, Okuda
M, Kawauchi S, Inoue R, Furuya T, Oga A, Naito K and Sasaki K:
Overexpression of BUBR1 is associated with chromosomal instability
in bladder cancer. Cancer Genet Cytogen. 174:42–47. 2007.
View Article : Google Scholar
|
|
41
|
Liu AW, Cai J, Zhao XL, Xu AM, Fu HQ, Nian
H and Zhang SH: The clinicopathological significance of BUBR1
overexpression in hepatocellular carcinoma. J Clin Pathol.
62:1003–1008. 2009. View Article : Google Scholar : PubMed/NCBI
|
|
42
|
Fu X, Chen G, Cai ZD, Wang C, Liu ZZ, Lin
ZY, Wu YD, Liang YX, Han ZD, Liu JC and Zhong WD: Overexpression of
BUB1B contributes to progression of prostate cancer and predicts
poor outcome in patients with prostate cancer. Onco Targets Ther.
9:2211–2220. 2016.PubMed/NCBI
|
|
43
|
Shichiri M, Yoshinaga K, Hisatomi H,
Sugihara K and Hirata Y: Genetic and epigenetic inactivation of
mitotic checkpoint genes hBUB1 and hBUBR1 and their relationship to
survival. Cancer Res. 62:13–17. 2002.PubMed/NCBI
|
|
44
|
Park HY, Jeon YK, Shin HJ, Kim IJ, Kang
HC, Jeong SJ, Chung DH and Lee CW: Differential promoter
methylation may be a key molecular mechanism in regulating BubR1
expression in cancer cells. Exp Mol Med. 39:195–204. 2007.
View Article : Google Scholar : PubMed/NCBI
|
|
45
|
Williamson A, Wickliffe KE, Mellone BG,
Song L, Karpen GH and Rape M: Identification of a physiological E2
module for the human anaphase-promoting complex. Proc Natl Acad Sci
USA. 106:18213–18218. 2009. View Article : Google Scholar : PubMed/NCBI
|
|
46
|
Zhang HQ, Zhao G, Ke B, Ma G, Liu GL,
Liang H, Liu LR and Hao XS: Overexpression of UBE2C correlates with
poor prognosis in gastric cancer patients. Eur Rev Med Pharmacol
Sci. 22:1665–1671. 2018.PubMed/NCBI
|
|
47
|
Mo CH, Gao L, Zhu XF, Wei KL, Zeng JJ,
Chen G and Feng ZB: The clinicopathological significance of UBE2C
in breast cancer: A study based on immunohistochemistry, microarray
and RNA-sequencing data. Cancer Cell Int. 17:832017. View Article : Google Scholar : PubMed/NCBI
|
|
48
|
Bavi P, Uddin S, Ahmed M, Jehan Z, Bu R,
Abubaker J, Sultana M, Al-Sanea N, Abduljabbar A, Ashari LH, et al:
Bortezomib stabilizes mitotic cyclins and prevents cell cycle
progression via inhibition of UBE2C in colorectal carcinoma. Am J
Pathol. 178:2109–2120. 2011. View Article : Google Scholar : PubMed/NCBI
|
|
49
|
Dastsooz H, Cereda M, Donna D and Oliviero
S: A comprehensive bioinformatics analysis of UBE2C in cancers. Int
J Mol Sci. 20:22282019. View Article : Google Scholar
|
|
50
|
Lin YT, Chen Y, Wu G and Lee WH: Hec1
sequentially recruits Zwint-1 and ZW10 to kinetochores for faithful
chromosome segregation and spindle checkpoint control. Oncogene.
25:6901–6914. 2006. View Article : Google Scholar : PubMed/NCBI
|
|
51
|
Gao T, Han Y, Yu L, Ao S, Li Z and Ji J:
CCNA2 is a prognostic biomarker for ER+ breast cancer and tamoxifen
resistance. PLoS One. 9:e917712014. View Article : Google Scholar : PubMed/NCBI
|
|
52
|
Li CY, Xue C, Yang Q, Low BC and Liou YC:
NuSAP governs chromosome oscillation by facilitating the
Kid-generated polar ejection force. Nat Commun. 7:105972016.
View Article : Google Scholar : PubMed/NCBI
|
|
53
|
Gordon CA, Gong X, Ganesh D and Brooks JD:
NUSAP1 promotes invasion and metastasis of prostate cancer.
Oncotarget. 8:29935–29950. 2017. View Article : Google Scholar : PubMed/NCBI
|
|
54
|
Liu Z, Guan C, Lu C, Liu Y, Ni R, Xiao M
and Bian Z: High NUSAP1 expression predicts poor prognosis in colon
cancer. Pathol Res Pract. 214:968–973. 2018. View Article : Google Scholar : PubMed/NCBI
|
|
55
|
Wang Q, Su L, Liu N, Zhang L, Xu W and
Fang H: Cyclin Dependent Kinase 1 Inhibitors: A review of recent
progress. Curr Med Chem. 18:2025–2043. 2011. View Article : Google Scholar : PubMed/NCBI
|
|
56
|
Petri ET, Errico A, Escobedo L, Hunt T and
Basavappa R: The crystal structure of human cyclin B. Cell Cycle.
6:1342–1349. 2007. View Article : Google Scholar : PubMed/NCBI
|
|
57
|
Zhuang L, Yang Z and Meng Z: Upregulation
of BUB1B, CCNB1, CDC7, CDC20, and MCM3 in tumor tissues predicted
worse overall survival and disease-free survival in hepatocellular
carcinoma patients. Biomed Res Int. 2018:78973462018. View Article : Google Scholar : PubMed/NCBI
|
|
58
|
Brown NR, Lowe ED, Petri E, Skamnaki V,
Antrobus R and Johnson LN: Cyclin B and Cyclin A confer different
substrate recognition properties on CDK2. Cell Cycle. 6:1350–1359.
2007. View Article : Google Scholar : PubMed/NCBI
|
|
59
|
Qiao M, Shapiro P, Fosbrink M, Rus H,
Kumar R and Passaniti A: Cell cycle-dependent phosphorylation of
the RUNX2 transcription factor by cdc2 regulates endothelial cell
proliferation. J Biol Chem. 281:7118–7128. 2006. View Article : Google Scholar : PubMed/NCBI
|
|
60
|
Pagano M, Pepperkok R, Verde F, Ansorge W
and Draetta G: Cyclin A is required at two points in the human cell
cycle. EMBO J. 11:961–971. 1992. View Article : Google Scholar : PubMed/NCBI
|
|
61
|
David Y, Ziv T, Admon A and Navon A: The
E2 ubiquitin-conjugating enzymes direct polyubiquitination to
preferred lysines. J Biol Chem. 285:8595–8604. 2010. View Article : Google Scholar : PubMed/NCBI
|