Introduction
Clear cell renal cell carcinoma (ccRCC) accounts for
70–80% of all RCC and it is closely associated with von
Hippel-Lindau tumor suppressor gene mutations (1,2). RCC
comprises of a wide group of chemotherapy-resistant diseases that
can be distinguished by histopathological features and underlying
gene mutations (2); however, the
variable biological behavior of early ccRCC usually leads to a
failed diagnosis (3). The molecular
pathogenesis of ccRCC also remains unclear. It is of great clinical
importance to fully understand the pathogenesis of ccRCC, at this
would lead to the identification of reliable prognostic biomarkers
and appropriate treatment selection.
The aberrant expression of coding genes and long
non-coding RNAs (lncRNA) is usually associated with the emergence
and development of various types of cancers, such as lung
adenocarcinoma, ovarian cancer and ccRCC, and lncRNAs could serve
as potential diagnostic markers (4–8). It is
well known that ccRCC is associated with the following:
Dysregulated oxidative phosphorylation, amino acid metabolism and
oncogenic metabolism, such as the downregulation of genes involved
in the tricarboxylic acid cycle, decreased AMP-activated kinase and
levels of PTEN protein, upregulation of the pentose phosphate
pathway and glutamine transporter genes and increased
acetyl-Coenzyme A carboxylase protein levels (2,9,10). lncRNAs are non-coding RNAs of >200
nucleotides in length, and numerous ccRCC-associated lncRNAs have
been identified and applied as potential prognostic and diagnostic
biomarkers, such as metastasis-associated lung adenocarcinoma
transcript 1 and nuclear paraspeckle assembly transcript 1
(11–13). Despite considerable progress, the
prognostic roles of coding genes and lncRNAs in ccRCC, and the
underlying mechanisms remain poorly understood. Further functional
investigation is required to explore more ccRCC-associated coding
genes and lncRNAs, and to verify their functional mechanisms with
respect to the prognosis in patients with ccRCC.
Disease progression is usually mediated by multiple
relevant genes rather than by a single gene (14). It would be useful for both healthcare
providers and patients to develop risk assessment tools that could
detect populations at high risk of a disease and inform clinical
decisions regarding treatment (15).
Compared with the extensive application of risk assessment tools
for various types of cancer, such as gastric cancer, hepatocellular
carcinoma and prostate cancer (15–17),
risk assessment tools for ccRCC remain scant. The disease-free
survival of patients with localized ccRCC has mostly been predicted
using an immunohistochemistry-based molecular signature of five
markers, including Ki-67, p53, endothelial vascular endothelial
growth factor receptor (VEGFR)-1, epithelial VEGFR-1, and
epithelial vascular endothelial growth factor (VEGF)-D (18), and prognosis in patients with ccRCC
has been assessed using expression-based mRNA and non-coding RNA
signatures (11,19–21).
Therefore, further risk assessment tools for ccRCC are
required.
The present study analyzed large quantities of gene
expression and corresponding clinical data of patients with ccRCC
downloaded from The Cancer Genome Atlas (TCGA) and European
Bioinformatics Institute (EBI) Array databases in the public
domain. Differentially expressed RNAs (DERs) were identified and an
optimal prognosis prediction model was constructed after comparing
models based on the expression levels or status of prognostic DERs.
The reliability of the prognostic prediction model was validated in
two independent datasets. Furthermore, possible biological
functions of the prognostic DERs in the pathogenesis of ccRCC were
analyzed using Kyoto Encyclopedia of Genes and Genomes (KEGG)
pathway enrichment analysis. The present study aimed to identify
potential clinical diagnostic markers for ccRCC and to determine
the possible pathogenesis of ccRCC.
Materials and methods
Data sources and preprocessing
The RNA expression profiles of ccRCC samples
downloaded on April 5, 2019, from TCGA database (https://gdc-portal.nci.nih.gov/) were generated
on an Illumina HiSeq 2000 RNA Sequencing platform. A total of 526
ccRCC tumor samples accompanied by relevant information about
clinical survival were randomly assigned to either a training or
validation set (n=263 in each). Table
I shows the clinicopathological characteristics and prognostic
information about the samples in the training, validation and
training + validation (entire) sets. A gene expression dataset of
patients with ccRCC (E-TABM-3267) (22), assessed on 22 January 2015 and last
updated on 27 September 2018, was downloaded from the EBI Array
database (https://www.ebi.ac.uk/arrayexpress/) (23) based on an Affymetrix GeneChip Human
Gene 1.0 ST Array platform. The E-TABM-3267 dataset included 53
ccRCC tumor tissue samples with accompanying survival information,
and served as an independent validation dataset.
 | Table I.Clinical information of the samples
in the training (n=263), validation (n=263) and entire sets
(n=526). |
Table I.
Clinical information of the samples
in the training (n=263), validation (n=263) and entire sets
(n=526).
| Clinical
characteristics | Training set | Testing set | Entire set |
|---|
| Age, mean ± SD | 60.84±11.73 | 60.24±12.52 | 60.54±12.12 |
| Sex,
male/female | 171/92 | 171/92 | 342/184 |
| Pathological M,
M0/M1/– | 213/35/15 | 207/42/14 | 420/77/29 |
| Pathological N,
N0/N1/– | 118/8/137 | 120/8/135 | 238/16/272 |
| Pathological T,
T1/T2/T3/T4 | 141/31/87/4 | 128/38/90/7 | 269/69/177/11 |
| Pathological stage,
I/II/III/IV | 137/26/61/39 | 126/31/62/44 | 263/57/123/83 |
| Pathological grade,
G1/G2/G3/G4/– | 8/110/104/37/4 | 5/116/101/37/4 |
13/226/205/74/8 |
| Platelet count
elevated/low/normal/– | 17/25/169/52 | 19/20/186/38 | 36/45/355/90 |
| Serum calcium,
elevated/low/normal/– | 4/96/75/88 | 6/107/72/78 | 10/203/147/166 |
| White cell count,
elevated/low/normal/– | 79/5/124/55 | 83/3/139/38 | 162/8/263/93 |
| Death,
dead/alive | 86/177 | 86/177 | 172/354 |
| Overall survival
time, months ± SD | 44.88±32.63 | 45.41±33.05 | 45.15±32.81 |
Screening DERs in ccRCC samples
Annotation and identification of lncRNAs and
mRNAs
According to probe location and ID provided in the
downloaded annotation platform, lncRNAs and mRNAs in TCGA and EBI
sets were annotated and identified from the Human Genome
Organization Gene Nomenclature Committee (HGNC) database
(http://www.genenames.org/), which
comprises of 4,112 lncRNAs and 19,201 protein-encoding genes
(24).
Screening of significant DERs
The 263 patients in the training set were classified
as having a less favorable (overall survival time, <36 months)
or a favorable (overall survival time, >60 months) prognosis.
Significant DERs between the two prognostic groups in the training
set were screened using the limma package (v3.34.7; http://bioconductor.org/packages/release/bioc/html/limma.html)
(25) in R language (26) (v3.4.1). A false discovery rate (FDR)
<0.05 and log 2-fold change (log2FC) >0.5 were set
as thresholds for determining significant DERs. Volcano plots of
the DERs were created using the ggplot2 (27) package (v2.2.1) in R 3.4.1.
Subsequently, pheatmap (v1.0.8; https://cran.r-project.org/web/packages/pheatmap/index.html)
(28) in R 3.4.1 was used to analyze
two-way hierarchical clustering of samples with a centered Pearson
correlation algorithm based on DER expression.
Construction of prognostic model
Screening prognostic DERs
Based on the DERs screened in the aforementioned
step, overall survival time in the training set was assessed via
univariate and multivariate Cox regression analyses using a
survival package (v2.41-1; http://bioconductor.org/packages/survivalr/) (29) in R 3.4.1 to identify DEmRNAs and
DElncRNAs with independent prognostic values, with log-rank
P<0.05 as the cutoff of significance.
Screening optimal DER combinations
The Least Absolute Shrinkage And Selection Operator
(LASSO) Cox regression model (30)
of penalized package v0.9.50 (31)
(https://cran.r-project.org/web/packages/penalized/index.html)
in R 3.4.1 was used to uncover the optimal combinations of the
aforementioned prognostic DEmRNAs and DElncRNAs. The optimized
parameter ‘lambda’ was generated via the cross-validation
likelihood (cvl) of 1,000 measurements.
Diverse risk assessment models constructed based
on optimal mRNAs or lncRNAs
Two categories of risk assessment models were
constructed using multivariate Cox regression coefficients of the
optimal combinations of DEmRNAs or DElncRNAs.
Risk prediction models based on mRNA or lncRNA
status
The cut-off values for amounts of optimal DEmRNA and
DElncRNA expression were calculated using the X-Tile
Bio-Information Tool (32)
(https://medicine.yale.edu/lab/rimm/research/software.aspx).
The Monte-Carlo value P<0.05 was set as the criterion to
determine the optimal cut-off for RNA expression. The status of RNA
expression in the samples was defined according to the cut-off for
each RNA; RNA expression > cut-off or < cut-off was defined
as status 1 or 0, respectively. Two risk assessment models of
status risk score were established using a linear combination of
expression status of the optimal mRNAs or lncRNAs, weighted by
regression coefficients to calculate status risk scores for each
sample according to the following formula: βRNAn ×
StatusRNAn, where βRNAn and
StatusRNAn represent the regression coefficient and
status variable of RNAn, respectively.
Risk prediction models based on expression levels
of mRNAs or lncRNAs
Two risk prediction models of expression risk score
were constructed based on the expression levels of optimal mRNA or
lncRNA, and expression risk scores for all samples were calculated
as follows: ∑βRNAn × ExpressionRNAn, where
βRNAn and ExpressionRNAn represent the
regression coefficient and the amount of RNAn expression,
respectively.
Evaluation and comparison of diverse risk
prediction models
Samples in the training set were divided into high-
and low-risk groups for each of the four prognosis prediction
models, with the median risk score as the demarcation point.
Associations between risk models and overall survival time were
evaluated using Kaplan-Meier curves in the survival package
(v2.41–1) in R 3.4.1. The sensitivity and specificity of risk
scores to predict the overall survival time of patients were
evaluated using receiver operating characteristic (ROC) curves. The
predictive capability of these models was authenticated using the
validation, entire and independent validation (E-TABM-3267)
datasets. The optimal model was that with the greatest power to
predict the prognosis in patients with ccRCC.
Establishment of a survival nomogram
based on independent prognostic factors and the fittest risk score
model
Screening independent prognostic clinical
factors
Independent prognostic clinical factors were
screened in samples in the training, validation and entire sets via
univariate and multivariate Cox regression analysis using the
survival package (v2.41–1) in R3.4.1. Log-rank values with
P<0.05 were chosen as thresholds for identifying significant
prognostic clinical factors. Pathological stage of ccRCC was
defined according to the 1997 TNM staging system (33). The tumors were graded following the
Fuhrman nuclear grading system (34). Normal platelet count was defined as
100–300×109/l; elevated platelet count,
>300×109/l; low platelet count,
<300×109/l. Normal serum calcium levels are 2.25–2.75
mmol/l, elevated levels, >2.75 mmol/l and low levels <2.25
mmol/l. Normal white cell count was defined as
4.0–10.0×10⁹/l, elevated count was
>10.0×10⁹/l and low count was
<4.0×10⁹/l.
Construction of nomograms for 3- and 5-year
survival probability
Associations between independent prognostic factors
and prognosis were further analyzed as follows. Risk scores from
the optimal prognostic prediction model were combined with the
identified independent prognostic factors, and nomograms were
constructed for 3- and 5-year survival probability using the rms
package (v5.1–2) (35,36) in R 3.4.1 (https://cran.r-project.org/web/packages/rms/index.html).
Nomograms enable the visualization of regression equations. Scoring
criteria are formulated by the magnitude of the regression
coefficients of all independent variables. Scales of each
independent variable are scored, and a total score can be estimated
for each sample. The probability and outcome for each sample can
then be calculated using a conversion function between the score
and the probability that the outcome will occur (37). Probabilities derived from nomograms
were used to evaluate and predict associations between independent
prognostic factors and the prognosis of targets.
Functional analysis of DE genes (DEGs) in
high-and low-risk groups in the entire set
Samples in the entire set were divided into high-
and low-risk groups according to risk scores obtained from the
fittest prognostic prediction model. Differences in the expression
matrix of genes between the high- and low-risk groups were
investigated using the limma package (v3.34.7) in R 3.4.1. FDR
<0.05 and log2FC >0.263 were set as the threshold
for identifying DEGs, and a volcano plot of significant DEGs was
created using the ggplot2 package in R 3.4.1. Gene Ontology (GO) of
biological processes and KEGG pathway enrichment analysis of the
identified DEGs were performed using the clusterProfiler package
(v3.6.0) in R 3.4.1 language (38)
(http://bioconductor.org/packages/release/bioc/html/clusterProfiler.html).
P<0.05 was considered to indicate a statistically significant
difference.
Results
Identification of DERs
Annotation of lncRNAs and mRNAs
According to probe location provided in the
downloaded platforms, 19,021 mRNAs and 376 lncRNAs were annotated
in TCGA set, and 18,007 mRNAs and 402 lncRNAs were annotated in
E-TABM-3267 using the HGNC database. After removing the mRNAs and
lncRNAs with a value of 0 in all samples, the two datasets had
17,097 mRNAs and 376 lncRNAs in common (data not shown).
Screening DERs
The RNA expression profiles of 526 ccRCC tumor
samples were downloaded from TCGA database with corresponding
clinical data. These samples were randomly and equally divided into
training (n=263) and testing (n=263) sets. Among the 263 ccRCC
cancer samples in the training set, the prognosis of 53 samples was
defined as less favorable and that of 63 samples was defined as
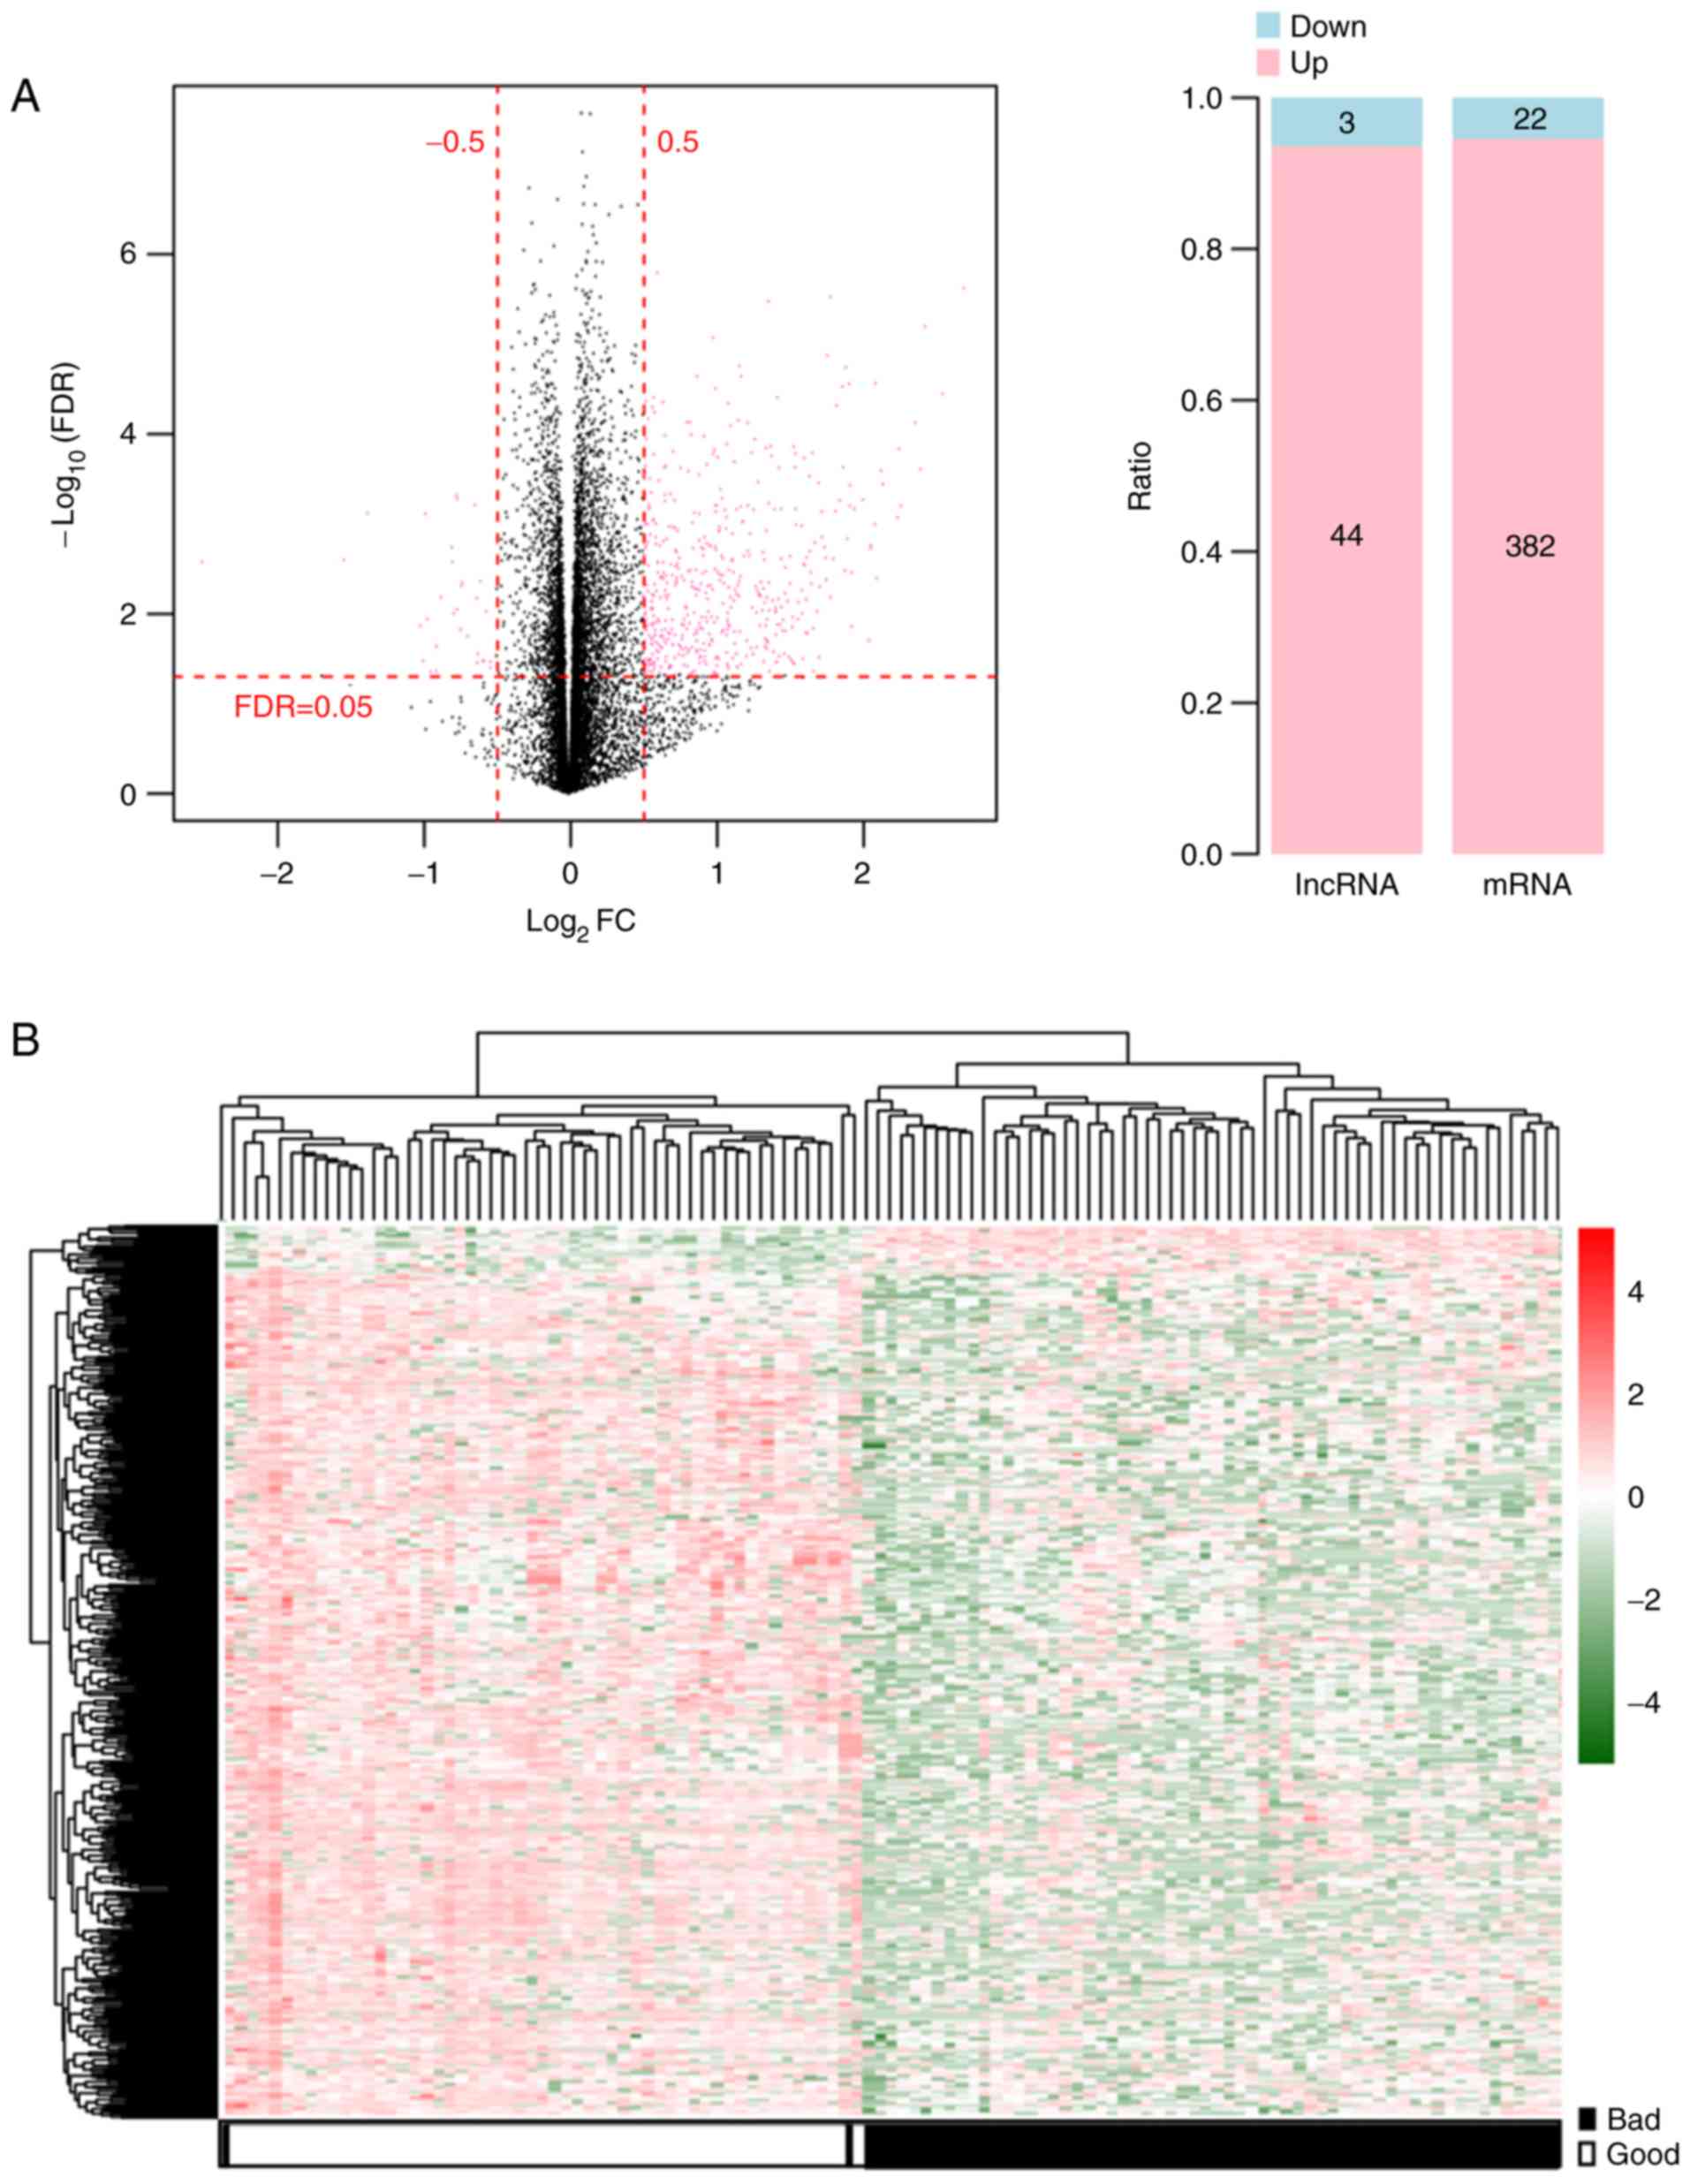
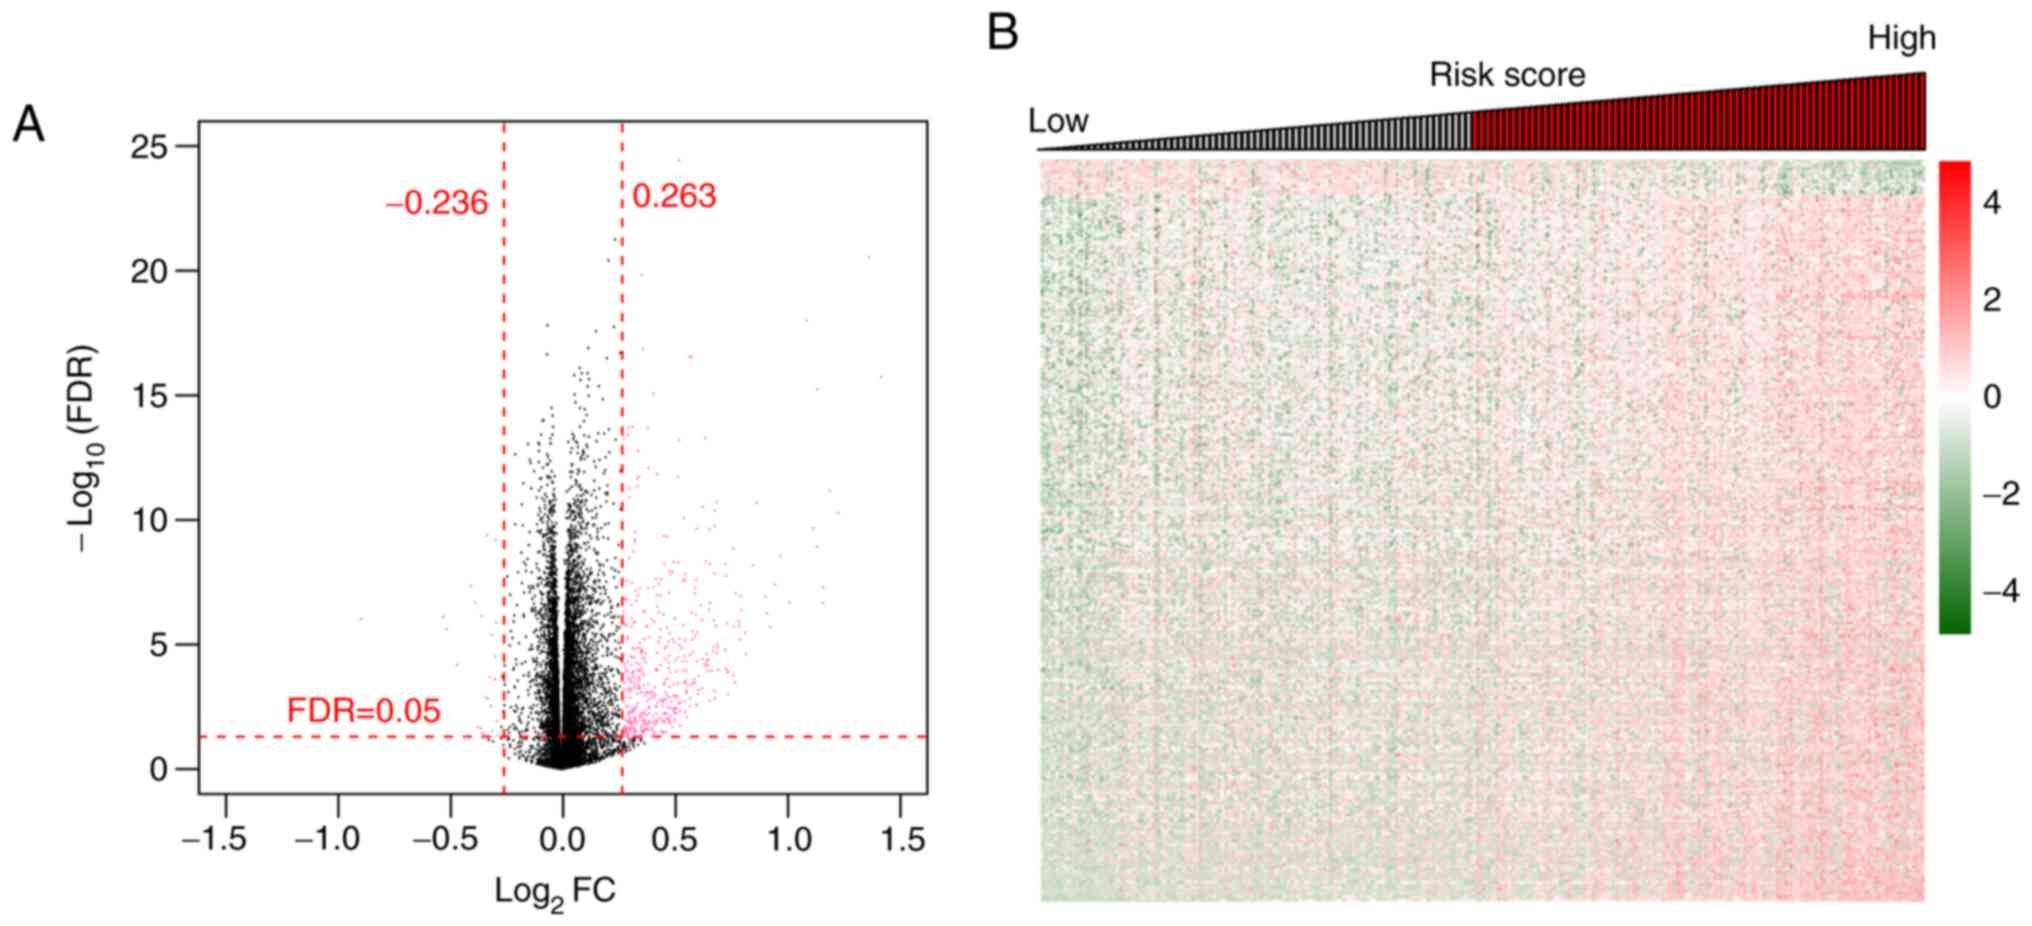
favorable. A total of 451 significant DERs with FDR <0.05 and
log2FC >0.5 were identified between the two prognoses
groups from the volcano plot generated using the limma package
(Fig. 1A). These DERs comprised 404
(22 downregulated and 382 upregulated) mRNAs and 47 (three
downregulated and 44 upregulated) lncRNAs (Fig. 1A). Two-way hierarchical clustering
heatmaps showed that the samples clustered into two groups
(Fig. 1B).
Construction of prognostic models
Screening independent prognostic DER
Univariate Cox regression analysis was used to
screen 269 prognostic DERs, including 233 mRNAs and 36 lncRNAs from
the 451 DERs identified according to the overall survival time of
patients in the aforementioned step. Multivariate Cox regression
analysis then selected 44 mRNAs and 15 lncRNAs as independent
prognostic factors (data not shown).
Screening optimal DER combinations
Using the expression values of the identified 44
mRNAs and 15 lncRNAs of independent prognostic values as input, the
combination of predictive mRNAs or lncRNAs was further optimized
and identified using the Cox regression model based on LASSO
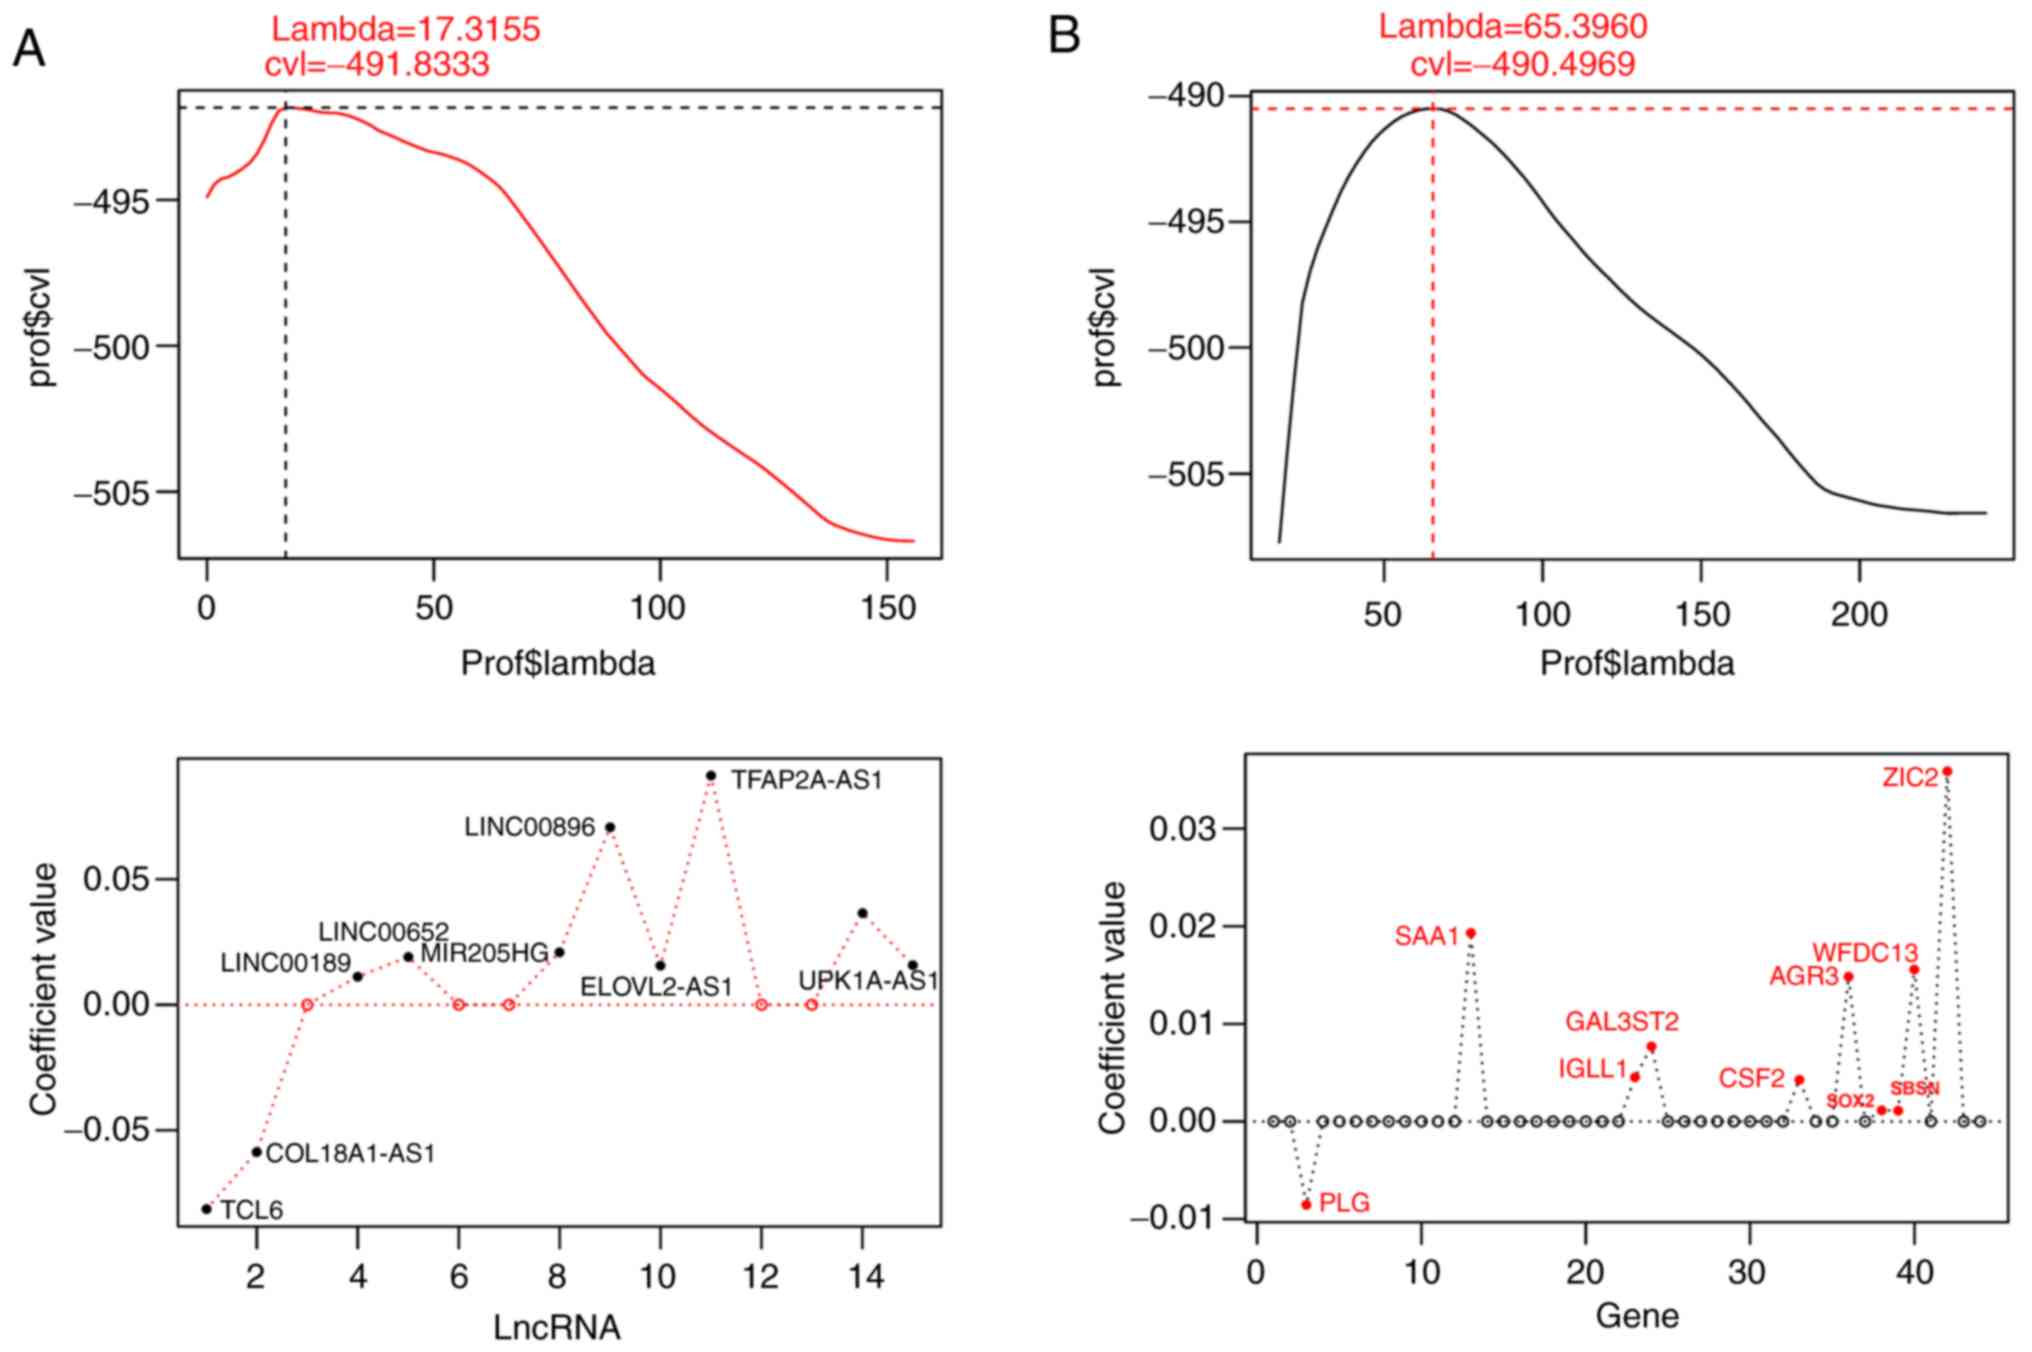
regularization regression algorithm in the penalized package. When
the maximum value of cvl was −491.8333, the lambda value was
17.3155, obtaining an optimal combination of 10 mRNAs comprising
anterior gradient homolog 3 (AGR3), granulocyte-macrophage
colony-stimulating factor (CSF2), galactose
3-O-sulfotransferase (GAL3ST2), immunoglobulin λ-like
polypeptide 1 (IGLL1), plasminogen (PLG), serum
amyloid A1 (SAA1), suprabasin (SBSN), SRY-type HMG
box transcription factor 2 (SOX2), whey acidic protein (WAP)
four-disulfide core domain protein (WFDC13) and zinc finger
of the cerebellum family member 2 (ZIC2) (Fig. 2A). When the cvl reached the maximum
value of −490.4969, lambda was 65.3960, and an optimal combination
of 10 significant lncRNAs was retrieved, comprising of collagen
18A1 antisense RNA 1 (COL18A1-AS1), elongation of very long-chain
fatty acid 2 antisense RNA 1 (ELOVL2-AS1), long intergenic
non-protein coding RNA 189 (LINC00189), LINC00470, LINC00652,
LINC00896, microRNA 205 host gene (MIR205HG), T cell
leukemia/lymphoma 6 (TCL6), transcription factor AP-2 α antisense
RNA (TFAP2A-AS1) and uroplakin 1A antisense RNA 1 (UPK1A-AS1)
(Fig. 2B). Regression coefficients,
P-values, hazard ratios (HRs) and 95% CIs of the 10 significant
lncRNAs and 10 significant mRNAs derived from the LASSO Cox
regression model are listed in Table
II. P-values of all the 10 lncRNAs and 10 mRNAs were all
<0.05.
| Table II.Detailed information of the optimal
combinations of 10 DElncRNAs or 10 DEmRNAs. |
Table II.
Detailed information of the optimal
combinations of 10 DElncRNAs or 10 DEmRNAs.
| RNA | Coefficient | P-value | HR | 95% CI | Cut-off |
|---|
| mRNA |
|
|
|
|
|
|
AGR3 | 0.0148287 |
9.65×10⁻³ | 1.2059 | 1.0465–1.3895 | −0.13 |
|
CSF2 | 0.0042776 |
9.22×10⁻⁵ | 1.4426 | 1.2005–1.7334 | 0.40 |
|
GAL3ST2 | 0.0076842 |
1.69×10⁻² | 1.3308 | 1.0527–1.6822 | 0.51 |
|
IGLL1 | 0.0045121 |
2.50×10⁻³ | 1.2333 | 1.0765–1.4130 | 0.41 |
|
PLG | −0.008533 |
1.88×10⁻³ | 0.7408 | 0.6131–0.8951 | −0.67 |
|
SAA1 | 0.0193154 |
1.28×10⁻⁴ | 1.8849 | 1.3629–2.6068 | 0.62 |
|
SBSN | 0.0155634 |
9.34×10⁻³ | 1.2852 | 1.0636–1.5528 | 0.55 |
|
SOX2 | 0.0011085 |
2.76×10⁻⁴ | 1.3625 | 1.1533–1.6097 | 0.28 |
|
WFDC13 | 0.0011551 |
2.06×10⁻⁴ | 1.3922 | 1.1690–1.6581 | 0.65 |
|
ZIC2 | 0.0358394 |
1.43×10⁻² | 1.2846 | 1.0512–1.5698 | 0.42 |
| lncRNA |
|
|
|
|
|
|
COL18A1-AS1 | −0.058594 |
2.02×10⁻³ | 0.8678 | 0.7790–0.9668 | 0.07 |
|
ELOVL2-AS1 | 0.0155223 |
2.75×10⁻² | 1.0463 | 1.0056–1.1106 | −0.06 |
|
LINC00189 | 0.0112113 |
1.61×10⁻² | 1.0769 | 1.0011–1.1701 | −0.02 |
|
LINC00470 | 0.036526 |
3.48×10⁻² | 1.0574 | 1.0056–1.1461 | −0.23 |
|
LINC00652 | 0.0190087 |
4.50×10⁻² | 1.1313 | 1.0927–1.3806 | 0.07 |
|
LINC00896 | 0.0707072 |
2.65×10⁻² | 1.0775 | 1.0060–1.1875 | 0.83 |
|
MIR205HG | 0.0209242 |
4.94×10⁻² | 1.0344 | 1.0019–1.0952 | 0.04 |
|
TCL6 | −0.081477 |
1.39×10⁻² | 0.9224 | 0.8453–0.9964 | −0.13 |
|
TFAP2A-AS1 | 0.0910578 |
9.28×10⁻³ | 1.1224 | 1.0019–1.2574 | 0.46 |
|
UPK1A-AS1 | 0.015775 |
1.66×10⁻² | 1.0481 | 1.0039–1.1053 | 0.20 |
Construction of risk prediction models based on
optimal combinations of 10 mRNAs or 10 lncRNAs
Various types of risk prediction models were
constructed based on the regression coefficients of the optimal
combinations of the aforementioned 10 prognostic mRNAs or lncRNAs
(Table II).
Risk prediction models based on mRNA expression
status (I)
Associations between expression levels of the
identified combinations of 10 DElncRNAs or 10 DEmRNAs in samples
and overall survival time were analyzed in the training set using
the X-Tile Bio-Informatics Tool. Table
II shows the cut-off values for the expression levels of each
DElncRNA or DEmRNA.
According to the cut-off value of each RNA, the
status of samples with lower and higher expression was set to 0 and
1, respectively. Consequently, the following prediction model based
on the status of 10 mRNAs or 10 lncRNAs was constructed: mRNA
Status risk score = 0.0148287 × StatusAGR3 + (0.0042776)
× StatusCSF2 + (0.0076842) × StatusGAL3ST2+
(0.0045121) × StatusIGLL1 + (−0.008533) ×
StatusPLG + (0.0193154) × StatusSAA1 +
(0.0155634) × StatusSBSN + (0.0011085) × Status
SOX2 + (0.0011551) × StatusWFDC13 +
(0.0358394) × StatusZIC2; lncRNA Status risk score =
−0.058594 × StatusCOL18A1-AS1 + (0.0155223) ×
StatusELOVL2-AS1 + (0.0112113) ×
StatusLINC00189 + (0.036526) ×
StatusLINC00470 + (0.0190087) ×
StatusLINC00652 + (0.0707072) ×
StatusLINC00896 + (0.0209242) × Status
MIR205HG + (−0.081477) × StatusTCL6+
(0.0910578) × StatusTFAP2A-AS1+ (0.015775) ×
StatusUPK1A-AS1.
Risk prediction models based on expression levels
(II)
The following prediction models were created based
on expression levels (Exprs) of the mRNAs or lncRNAs in the
aforementioned step: mRNA Expression risk score = 0.0148287 ×
ExprsAGR3 + (0.0042776) × ExprsCSF2 + (0.0076842) × ExprsGAL3ST2 +
(0.0045121) × ExprsIGLL1 + (−0.008533) × ExprsPLG + (0.0193154) ×
ExprsSAA1 + (0.0155634) × ExprsSBSN + (0.0011085) × ExprsSOX2 +
(0.0011551) × ExprsWFDC13 + (0.0358394) × ExprsZIC2; lncRNA
Expression risk score = −0.058594 × ExprsCOL18A1-AS1 + (0.0155223)x
ExprsELOVL2-AS1 + (0.0112113) × ExprsLINC00189 + (0.036526) ×
ExprsLINC00470 + (0.0190087) × ExprsLINC00652 + (0.0707072)x
ExprsLINC00896 + (0.0209242) × ExprsMIR205HG + (−0.081477) ×
ExprsTCL6 + (0.0910578) × ExprsTFAP2A-AS1+ (0.015775) ×
ExprsPK1A-AS1.
Effectiveness evaluation and comparison of
prognosis prediction models
The predictive abilities of the four models were
evaluated and compared among the training, validation, entire and
E-MTAB-3267 (independent validation) sets (Figs. 3 and 4). The training [lncRNAs-based status risk
score: log-rank P=4.07×10⁻⁹; HR (95% CI), 3.885
(2.388–6.321); mRNAs-based status risk score: log-rank
P=1.04×10⁻¹⁰; HR (95% CI), 4.653 (2.757–7.553)],
validation [lncRNAs-based status risk score:log-rank
P=9.58×10⁻⁴; HR (95% CI), 2.087 (1.329–3.278);
mRNAs-based status risk score: log-rank P=2.27×10⁻⁵; HR
(95% CI), 2.637 (1.654–4.203)] and entire [lncRNAs-based status
risk score:log-rank P=5.41×10⁻¹¹; HR (95% CI), 2.869
(2.064–3.989); mRNAs-based status risk score: log-rank
P=2.73×10⁻¹³; HR (95% CI), 3.270 (2.336–4.578)] sets
were separated into a high-risk group (shorter overall survival
time) and a low-risk group (longer overall survival time) using the
status model based on the 10 lncRNAs or 10 mRNAs, respectively
(Fig. 3). However, the two status
models could not dichotomize the E-MTAB-3267 set into two risk
groups with significantly different overall survival time (log-rank
P=5.14×10⁻¹ for lncRNA and 6.20×10⁻² for
mRNA; Fig. 3; Table III). Furthermore, all four datasets
exhibited significantly different overall survival time between the
high- and low-risk groups determined using the 10 lncRNA expression
model (Fig. 4A): training set,
log-rank P=6.33×10⁻⁸; HR (95% CI), 3.454 (2.145–5.563);
validation set, log-rank P=7.41×10⁻⁹; HR (95% CI), 3.947
(2.389–6.521); entire set, log-rank P=1.37×10⁻¹⁴; HR
(95% CI), 3.521 (2.503–4.955); E-MTAB-3267, log-rank
P=3.83×10⁻²; HR (95% CI), 1.942 (1.025–3.678). Similar
results were obtained using the 10 mRNA expression model (Fig. 4B): training set, log-rank
P=5.37×10⁻¹⁰; HR (95% CI), 4.315 (2.611–7.132);
validation set, log-rank P=9.17×10⁻⁶; HR (95% CI), 2.816
(1.746–4.542); entire set, log-rank P=3.04×10⁻¹⁴; HR
(95% CI), 3.513 (2.486–4.964); E-MTAB-3267, log-rank
P=6.89×10⁻³; HR (95% CI), 2.404 (1.248–4.628).
Additionally, Figs. 3 and 4 show the ROC curves and areas under the
ROC curves (AUC) of the four models for the training, validation,
entire and E-MTAB-3267 sets. The aforementioned results suggested
that the risk assessment model based on the expression levels of
the 10 mRNAs yielded more significant or similar log-rank P-values,
and higher or similar AUC values compared with the other three
models in the four datasets. Therefore, this model was selected as
the best prognostic model and was applied in further analyses.
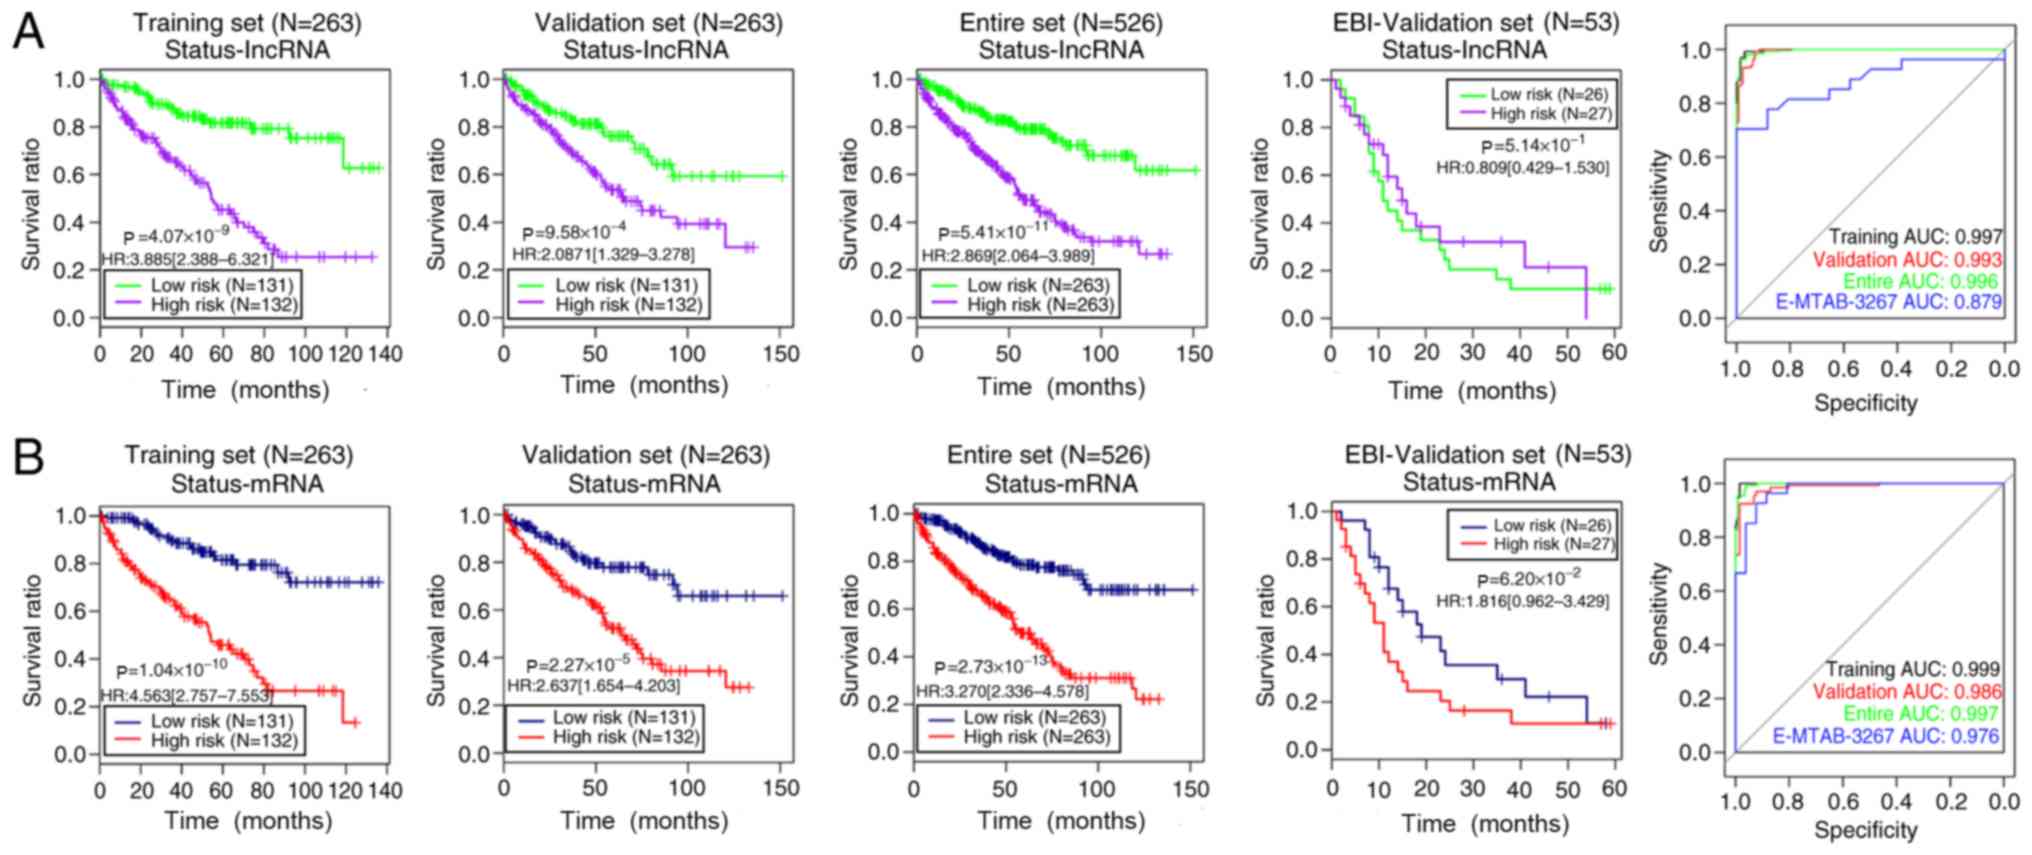 | Figure 3.Kaplan-Meier overall survival time
and ROC curves of risk score models based on the status of (A) 10
lncRNAs and (B) 10 mRNAs in the training, validation, entire and
EBI-validation sets. Green/blue and red/purple curves represent low
and high risk groups, respectively. In the ROC curves, the black,
red, green and blue lines indicate the training, validation, entire
and EBI-validation sets, respectively. lncRNA, long non-coding RNA;
EBI, European Bioinformatics Institute; ROC, receiver operating
characteristic; AUC, area under the curve; HR, hazard ratio. |
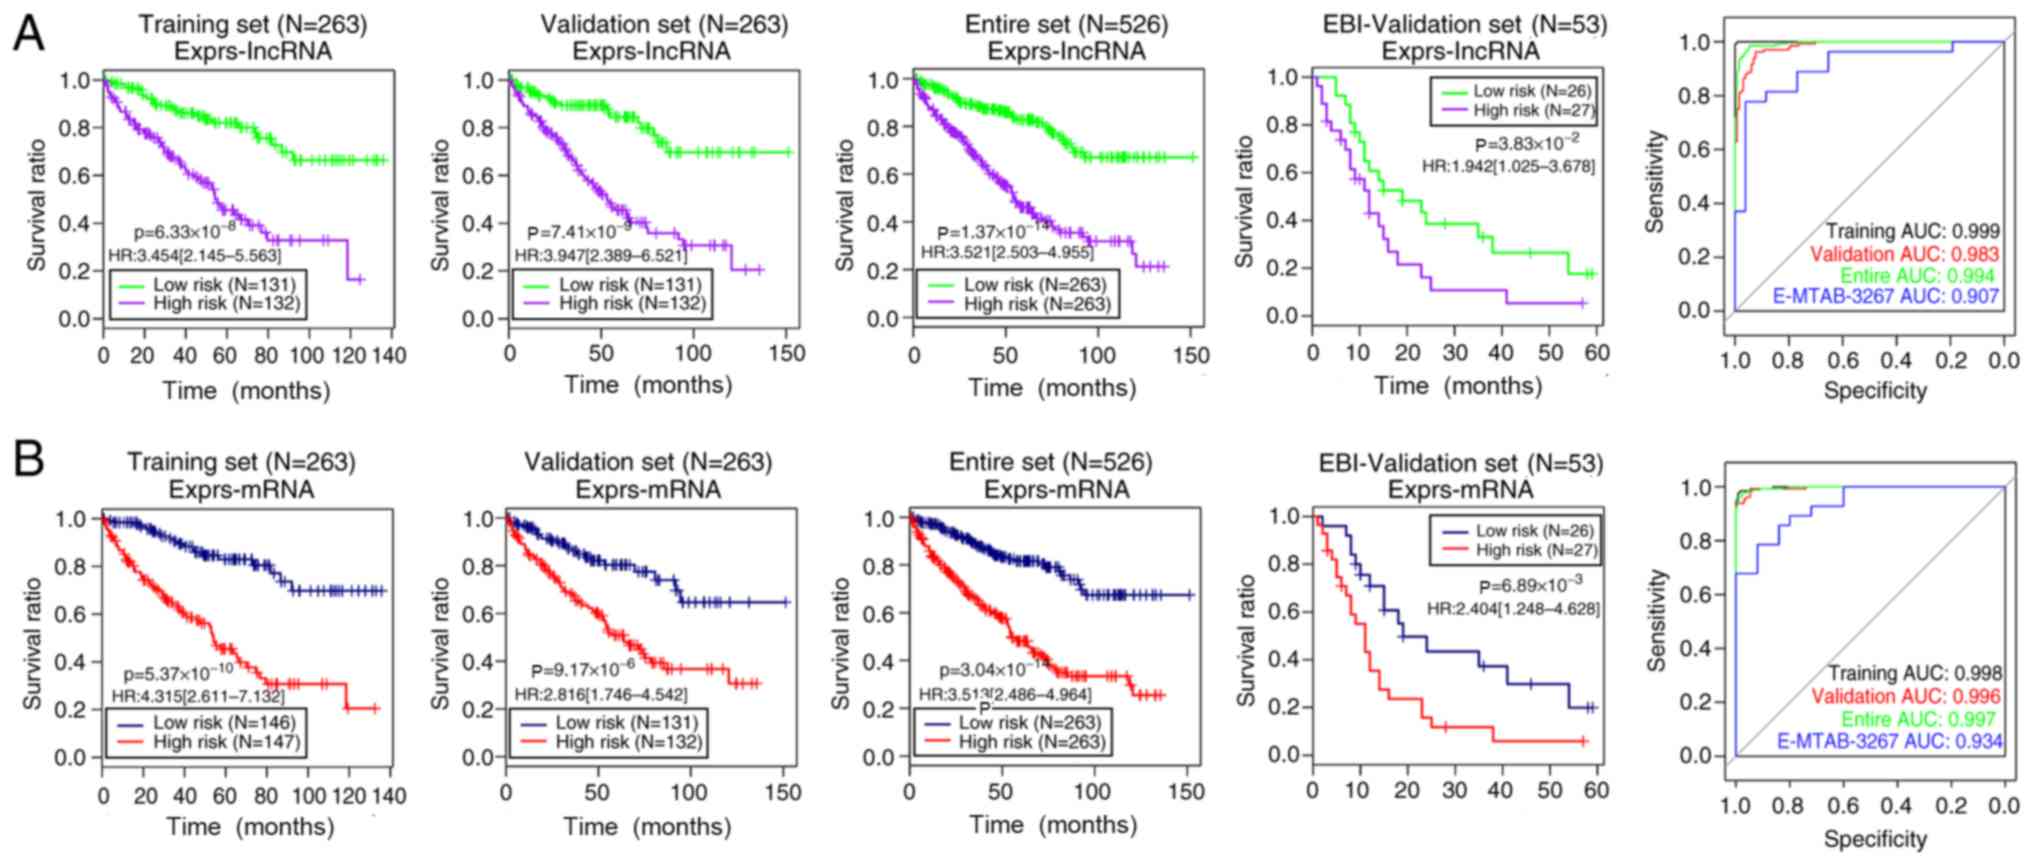 | Figure 4.Kaplan-Meier curves for overall
survival time and ROC analysis of risk score models based on the
expression levels of (A) 10 lncRNAs and (B) 10 mRNAs in the
training, validation, entire and EBI-validation sets. Green/blue
and red/purple curves represent the low and high risk groups,
respectively. In the ROC curves, the black, red, green and blue
lines indicate the training, validation, entire and EBI-validation
sets, respectively. lncRNA, long non-coding RNA; EBI, European
Bioinformatics Institute; ROC, receiver operating characteristic;
AUC, area under the curve; HR, hazard ratio; Exprs, expression
levels. |
| Table III.Independent prognostic clinical
factors identified by univariate and multivariate Cox regression
analysis. |
Table III.
Independent prognostic clinical
factors identified by univariate and multivariate Cox regression
analysis.
| A, Training set
(n=263) |
|---|
|
|---|
|
| Univariate
analysis | Multivariate
analysis |
|---|
|
|
|
|
|---|
| Clinical
characteristics | HR (95% CI) | P-value | HR (95% CI) | P-value |
|---|
| Age, <60/≥60
years | 1.028
(1.009–1.047) |
3.12×10⁻³ | 1.026
(1.0032–1.049) |
2.48×10⁻² |
| Sex,
male/female | 1.186
(0.755–1.862) |
4.59×10⁻¹ | – | – |
| Pathological M,
M0/M1/– | 4.396
(0.782–6.945) |
4.25×10⁻¹ | – | – |
| Pathological N,
N0/N1/– | 3.007
(0.779–7.670) |
1.55×10⁻¹ | – | – |
| Pathological T,
T1/T2/T3/T4 | 2.170
(1.701–2.767) |
1.71×10⁻¹¹ | 1.761 (0.952-
2.279) |
3.02×10⁻¹ |
| Pathological stage,
I/II/III/IV/– | 1.995
(1.657–2.403) |
2.44×10⁻¹⁵ | 1.759
(1.179–2.627) |
5.69×10⁻³ |
| Neoplasm histologic
grade, G1/G2/G3/G4/– | 2.536
(1.893–3.397) |
1.28×10⁻¹⁰ | 1.361
(0.952–1.945) |
9.07×10⁻² |
| Platelet count,
elevated/low/normal/– | 0.629
(0.517–0.765) |
1.10×10⁻⁶ | 0.832
(0.679–1.017) |
7.30×10⁻² |
| Serum calcium,
elevated/low/normal/– | 1.179
(0.738–1.884) |
4.90×10⁻¹ | – | – |
| White cell count,
elevated/low/normal/– | 1.159
(0.899–1.496) |
2.54×10⁻¹ | – | – |
| mRNA expression
model |
| Risk score status,
high/low | 4.315
(2.611–7.132) |
5.37×10⁻¹⁰ | 2.626
(1.426–4.838) |
1.95×10⁻³ |
|
| B, Validation
set (n=263) |
|
|
| Univariate
analysis | Multivariate
analysis |
|
|
|
|
| Clinical
characteristics | HR (95%
CI) | P-value | HR (95%
CI) | P-value |
|
| Age, <60/≥60
years | 1.028
(1.011–1.046) |
1.41×10⁻³ | 1.034
(1.013–1.055) |
1.35×10⁻³ |
| Sex,
male/female | 0.755
(0.491–1.162) |
2.00×10⁻¹ | – | – |
| Pathological M,
M0/M1/– | 4.189
(2.710–6.475) |
5.41×10⁻² | – | – |
| Pathological N,
N0/N1/– | 3.947
(1.649–9.450) |
8.72×10⁻² | – | – |
| Pathological T,
T1/T2/T3/T4 | 1.725
(1.375–2.164) |
1.1-x10−6 | 0.716
(0.474–1.082) |
1.13×10⁻¹ |
| Pathological stage,
I/II/III/IV/– | 1.786
(1.481–2.154) |
1.31×10⁻¹⁰ | 2.006
(1.424–2.825) |
6.84×10⁻⁵ |
| Neoplasm histologic
grade, G1/G2/G3/G4/– | 2.075
(1.557–2.765) |
3.37×10⁻⁷ | 1.245
(0.906–1.712) |
1.76×10⁻¹ |
| Platelet
qualitative, elevated/low/normal/– | 0.602
(0.453–0.8001) |
3.07×10⁻⁴ | 0.749
(0.560–1.001) |
5.04×10⁻² |
| Serum calcium,
elevated/low/normal/– | 0.752
(0.477–1.186) |
2.20×10⁻¹ | – | – |
| White cell count,
elevated/low/normal/– | 1.116
(0.879–1.416) |
3.68×10⁻¹ | – | – |
| mRNA expression
model |
| Risk score status,
high/low | 2.816
(1.746–4.542) |
9.17×10⁻⁶ | 1.986
(1.168-.379) |
1.14×10⁻² |
|
| C, Entire set
(n=526) |
|
|
| Univariate
analysis | Multivariate
analysis |
|
|
|
|
| Clinical
characteristics | HR (95%
CI) | P-value | HR (95%
CI) | P-value |
|
| Age, <60/≥60
years | 1.028
(1.015–1.041) |
1.25×10⁻⁵ | 1.022
(1.001–1.0429) |
3.59×10⁻² |
| Sex,
male/female | 0.943
(0.692–1.287) |
7.13×10⁻¹ | – | – |
| Pathological M,
M0/M1/– | 4.270
(0.919–5.845) |
6.32×10⁻² | – | – |
| Pathological N,
N0/N1/– | 3.461
(1.836–6.526) |
4.38×10⁻⁵ | 1.007
(0.429–2.361) |
9.87×10⁻¹ |
| Pathological T,
T1/T2/T3/T4 | 1.914
(1.624–2.255 |
4.44×10⁻¹⁶ | 0.703
(0.451–1.098) |
1.22×10⁻¹ |
| Pathological stage,
I/II/III/IV/– | 1.884
(1.652–2.15) |
2.00×10⁻¹⁶ | 1.815
(1.278–2.577) |
8.68×10⁻⁴ |
| Neoplasm
histological grade, G1/G2/G3/G4/– | 2.285
(1.863–2.802) |
3.33×10⁻¹⁶ | 1.359
(0.9591.926) |
8.39×10⁻² |
| Platelet
qualitative, elevated/low/normal/– | 0.648
(0.552–0.763) |
1.02×10⁻⁷ | 0.746
(0.594–0.936) |
1.12×10⁻² |
| Serum calcium
levels, elevated/low/normal/– | 0.938
(0.677–1.298) |
6.98×10⁻¹ | – | – |
| White cell count,
elevated/low/normal/– | 1.135
(0.954–1.351) |
1.53×10⁻¹ | – | – |
| mRNA expression
model |
| Risk score status,
high/low | 3.513
(2.486–4.964) |
3.04×10⁻¹⁴ | 2.943
(1.666–5.200) |
2.02×10⁻⁴ |
Establishment of nomogram survival model with
independent prognostic clinical factors and 10 DEmRNA expression
risk scores
Independent clinical prognostic factors for ccRCC
were analyzed using univariate and multivariate Cox regression
analyses of the samples. Table III
shows that age, pathological stage and mRNA expression model risk
score status were identified as independent prognostic factors in
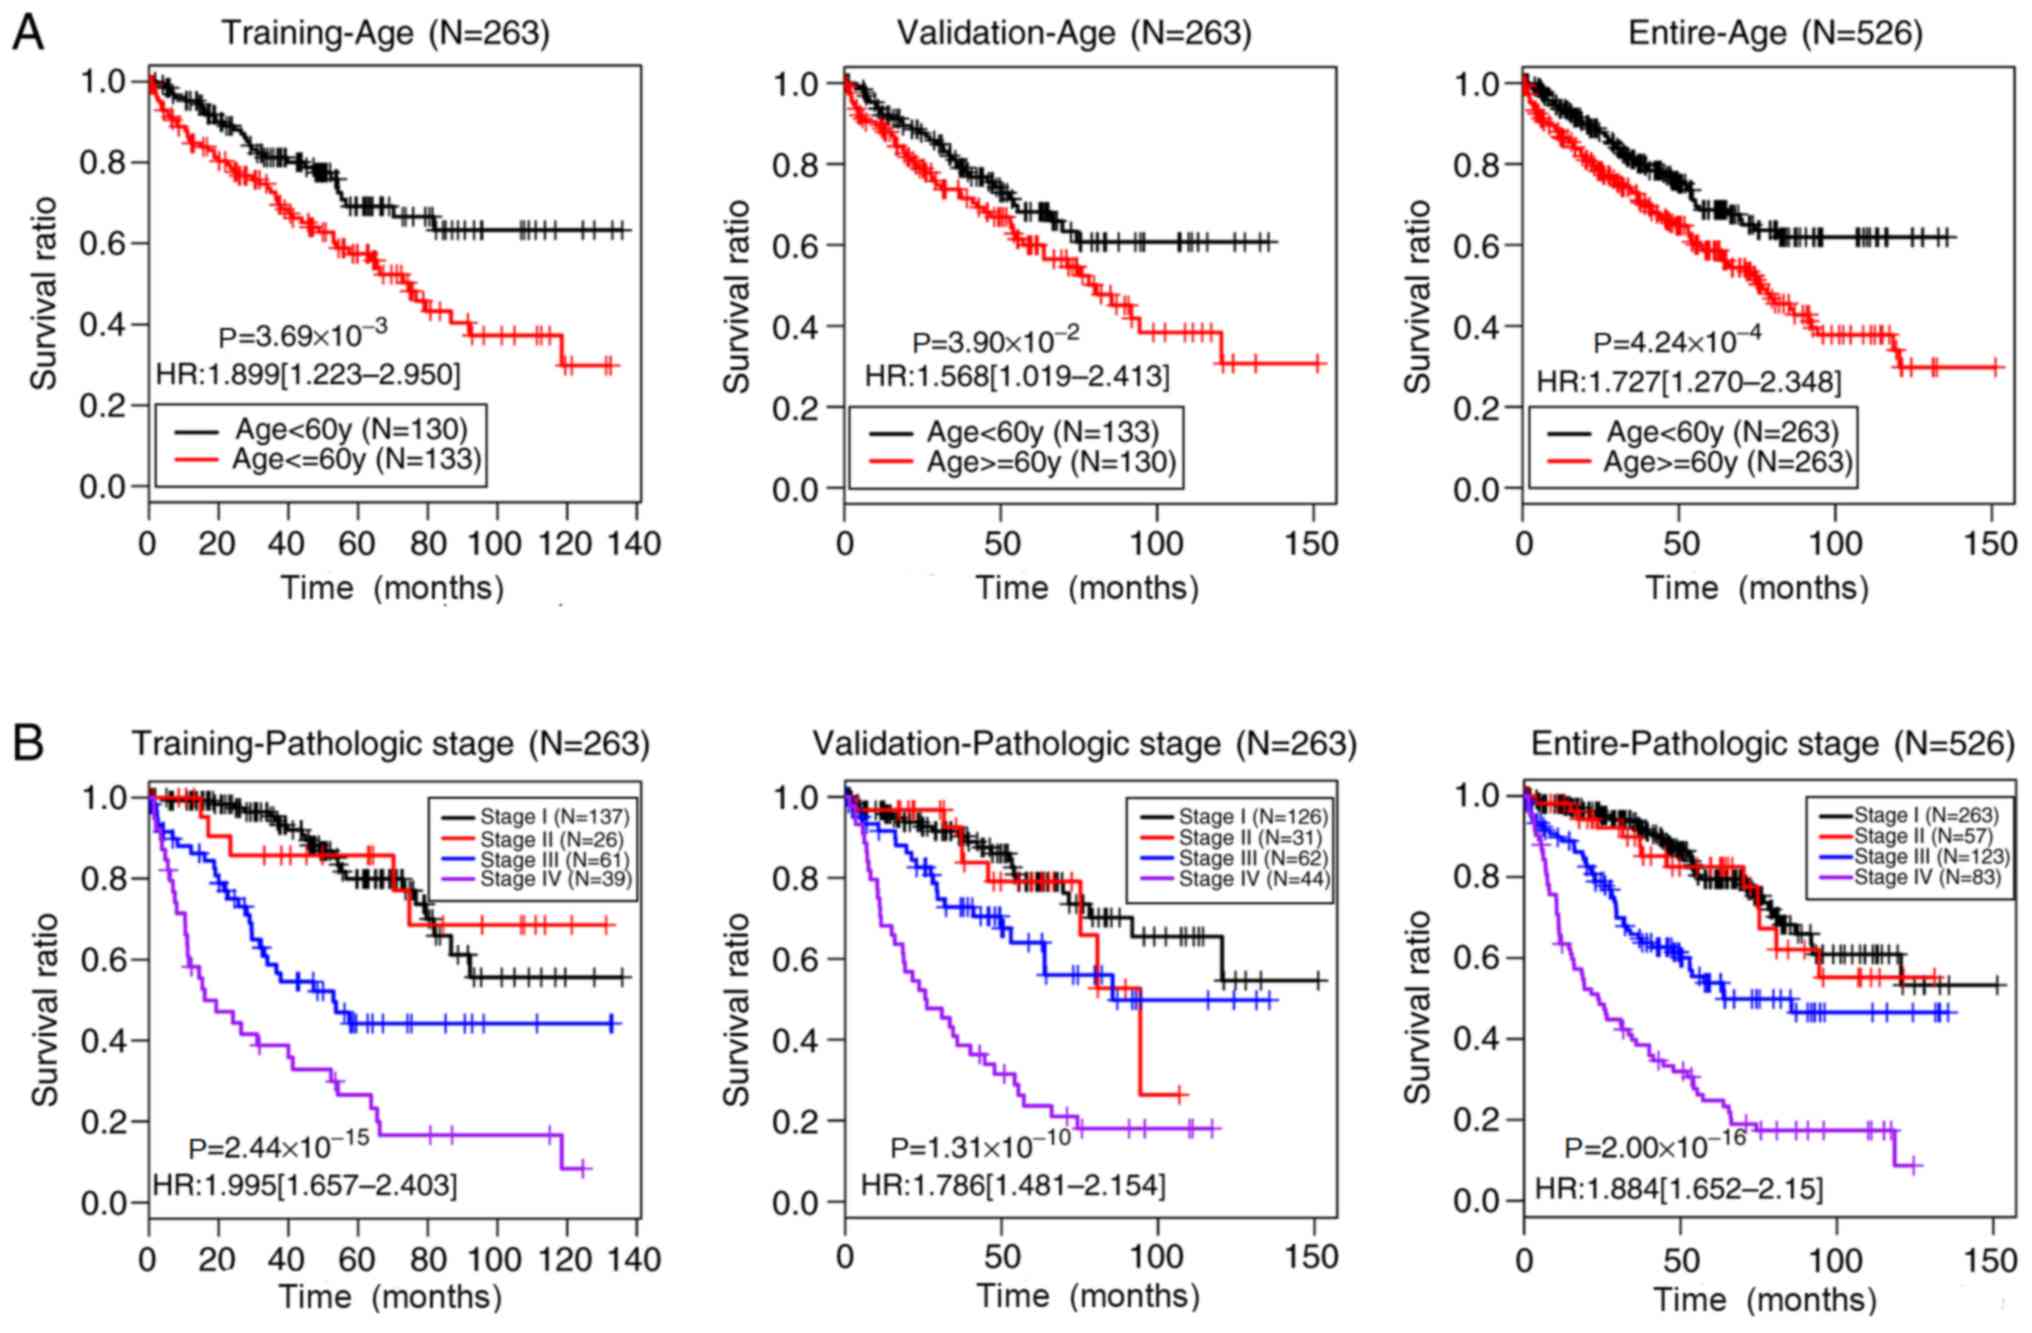
the training, validation and entire sets (P<0.05). Fig. 5 shows the Kaplan-Meier curves of age
and pathological stage in these three sets. The prognoses of
younger patients (<60 years) and of patients at earlier
pathological stages of ccRCC were significantly improved compared
with those of older patients (≥60 years) (training set,
P=3.69×10⁻³; validation set, P=3.90×10⁻²;
entire set, P=4.24×10⁻⁴) and of patients with later
pathological stages (training set, P=2.44×10⁻¹⁵;
validation set, P=1.31×10⁻¹⁰; entire set,
P=2.00×10⁻¹⁶), respectively, which was consistent with
current clinical practice (39).
Establishment of nomogram survival model
integrating 10 mRNA expression risk scores with independent
prognostic factors
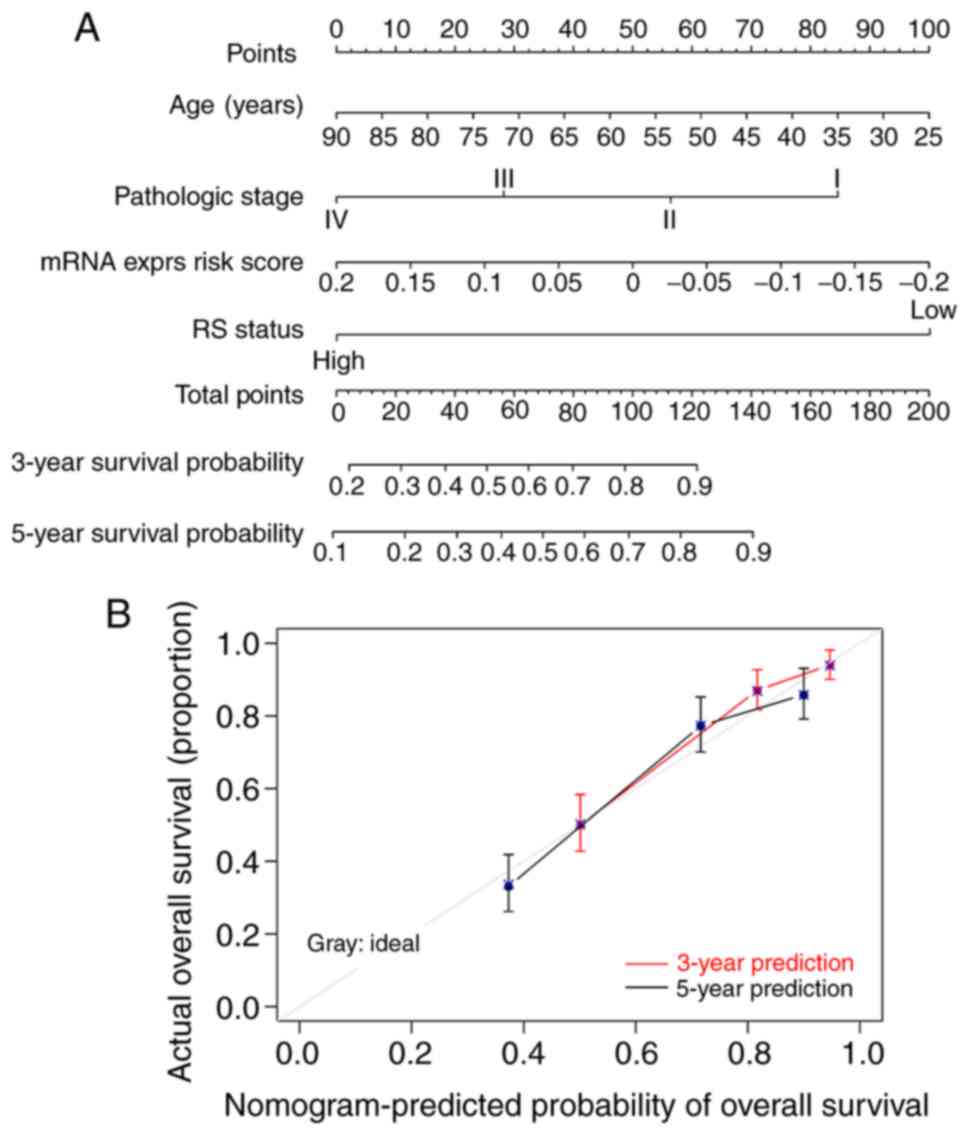
A composite nomogram was constructed using the
entire set to further assess associations between prognosis and
age, pathological stage and mRNA expression. Fig. 6A shows the nomogram of combined age,
pathological stage and mRNA expression model risk score status to
predict the survival of patients with ccRCC as the ‘total points’
axis of the sixth row. Total points represent the total account of
points of age, pathological stage and mRNA expression model risk
score. Calibration curves revealed good consistency between the 3-
and 5-year survival probabilities of all patients of the entire set
and those predicted by the nomogram survival model (Fig. 6B).
Identification and pathway enrichment analysis of
DEG in high-and low-risk groups of entire set
The present study aimed to resolve the possible
functional roles of the 10 prognostic mRNAs in ccRCC. Samples in
the entire set were divided into high- and low-risk groups by
applying the optimal risk score prediction model dependent on the
expression levels of the 10 DEmRNAs. A total of 400 significant
DEGs (including 19 downregulated and 381 upregulated genes) with
FDR <0.05 and log2FC >0.263 were identified using
the limma package (Fig. 7A). An
expression heatmap of the DEGs revealed distinctive expression
patterns of DEGs with high and low risk scores (Fig. 7B). Subsequently, enrichment analyses
of GO biological processes and KEGG signaling pathways for these
DEGs were conducted. The results revealed that 11 biological
processes, such as ‘inflammatory response’, ‘neuron
differentiation’ and ‘acute inflammatory response’, and six KEGG
signaling pathways, including ‘complement and coagulation cascades’
and ‘neuroactive ligand-receptor interactions’, were significantly
enriched within these DEGs (Table
IV).
| Table IV.GO biological processes and KEGG
pathways significantly enriched by the differentially expressed
genes. |
Table IV.
GO biological processes and KEGG
pathways significantly enriched by the differentially expressed
genes.
| Term | Count | P-value |
|---|
| Biological
processes |
|
|
|
GO:0006953 acute-phase
response | 11 |
5.25×10⁻⁹ |
|
GO:0007586 digestion | 13 |
3.08×10⁻⁷ |
|
GO:0002526 acute inflammatory
response | 13 |
6.99×10⁻⁷ |
|
GO:0030182 neuron
differentiation | 27 |
1.08×10⁻⁶ |
|
GO:0035270 endocrine system
development | 10 |
1.04×10⁻⁵ |
|
GO:0051606 detection of
stimulus | 11 |
1.49×10⁻⁴ |
|
GO:0007398 ectoderm
development | 14 |
2.25×10⁻⁴ |
|
GO:0030900 forebrain
development | 12 |
2.85×10⁻⁴ |
|
GO:0006954 inflammatory
response | 18 |
3.73×10⁻⁴ |
|
GO:0032101 regulation of
response to external stimulus | 12 |
4.19×10⁻⁴ |
|
GO:0009611 response to
wounding | 24 |
5.40×10⁻⁴ |
| KEGG pathways |
|
|
|
hsa04080: Neuroactive
ligand-receptor interaction | 17 |
1.07×10⁻⁵ |
|
hsa00590: Arachidonic acid
metabolism | 5 |
1.80×10⁻² |
|
hsa00591: Linoleic acid
metabolism | 4 |
1.35×10⁻² |
|
hsa04060: Cytokine-cytokine
receptor interaction | 10 |
4.62×10⁻² |
|
hsa00592: alpha-Linolenic acid
metabolism | 3 |
4.11×10⁻² |
|
hsa04610: Complement and
coagulation cascades | 5 |
3.55×10⁻² |
Discussion
Considering that aberrant expression levels of mRNAs
and lncRNAs are usually associated with the occurrence and
development of ccRCC (2,9–13,20),
exploring further lncRNA/mRNA-based signatures to predict the
prognosis in patients with ccRCC should be important. In the
present study, a large quantity of RNA-sequencing and survival data
of patients with ccRCC was downloaded, and DERs were screened
between samples of patients with less favorable and favorable
prognoses using models that could predict prognosis. Among the 451
DERs obtained from the training set, 404 and 47 were mRNAs and
lncRNAs, respectively. Univariate and multivariate Cox regression
analyses selected 44 mRNAs and 15 lncRNAs as independent prognostic
factors. Furthermore, optimal combinations of 10 DEmRNAs (AGR3,
CSF2, GAL3ST2, IGLL1, PLG, SAA1, SBSN, SOX2, WFDC13 and ZIC2) and
10 DElncRNAs (COL18A1-AS1, ELOVL2-AS1, LINC00189, LINC00470,
LINC00652, LINC00896, MIR205HG, TCL6, TFAP2A-AS1 and UPK1A-AS1)
were screened out based on the findings of the LASSO Cox regression
model.
Given the important roles of risk assessment tools
in estimating the probability of risk factors and detecting
high-risk populations for disease entities (14–17), the
present study constructed four prognostic prediction models based
on the status or expression levels of the 10 DElncRNAs or 10
DEmRNAs in optimal combinations. The predictive value of the four
models for ccRCC was assessed, and the results revealed that the
risk score model based on the expression levels of the 10 DEmRNAs
was the best predictor. Although risk assessment tools have been
widely applied to the clinical prediction of various types of
cancer, such as gastric cancer, hepatocellular carcinoma and
prostate cancer, few are available for ccRCC (11,18–21). The
present study created a potential risk assessment tool with which
to predict the prognosis in patients with ccRCC, and to explore the
possible pathogenesis of ccRCC.
According to the association with different types of
cancer, especially ccRCC, the 10 DEmRNAs in the optimal combination
can be divided into three groups. AGR3, CSF2, GAL3ST2, SAA1,
SBSN, SOX2 and ZIC2 in the first group are all
associated with human tumors. AGR3 was originally identified as a
membrane protein from breast cancer cell lines, and it has been
implicated in the growth, differentiation, metastasis and survival
of breast, prostate and ovarian cancer (40–43).
CSF2 is an important survival, proliferation and differentiation
factor of neutrophil and macrophage progenitors (44). CSF2 overexpression is associated with
a poor prognosis in patients with urothelial carcinoma, suggesting
that CSF2 may serve as an important prognosticator and a potential
therapeutic target for urothelial carcinoma (45). GAL3ST2 functions in regulating
adhesion capacity and may be associated with tumor metastasis in
lung giant cells and hepatoma cancer cells, where elevated GAL3ST2
expression is be associated with higher metastatic potential
(46). Previous studies have
identified GAL3ST2 expression in a normal murine mammary gland and
in two human breast cancer cell lines, and elevated expression
levels in metastatic tumors (47,48). SAA
is an acute phase protein that may be the precursor of amyloid
fibrils in reactive systemic amyloidosis (49) and function in cancer pathogenesis
(50). SAA1 may be a negative
prognostic factor for patients with melanoma and further studies
should assess these associations in other types of cancer (51). SAA1 is overexpressed in plasma
from patients with non-small cell lung cancer who experience short
overall survival after treatment with epidermal growth factor
receptor tyrosine-kinase inhibitors (52). SBSN is an epidermal differentiation
marker that is detectable in several types of tumor endothelial
cells (53,54). SBSN expression is associated with the
growth, proliferation and invasiveness of salivary gland adenoid
cystic and normal small cell lung carcinoma cells, as well as
glioblastoma (55–58). SOX2, a transcription factor expressed
in various types of embryonic and adult stem cells, is
significantly upregulated in cancer stem cells of squamous skin
tumors in mice (59). Furthermore,
SOX2 establishes a continuum between tumor initiation and
progression in primary skin tumors (59), and its expression is required for the
proliferation and anchorage-independent growth of lung and
esophageal cell lines (60,61). ZIC2 belongs to a gene family
that was originally identified by homology with odd-paired genes in
Drosophila, and functions during neural development
(62). ZIC2 has oncogenic
features and its overexpression is closely associated with the
progression of cervical, epithelial ovarian and liver cancer
(63–65). Although the seven genes in the first
group are all associated with human tumors, their involvement in
ccRCC is unknown. The second group contains only one gene,
WFDC13. WAP domains are widely distributed and highly
conserved in vertebrates and invertebrates, and they participate in
diverse physiological processes, such as calcium transport,
proteinase inhibition and bacterial killing (66). The WFDC proteins contain WAP domains
and are found in vertebrates and invertebrates (66). WFDC2 is frequently overexpressed in
epithelial ovarian cancer cells and may have potential as a
therapeutic target (67). However,
the biological function of WFDC13 in tumor progression
remains unclear. The third group contains IGLL1 and
PLG, which have unknown functions.
The present findings suggested that the 10 DElncRNAs
of the optimal combination may be involved in the pathogenesis of
ccRCC. Among the 10 DElncRNAs, COL18A1-AS1 (68,69),
TCL6 (70) and TFAP2A-AS1 (71) are associated with a worse survival of
patients with ccRCC, in accordance with the results of the present
study. Furthermore, ELOVL2-AS1, LINC00189, LINC00470, LINC00896 and
MIR205HG may be associated with tumors other than ccRCC. For
instance, ELOVL2-AS1 may be a progression-associated prognostic
biomarker for lung squamous cell carcinoma (72). LINC00189 is associated with cervical
cancer recurrence and may be used as a potential prognostic
biomarker (73). Upregulated
LINC00470 expression promotes the development of gastric cancer
(74). LINC00896 expression is
upregulated in human lung adenocarcinoma (75) and MIR205HG is differentially
expressed in papillary renal cell carcinoma (76). However, few studies have investigated
the functions of LINC00652 and UPK1A-AS1 in tumors. Despite
considerable effort to determine the underlying mechanisms of
lncRNAs in cancer, how they regulate gene expression remains
elusive. Further studies are required to verify these prognostic
DElncRNAs in ccRCC.
Functional annotations of the significant DEGs
between the high- and low-risk groups of the entire set determined
by the 10 DEmRNA expression risk scores according to the GO and
KEGG databases may provide an ample number of candidate genes and
further information regarding the pathogenesis of ccRCC. GO
functional analyses of 400 DEGs were conducted, and 11 GO terms and
5 KEGG signaling pathways validated the significant enrichment of
these DEGs. These genes were significantly associated with
biological processes, such as ‘inflammatory response’, ‘neuron
differentiation’ and ‘acute inflammatory response’, and
participated in signaling pathways, such as ‘complement and
coagulation cascades’ and ‘neuroactive ligand-receptor
interaction’, suggesting potential functions for the 10 prognostic
DEmRNAs in ccRCC. Further investigation of these genes may help to
further clarify the pathogenesis of ccRCC. Since the present
extensive bioinformatics study was based on published data, the
results of the present study should be further validated in
vitro and/or in vivo. Expression of these genes in ccRCC
can be detected using reverse transcription PCR or the protein
levels could be examined using western blotting.
In conclusion, the present study constructed risk
score models based on the status or expression levels of 10
DElncRNAs or 10 DEmRNAs to predict the prognosis of patients with
ccRCC, revealing that the prognostic performance of the model based
on the expression levels of the 10 DEmRNAs was the most effective.
The 10 prognostic DEmRNAs were mainly associated with inflammatory
response-associated biological processes, complement and
coagulation cascades and neuroactive ligand-receptor interaction
pathways. The 10 DEmRNAs in the optimal combination may be used as
potential therapeutic targets, and the present results may provide
novel insights into the pathogenesis of ccRCC.
Acknowledgements
Not applicable.
Funding
The present study was supported by National Natural
Science Foundation of China (grant no. 81603441), Science and
Technology Agency Foundation of Sichuan Province of China (grant
no. 2017JY0297), Chengdu Medical College Foundation (grant no.
CYZ15-11) and Health and Health Commission of Sichuan Province of
China (grant no. 18ZD041).
Availability of data and materials
All datasets generated and/or analyzed during the
current study are available in TCGA database (https://gdc-portal.nci.nih.gov/) or EBI Array
database (dataset number, E-TABM-3267; https://www.ebi.ac.uk/arrayexpress/).
Authors’ contributions
LY designed the present study. DX, WD, SW, BH and BG
performed the data analysis. DX and WD drafted the manuscript. All
authors read and approved the final manuscript.
Ethics approval and consent to
participate
Not applicable.
Patient consent for publication
Not applicable.
Competing interests
The authors declare that they have no competing
interests.
Glossary
Abbreviations
Abbreviations:
|
AGR
|
anterior gradient homolog
|
|
AUC
|
area under the curve
|
|
ccRCC
|
clear cell renal cell carcinoma
|
|
COL18A1-AS1
|
collagen 18A1 antisense RNA 1
|
|
CSF
|
granulocyte-macrophage
colony-stimulating factor
|
|
cvl
|
cross-validation likelihood
|
|
DE
|
differentially expressed
|
|
DEGs
|
DE genes
|
|
DER
|
DE RNA
|
|
EBI
|
European Bioinformatics Institute
|
|
ELOVL2-AS
|
elongation of very long-chain fatty
acid 2-antisense RNA
|
|
FDR
|
false discovery rate
|
|
GAL3ST
|
galactose 3-O-sulfotransferase
|
|
GO
|
Gene Ontology
|
|
HGNC
|
Human Genome Organization Gene
Nomenclature Committee
|
|
IGLL1
|
immunoglobulin λ-like polypeptide
1
|
|
KEGG
|
Kyoto Encyclopedia of Genes and
Genomes
|
|
lncRNA
|
long non-coding RNA
|
|
LINC
|
long intergenic non-protein coding
RNA
|
|
log2FC
|
log2-fold change
|
|
MIR205HG
|
microRNA 205 host gene
|
|
PLG
|
plasminogen
|
|
ROC
|
receiver operating characteristic
|
|
SAA
|
serum amyloid A
|
|
SOX
|
SRY-type HMG box transcription
factor
|
|
SBSN
|
suprabasin
|
|
TCGA
|
The Cancer Genome Atlas
|
|
TCL
|
T cell leukemia/lymphoma
|
|
TFAP2A-AS1
|
transcription factor AP-2 α antisense
RNA
|
|
UPK
|
uroplakin
|
|
WAP
|
whey acidic proteins
|
|
WFDC
|
WAP four-disulfide core domain
protein
|
|
ZIC
|
zinc finger of the cerebellum
|
References
|
1
|
Rini BI, Campbell SC and Escudier B: Renal
cell carcinoma. Lancet. 373:1119–1132. 2009. View Article : Google Scholar : PubMed/NCBI
|
|
2
|
Cancer Genome Atlas Research Network, .
Comprehensive molecular characterization of clear cell renal cell
carcinoma. Nature. 499:43–49. 2013. View Article : Google Scholar : PubMed/NCBI
|
|
3
|
Valera VA and Merino MJ: Misdiagnosis of
clear cell renal cell carcinoma. Nat Rev Urol. 8:321–333. 2011.
View Article : Google Scholar : PubMed/NCBI
|
|
4
|
Aref S, Al Khodary T, Zeed TA, El Sadiek
A, El Menshawy N and Al Ashery R: The prognostic relevance of BAALC
and ERG expression levels in cytogenetically normal pediatric acute
myeloid leukemia. Indian J Hematol Blood Transfus. 31:21–28. 2015.
View Article : Google Scholar : PubMed/NCBI
|
|
5
|
Li L, Feng T, Qu J, Feng N, Wang Y, Ma RN,
Li X, Zheng ZJ, Yu H and Qian B: LncRNA expression signature in
prediction of the prognosis of lung adenocarcinoma. Genet Test Mol
Biomarkers. 22:20–28. 2018. View Article : Google Scholar : PubMed/NCBI
|
|
6
|
Miller A, McLeod L, Alhayyani S, Szczepny
A, Watkins DN, Chen W, Enriori P, Ferlin W, Ruwanpura S and Jenkins
BJ: Blockade of the IL-6 trans-signalling/STAT3 axis suppresses
cachexia in Kras-induced lung adenocarcinoma. Oncogene.
36:3059–3066. 2017. View Article : Google Scholar : PubMed/NCBI
|
|
7
|
Tripathi MK, Doxtater K, Keramatnia F,
Zacheaus C, Yallapu MM, Jaggi M and Chauhan SC: Role of lncRNAs in
ovarian cancer: Defining new biomarkers for therapeutic purposes.
Drug Discov Today. 23:1635–1643. 2018. View Article : Google Scholar : PubMed/NCBI
|
|
8
|
Yao J, Chen Y, Wang Y, Liu S, Yuan X, Pan
F and Geng P: Decreased expression of a novel lncRNA CADM1-AS1 is
associated with poor prognosis in patients with clear cell renal
cell carcinomas. Int J Clin Exp Pathol. 7:2758–2767.
2014.PubMed/NCBI
|
|
9
|
Hakimi AA, Reznik E, Lee C-H, Creighton
CJ, Brannon AR, Luna A, Aksoy BA, Liu EM, Shen R, Lee W, et al: An
integrated metabolic atlas of clear cell renal cell carcinoma.
Cancer Cell. 29:104–116. 2016. View Article : Google Scholar : PubMed/NCBI
|
|
10
|
Huang H, Ling W, Qiu T and Luo Y:
Ultrasonographic features of testicular metastasis from renal clear
cell carcinoma that mimics a seminoma: A case report. Medicine
(Baltimore). 97:e127282018. View Article : Google Scholar : PubMed/NCBI
|
|
11
|
Chen J, Chen Y, Gu L, Li X, Gao Y, Lyu X,
Chen L, Luo G, Wang L, Xie Y, et al: LncRNAs act as prognostic and
diagnostic biomarkers in renal cell carcinoma: A systematic review
and meta-analysis. Oncotarget. 7:74325–74336. 2016. View Article : Google Scholar : PubMed/NCBI
|
|
12
|
Deng M, Blondeau JJ, Schmidt D, Perner S,
Müller SC and Ellinger J: Identification of novel differentially
expressed lncRNA and mRNA transcripts in clear cell renal cell
carcinoma by expression profiling. Genom Data. 5:173–175. 2015.
View Article : Google Scholar : PubMed/NCBI
|
|
13
|
Ning L, Li Z, Wei D, Chen H and Yang C:
LncRNA, NEAT1 is a prognosis biomarker and regulates cancer
progression via epithelial-mesenchymal transition in clear cell
renal cell carcinoma. Cancer Biomark. 19:75–83. 2017. View Article : Google Scholar : PubMed/NCBI
|
|
14
|
Chen J-M, Cooper DN, Chuzhanova N, Férec C
and Patrinos GP: Gene conversion: Mechanisms, evolution and human
disease. Nat Rev Genet. 8:762–775. 2007. View Article : Google Scholar : PubMed/NCBI
|
|
15
|
Iida M, Ikeda F, Hata J, Hirakawa Y, Ohara
T, Mukai N, Yoshida D, Yonemoto K, Esaki M, Kitazono T, et al:
Development and validation of a risk assessment tool for gastric
cancer in a general Japanese population. Gastric Cancer.
21:383–390. 2018. View Article : Google Scholar : PubMed/NCBI
|
|
16
|
Hung YC, Lin CL, Liu CJ, Hung H, Lin SM,
Lee SD, Chen PJ, Chuang SC and Yu MW: Development of risk scoring
system for stratifying population for hepatocellular carcinoma
screening. Hepatology. 61:1934–1944. 2015. View Article : Google Scholar : PubMed/NCBI
|
|
17
|
Hussein AA, Ghani KR, Peabody J, Sarle R,
Abaza R, Eun D, Hu J, Fumo M, Lane B, Montgomery JS, et al Michigan
Urological Surgery Improvement Collaborative and Applied Technology
Laboratory for Advanced Surgery Program, : Development and
validation of an objective scoring tool for robot-assisted radical
prostatectomy: Prostatectomy assessment and competency evaluation.
J Urol. 197:1237–1244. 2017. View Article : Google Scholar : PubMed/NCBI
|
|
18
|
Klatte T, Seligson DB, LaRochelle J, Shuch
B, Said JW, Riggs SB, Zomorodian N, Kabbinavar FF, Pantuck AJ and
Belldegrun AS: Molecular signatures of localized clear cell renal
cell carcinoma to predict disease-free survival after nephrectomy.
Cancer Epidemiol Biomarkers Prev. 18:894–900. 2009. View Article : Google Scholar : PubMed/NCBI
|
|
19
|
Heinzelmann J, Henning B, Sanjmyatav J,
Posorski N, Steiner T, Wunderlich H, Gajda MR and Junker K:
Specific miRNA signatures are associated with metastasis and poor
prognosis in clear cell renal cell carcinoma. World J Urol.
29:367–373. 2011. View Article : Google Scholar : PubMed/NCBI
|
|
20
|
Takahashi M, Rhodes DR, Furge KA, Kanayama
H, Kagawa S, Haab BB and Teh BT: Gene expression profiling of clear
cell renal cell carcinoma: Gene identification and prognostic
classification. Proc Natl Acad Sci USA. 98:9754–9759. 2001.
View Article : Google Scholar : PubMed/NCBI
|
|
21
|
Wu X, Weng L, Li X, Guo C, Pal SK, Jin JM,
Li Y, Nelson RA, Mu B, Onami SH, et al: Identification of a
4-microRNA signature for clear cell renal cell carcinoma metastasis
and prognosis. PLoS One. 7:e356612012. View Article : Google Scholar : PubMed/NCBI
|
|
22
|
Beuselinck B, Job S, Becht E, Karadimou A,
Verkarre V, Couchy G, Giraldo N, Rioux-Leclercq N, Molinié V,
Sibony M, et al: Molecular subtypes of clear cell renal cell
carcinoma are associated with sunitinib response in the metastatic
setting. Clin Cancer Res. 21:1329–1339. 2015. View Article : Google Scholar : PubMed/NCBI
|
|
23
|
Parkinson H, Kapushesky M, Kolesnikov N,
Rustici G, Shojatalab M, Abeygunawardena N, Berube H, Dylag M, Emam
I, Farne A, et al: ArrayExpress update--from an archive of
functional genomics experiments to the atlas of gene expression.
Nucleic Acids Res. 37:(Database). D868–D872. 2009. View Article : Google Scholar : PubMed/NCBI
|
|
24
|
Wright MW: A short guide to long
non-coding RNA gene nomenclature. Hum Genomics. 8:72014. View Article : Google Scholar : PubMed/NCBI
|
|
25
|
Ritchie ME, Phipson B, Wu D, Hu Y, Law CW,
Shi W and Smyth GK: limma powers differential expression analyses
for RNA-sequencing and microarray studies. Nucleic Acids Res.
43:e472015. View Article : Google Scholar : PubMed/NCBI
|
|
26
|
R Development Core Team R, . A language
and environment for statistical computing. R Foundation for
Statistical Computing. (Vienna). 2011.
|
|
27
|
Ito K and Murphy D: Application of ggplot2
to Pharmacometric Graphics. CPT Pharmacometrics Syst Pharmacol.
2:e792013. View Article : Google Scholar : PubMed/NCBI
|
|
28
|
Wang L, Cao C, Ma Q, Zeng Q, Wang H, Cheng
Z, Zhu G, Qi J, Ma H, Nian H, et al: RNA-seq analyses of multiple
meristems of soybean: Novel and alternative transcripts,
evolutionary and functional implications. BMC Plant Biol.
14:1692014. View Article : Google Scholar : PubMed/NCBI
|
|
29
|
Wang P, Wang Y, Hang B, Zou X and Mao JH:
A novel gene expression-based prognostic scoring system to predict
survival in gastric cancer. Oncotarget. 7:55343–55351. 2016.
View Article : Google Scholar : PubMed/NCBI
|
|
30
|
Tibshirani R: The lasso method for
variable selection in the Cox model. Stat Med. 16:385–395. 1997.
View Article : Google Scholar : PubMed/NCBI
|
|
31
|
Goeman JJ: L1 penalized estimation in the
Cox proportional hazards model. Biom J. 52:70–84. 2010.PubMed/NCBI
|
|
32
|
Camp RL, Dolled-Filhart M and Rimm DL:
X-tile: A new bio-informatics tool for biomarker assessment and
outcome-based cut-point optimization. Clin Cancer Res.
10:7252–7259. 2004. View Article : Google Scholar : PubMed/NCBI
|
|
33
|
Gettman MT, Blute ML, Spotts B, Bryant SC
and Zincke H: Pathologic staging of renal cell carcinoma:
Significance of tumor classification with the 1997 TNM staging
system. Cancer. 91:354–361. 2001. View Article : Google Scholar : PubMed/NCBI
|
|
34
|
Delahunt B, Eble JN, Egevad L and
Samaratunga H: Grading of renal cell carcinoma. Histopathology.
74:4–17. 2019. View Article : Google Scholar : PubMed/NCBI
|
|
35
|
Anderson WI, Schlafer DH and Vesely KR:
Thyroid follicular carcinoma with pulmonary metastases in a beaver
(Castor canadensis). J Wildl Dis. 25:599–600. 1989. View Article : Google Scholar : PubMed/NCBI
|
|
36
|
Eng KH, Schiller E and Morrell K: On
representing the prognostic value of continuous gene expression
biomarkers with the restricted mean survival curve. Oncotarget.
6:36308–36318. 2015. View Article : Google Scholar : PubMed/NCBI
|
|
37
|
Iasonos A, Schrag D, Raj GV and Panageas
KS: How to build and interpret a nomogram for cancer prognosis. J
Clin Oncol. 26:1364–1370. 2008. View Article : Google Scholar : PubMed/NCBI
|
|
38
|
Huang G, Zhao G, Xia J, Wei Y, Chen F,
Chen J and Shi J: FGF2 and FAM201A affect the development of
osteonecrosis of the femoral head after femoral neck fracture.
Gene. 652:39–47. 2018. View Article : Google Scholar : PubMed/NCBI
|
|
39
|
Klatte T and Rossi SH: Prognostic factors
and prognostic models for renal cell carcinoma: a literature
review. World J Urol. 36:1943–1952. 2018. View Article : Google Scholar : PubMed/NCBI
|
|
40
|
Adam PJ, Boyd R, Tyson KL, Fletcher GC,
Stamps A, Hudson L, Poyser HR, Redpath N, Griffiths M, Steers G, et
al: Comprehensive proteomic analysis of breast cancer cell
membranes reveals unique proteins with potential roles in clinical
cancer. J Biol Chem. 278:6482–6489. 2003. View Article : Google Scholar : PubMed/NCBI
|
|
41
|
King ER, Tung CS, Tsang YTM, Zu Z, Lok GT,
Deavers MT, Malpica A, Wolf JK, Lu KH, Birrer MJ, et al: The
anterior gradient homolog 3 (AGR3) gene is associated with
differentiation and survival in ovarian cancer. Am J Surg Pathol.
35:904–912. 2011. View Article : Google Scholar : PubMed/NCBI
|
|
42
|
Obacz J, Takacova M, Brychtova V, Dobes P,
Pastorekova S, Vojtesek B and Hrstka R: The role of AGR2 and AGR3
in cancer: Similar but not identical. Eur J Cell Biol. 94:139–147.
2015. View Article : Google Scholar : PubMed/NCBI
|
|
43
|
Qiu C, Wang Y, Wang X, Zhang Q, Li Y, Xu
Y, Jin C, Bu H, Zheng W, Yang X, et al: Combination of TP53 and
AGR3 to distinguish ovarian high-grade serous carcinoma from
low-grade serous carcinoma. Int J Oncol. 52:2041–2050.
2018.PubMed/NCBI
|
|
44
|
He J-Q, Shumansky K, Connett JE,
Anthonisen NR, Paré PD and Sandford AJ: Association of genetic
variations in the CSF2 and CSF3 genes with lung function in
smoking-induced COPD. Eur Respir J. 32:25–34. 2008. View Article : Google Scholar : PubMed/NCBI
|
|
45
|
Lee Y-Y, Wu W-J, Huang C-N, Li CC, Li WM,
Yeh BW, Liang PI, Wu TF and Li CF: CSF2 overexpression is
associated with STAT5 phosphorylation and poor prognosis in
patients with urothelial carcinoma. J Cancer. 7:711–721. 2016.
View Article : Google Scholar : PubMed/NCBI
|
|
46
|
Shi B-Z, Hu P, Geng F, He P-J and Wu X-Z:
Gal3ST-2 involved in tumor metastasis process by regulation of
adhesion ability to selectins and expression of integrins. Biochem
Biophys Res Commun. 332:934–940. 2005. View Article : Google Scholar : PubMed/NCBI
|
|
47
|
Guerra LN, Suárez C, Soto D, Schiappacasse
A, Sapochnik D, Sacca P, Piwien-Pilipuk G, Peral B and Calvo JC:
GAL3ST2 from mammary gland epithelial cells affects differentiation
of 3T3-L1 preadipocytes. Clin Transl Oncol. 17:511–520. 2015.
View Article : Google Scholar : PubMed/NCBI
|
|
48
|
Qin F, Song Z, Chang M, Song Y, Frierson H
and Li H: Recurrent cis-SAGe chimeric RNA, D2HGDH-GAL3ST2, in
prostate cancer. Cancer Lett. 380:39–46. 2016. View Article : Google Scholar : PubMed/NCBI
|
|
49
|
Turnell W, Sarra R, Glover ID, Baum JO,
Caspi D, Baltz ML and Pepys MB: Secondary structure prediction of
human SAA1. Presumptive identification of calcium and lipid binding
sites. Mol Biol Med. 3:387–407. 1986.PubMed/NCBI
|
|
50
|
Sung H-J, Ahn J-M, Yoon Y-H, Rhim TY, Park
CS, Park JY, Lee SY, Kim JW and Cho JY: Identification and
validation of SAA as a potential lung cancer biomarker and its
involvement in metastatic pathogenesis of lung cancer. J Proteome
Res. 10:1383–1395. 2011. View Article : Google Scholar : PubMed/NCBI
|
|
51
|
Mattarollo SR and Smyth MJ: A novel axis
of innate immunity in cancer. Nat Immunol. 11:981–982. 2010.
View Article : Google Scholar : PubMed/NCBI
|
|
52
|
Milan E, Lazzari C, Anand S, Floriani I,
Torri V, Sorlini C, Gregorc V and Bachi A: SAA1 is over-expressed
in plasma of non small cell lung cancer patients with poor outcome
after treatment with epidermal growth factor receptor
tyrosine-kinase inhibitors. J Proteomics. 76:91–101. 2012.
View Article : Google Scholar : PubMed/NCBI
|
|
53
|
Alam MT, Nagao-Kitamoto H, Ohga N, Akiyama
K, Maishi N, Kawamoto T, Shinohara N, Taketomi A, Shindoh M, Hida
Y, et al: Suprabasin as a novel tumor endothelial cell marker.
Cancer Sci. 105:1533–1540. 2014. View Article : Google Scholar : PubMed/NCBI
|
|
54
|
Park GT, Lim SE, Jang S-I and Morasso MI:
Suprabasin, a novel epidermal differentiation marker and potential
cornified envelope precursor. J Biol Chem. 277:45195–45202. 2002.
View Article : Google Scholar : PubMed/NCBI
|
|
55
|
Formolo CA, Williams R, Gordish-Dressman
H, MacDonald TJ, Lee NH and Hathout Y: Secretome signature of
invasive glioblastoma multiforme. J Proteome Res. 10:3149–3159.
2011. View Article : Google Scholar : PubMed/NCBI
|
|
56
|
Glazer CA, Smith IM, Ochs MF, Begum S,
Westra W, Chang SS, Sun W, Bhan S, Khan Z, Ahrendt S, et al:
Integrative discovery of epigenetically derepressed cancer testis
antigens in NSCLC. PLoS One. 4:e81892009. View Article : Google Scholar : PubMed/NCBI
|
|
57
|
Shao C, Tan M, Bishop JA, Liu J, Bai W,
Gaykalova DA, Ogawa T, Vikani AR, Agrawal Y, Li RJ, et al:
Suprabasin is hypomethylated and associated with metastasis in
salivary adenoid cystic carcinoma. PLoS One. 7:e485822012.
View Article : Google Scholar : PubMed/NCBI
|
|
58
|
Zhu J, Wu G, Li Q, Gong H, Song J, Cao L,
Wu S, Song L and Jiang L: Overexpression of suprabasin is
associated with proliferation and tumorigenicity of esophageal
squamous cell carcinoma. Sci Rep. 6:215492016. View Article : Google Scholar : PubMed/NCBI
|
|
59
|
Boumahdi S, Driessens G, Lapouge G, Rorive
S, Nassar D, Le Mercier M, Delatte B, Caauwe A, Lenglez S, Nkusi E,
et al: SOX2 controls tumour initiation and cancer stem-cell
functions in squamous-cell carcinoma. Nature. 511:246–250. 2014.
View Article : Google Scholar : PubMed/NCBI
|
|
60
|
Bass AJ, Watanabe H, Mermel CH, Yu S,
Perner S, Verhaak RG, Kim SY, Wardwell L, Tamayo P, Gat-Viks I, et
al: SOX2 is an amplified lineage-survival oncogene in lung and
esophageal squamous cell carcinomas. Nat Genet. 41:1238–1242. 2009.
View Article : Google Scholar : PubMed/NCBI
|
|
61
|
Leis O, Eguiara A, Lopez-Arribillaga E,
Alberdi MJ, Hernandez-Garcia S, Elorriaga K, Pandiella A, Rezola R
and Martin AG: Sox2 expression in breast tumours and activation in
breast cancer stem cells. Oncogene. 31:1354–1365. 2012. View Article : Google Scholar : PubMed/NCBI
|
|
62
|
Elms P, Siggers P, Napper D, Greenfield A
and Arkell R: Zic2 is required for neural crest formation and
hindbrain patterning during mouse development. Dev Biol.
264:391–406. 2003. View Article : Google Scholar : PubMed/NCBI
|
|
63
|
Chan DW, Liu VW, Leung LY, Yao KM, Chan
KK, Cheung AN and Ngan HY: Zic2 synergistically enhances Hedgehog
signalling through nuclear retention of Gli1 in cervical cancer
cells. J Pathol. 225:525–534. 2011. View Article : Google Scholar : PubMed/NCBI
|
|
64
|
Marchini S, Poynor E, Barakat RR, Clivio
L, Cinquini M, Fruscio R, Porcu L, Bussani C, D'Incalci M, Erba E,
et al: The zinc finger gene ZIC2 has features of an oncogene and
its overexpression correlates strongly with the clinical course of
epithelial ovarian cancer. Clin Cancer Res. 18:4313–4324. 2012.
View Article : Google Scholar : PubMed/NCBI
|
|
65
|
Zhu P, Wang Y, He L, Huang G, Du Y, Zhang
G, Yan X, Xia P, Ye B, Wang S, et al: ZIC2-dependent OCT4
activation drives self-renewal of human liver cancer stem cells. J
Clin Invest. 125:3795–3808. 2015. View Article : Google Scholar : PubMed/NCBI
|
|
66
|
Smith VJ: Phylogeny of whey acidic protein
(WAP) four-disulfide core proteins and their role in lower
vertebrates and invertebrates. Biochem Soc Trans. 39:1403–1408.
2011. View Article : Google Scholar : PubMed/NCBI
|
|
67
|
Chen Y, Mu X, Wang S, Zhao L, Wu Y, Li J
and Li M: WAP four-disulfide core domain protein 2 mediates the
proliferation of human ovarian cancer cells through the regulation
of growth- and apoptosis-associated genes. Oncol Rep. 29:288–296.
2013. View Article : Google Scholar : PubMed/NCBI
|
|
68
|
Wang J, Zhang C, He W and Gou X:
Construction and comprehensive analysis of dysregulated long
non-coding RNA-associated competing endogenous RNA network in clear
cell renal cell carcinoma. J Cell Biochem. 120:2576–2593. 2018.
View Article : Google Scholar
|
|
69
|
Liu T, Sui J, Zhang Y, Zhang XM, Wu WJ,
Yang S, Xu SY, Hong WW, Peng H, Yin LH, et al: Comprehensive
analysis of a novel lncRNA profile reveals potential prognostic
biomarkers in clear cell renal cell carcinoma. Oncol Rep.
40:1503–1514. 2018.PubMed/NCBI
|
|
70
|
Su H, Sun T, Wang H, Shi G, Zhang H, Sun F
and Ye D: Decreased TCL6 expression is associated with poor
prognosis in patients with clear cell renal cell carcinoma.
Oncotarget. 8:5789–5799. 2017. View Article : Google Scholar : PubMed/NCBI
|
|
71
|
Jiang W, Guo Q, Wang C and Zhu Y: A
nomogram based on 9-lncRNAs signature for improving prognostic
prediction of clear cell renal cell carcinoma. Cancer Cell Int.
19:208. 2019. View Article : Google Scholar : PubMed/NCBI
|
|
72
|
Wang Y, Yang F and Zhuang Y:
Identification of a progression-associated long non-coding RNA
signature for predicting the prognosis of lung squamous cell
carcinoma. Exp Ther Med. 15:1185–1192. 2018.PubMed/NCBI
|
|
73
|
Zhang Y, Zhang X, Zhu H, Liu Y, Cao J, Li
D, Ding B, Yan W, Jin H and Wang S: Identification of Potential
prognostic long non-coding RNA biomarkers for predicting recurrence
in patients with cervical cancer. Cancer Manag Res. 12:719–730.
2020. View Article : Google Scholar : PubMed/NCBI
|
|
74
|
Yan J, Huang X, Zhang X, Chen Z, Ye C,
Xiang W and Huang Z: LncRNA LINC00470 promotes the degradation of
PTEN mRNA to facilitate malignant behavior in gastric cancer cells.
Biochem Biophys Res Commun. 521:887–893. 2020. View Article : Google Scholar : PubMed/NCBI
|
|
75
|
Sui J, Li YH, Zhang YQ, Li CY, Shen X, Yao
WZ, Peng H, Hong WW, Yin LH, Pu YP, et al: Integrated analysis of
long non-coding RNA-associated ceRNA network reveals potential
lncRNA biomarkers in human lung adenocarcinoma. Int J Oncol.
49:2023–2036. 2016. View Article : Google Scholar : PubMed/NCBI
|
|
76
|
Luo Q, Cui M, Deng Q and Liu J:
Comprehensive analysis of differentially expressed profiles and
reconstruction of a competing endogenous RNA network in papillary
renal cell carcinoma. Mol Med Rep. 19:4685–4696. 2019.PubMed/NCBI
|