Introduction
Glioma is the most common and most malignant tumor
type in the brain and accounts for ~80% of primary malignant brain
tumors (1). Currently, the treatment
of glioma primarily comprises surgical resection combined with
postoperative radiotherapy and chemotherapy (2). However, the median overall survival
time is 14 months and the 5-year survival rate of patients with
glioma is <10%, which is not satisfactory (3). Previous studies have reported that
glioma is caused by genetic alterations and genetic accumulations
(4,5). Moreover, the malignant process of
glioma is regulated by a complex gene network comprising of genes,
such as p53 and pTEN (6). Therefore,
it is essential to identify molecules that may serve a key role in
the regulation of the malignant process of glioma.
Stanniocalcin 1 (STC1) is a glycoprotein originally
identified in 1996, and is reported to influence the homeostasis of
calcium and phosphate (7).
Furthermore, STC1 is expressed in several tissue types, including
the brain, thymus, spleen, colon and ovaries, and regulates
numerous physiological and pathological functions, such as hypoxia,
tumorigenesis, angiogenesis and cell proliferation (6,8,9). In addition, STC1 can be secreted into
the peripheral blood or body fluid by cells (10). Several studies have reported that
circulating STC1 can be used as a promising serum candidate
biomarker for tracking the progression of several diseases
(11–13). It has also been revealed that the
expression of STC1 is significantly correlated with TNM stage in
patients with clear cell renal carcinoma (9). Moreover, STC1 is upregulated in ovarian
cancer tissue, and may influence ovarian tumorigenesis (12). STC1 expression has been previously
detected in a small patient cohort that contained 60 glioma
tissues, and it was reported that STC1 is upregulated as glioma
grade increases and is correlated with the prognosis of patients
with glioma (14). Furthermore,
overexpression of STC1 in U87 and LN-229 cells can enhance
stem-like traits via regulating Neurogenic locus notch homolog
protein 1 (NOTCH) signaling (15).
However, the oncogenic role of STC1 in glioma requires further
investigation.
The present study aimed to investigate the
expression pattern of STC1 in glioma and its association with
glioma grade, molecular subtypes and clinical prognosis. In
addition, Gene Ontology (GO) analysis was performed to understand
the potential oncogenic role of STC1 in glioma.
Materials and methods
Patient samples
This study was carried out on 80 glioma tissues that
were collected from the Department of Neurosurgery of Shenzhen
People's Hospital from April 2013 to July 2016 (Shenzen, China).
The patient cohort consisted of 51 females and 29 males with an
average age of 47.54 years old and an age range of 14–72 years old.
Patients were followed-up every 3 months for the first 2 years
post-surgery, every 6 months for the following 3 years and finally
every 12 months for the next 5 years. The primary end point was
overall survival time (OS). An additional 10 non-tumor tissues were
collected from patients with traumatic brain injury or hypertensive
intracerebral hemorrhage. The non-tumor group was comprised of 4
females and 6 males with an average age of 45.2 years old and an
age range of 33–68 years old. Sections of the tissues were used for
paraffin-embedding once the tumor samples were collected and others
were stored at −80°C for further analysis. None of the involved
patients received radiotherapy or chemotherapy prior to surgery.
The present study was approved by the Ethics Committee of Shenzhen
People's Hospital. All patients included in this study provided
signed informed consent.
Bioinformatics analysis
Normalized RNAseq data and corresponding clinical
material from The Cancer Genome Atlas (TCGA), Rembrandt datasets
and GSE16011 were all downloaded from Gliovis (http://gliovis.bioinfo.cnio.es/) (16). TCGA is a public database (http://cancergenome.nih.gov/) that includes 29 cancer
types, along with related gene expression and clinical information.
Rembrandt dataset (https://caintegrator.nci.nih.gov/rembrandt) is based
on 524 Affymetrix U133 2.0 plus microarrays and contained 228 GBM
samples and 143 lower grade glioma (WHO II–III) samples. GSE16011
is a public dataset that contains 276 glioma samples of all
histology and 8 control samples (17). GO analysis was also performed in the
platform of Gliovis. Through screening comparison, H-cluster
analysis was used to analyze the expression of differential
expressed genes (DEGS) and functional enrichment was studied by GO
analysis. In addition, mRNAseq 693 dataset consisting of 693 glioma
tissues with different grades (WHO I–IV) was downloaded from the
Chinese Glioma Genome Atlas (CGGA) (18). Low grade glioma (LGG) was defined as
WHO grade I–II and high grade glioma (HGG) was defined as WHO grade
III–IV according to the 2016 WHO classification of central nervous
system tumors (19). According to
the WHO 2016 criteria, adult diffuse glioma centers around
isocitrate dehydrogenase (IDH) (19). Molecular subtypes in public datasets
were defined as described before (20).
Immunohistochemical (IHC)
staining
Paraffin-embedded glioma tissues and control brain
tissues were used for IHC analysis. Glioma tissues were dewaxed,
hydrated and incubated with 3% hydrogen peroxide for 10 min. The 4
mm thick sections were then washed three times with PBS for 5 min
each time. Slides were boiled in 0.01 M sodium citrate buffer
(pH=6.0) for 10 min using a microwave and then allowed to cool for
an additional 20 min. Subsequently, 1% BSA (Beijing Solarbio
Science & Technology Co., Ltd.) was used to block non-specific
staining at room temperature for 30 min. Sections were then
incubated with STC1 rabbit monoclonal antibody (1:1,000; cat. no.
20621-AP; ProteinTech Group, Inc.) overnight at 4°C. The next day,
sections were incubated with horseradish peroxidase (HRP)
conjugated-secondary antibody (1:10,000; cat. no. ANT020; Antgene,
Wuhan Antejie Biotechnology Co., Ltd.) for 1 h at room temperature.
Neutral resin was used to seal the slices which were left to dry
naturally. After staining, two experienced pathologists were
responsible for the evaluation of section staining under an
automatic microscope (Olympus BX51; Olympus Corporation), which was
performed independently. Images were taken under the microscope at
×200× and ×400 magnifications. If the two observers disagreed, a
third reader reviewed the images and the final score was given by
consensus. IHC score was calculated according to the positive rate
of cell staining (number of positively-stained cells per 100 cells)
and staining intensity. The staining positive rate was defined as
follows: <5%, 0 points; 5–25%, 1 point; 26–50%, 2 points; 51–75%
score, 3 points; and >75% score, 4 points. In addition, staining
intensity was scored manually as follows: 0 point, non-stained; 1
point, light yellow; 2 points, brown; and 3 points, dark brown.
Final quantization was obtained by multiplying the two scores. The
overall score was defined as: 0, negative; 1–4, weak; 5–8,
positive; and 9–12, strong. An IHC score ≤5 was defined as low STC1
expression and >5 points was defined as high STC1
expression.
RNA isolation and reverse
transcription-quantitative PCR (RT-qPCR)
TRIzol® reagent (Invitrogen; Thermo
Fisher Scientific, Inc.) was used to extract total RNA from glioma
tissues. PrimeScript RT reagent kit with gDNA Eraser (Takara Bio,
Inc.) was used to prepare cDNA and SYBR Green II mixture (Takara
Bio, Inc.) was used for RT-qPCR. The thermocycling conditions were
as follows: 95°C for 15 sec followed by 40 cycles of 60°C for 30
sec. GAPDH was used as the reference gene. All the operations were
performed according to the manufacturer's protocols. The specific
primer pairs used in this study were as follows: STC1 forward,
5′-ATCACATTCCAGCAGGCTTC-3′ and reverse, 5′-CCTGAAGCCATCACTGAGGT-3′;
and GAPDH forward, 5′-AACTAGACGATCACAGCGATGA-3′ and reverse,
5′-ACTATCGCAGACGGACTAC-3′. The quantification of relative
expression used 2−ΔΔCq method described previously
(21).
Statistical analysis
Continuous variables are presented as the mean ± SD.
Comparisons between the two groups were performed using independent
sample unpaired t-tests and one-way ANOVA with post hoc Tukey test
was used for comparing ≥3 groups. Kaplan-Meier with Log-Rank test
was used to analyze the association between STC1 expression and
survival time in patients with glioma; 50% of STC1 expression was
used as a cutoff point in Kaplan-Meier analysis. Correlation
analysis between STC1 expression and invasion-related markers was
performed using Pearson correlation. Comparisons of categorical
variables between the groups were performed using the Fishers exact
χ2 test. Univariate and multivariate regression analyses
were used to analyze the prognostic-related independent risk
factors. P<0.05 was considered to indicate a statistically
significant different. All statistical analysis and graphics
production were performed with SPSS v21 (IBM Corp.) and GraphPad
Prism 5.0 software (GraphPad Software, Inc.).
Results
Expression of STC1 in glioma
tissues
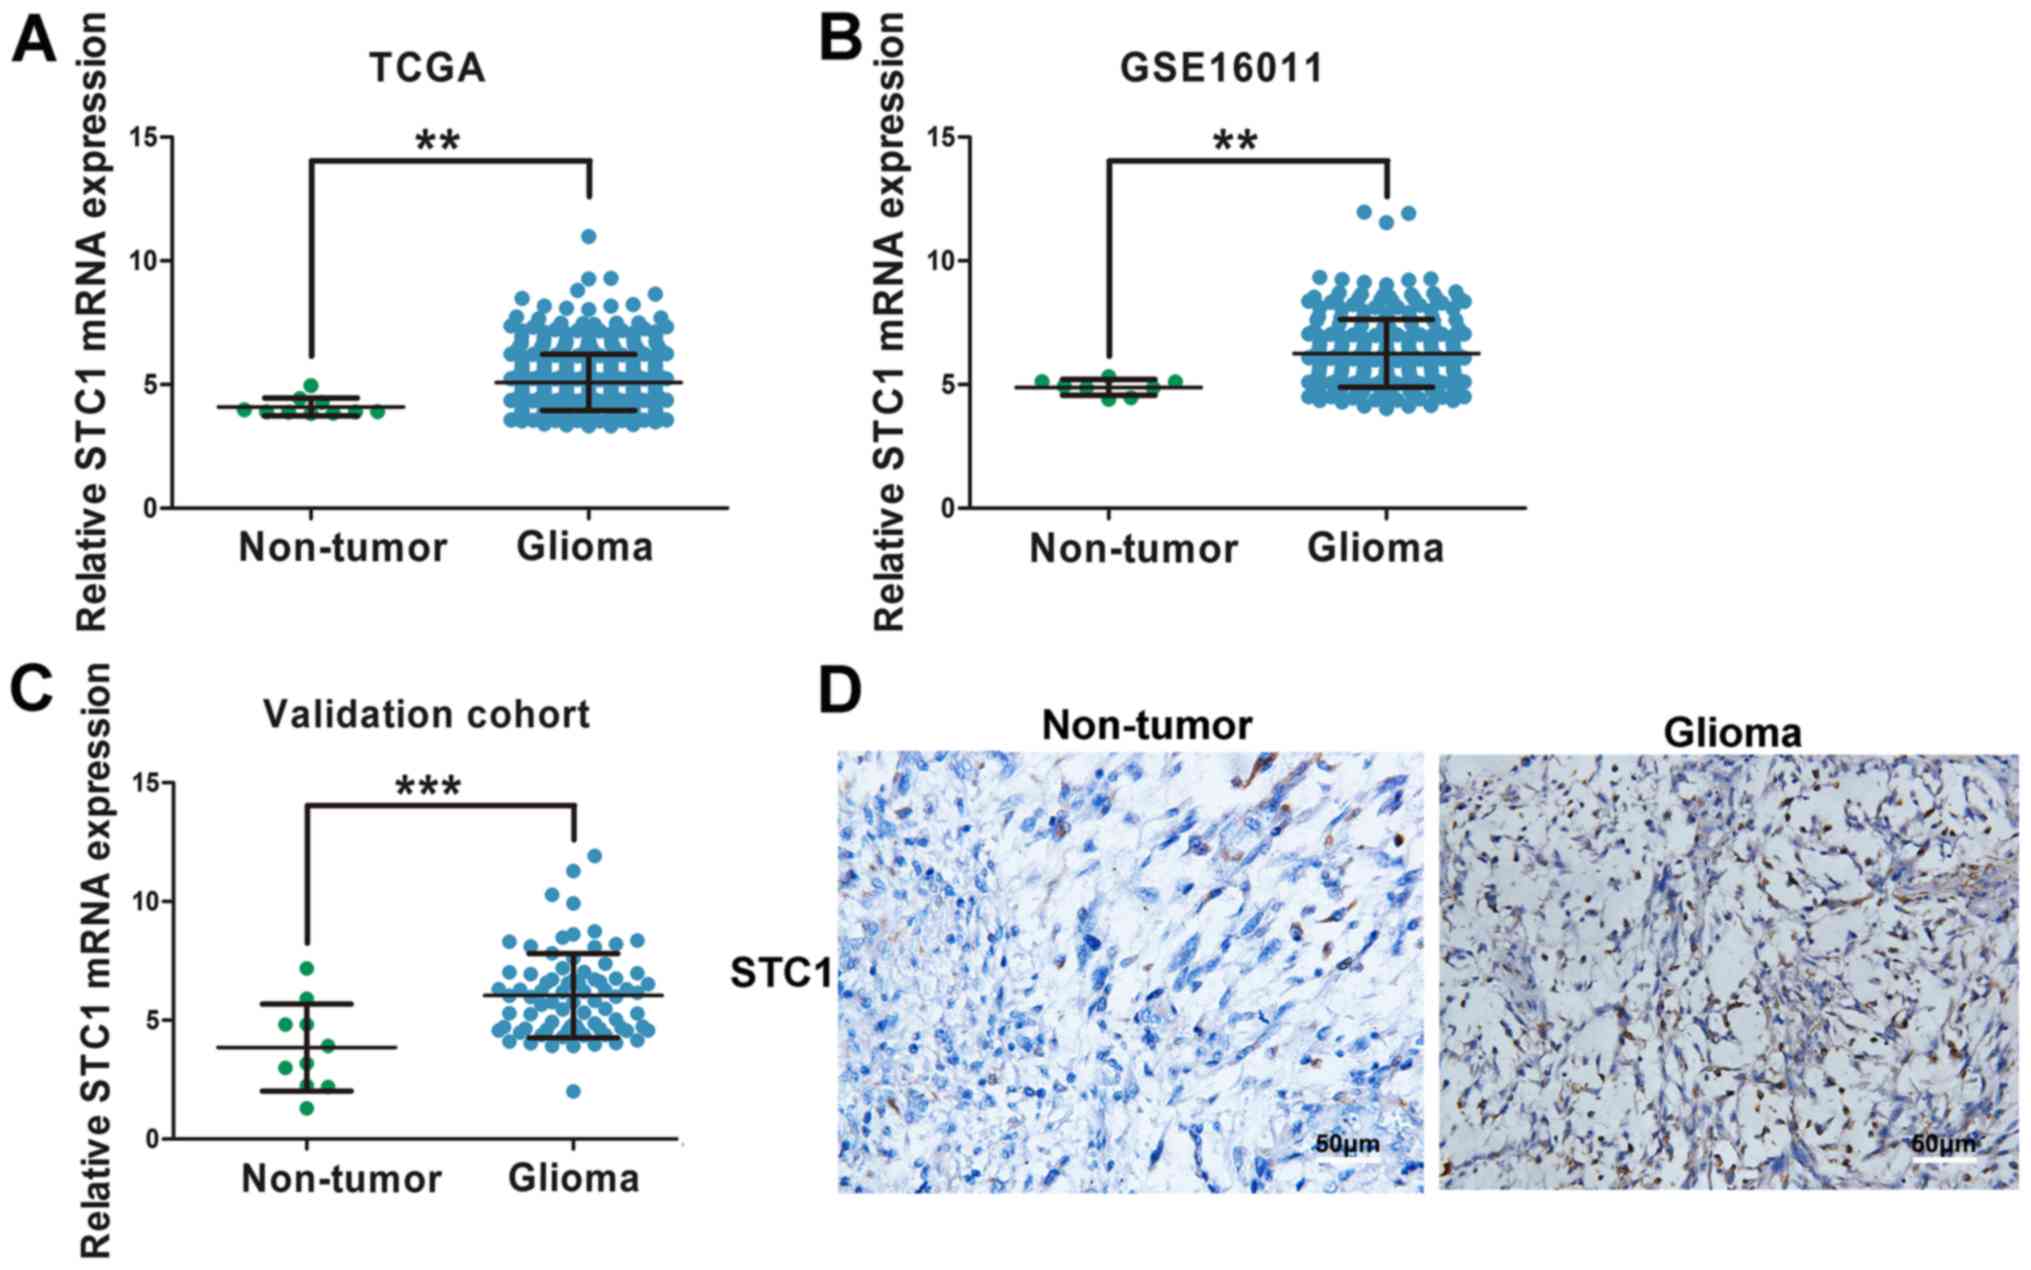
Normalized RNAseq gene expression from TCGA and
GSE16011 datasets was used to analyze STC1 expression in glioma
tissues. The results indicated that patients with glioma had higher
expression levels of STC1 compared with non-tumor tissues (Fig. 1A and B). In order to validate this
finding, RT-qPCR was performed on 80 glioma tissues and ten
non-tumor brain tissues. The baseline characteristics of patients
involved in the study are exhibited in Table I. It was demonstrated that STC1 mRNA
expression was significantly elevated in glioma tissues compared
with non-tumor tissues (Fig. 1C). In
addition, IHC staining was performed, and it was identified that
STC1 expression was higher in patients with glioma compared with
those without brain tumor (Fig.
1D).
 | Table I.Baseline information of patients
included in the study (n=80). |
Table I.
Baseline information of patients
included in the study (n=80).
| Baseline
information | Value |
|---|
| Mean age ± SD,
years | 47.54±12.30 |
| Sex, n |
|
|
Female | 51 |
|
Male | 29 |
| Tumor location,
n |
|
|
Supratentorial | 72 |
|
Subtentorial | 8 |
| WHO grade, n |
|
|
I–II | 34 |
|
III–IV | 46 |
| Mean follow-up
time, months | 14.58 |
Association between expression of STC1
and glioma grade
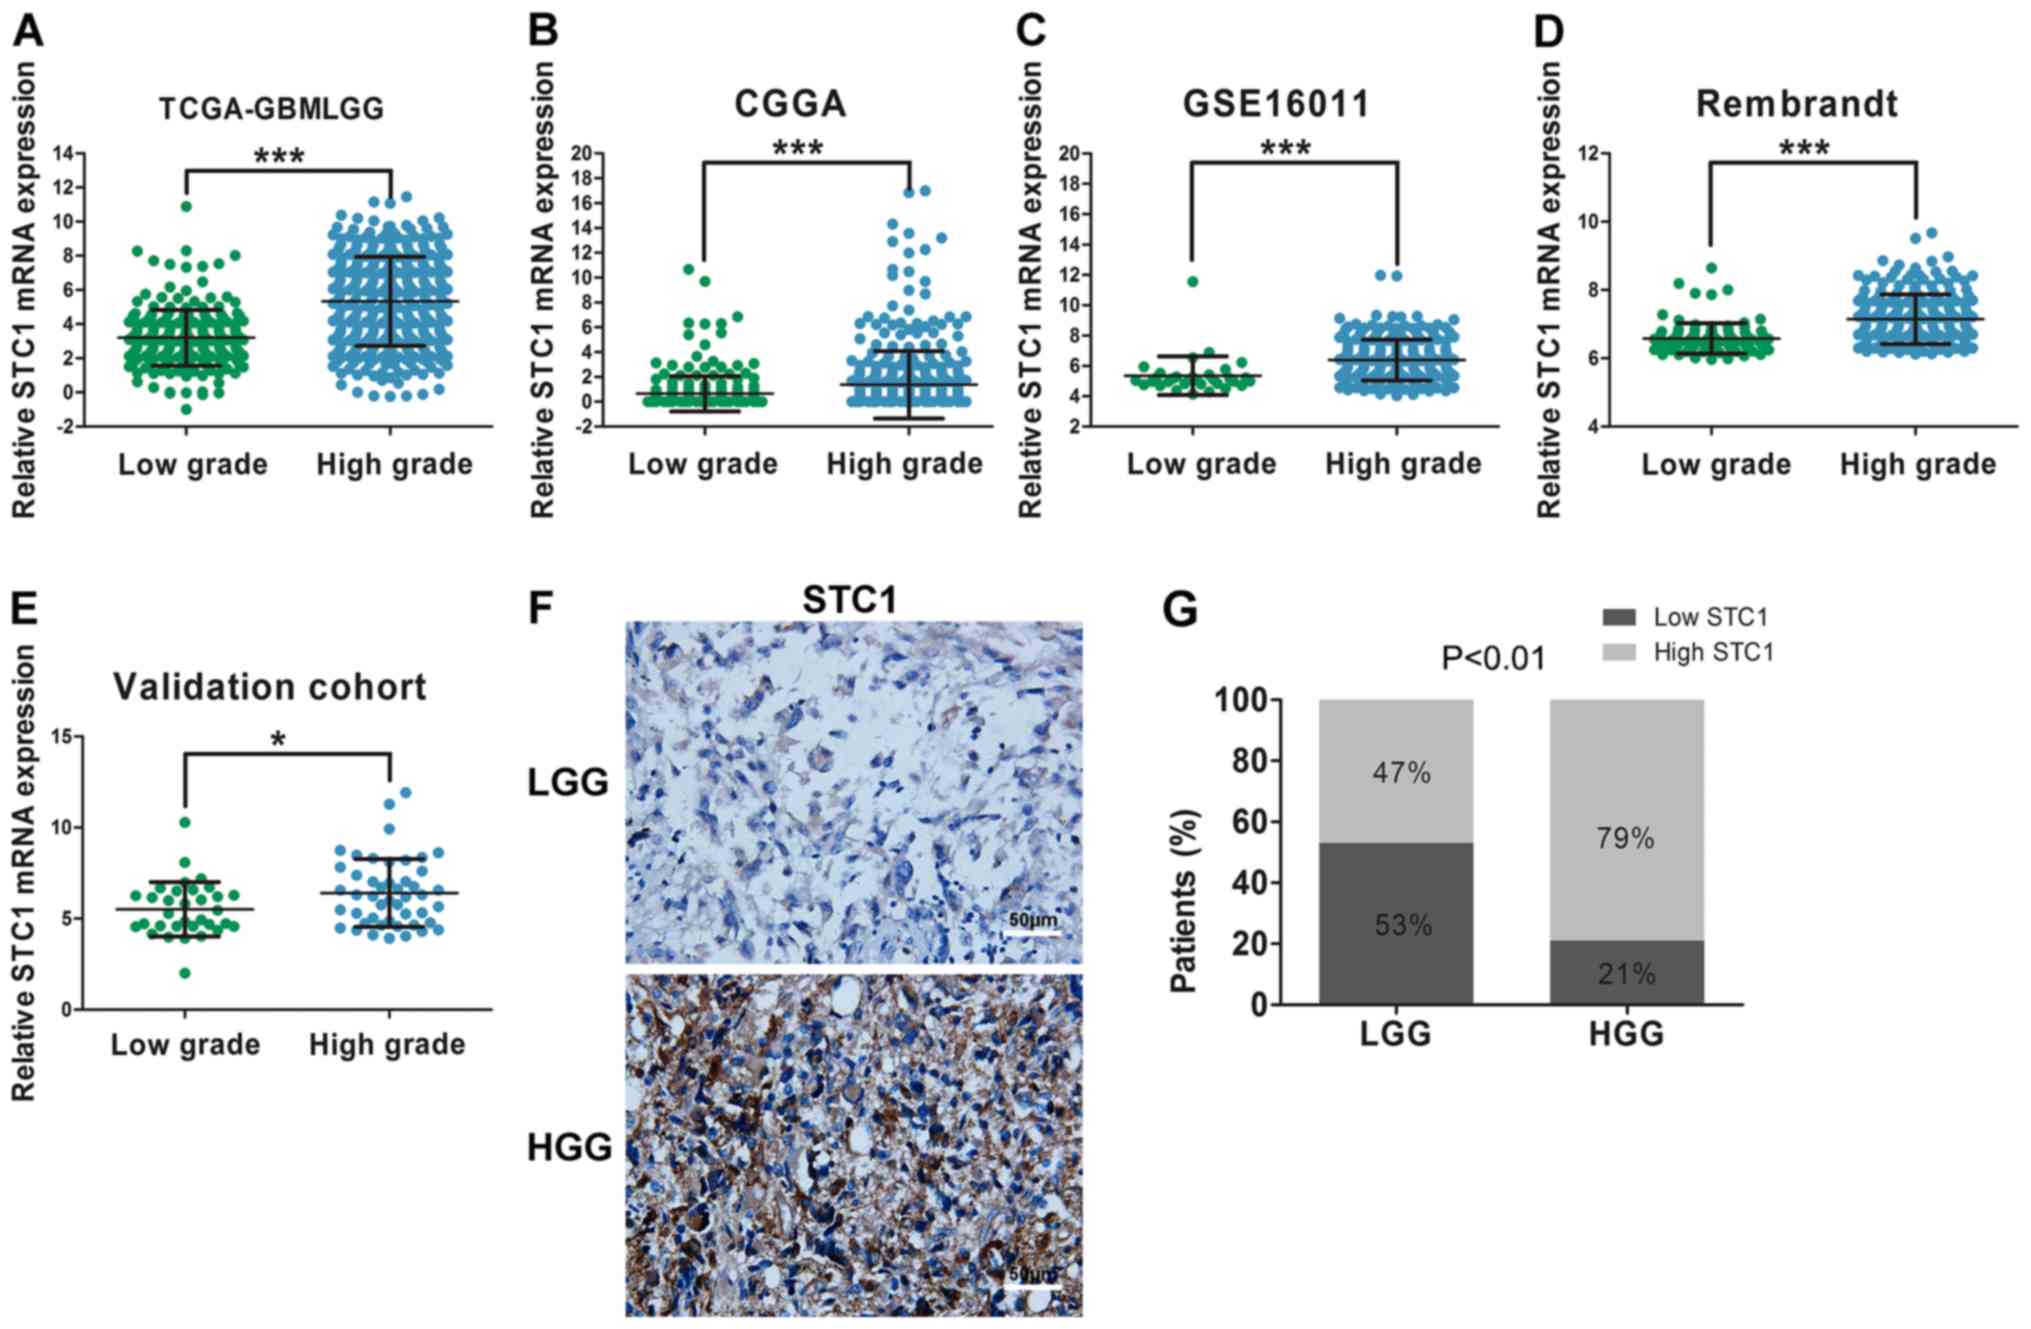
It was demonstrated that the malignancy of glioma
increased when the grade of tumor was increased The median overall
survival of patients with glioblastoma [World Health Organization
(WHO) IV] is 14 months and the 5-year survival rate is <5%
(22). In order to examine the
correlation between STC1 expression and tumor grade, data from the
four datasets, TCGA, CGGA, GSE16011 and Rembrandt, were used. The
results suggested that STC1 expression was elevated in patients
with HGG compared with patients with LGG throughout the four
datasets (Fig. 2A-D). Furthermore,
in the validation cohort, compared with patients with LGG, there
was an increased number of patients with high expression of STC1 in
the HGG group according to the results of RT-qPCR (Fig. 2E) and IHC staining score (Fig. 2F and G).
Association between STC1 expression
and glioma molecular subtypes
IDH status is an important molecular indicator for
the prognosis of patients with glioma (23). Furthermore, it has been reported that
the prognosis of patients with glioma with an IDH1 mutation is
significantly improved compared with patients with IDH1 wild-type
glioma. The results of the present study indicated that patients
with IDH1 wild-type had a higher expression of STC1 compared with
patients with the IDH1 mutation, according to TCGA, CGGA and
GSE16011 datasets (Fig. 3A-C). This
was not performed for the data obtained from the Rembrandt dataset
due to the absence of IDH1/2 status information.
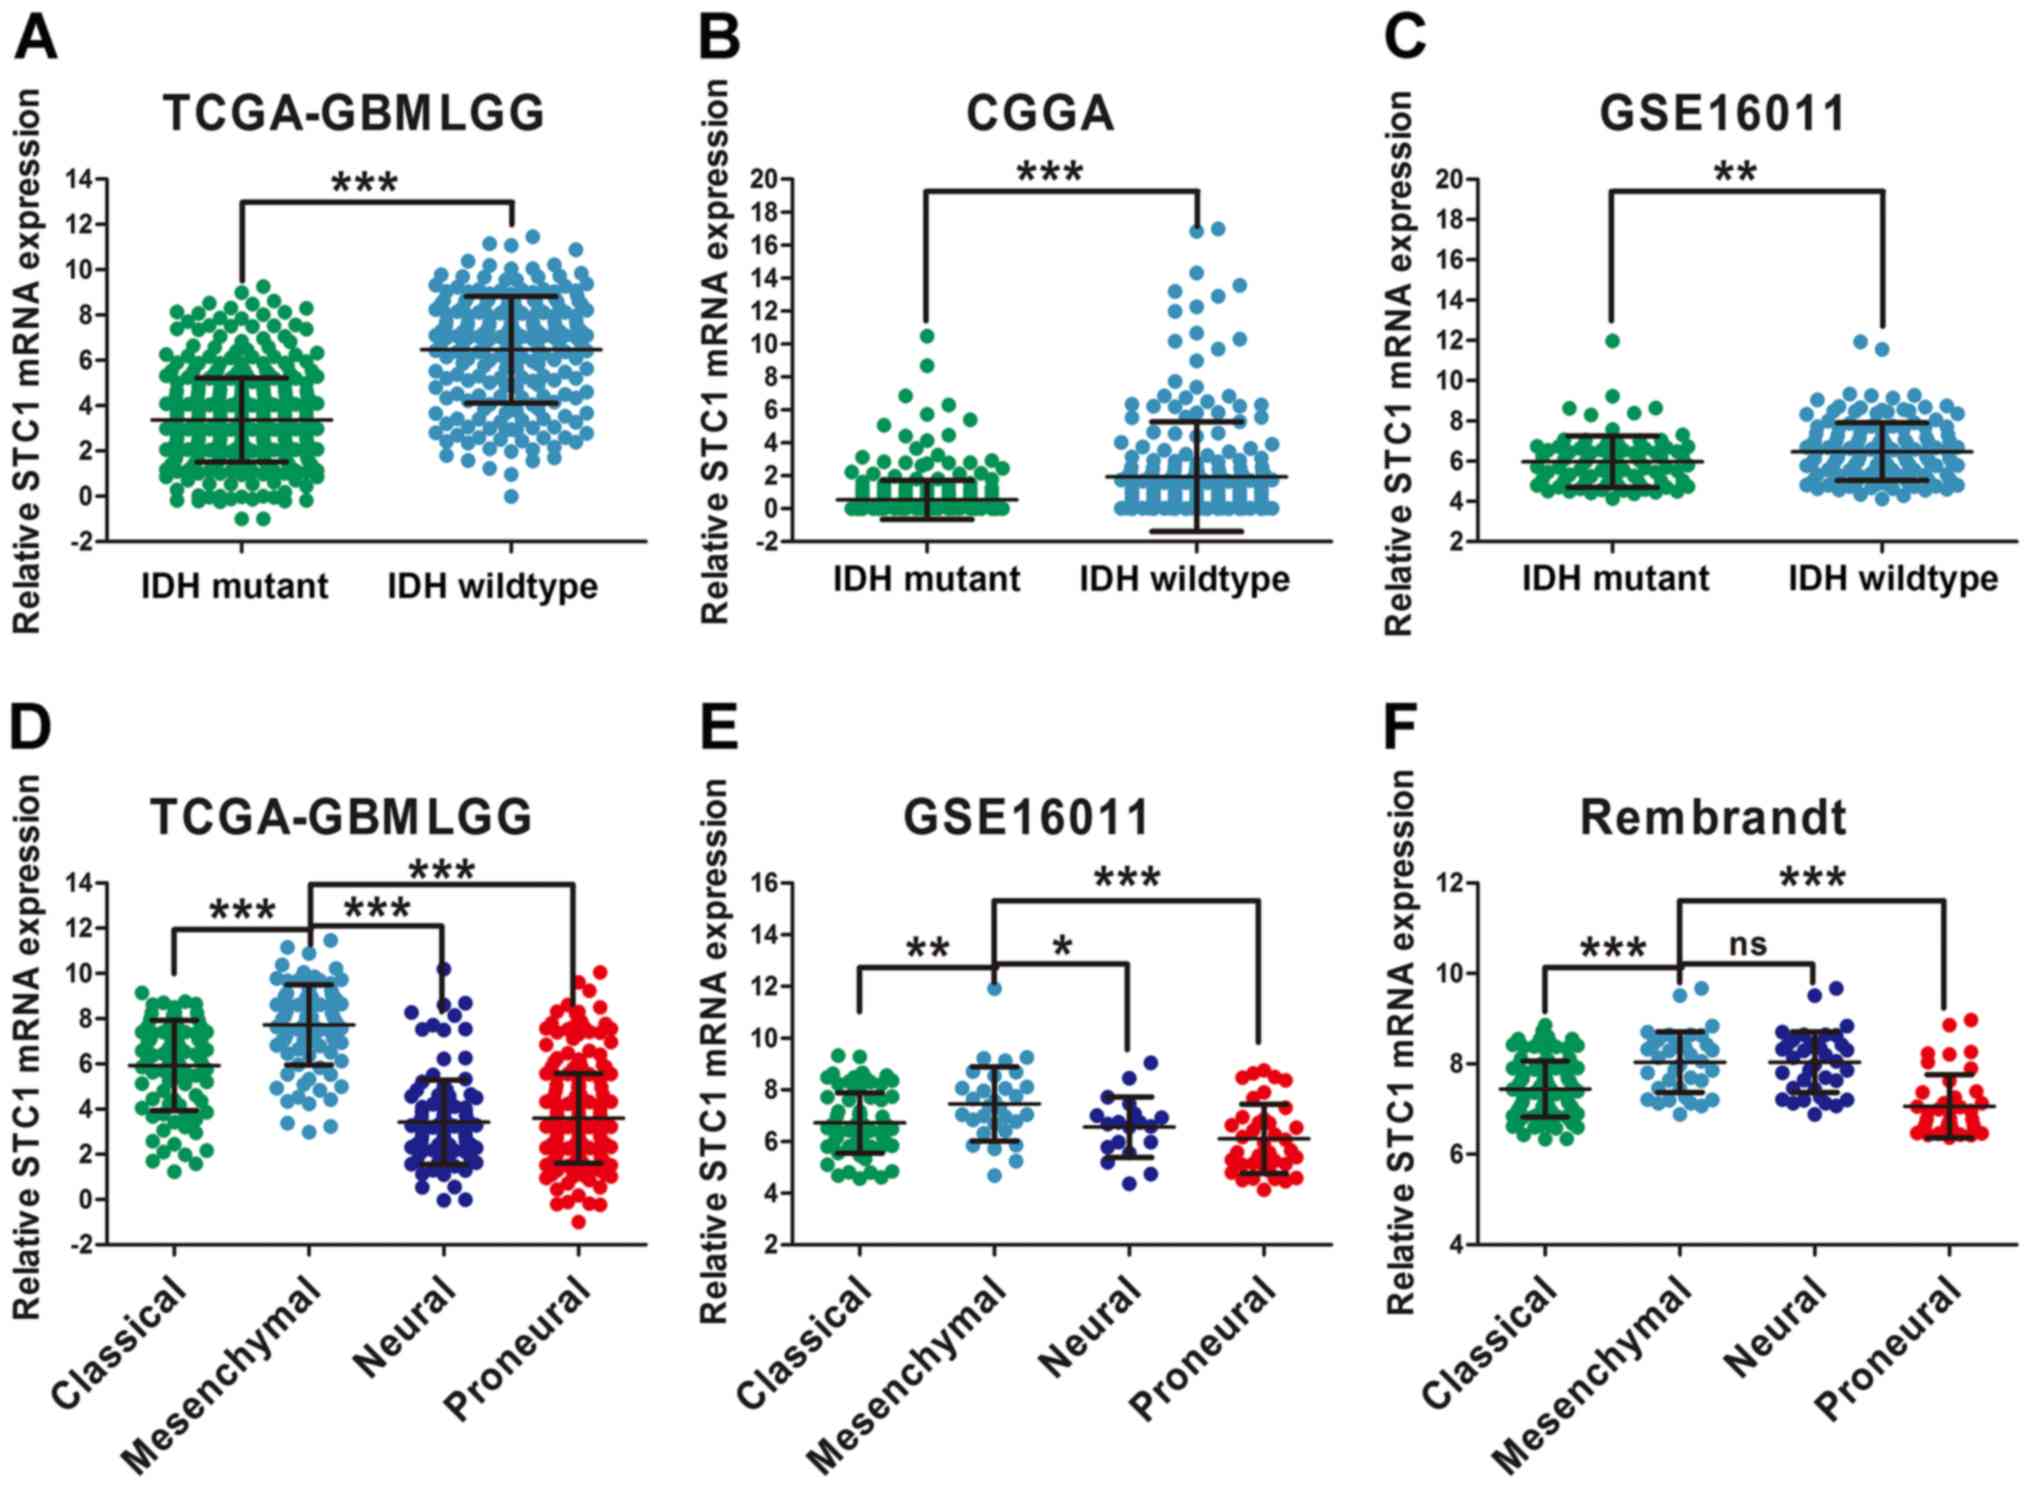 | Figure 3.STC1 expression is associated with
glioma molecular subtypes. Differential analysis of STC1 expression
in patients with glioma with different IDH status according to (A)
TCGA, (B) CGGA and (C) GSE16011 datasets. Expression of STC1 in
different glioma molecular subtypes according to (D) TCGA, (E)
GSE16011 and (F) Rembrandt datasets. *P<0.05, **P<0.01,
***P<0.001. ns, no significance; STC1, Stanniocalcin 1; TCGA,
The Cancer Genome Atlas; CGGA, Chinese Glioma Genome Atlas; IDH,
isocitrate dehydrogenase; GBMLGG, Glioblastoma and low grade
glioma. |
Moreover, differential expression among the four
molecular subtypes was examined, and were classified based on
transcriptome data (24,25). In Rembrandt, STC1 expression was
higher in the mesenchymal subtype compared with the neural subtype,
but the difference was not significant (Fig. 3F). Furthermore, according to the TCGA
and GSE16011 datasets, STC1 expression was highly expressed in
mesenchymal glioma compared with other molecular subtypes (Fig. 3D and E), which has stronger invasive
ability and increases resistance to chemotherapy compared with
other subtypes (26).
Association between STC1 and prognosis
in patients with glioma
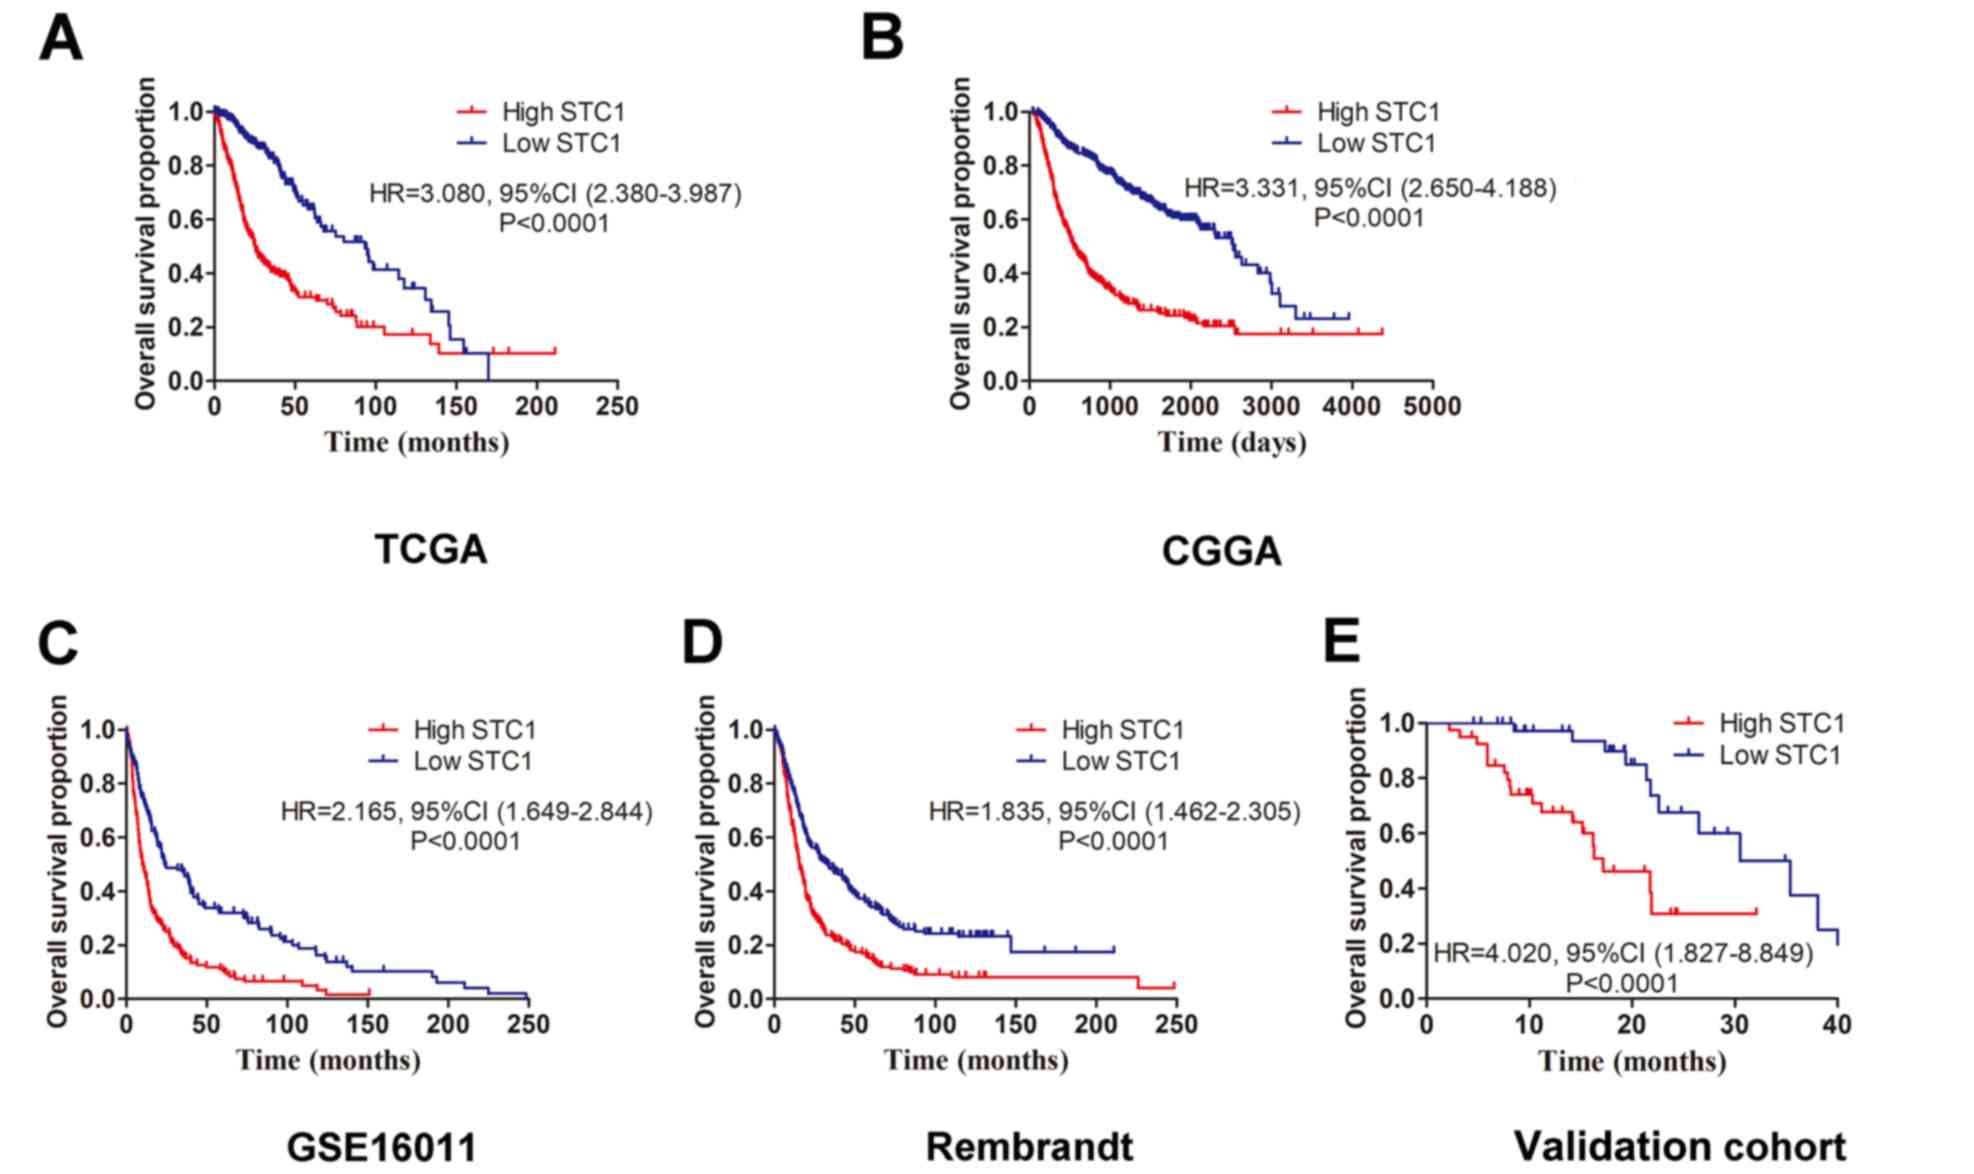
The four datasets (TCGA, CGGA, Rembrandt and
GSE16011) were used to investigate the prognostic role of STC1 in
patients with glioma. Kaplan-Meier survival analyses results
indicated that patients with high STC1 expression had a less
favorable clinical prognosis compared with patients with low STC1
expression in all four datasets (Fig.
4A-D), which was also identified in the validation cohort.
Furthermore, it was revealed that patients with glioma who
expressed low levels of STC1 had a longer survival time compared
with patients with high STC1 expression (Fig. 4E). To further determine the
prognostic value of STC1 expression, multivariate Cox regression
analysis was performed based on TCGA dataset. It was demonstrated
that STC1 expression was significantly associated with the
prognosis of patients with glioma via multivariate analysis [Hazard
ratio=0.52; P<0.001; Table
II].
| Table II.Univariate analysis and multivariate
Cox analysis of clinical prognostic parameters in The Cancer Genome
Atlas. |
Table II.
Univariate analysis and multivariate
Cox analysis of clinical prognostic parameters in The Cancer Genome
Atlas.
|
| Univariate cox
regression | Multivariate cox
regression |
|---|
|
|
|
|
|---|
| Variable | HR (95% CI) | P-value | HR (95% CI) | P-value |
|---|
| Age, years | 0.31
(0.23–0.41) | <0.001 | 1.10
(0.76–1.59) | 0.63 |
| ≥60 vs.
<60 |
|
|
|
|
| Sex | 1.14
(0.87–1.49) | 0.36 | – | – |
| Female
vs. male |
|
|
|
|
| WHO Grade | 0.18
(0.12–0.27) | <0.001 | 0.44
(0.29–0.68) | <0.001 |
| High
vs. low |
|
|
|
|
| Isocitrate
dehydrogenase 1 status | 0.10
(0.07–0.13) | <0.001 | 0.18
(0.12–0.27) | <0.001 |
|
Wild-type vs. mutant |
|
|
|
|
| MGMT promoter | 0.37
(0.28–0.50) | <0.001 | 0.99
(0.72–1.36) | 0.95 |
|
Unmethylated vs.
methylated |
|
|
|
|
| Molecular
subtype | 0.22
(0.17–0.30) | <0.001 | 0.57
(0.41–0.80) | 0.001 |
| ME vs.
others |
|
|
|
|
| Stanniocalcin 1
expression | 0.20
(0.15–0.26) | <0.001 | 0.52
(0.38–0.71) | <0.001 |
| High
vs. low |
|
|
|
|
Role of STC1 in extracellular
structure organization
According to mRNA sequencing in TCGA database, the
expression of STC1 was divided into high and low groups to perform
Gene Ontology analysis; the cut-off was 50% of STC1 expression. The
results demonstrated that STC1 primarily enriched ‘extracellular
matrix organization’ and ‘extracellular structure organization’,
which indicates that STC1 may be closely associated with the
migratory and invasive abilities of glioma (Fig. 5A). Only the results of biological
function were presented to illustrate its potential oncogenic role
in the present study.
To investigate the Gene Ontology results,
association analysis between STC1 expression and various
invasive-related protein expression was performed. It was found
that STC1 expression was significantly associated with that of
matrix metalloproteinase 2 (MMP2), MMP9, vimentin and Snail1 in
TCGA database (P<0.0001; Fig.
5B-E).
Discussion
STC1 is a glycoprotein associated with calcium and
phosphorus metabolism, but has rarely been studied in neurological
diseases (27). Moreover, it was
demonstrated that STC1 expression was significantly associated with
malignancy, tumor grade, IDH status and subtype, in patients with
glioma. Kaplan-Meier survival analyses also identified that
patients with high STC1 expression levels had a less favorable
clinical prognosis compared with patients with low STC1 expression,
in both in silico analysis and cohort validation.
Furthermore, biological process results of Gene Ontology analysis
revealed that STC1 was primarily involved in ‘extracellular
structure organization’. It was also identified that STC1
expression in glioma was significantly correlated with MMP2, MMP9,
vimentin and Snail1. Therefore, it was hypothesized that STC1 may
represent a biomarker and therapeutic target in glioma.
A previous study reported that STC1 expression is
elevated in lung adenocarcinoma and is positively correlated with
tumor stage, using bioinformatics analysis and IHC staining
validation (28). Moreover, STC1 is
increased in patients with late recurrence breast cancer compared
with patients with early recurrence, and its secretory form is
associated with tumor size and disease-free survival (13,29).
Although STC1 has been widely studied in several cancer types, to
the best of our knowledge, there are few studies on its effects in
neurological diseases, especially glioma. In the present study, it
was found that STC1 was upregulated in glioma tissues and its
expression was enhanced as tumor grade increased, which indicates
that STC1 may be an oncogene in glioma; which is in line with the
previous reports (14,15). Furthermore, elevated expression of
STC1 is closely associated with the poor prognosis of patients with
malignant tumors, such as gastric cancer (30), hepatocellular carcinoma (31) and esophageal squamous cell carcinoma
(32).
It has been reported that STC1 may be a
neuroprotectant in neurological diseases, and knockdown of STC1
expression in Amyloid β-treated human brain microvascular
endothelial cells (HBMECs) increases the invasion of monocytes and
apoptosis of HBMECs (33). However,
further research is required to investigate the role of STC1 in
cerebrovascular diseases. Using an ischemic mouse model, Durukan
et al (34) revealed that
STC1 was elevated under hypoxic condition and it was proven that
STC1 was dispensable for functional recovery after ischemic stroke.
Moreover, hypoxic conditions can induce the expression of STC1, and
high expression of STC1 can enhance neuronal resistance to hypoxia
(35). It has been demonstrated that
hypoxic microenvironments are common in glioma tissues (35). In glioblastoma, tumor tissue hypoxia
is an important indicator of malignancy of the tumor; the larger
the hypoxic area, the higher the malignancy (35). Furthermore, a hypoxic environment can
accelerate the proliferation, migration and invasiveness of tumor
cells, and promote the malignant progression of glioma (36). Therefore, it was hypothesized that
STC1 may regulated the malignant progression of glioma. To the best
of our knowledge, the present study was the first to demonstrate
that STC1 expression is elevated in glioma tissues compared with
non-tumor brain tissues. In addition, the present results suggested
that STC1 expression was significantly correlated with malignancy,
as shown by tumor grade, IDH status and subtypes, of glioma, in
both in silico analysis and in the validation cohort.
Collectively, the present results indicated the potential oncogenic
role of STC1 in the progression of glioma. Furthermore, higher
expression of STC1 in glioma tissues was associated with poorer
prognosis of overall survival, which demonstrated that STC1 may be
a biomarker in patients with glioma.
STC1 has been reported to serve as an oncogene. For
example, Li et al (15)
reported that STC1 expression is upregulated in glioma stem cells,
and it directly binds NOTCH1, which subsequently mediates the
stem-like traits of glioma cells. Moreover, hypoxia induces the
expression of STC1 in the tumor microenvironment, thus indicating
that STC1 may be a crucial factor mediating cancer metastasis and
chemoresistance (37). In addition,
Wang et al (30) revealed
that STC1 expression promotes gastric cancer cell proliferation,
migration and invasion under hypoxia. Furthermore, STC1 also
exhibits the ability to enhance tumor growth and reprogrammed
metabolism in hepatocellular carcinoma (13). A previous study has also reported
hypoxia as an invasion-promoting factor in glioma cells (38). In the present study, biological
process of Gene Ontology analysis results demonstrated that STC1
was mainly involved in the ‘extracellular matrix organization’,
which suggested that STC1 may be closely associated with the
migration and invasion abilities of glioma cells. It has been shown
that infiltration of glioma cells into surrounding non-tumor brain
tissue is an important process in promoting malignancy of the tumor
(38). Therefore, targeted
interventions to inhibit the invasion of glioma cells may represent
an important strategy for the treatment of glioma.
The present study had several limitations. The
present results suggest that STC1 expression is elevated in glioma
tissues compared with non-tumor brain tissues. While expression of
STC1 in non-tumor brain tissues may be partly attributable to the
effects of traumatic brain injury (TBI) or hypertensive
intracerebral haemorrhage, which was not controlled for in present
study. In addition, the sample size in the validation cohort was
small and a larger sample size is required for future validation.
Finally, only GO analysis was performed, future in vitro and
in vivo studies are required to validate the functional role
of STC1 in glioma.
In conclusion, STC1 expression was upregulated in
glioma tissues and was significantly associated with tumor grade
and molecular characteristics, in both in silico analysis
and cohort validation. Furthermore, it was demonstrated that
patients with higher STC1 expression had shorter overall survival
times compared with those with lower STC1 expression. Gene Ontology
results also suggested that STC1 may be a key regulator of
invasiveness in gliomas. Therefore, the present results indicated
that STC1 may represent a novel biomarker and a potential target
for the treatment of glioma.
Acknowledgements
Not applicable.
Funding
No funding was received.
Availability of data and materials
The datasets used and/or analyzed during the present
study are available from the corresponding author on reasonable
request.
Authors' contributions
WJL and DC designed the present study. WJL, DC and
HW acquired and analyzed the data. JLH and WJL drafted the initial
manuscript and made revisions for important intellectual content.
JLH also designed the study and was responsible for analysis and
interpretation of data. JLH agreed to be accountable for all
aspects of the work in ensuring that questions related to the
accuracy or integrity of any part of the work are appropriately
investigated and resolved. All authors read and approved the final
manuscript.
Ethics approval and consent to
participate
This study was approved by the Ethics Committee of
Shenzhen People's Hospital and informed consent of every patient
included was signed by their relatives.
Patient consent for publication
Not applicable.
Competing interests
The authors declare that they have no competing
interests.
References
|
1
|
Ostrom QT, Gittleman H, Truitt G, Boscia
A, Kruchko C and Barnholtz-Sloan JS: CBTRUS statistical report:
Primary brain and other central nervous system tumors diagnosed in
the United States in 2011–2015. Neuro Oncol. 20 (Suppl 4):iv1–iv86.
2018. View Article : Google Scholar : PubMed/NCBI
|
|
2
|
Albain KS, Swann RS, Rusch VW, Turrisi AT
III, Shepherd FA, Smith C, Chen Y, Livingston RB, Feins RH, Gandara
DR, et al: Radiotherapy plus chemotherapy with or without surgical
resection for stage III non-small-cell lung cancer: A phase III
randomised controlled trial. Lancet. 374:379–386. 2009. View Article : Google Scholar : PubMed/NCBI
|
|
3
|
Ostrom QT, Cote DJ, Ascha M, Kruchko C and
Barnholtz-Sloan JS: Adult glioma incidence and survival by race or
ethnicity in the United States from 2000 to 2014. JAMA Oncol.
4:1254–1262. 2018. View Article : Google Scholar : PubMed/NCBI
|
|
4
|
Bralten LB and French PJ: Genetic
alterations in glioma. Cancers (Basel). 3:1129–1140. 2011.
View Article : Google Scholar : PubMed/NCBI
|
|
5
|
Ohgaki H, Dessen P, Jourde B, Horstmann S,
Nishikawa T, Di Patre PL, Burkhard C, Schüler D, Probst-Hensch NM,
Maiorka PC, et al: Genetic pathways to glioblastoma: A
population-based study. Cancer Res. 64:6892–6899. 2004. View Article : Google Scholar : PubMed/NCBI
|
|
6
|
Zheng H, Ying H, Yan H, Kimmelman AC,
Hiller DJ, Chen AJ, Perry SR, Tonon G, Chu GC, Ding Z, et al: p53
and Pten control neural and glioma stem/progenitor cell renewal and
differentiation. Nature. 455:1129–1133. 2008. View Article : Google Scholar : PubMed/NCBI
|
|
7
|
Chou MY, Lin CH, Chao PL, Hung JC, Cruz SA
and Hwang PP: Stanniocalcin-1 controls ion regulation functions of
ion-transporting epithelium other than calcium balance. Int J Biol
Sci. 11:122–132. 2015. View Article : Google Scholar : PubMed/NCBI
|
|
8
|
Hayase S, Sasaki Y, Matsubara T, Seo D,
Miyakoshi M, Murata T, Ozaki T, Kakudo K, Kumamoto K, Ylaya K, et
al: Expression of stanniocalcin 1 in thyroid side population cells
and thyroid cancer cells. Thyroid. 25:425–436. 2015. View Article : Google Scholar : PubMed/NCBI
|
|
9
|
Zhou H, Li YY, Zhang WQ, Lin D, Zhang WM
and Dong WD: Expression of stanniocalcin-1 and stanniocalcin-2 in
laryngeal squamous cell carcinoma and correlations with clinical
and pathological parameters. PLoS One. 9:e954662014. View Article : Google Scholar : PubMed/NCBI
|
|
10
|
Song H, Xu B and Yi J: Clinical
significance of stanniocalcin-1 detected in peripheral blood and
bone marrow of esophageal squamous cell carcinoma patients. J Exp
Clin Cancer Res. 31:352012. View Article : Google Scholar : PubMed/NCBI
|
|
11
|
Du YZ, Gu XH, Li L and Gao F: The
diagnostic value of circulating stanniocalcin-1 mRNA in non-small
cell lung cancer. J Surg Oncol. 104:836–840. 2011. View Article : Google Scholar : PubMed/NCBI
|
|
12
|
Liu G, Yang G, Chang B, Mercado-Uribe I,
Huang M, Zheng J, Bast RC, Lin SH and Liu J: Stanniocalcin 1 and
ovarian tumorigenesis. J Natl Cancer Inst. 102:812–827. 2010.
View Article : Google Scholar : PubMed/NCBI
|
|
13
|
Chan KK, Leung CO, Wong CC, Ho DW, Chok
KS, Lai CL, Ng IO and Lo RC: Secretory stanniocalcin 1 promotes
metastasis of hepatocellular carcinoma through activation of JNK
signaling pathway. Cancer Lett. 403:330–338. 2017. View Article : Google Scholar : PubMed/NCBI
|
|
14
|
Su J, Guo B, Zhang T, Wang K, Li X and
Liang G: Stanniocalcin-1, a new biomarker of glioma progression, is
associated with prognosis of patients. Tumour Biol. 36:6333–6339.
2015. View Article : Google Scholar : PubMed/NCBI
|
|
15
|
Li Y, He ZC, Zhang XN, Liu Q, Chen C, Zhu
Z, Chen Q, Shi Y, Yao XH, Cui YH, et al: Stanniocalcin-1 augments
stem-like traits of glioblastoma cells through binding and
activating NOTCH1. Cancer Lett. 416:66–74. 2018. View Article : Google Scholar : PubMed/NCBI
|
|
16
|
Bowman RL, Wang Q, Carro A, Verhaak RG and
Squatrito M: GlioVis data portal for visualization and analysis of
brain tumor expression datasets. Neuro Oncol. 19:139–141. 2017.
View Article : Google Scholar : PubMed/NCBI
|
|
17
|
Gravendeel LA, Kouwenhoven MC, Gevaert O,
de Rooi JJ, Stubbs AP, Duijm JE, Daemen A, Bleeker FE, Bralten LB,
Kloosterhof NK, et al: Intrinsic gene expression profiles of
gliomas are a better predictor of survival than histology. Cancer
Res. 69:9065–9072. 2009. View Article : Google Scholar : PubMed/NCBI
|
|
18
|
Hu H, Mu Q, Bao Z, Chen Y, Liu Y, Chen J,
Wang K, Wang Z, Nam Y, Jiang B, et al: Mutational landscape of
secondary glioblastoma guides MET-targeted trial in brain tumor.
Cell. 175:1665–1678.e18. 2018. View Article : Google Scholar : PubMed/NCBI
|
|
19
|
Louis DN, Perry A, Reifenberger G, von
Deimling A, Figarella-Branger D, Cavenee WK, Ohgaki H, Wiestler OD,
Kleihues P and Ellison DW: The 2016 world health organization
classification of tumors of the central nervous system: A summary.
Acta Neuropathol. 131:803–820. 2016. View Article : Google Scholar : PubMed/NCBI
|
|
20
|
Verhaak RG, Hoadley KA, Purdom E, Wang V,
Qi Y, Wilkerson MD, Miller CR, Ding L, Golub T, Mesirov JP, et al:
Integrated genomic analysis identifies clinically relevant subtypes
of glioblastoma characterized by abnormalities in PDGFRA, IDH1,
EGFR, and NF1. Cancer Cell. 17:98–110. 2010. View Article : Google Scholar : PubMed/NCBI
|
|
21
|
Livak KJ and Schmittgen TD: Analysis of
relative gene expression data using real-time quantitative PCR and
the 2(-Delta Delta C(T)) method. Methods. 25:402–408. 2001.
View Article : Google Scholar : PubMed/NCBI
|
|
22
|
Stupp R, Mason WP, Van Den Bent MJ, Weller
M, Fisher B, Taphoorn MJ, Belanger K, Brandes AA, Marosi C, Bogdahn
U, et al: Radiotherapy plus concomitant and adjuvant temozolomide
for glioblastoma. N Engl J Med. 352:987–996. 2005. View Article : Google Scholar : PubMed/NCBI
|
|
23
|
Pekmezci M, Rice T, Molinaro AM, Walsh KM,
Decker PA, Hansen H, Sicotte H, Kollmeyer TM, McCoy LS, Sarkar G,
et al: Adult infiltrating gliomas with WHO 2016 integrated
diagnosis: Additional prognostic roles of ATRX and TERT. Acta
Neuropathol. 133:1001–1016. 2017. View Article : Google Scholar : PubMed/NCBI
|
|
24
|
Shen R, Mo Q, Schultz N, Seshan VE, Olshen
AB, Huse J, Ladanyi M and Sander C: Integrative subtype discovery
in glioblastoma using icluster. PLoS One. 7:e352362012. View Article : Google Scholar : PubMed/NCBI
|
|
25
|
Morokoff A, Ng W, Gogos A and Kaye AH:
Molecular subtypes, stem cells and heterogeneity: Implications for
personalised therapy in glioma. J Clin Neurosci. 22:1219–1226.
2015. View Article : Google Scholar : PubMed/NCBI
|
|
26
|
Ramirez YP, Weatherbee JL, Wheelhouse RT
and Ross AH: Glioblastoma multiforme therapy and mechanisms of
resistance. Pharmaceuticals (Basel). 6:1475–1506. 2013. View Article : Google Scholar : PubMed/NCBI
|
|
27
|
Kikuchi M, Nakano Y, Nambo Y, Haneda S,
Matsui M, Miyake Y, Macleod JN, Nagaoka K and Imakawa K: Production
of calcium maintenance factor stanniocalcin-1 (STC1) by the equine
endometrium during the early pregnant period. J Reprod Dev.
57:203–211. 2011. View Article : Google Scholar : PubMed/NCBI
|
|
28
|
Du YZ, Gu XH, Cheng SF, Li L, Liu H, Hu LP
and Gao F: The oncogenetic role of stanniocalcin 1 in lung
adenocarcinoma: A promising serum candidate biomarker for tracking
lung adenocarcinoma progression. Tumour Biol. 37:5633–5644. 2016.
View Article : Google Scholar : PubMed/NCBI
|
|
29
|
Brantley KD, Kjaersgaard A, Cronin-Fenton
D, Yacoub R, Nielsen AS, Lauridsen KL, Hamilton-Dutoit S and Lash
TL: Stanniocalcin expression as a predictor of late breast cancer
recurrence. Cancer Epidemiol Biomarkers Prev. 27:653–659. 2018.
View Article : Google Scholar : PubMed/NCBI
|
|
30
|
Wang Y, Qi Z, Zhou M, Yang W, Hu R, Li G,
Ma X and Zhang Z: Stanniocalcin1 promotes cell proliferation,
chemoresistance and metastasis in hypoxic gastric cancer cells via
Bcl2. Oncol Rep. 41:1998–2008. 2019.PubMed/NCBI
|
|
31
|
Leung CC and Wong CK: Effects of STC1
overexpression on tumorigenicity and metabolism of hepatocellular
carcinoma. Oncotarget. 9:6852–6861. 2018. View Article : Google Scholar : PubMed/NCBI
|
|
32
|
Shirakawa M, Fujiwara Y, Sugita Y, Moon
JH, Takiguchi S, Nakajima K, Miyata H, Yamasaki M, Mori M and Doki
Y: Assessment of stanniocalcin-1 as a prognostic marker in human
esophageal squamous cell carcinoma. Oncol Rep. 27:940–946. 2012.
View Article : Google Scholar : PubMed/NCBI
|
|
33
|
Li K, Dong D, Yao L, Dai D, Gu X and Guo
L: Identification of STC1 as an beta-amyloid activated gene in
human brain microvascular endothelial cells using cDNA microarray.
Biochem Biophys Res Commun. 376:399–403. 2008. View Article : Google Scholar : PubMed/NCBI
|
|
34
|
Durukan Tolvanen A, Westberg JA,
Serlachius M, Chang AC, Reddel RR, Andersson LC and Tatlisumak T:
Stanniocalcin 1 is important for poststroke functionality, but
dispensable for ischemic tolerance. Neuroscience. 229:49–54. 2013.
View Article : Google Scholar : PubMed/NCBI
|
|
35
|
Ito Y, Zemans R, Correll K, Yang IV, Ahmad
A, Gao B and Mason RJ: Stanniocalcin-1 is induced by hypoxia
inducible factor in rat alveolar epithelial cells. Biochem Biophys
Res Commun. 452:1091–1097. 2014. View Article : Google Scholar : PubMed/NCBI
|
|
36
|
Monteiro AR, Hill R, Pilkington GJ and
Madureira PA: The Role of Hypoxia in Glioblastoma Invasion. Cells.
6:E452017. View Article : Google Scholar : PubMed/NCBI
|
|
37
|
Yeung HY, Lai KP, Chan HY, Mak NK, Wagner
GF and Wong CK: Hypoxia-inducible factor-1-mediated activation of
stanniocalcin-1 in human cancer cells. Endocrinology.
146:4951–4960. 2005. View Article : Google Scholar : PubMed/NCBI
|
|
38
|
Jensen RL: Brain tumor hypoxia:
Tumorigenesis, angiogenesis, imaging, pseudoprogression, and as a
therapeutic target. J Neurooncol. 92:317–335. 2009. View Article : Google Scholar : PubMed/NCBI
|