Introduction
Breast-conserving surgery (BCS) for patients with
breast cancer is gaining popularity due to the comparable survival
outcomes of BCS and modified radical mastectomy (MRM) demonstrated
by several studies (1). Currently,
BCS accounts for ~60% of all breast cancer surgeries in the USA
compared with ~20% in China (2,3). The
most important aspect of BCS is complete resection of the lesion
area to ensure that the surgical margin is negative as a positive
surgical margin means a higher local recurrence rate. At present,
there is a lack of a rapid and accurate diagnostic methods for
breast cancer and pathological diagnosis is the most common method
used in clinical settings (4).
However, histopathological examination of paraffin sections is a
time- and resource-intensive procedure. In addition, it does not
meet the requirements of rapid diagnosis and may result in a higher
rate of secondary surgery (5).
Intraoperative frozen section pathology is relatively fast;
however, the diagnostic accuracy is limited due to the small amount
of obtained tissues (6). Thus, the
development of a rapid, convenient and accurate diagnostic method
is required to improve outcomes of BCS and to minimize the chances
of secondary surgery.
Raman spectra are generated by inelastic scattering
of photons on the surface of molecules. Each molecule has a set of
energy levels, and the scattered spectrum is dependent on the
energy transfer between the molecule and the photons. By analyzing
the relative strength and position of each characteristic peak in
the Raman scattering spectrum, the biochemical composition
information of the sample can be obtained (7). Raman spectroscopy is often used for the
detection and imaging of crystals (8,9). Raman
spectroscopy diagnosis at the molecular level offers the advantage
of possible detection of lesions prior to the development of overt
morphological changes; therefore, it may facilitate identification
of the tumor edge and help reduce the local recurrence rate
(10). Raman spectra can provide
molecular vibration and rotation information (11,12).
Raman spectroscopy is a simple, fast and sensitive method that can
directly analyze tissues without any preprocessing and offers the
potential for rapid diagnosis of pathological features of tissues
during surgery (13). Raman
spectroscopy is promising for clinical application and has become a
research hotspot for rapid diagnosis of breast tumors (14–17).
Raman spectroscopy identifies molecular vibrations and so allows
breast cancer tissue to be distinguished from surrounding normal
tissue using mathematical processing and computer modeling
(18). The majority of recent
studies have generated data based on random single-point detection
or targeted random-point detection (12,19).
Some researchers have used surface enhanced Raman spectroscopy and
other surface enhancement methods to enhance the signal to obtain
improved results (20).
For unprocessed fresh breast cancer tissues, the
heterogeneity of the biochemical components in the tissues and the
blindness of the detection location lead to the great difference in
the results of the Raman data in the detected tissues; it is
difficult to analyze such results and construct diagnostic models
(14,21), even with use of mathematical methods
such as linear regression, partial least squares and the artificial
neural network. During the test, a laser beam is emitted from the
microscope of the Raman instrument. Since the laser detection point
is very small, the beam may focus on the nucleus, the cytoplasm, an
organelle or the interstitium during the detection process, thus
not achieving the ideal result (21). The peak assignment and difference of
Raman spectra between cancer and normal tissues have been explored
and described by numerous studies (14,15,22,23).
Raman data of single-point detection may be used to identify benign
and malignant breast cancer; however, it can only provide chemical
information about the tissue. Since the obtained tissue often
contains a number of different components with similar spectral
characteristics, it is difficult to provide reliable information
about the tissue structure (15).
The Raman spectroscopy mapping method can provide information
pertaining to the chemical composition as well as information about
specific areas by helping identify specific areas of the tissue.
The analysis results obtained using mapping display the
morphological structure inside the tissue and the spatial
distribution of the relative content of biochemical components,
such as DNA and actin (24,25). Yu et al (25) successfully identified normal cells
and cancer cells by using Raman mapping spectra, which indicated
the feasibility of using the mapping technique for the detection of
breast cancer tissues.
Breast tissue is inherently heterogeneous. The
fingerprint characteristics of Raman spectra also enable the
analysis of Raman spectral data of breast cancer tissues to provide
in-depth information on the malignant transformation process of
breast tissues. Several research groups investigated the
effectiveness of Raman imaging in clinical diagnosis (13,24).
However, Raman spectroscopy has not been used to image breast
tissue. Our earlier studies showed that the single point detection
technique of Raman spectrum could distinguish normal breast tissue,
breast cancer tissue and benign breast tissue (15). However, due to the heterogeneity of
tissues and detection methods, the obtained data varied greatly and
showed poor regularity. In order to improve the stability of Raman
data obtained in the present study, Raman spectrum mapping
detection was used to minimize the influence of organizational
structure and human factors, for example slight movement of the
microscope lens after fixation, on the results. This technique was
used to construct a breast cancer diagnostic model to conduct
imaging analysis and create pseudocolor Raman maps. A map similar
to the pathological hematoxylin and eosin (H&E) images were
obtained, demonstrating the reliability of Raman spectroscopy
method for tissue imaging. The results of the present study may
inform future studies investigating real-time imaging of incisor
edge lesions.
Materials and methods
Patient information
A total of 45 breast cancer tissue specimens from
patients who underwent MRM or simple mastectomy at the First
Hospital of Jilin University (Changchun, China) between July 2015
and January 2016 were used in the present study. Of these, 22
tissue specimens were subjected to mapping and 23 were subjected to
random single-point Raman spectroscopy. A total of 25 samples of
adjacent normal breast tissues were also collected. Mapping and
random-single point detection was performed in 15 and 10 normal
breast specimens, respectively. All patients were female with a
median age of 52 years (age range, 32–63). The only inclusion
criterion for the present study was invasive breast cancer. The
exclusion criteria were patients who refused to participate in the
trial. Following further examination by preoperative biopsy and
postoperative pathology, the breast tissues were confirmed as
invasive ductal carcinoma; however, breast cancer stage was not
assessed). All patients agreed to participate in the study and
provided written informed consent. The study protocol was approved
by the Ethics Committee of the First Hospital of Jilin University
(approval no. 2013–168).
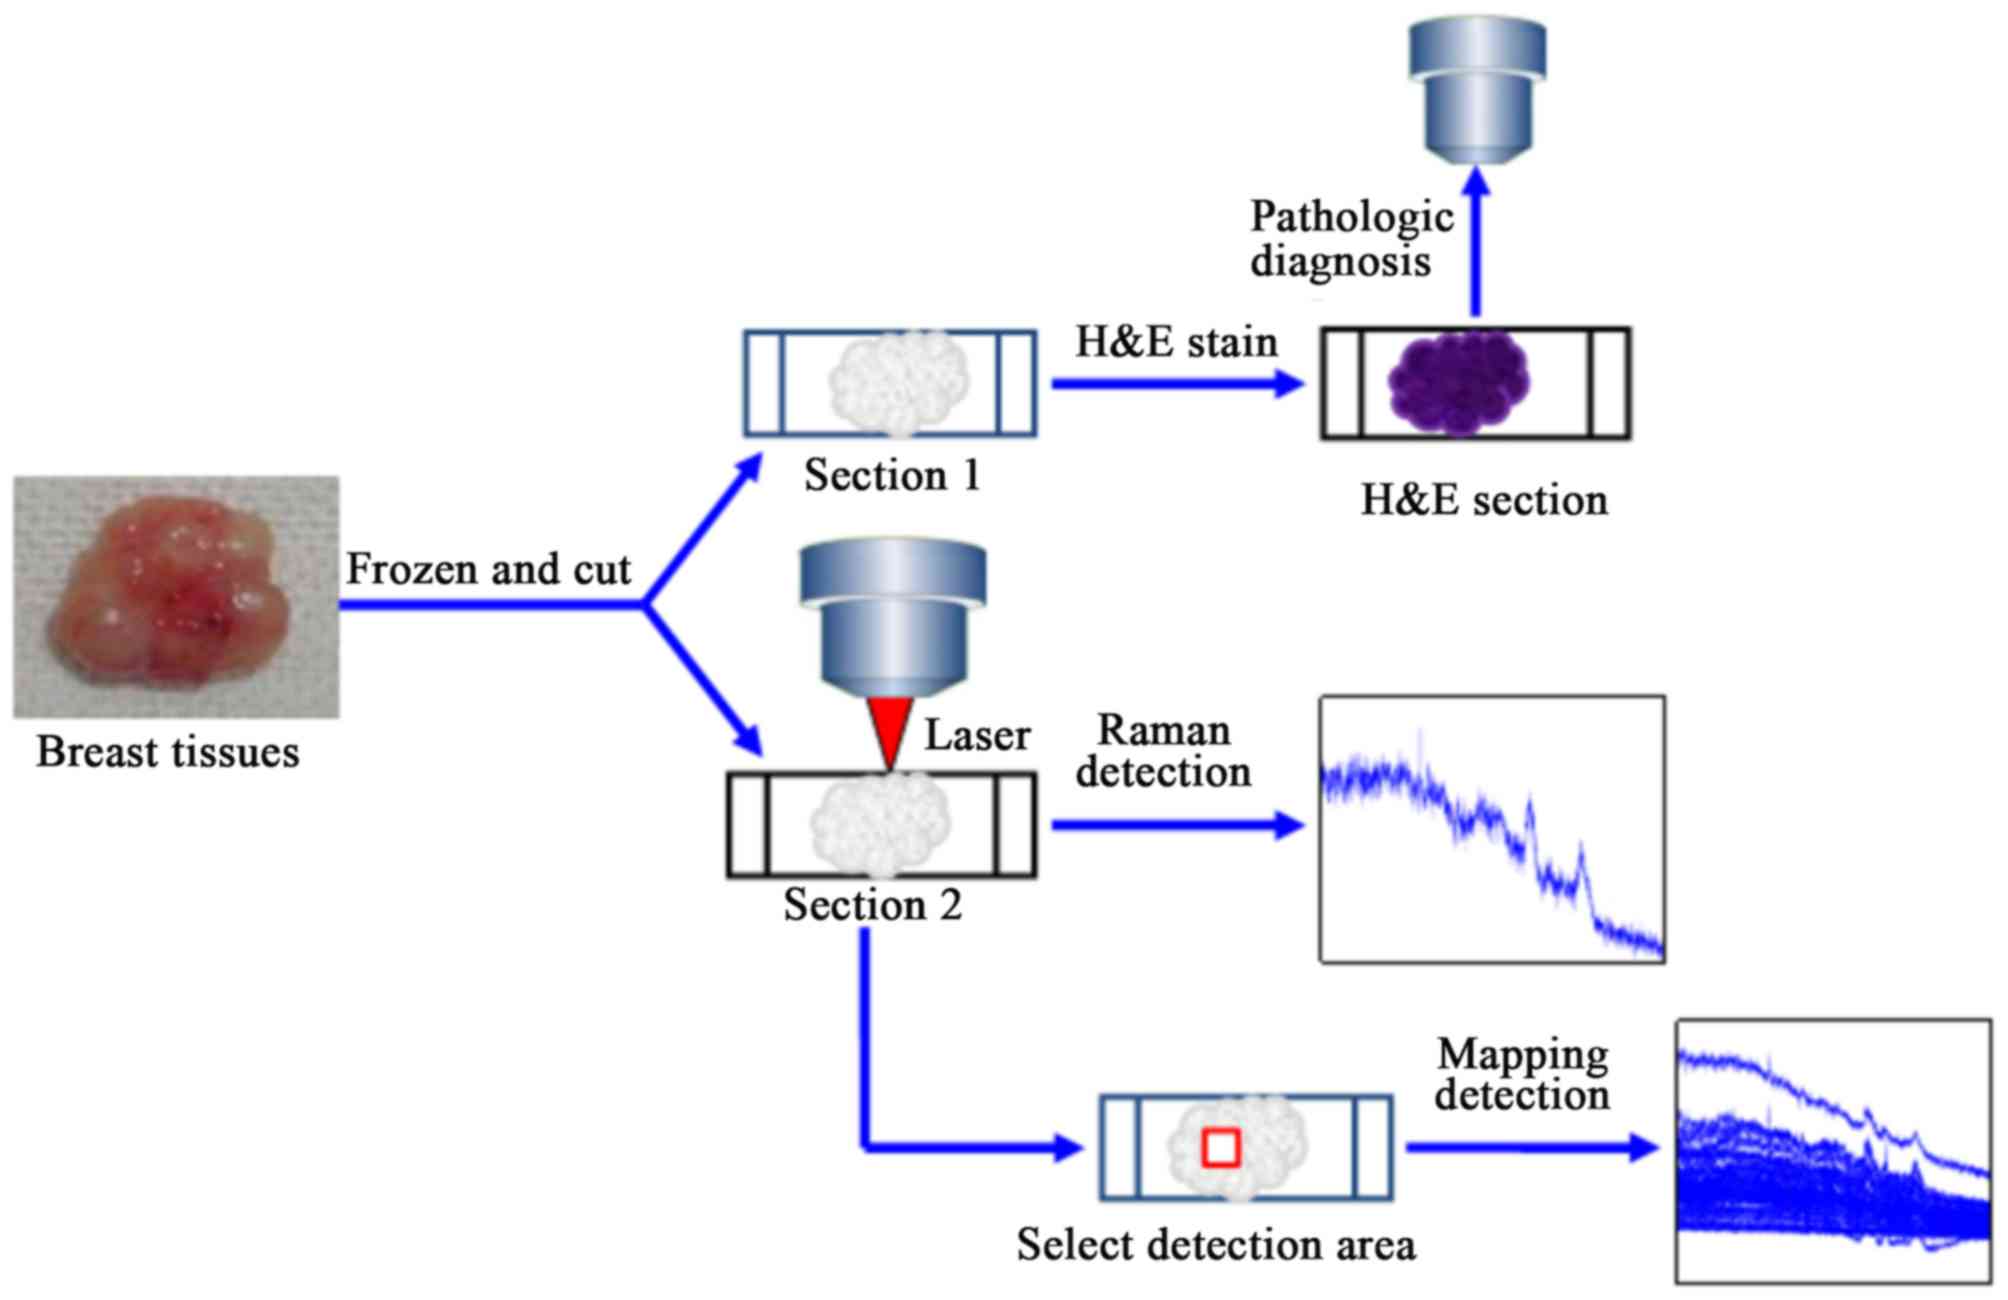
Specimen collection
Breast cancer tissue and adjacent normal breast
tissue (as far away as possible from the lesion, ≥5 cm) of the same
patients were collected, and the adipose tissues were removed. The
specimens were immediately frozen at −25 to −20°C. Subsequently,
two contiguous sections were sliced using a freezing microtome
(cat. no. CM3050S; Leica Microsystems GmbH). Following this, the
specimens were stained with H&E for further examination.
H&E staining was performed as follows. First, the specimens
were immersed in 10% neutral buffered formalin for 12 h at room
temperature and then dehydrated in 75, 80, 95 (I), 95 (II), 100 (I)
and 100% (II) ethanol for 1 h, respectively. Next, specimens were
washed in in xylene for 1 h twice, paraffin embedded for 4 h, and
then cut into 3–5 µm-thick sections. H&E staining was performed
at 22°C with H staining for 5 min, then sections were washed with
running water for 1 min, dipped in 0.1% HCl for 10 sec and E
counterstained for 1 min. Stained sections were then dehydrated in
75, 80, 95 (I), 95 (II), 100 (I) and 100% (II) ethanol for 1 min,
respectively. Finally, specimens were dipped in xylene for 1 min
three times. Dried sections were sealed with neutral gum. In the
process of making pathological sections, one of the two adjacent
sections was stained with H&E for routine histopathological
analysis by two experienced breast pathologists, and the other
section was transported in liquid nitrogen for Raman spectroscopy
without any further processing. To ensure that the detection area
was malignant, the H&E-stained section was used as a guide to
determine the detection area of the frozen section.
Raman spectroscopy
Raman spectroscopy was performed using a confocal
Raman System (HORIBA) (http://www.horiba.com/en_en/) at the State Key
Laboratory of Supramolecular Structures and Materials of Jilin
University (Changchun, China). It is a combination of a Raman
spectrometer and a standard optical microscope, with an optical
microscope at the bottom for image acquisition and a Raman
spectrometer at the top. The optical microscope is used to capture
images of the area being examined, and the laser beam excited by
the instrument is focused through the optical microscope as a tiny
spot of light with a diameter of 1.5 µm. The Raman signal in the
area where the spot is located passes through the microscope back
to the Raman spectrometer to obtain the Raman spectral information
of the tissue. For the single point test, a 633 nm helium-neon
laser was used in Duoscan mode, and the selected tissue area was
scanned point by point. The Raman signal generated during the test
was detected by a Synapse Thermoelectric cooled charge-coupled
device camera (Horiba Jobin Yvon SAS) with a spatial resolution of
3 λ. The power of the laser reaching the tissue surface was 20 mW.
No photo damage was observed in the samples after the mapping data
acquisition. Rayleigh scattered light was filtered using a 4-notch
filter (Ηoriba Jobin Yvon). The scanning range was 400–3,000
cm−1, the integration time was 20 sec and the number of
integration times was 1. The test tissue was kept moist with saline
to effectively reduce the spectral background and photodegradation.
Prior to the Raman spectroscopy test, images of the H&E-stained
sections of the breast tissue were captured using a light
microscope (Olympus Corporation) at ×10 and ×50 magnification . The
optical images were obtained at the same position as the
corresponding continuous frozen section. The wave number
calibration setting referred to the vibration frequency of the
silicon wafer at 520.7 cm−1, and these parameters
remained unchanged during all measurement processes (Fig. 1).
Data collection
From the H&E-stained sections, representative
regions of malignant and normal cells were selected for Raman
spectroscopy on frozen contiguous sections. During the collection
of single-point Raman spectra of tissues, 20–30 spectra were
obtained in each sample from different locations to ensure
representative sampling and collection of varying signals. During
collection of the mapping spectrum, each section was scanned for
1–3 regions to obtain a Raman map of this region by point-to-point
detection; a total of 7×7 points were scanned.
Data processing
A total of 53 sets of mapping data and 2,597
single-point Raman spectra were obtained for detection (each set of
mapping data comprised 49 spectra). Among these, 34 sets were form
malignant tissues with a total of 1,666 spectra and 19 sets were
from normal breast tissue with a total of 931 spectra. A total of
1,280 Raman spectra were obtained from single-point detection
including 720 from malignant tissues and 560 from benign tissues.
The spectra were subjected to baseline correction by fitting and
subtracting a trinomial polynomial using NGSLabSpec version 5.58.25
software (Horiba, Ltd.). The spectral data was then smoothed using
a 15-point adjacent averaging algorithm. Average spectra of Raman
data were calculated using Matlab version 7.9.0 software (The
MathWorks, Inc.).
k-Nearest Neighbor (KNN) method
KNN algorithm is run by self-programming program in
MATLAB R2009b software (https://ww2.mathworks.cn/products/matlab.html), used
to classify Raman data (26). By
finding the k closest neighbors of the Raman characteristic peaks
of the breast tissue and assigning the average properties of these
neighbors to the sample, the characteristics of breast tissue in
different lesions can be analyzed.
Mapping imaging method
A total of 24 sets (70.6%) of malignant data were
used to construct the diagnostic model and mapping imaging and 10
sets (29.4%) were used to test the model. The diagnostic model was
also constructed and tested in 13 sets (68.4%) and 6 sets (31.6%)
of normal breast tissues. Single-point test results were used in
the malignant group and the normal breast tissue group using 504
and 392 spectra (70%), respectively, as training sets for
construction of the models; 216 and 168 spectra (30%),
respectively, were used as test sets for testing the models and
analysis. t-tests (SPSS.20.0) were applied to analyze 2 sets of
data. Raman spectroscopy images were analyzed by the KNN
classification method and processed by diagnostic models to explore
the advantages and feasibility of practical application.
Results
Mapping is more stable compared with
single-point detection due to fewer outliers
Mapping data is more conducive to building a model
with high discrimination efficiency. Table I presents the number of outliers in
the measured data of each group; greater the outlier number
indicates lower stability. The mapping data for malignant breast
tissues consisted of 24 sets. The malignant outlier data comprised
149 pieces [mean There were 140 pieces of outlier data [average,
12.7 (8–17) pieces/group; Table I]. A significant difference was
observed in the number of outliers between mapping and single-point
detection data in the malignant group (t=−6.169; P<0.001). A
similar result was obtained for normal breast tissues (t=−8.873;
P<0.001).
 | Table I.Outlier data of the mapping test. |
Table I.
Outlier data of the mapping test.
|
| Mapping of breast
tissue (Outlier data) | Single point
detection of breast tissue (Outlier data) |
|---|
|
|
|
|
|---|
| Classification
group | Malignant | Normal | Malignant | Normal |
|---|
| 1 | 7 | 2 | 9 | 13 |
| 2 | 2 | 2 | 10 | 15 |
| 3 | 5 | 1 | 15 | 12 |
| 4 | 6 | 4 | 12 | 8 |
| 5 | 8 | 9 | 5 | 17 |
| 6 | 6 | 6 | 14 | 13 |
| 7 | 5 | 2 | 15 | 15 |
| 8 | 7 | 2 | 11 | 12 |
| 9 | 9 | 2 | 14 | 10 |
| 10 | 6 | 2 | 12 | 10 |
| 11 | 6 | 1 | 7 | 15 |
| 12 | 5 | 2 | 16 | – |
| 13 | 8 | 7 | 13 | – |
| 14 | 4 | – | 15 | – |
| 15 | 6 | – | – | – |
| 16 | 6 | – | – | – |
| 17 | 7 | – | – | – |
| 18 | 6 | – | – | – |
| 19 | 7 | – | – | – |
| 20 | 7 | – | – | – |
| 21 | 10 | – | – | – |
| 22 | 6 | – | – | – |
| 23 | 5 | – | – | – |
| 24 | 5 | – | – | – |
Mapping is more robust compared with
single-point detection according to the diagnostic model
The evaluation indicators were overall accuracy
(OA), sensitivity (SE), specificity (SP), positive predictive value
(PPV) and negative predictive value (NPV). The results of the five
evaluation indicators obtained from the test set are presented in
Table II. The correct OA rates for
breast cancer and normal breast tissue prediction were 99.56 and
89.04%, respectively. The overall SE, SP, PPV and NPV of the
mapping data diagnostic model were 96.60, 98.48, 99.56 and 89.04%,
respectively. With single-point data, the correct OA rates for
breast cancer and normal breast tissue prediction were 90.70 and
63.64%, respectively. The overall SE, SP, PPV and NPV of the
diagnostic model were 84.78, 50.00, 90.70 and 63.64%, respectively
(Table II).
| Table II.Diagnostic results of the k-Nearest
Neighbor model. |
Table II.
Diagnostic results of the k-Nearest
Neighbor model.
| Variable | OA | SE | SP | PPV | NPV |
|---|
| Mapping of
malignant breast tissue, % | 99.56 | 96.60 | 98.48 | 99.56 | 89.04 |
| Mapping of normal
breast tissue, % | 89.04 |
|
|
|
|
| Single-point
detection of malignant breast tissue, % | 90.70 | 84.78 | 50.00 | 90.70 | 63.64 |
| Single-point
detection of normal breast tissue, % | 63.64 |
|
|
|
|
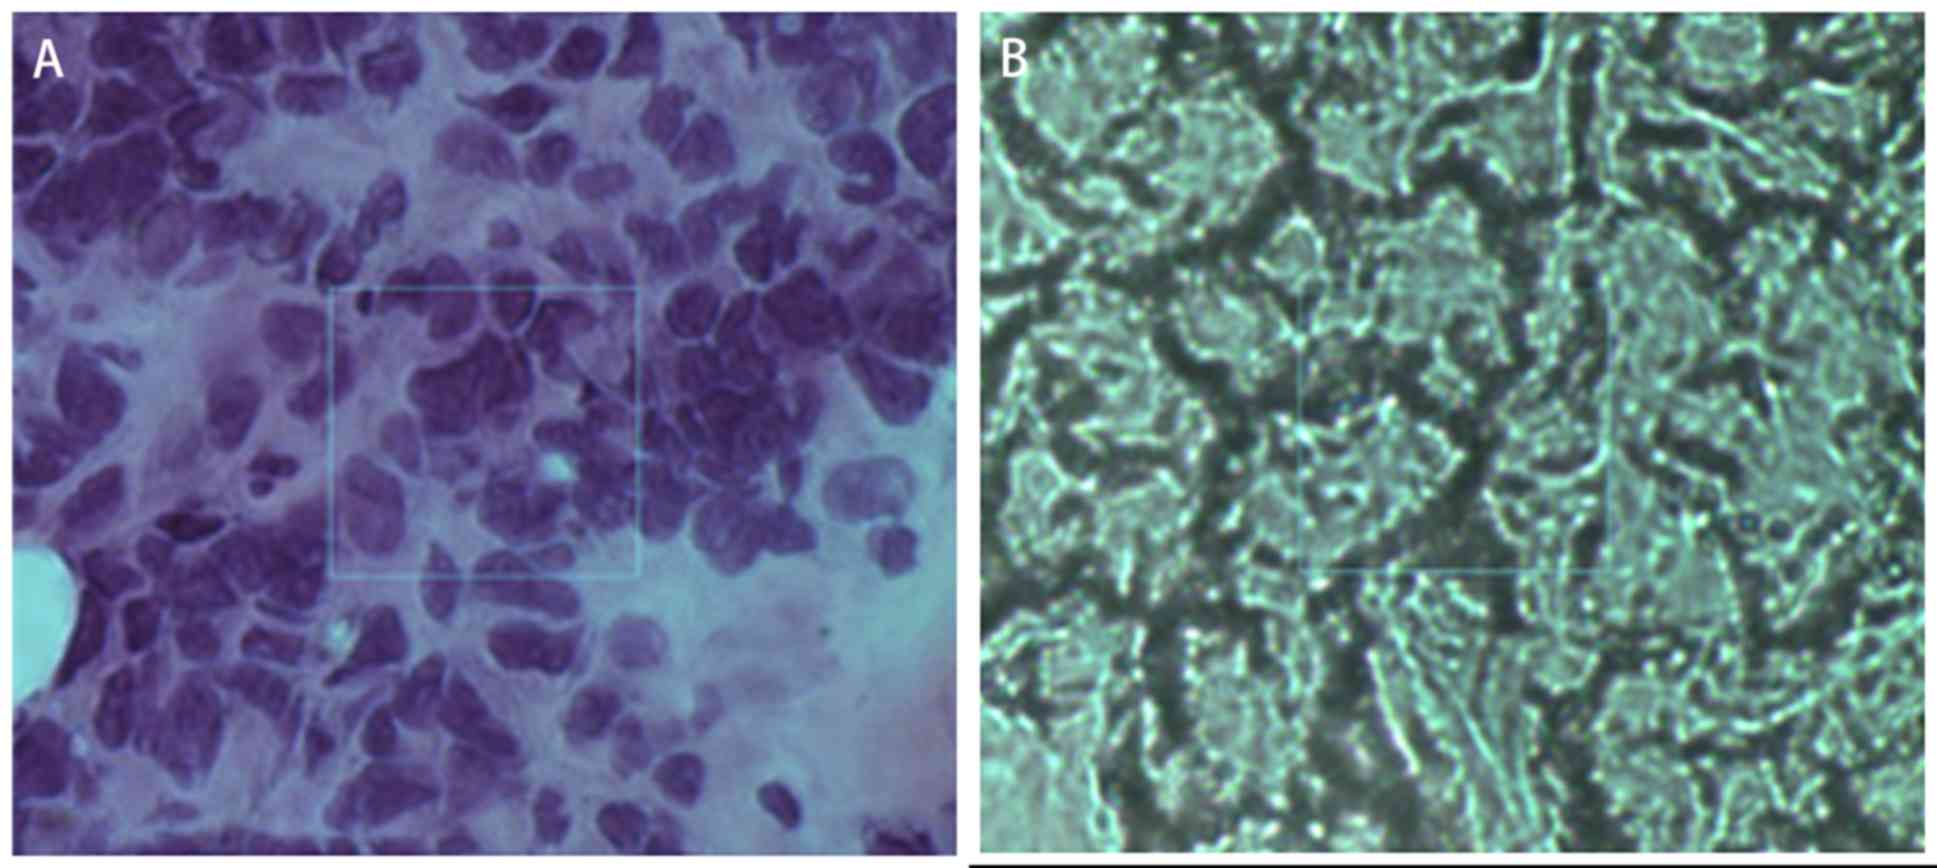
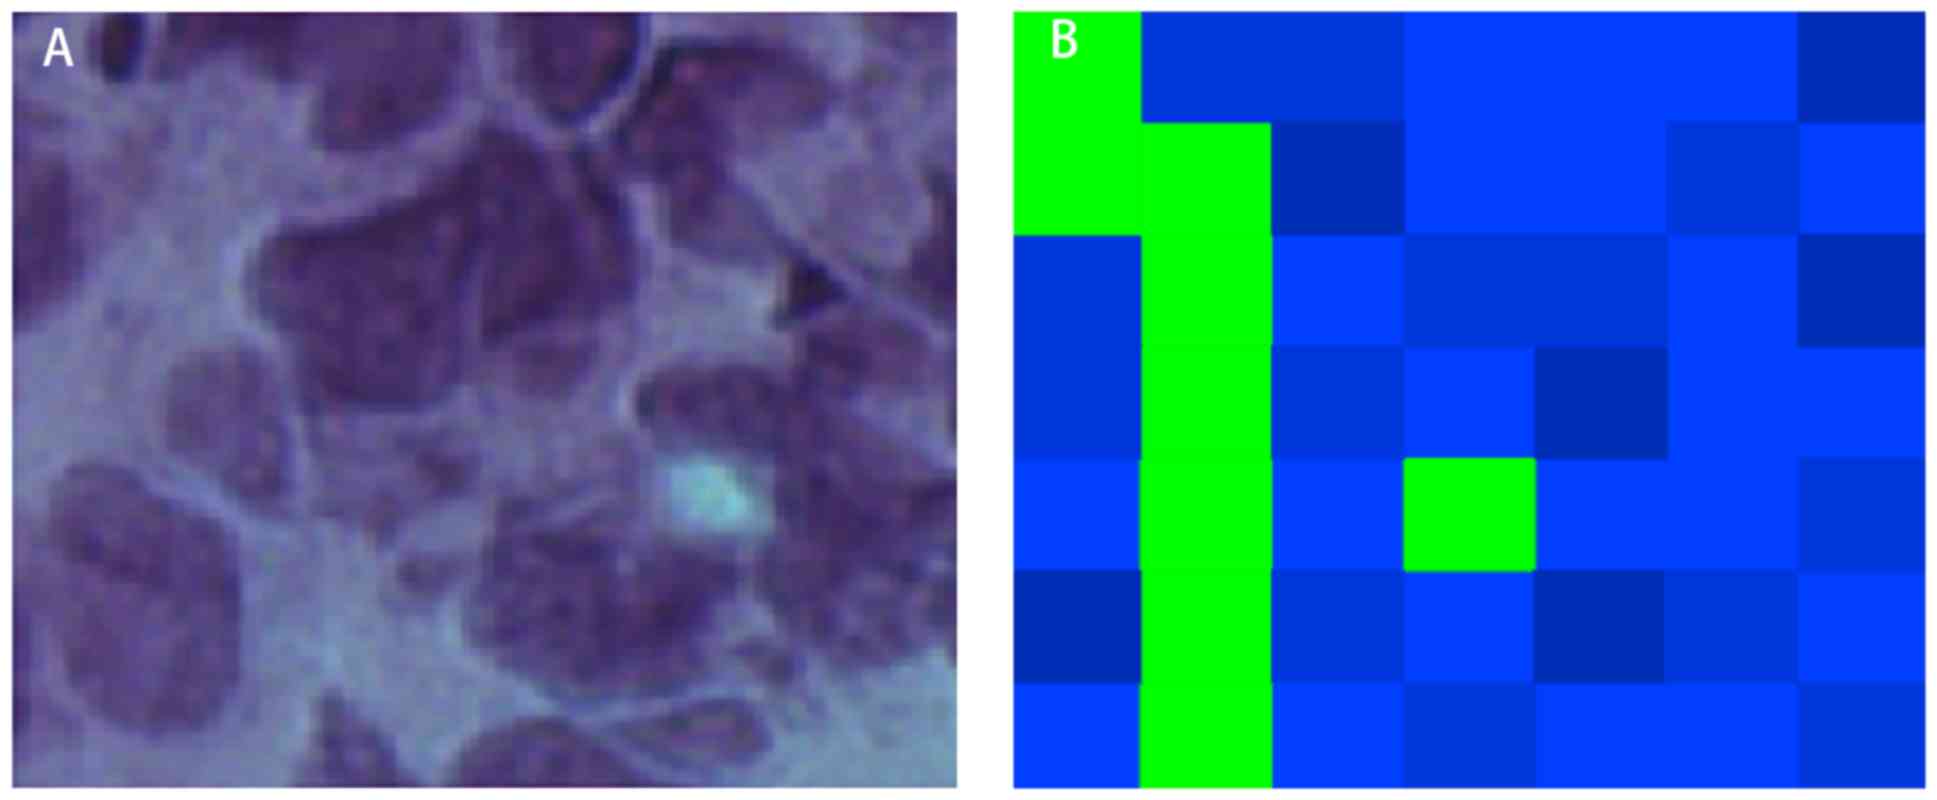
KNN classification imaging map
Blue and green represented malignant and
non-malignant tissues in the map, respectively. The map was
restored according to the coordinates of each detection point
(Figs. 2 and 3). Fig. 2
shows the comparison between H&E stained pathological sections
and unstained continuous pathological sections. In mammary gland
tissue, the cancer cells are disordered and have large atypia. By
observing the H&E section, the cell structure can be better
observed. Fig. 2A is the section
stained by H&E, and Fig. 2B is
the frozen section. The location shown in the box in the figure is
the cancerous region. The large blue area corresponded to the
nucleus of the pathological section, whereas the green area
corresponded to the tumor stroma (Fig.
3). The images of this method were consistent with the
distribution of tumor and interstitial cells on pathological
sections.
Discussion
The percentage of BCS is increasing yearly (27). The aim of BCS is to achieve negative
margins to avoid re-excision and achieve good esthetic results
(28). The results reported at the
2015 San Antonio breast cancer conference revealed that ~17% of
patients underwent secondary surgery following BCS (5). Clinicians and researchers have been
exploring ways to reduce the rate of secondary surgery through
preoperative examination (29).
There are many methods to evaluate the surgical margin of
breast-conserving surgery, including clinical observation and
palpation, in vivo or specimen imaging examination and
pathological evaluation. A recent meta-analysis showed that the
sensitivity and specificity of intraoperative ultrasound
examination of the surgical margin of the tumor were 59 and 81%,
respectively, and the sensitivity and specificity of specimen X-ray
examination were 53 and 84%, respectively, which did not
significantly reduce the incidence of secondary surgery (30). Thus, it is imperative to introduce a
new technique for the detection of the surgical margin in BCS.
Surgeons require a quick, comprehensive test to determine whether
there are any residual cancer cells at the surgical margin.
Indocyanine green and microwave technologies are ineffective at
reducing the rate of secondary surgery following BCS (31,32). At
present, the most popular methods for the determination of the
surgical margin or tissue properties include Raman spectroscopy and
real-time imaging of tumor cells with fluorescent nanoparticles
(15,33).
In the present study, a mapping technique of Raman
spectroscopy was used to minimize the influence of tissue
heterogeneity and inter-observer variability on the results. The
detection method of the mapping technology involves fixed interval
and point-by-point scanning per unit area; therefore, the results
are more objective and stable. However, mapping is relatively
time-consuming. H&E-stained malignant and normal breast tissue
sections were used to identify areas with the most abundant cells;
areas with a size of 10×10 µm were selected, and the corresponding
positions on the frozen sections were identified for detection. In
the mapping data set, the average number of outliers in malignant
tissues was 6.2 pieces/group, which accounted for 12.7% of the
total training set data; in the conventional single-point
detection, the average number of outliers in the malignant group
were 12 pieces/group, which accounted for 24.5% of all data. A
significant difference between outlier numbers was observed between
the two techniques. The data obtained in the present study
demonstrated that the mapping method was more stable compared with
single-point detection and contains fewer outliers.
Mapping data are more conducive for construction of
diagnostic models (25). Robust
statistics is a statistical method that minimizes the effect of
extreme results on the mean and standard deviation estimates
(21). An in-depth discussion on the
application of robust statistics was provided in our previous study
(12). However, robust statistics is
not relevant if the data is too discrete (21). In the present study, the number of
outliers was small and the construction model could obtain
effective spectral results, which was conducive to model
construction.
In the present study, the KNN method was used to
construct a diagnostic model based on robust statistics. The
diagnostic accuracy for malignant tumors was 99.56%, and the NPV
was 89.04%, which was significantly higher compared with
single-point test results. The diagnostic model was also superior
to the results reported in previous studies (16,17) with
respect to accuracy and specificity; this further verified the
advantages of the mapping method for construction of breast cancer
diagnostic models. The present study differed from previous studies
(17,25) in that the training data for the model
construction was not used to test the model; instead, new data were
used, which reduced false high accuracy due to the same training
and testing data. The present study identified new possibilities
for sensitive detection of the tumor margins at the level of
mapping molecules. Although limited reports have been published on
the use of this method for detection of breast cancer tissue, it
has recently become a new research hotspot (15,17).
In the present study, a diagnostic model was used to
evaluate the images. The imaging method for classification by the
diagnostic model must be based on a good classification model. Behl
et al (13) performed Raman
spectroscopy imaging of the oral mucosa. The data was de-baselined
and then analyzed by the K-means cluster analysis method; tumor,
stroma and inflammatory cells were assigned different colors (red,
green and blue), and these regions are distinctly depicted on Raman
maps of tumor sections (13). Daniel
et al (34), used a
combination of principal component analysis and K classification to
image the oral mucosa and classify the different principal
components. In the present study, a breast cancer diagnosis model
was constructed by KNN method, and the Raman map obtained by
imaging the detected area could clearly depict the tumor margins.
This correspondence demonstrated the application value of this
method for real-time imaging of tumor margins. In the future,
real-time margin imaging by software determined properties may be
used to guide surgical resection.
In conclusion, confocal micro-Raman spectroscopy was
used to detect the features of breast cancer and normal breast
tissue by point-by-point scanning, and the results of the present
study demonstrated that it was possible to obtain more stable
spectral data compared with the data obtained using previous
methods. Based on the spectral data, the KNN method was used to
construct the diagnostic model software. The diagnostic accuracy
was significantly higher compared with that of the model built
using the single-point detection method, which demonstrated the
advantage of the mapping method for data acquisition. The image
obtained using the imaging method based on the diagnostic model
classification closely corresponded to the pathological sections,
which revealed the feasibility of the application of mapping for
intraoperative imaging. The present study provided a foundation for
the diagnostic use of the Raman spectrum at the molecular
level.
Acknowledgements
Not applicable.
Funding
The current study was supported by a grant from the
National Nature Foundation of China (grant no. 81773171).
Availability of data and materials
The datasets used and/or analyzed during the present
study are available from the corresponding author on reasonable
request.
Authors' contributions
HPZ, XZW, DS and BH contributed to the conception of
this study and performed the preliminary documentation. RBD, LS,
PG, HX, CFX and HXZ enrolled patients in the study and collected
clinical data. All authors participated in the statistical analysis
and contributed to the interpretation of the results as well as
drafting the manuscript. All authors have read and approved the
manuscript.
Ethics approval and consent to
participate
This research followed the International and
National regulations in accordance with the Declaration of
Helsinki. The study was approved by the Ethics Committee of the
First Hospital of Jilin University (Changchun, China). All patients
provided written informed consent before being included in this
study.
Patient consent for publication
Not applicable.
Competing interests
The authors declare that they have no competing
interests.
References
|
1
|
Fisher B, Anderson S, Bryant J, Margolese
RG, Deutsch M, Fisher ER, Jeong JH and Wolmark N: Twenty-year
follow-up of a randomized trial comparing total mastectomy,
lumpectomy, and lumpectomy plus irradiation for the treatment of
invasive breast cancer. N Engl J Med. 347:1233–1241. 2002.
View Article : Google Scholar : PubMed/NCBI
|
|
2
|
Yiannakopoulou EC and Mathelin C:
Oncoplastic breast conserving surgery and oncological outcome:
Systematic review. Eur J Surg Oncol. 42:625–630. 2016. View Article : Google Scholar : PubMed/NCBI
|
|
3
|
Rubio IT, Ahmed M, Kovacs T and Marco V:
Margins in breast conserving surgery: A practice-changing process.
Eur J Surg Oncol. 42:631–640. 2016. View Article : Google Scholar : PubMed/NCBI
|
|
4
|
Wen HY and Brogi E: Breast cancer
pathology. Oncoplastic Reconstructive Br Surg. 7:87–127. 2019.
View Article : Google Scholar
|
|
5
|
Bodilsen A, Bjerre K, Offersen BV, Vahl P,
Amby N, Dixon JM, Ejlertsen B, Overgaard J and Christiansen P:
Importance of margin width in breast-conserving treatment of early
breast cancer. J Surg Oncol. 113:609–615. 2016. View Article : Google Scholar : PubMed/NCBI
|
|
6
|
Eskelinen M, Collan Y, Puittinen J and
Valkamo E: Frozen section diagnosis of breast cancer. Acta
Oncologica. 28:183–186. 1989. View Article : Google Scholar : PubMed/NCBI
|
|
7
|
Downes A and Elfick A: Raman spectroscopy
and related techniques in biomedicine. Sensors (Basel).
10:1871–1889. 2010. View Article : Google Scholar : PubMed/NCBI
|
|
8
|
Furuyama N, Hasegawa S, Hamaura T, Yada S,
Nakagami H, Yonemochi E and Terada K: Evaluation of solid
dispersions on a molecular level by the Raman mapping technique.
Int J Pharm. 361:12–18. 2008. View Article : Google Scholar : PubMed/NCBI
|
|
9
|
Ueda H, Ida Y, Kadota K and Tozuka Y:
Raman mapping for kinetic analysis of crystallization of amorphous
drug based on distributional images. Int J Pharm. 462:115–122.
2014. View Article : Google Scholar : PubMed/NCBI
|
|
10
|
Zhang R, Zhang Y, Dong ZC, Jiang S, Zhang
C, Chen LG, Zhang L, Liao Y, Aizpurua J, Luo Y, et al: Chemical
mapping of a single molecule by Plasmon-enhanced Raman scattering.
Nature. 498:82–86. 2013. View Article : Google Scholar : PubMed/NCBI
|
|
11
|
Hanlon EB, Manoharan R, Koo TW, Shafer KE,
Motz JT, Fitzmaurice M, Kramer JR, Itzkan I, Dasari RR and Feld MS:
Prospects for in vivo Raman spectroscopy. Phys Med Biol. 45:R1–R59.
2000. View Article : Google Scholar : PubMed/NCBI
|
|
12
|
Short KW, Carpenter S, Freyer JP and
Mourant JR: Raman spectroscopy detects biochemical changes due to
proliferation in mammalian cell cultures. Biophys J. 88:4274–4288.
2005. View Article : Google Scholar : PubMed/NCBI
|
|
13
|
Behl I, Kukreja L, Deshmukh A, Singh SP,
Mamgain H, Hole AR and Krishna CM: Raman mapping of oral buccal
mucosa: A spectral histopathology approach. J Biomed Opt.
19:1260052014. View Article : Google Scholar : PubMed/NCBI
|
|
14
|
Hu C, Wang J, Zheng C, Xu S, Zhang H,
Liang Y, Bi L, Fan Z, Han B and Xu W: Raman spectra exploring
breast tissues: Comparison of principal component analysis and
support vector machine-recursive feature elimination. Med Phys.
40:0635012013. View Article : Google Scholar : PubMed/NCBI
|
|
15
|
Han B, Du Y, Fu T, Fan Z, Xu S, Hu C, Bi
L, Gao T, Zhang H and Xu W: Differences and relationships between
normal and atypical ductal hyperplasia, ductal carcinoma in situ,
and invasive ductal carcinoma tissues in the breast based on raman
spectroscopy. Appl Spectrosc. 71:300–307. 2017. View Article : Google Scholar : PubMed/NCBI
|
|
16
|
Haka AS, Shafer-Peltier KE, Fitzmaurice M,
Crowe J, Dasari RR and Feld MS: Diagnosing breast cancer by using
Raman spectroscopy. Proc Natl Acad Sci USA. 102:12371–12376. 2005.
View Article : Google Scholar : PubMed/NCBI
|
|
17
|
Haka AS, Volynskaya Z, Gardecki JA, Nazemi
J, Shenk R, Wang N, Dasari RR, Fitzmaurice M and Feld MS:
Diagnosing breast cancer using Raman spectroscopy: Prospective
analysis. J Biomed Opt. 14:0540232009. View Article : Google Scholar : PubMed/NCBI
|
|
18
|
Hu CX, Zheng C, Zhang HP, Li-Rong BI,
Shu-Ping XU, Zhi-Min F, Bing H and Qing XW: Study on fresh breast
tissues by near-infrared Raman spectroscopy. Chem J Chin Univ.
34:2721–2727. 2013.
|
|
19
|
Yu C, Gestl E, Eckert K, Allara D and
Irudayaraj J: Characterization of human breast epithelial cells by
confocal Raman microspectroscopy. Cancer Detect Prev. 30:515–522.
2006. View Article : Google Scholar : PubMed/NCBI
|
|
20
|
Zheng C, Shao W, Paidi SK, Han B, Fu T, Wu
D, Bi L, Xu W, Fan Z and Barman I: Pursuing shell-isolated
nanoparticle-enhanced Raman spectroscopy (SHINERS) for concomitant
detection of breast lesions and microcalcifications. Nanoscale.
7:16960–16968. 2015. View Article : Google Scholar : PubMed/NCBI
|
|
21
|
Zheng C, Zhang HP, Han B, Lijia L, Yabin
Z, Shuping X, Heping L, Weiqing X and Zhimin F: Study on fresh
breast tissues by Raman spectroscopy based on robust statistics.
Chem J Chin Univ. 36:74–80. 2014.
|
|
22
|
Naumann D: Ft-Infrared and Ft-Raman
spectroscopy in biomedical research. App Spectroscopy Rev.
36:239–298. 2001. View Article : Google Scholar
|
|
23
|
Chowdary MV, Kumar KK, Kurien J, Mathew S
and Krishna CM: Discrimination of normal, benign, and malignant
breast tissues by Raman spectroscopy. Biopolymers. 83:556–569.
2006. View Article : Google Scholar : PubMed/NCBI
|
|
24
|
Yi YN, Wang S, Gong YZ, Zheng JM, Qin J,
Liang ZW and He QL: A study on biochemical constitution of human
skin tissue by confocal raman microspectroscopy imaging. Acta Laser
Biol Sinica. 25:391–397. 2016.(In Chinese).
|
|
25
|
Yu G, Lue AJ, Wang B and Zhang CZ: Raman
imaging based on morphological model for human breast cancer
tissues. Guang Pu Xue Yu Guang Pu Fen Xi. 30:2167–2170. 2010.(In
Chinese). PubMed/NCBI
|
|
26
|
Wang CY, Yan YG, Zhang K and Li JG: A
K-nearest neighbor algorithm based on cluster in text
classification. 2010 International Conference on Computer,
Mechatronics, Control and Electronic Engineering (CMCE 2010).
1:225–228. 2010.
|
|
27
|
Bray F, Ferlay J, Soerjomataram I, Siegel
RL, Torre LA and Jemal A: Global cancer statistics 2018: GLOBOCAN
estimates of incidence and mortality worldwide for 36 cancers in
185 countries. CA Cancer J Clin. 68:394–424. 2018. View Article : Google Scholar : PubMed/NCBI
|
|
28
|
McClatchy DM III, Zuurbier RA, Wells WA,
Paulsen KD and Pogue BW: Micro-computed tomography enables rapid
surgical margin assessment during breast conserving surgery (BCS):
Correlation of whole BCS micro-CT readings to final histopathology.
Breast Cancer Res Treat. 172:587–595. 2018. View Article : Google Scholar : PubMed/NCBI
|
|
29
|
Mccahill LE, Single RM, Bowles EJ,
Feigelson HS, James TA, Barney T, Engel JM and Onitilo AA:
Variability in Reexcision following breast conservation surgery.
JAMA. 307:467–475. 2012. View Article : Google Scholar : PubMed/NCBI
|
|
30
|
St John ER, Al-Khudairi R, Ashrafian H,
Athanasiou T, Takats Z, Hadjiminas DJ, Darzi A and Leff DR:
Diagnostic Accuracy of intraoperative techniques for margin
assessment in breast cancer surgery: A Meta-analysis. Ann Surg.
265:300–310. 2017. View Article : Google Scholar : PubMed/NCBI
|
|
31
|
Keating J, Tchou J, Okusanya O, Fisher C,
Batiste R, Jiang J, Kennedy G, Nie S and Singhal S: Identification
of breast cancer margins using intraoperative near-infrared
imaging. J Surg Oncol. 113:508–514. 2016. View Article : Google Scholar : PubMed/NCBI
|
|
32
|
Blohmer JU, Tanko J, Kueper J, Gross J,
Völker R and Machleidt A: MarginProbe© reduces the rate
of re-excision following breast conserving surgery for breast
cancer. Arch Gynecol Obstet. 294:361–367. 2016. View Article : Google Scholar : PubMed/NCBI
|
|
33
|
Zhang HP, Han B, Jia ZZ, Ding R, Xu B, Xu
W and Fan Z: Fabrication of drug loaded fluorescent nanoparticles
and its biological application in MCF-7 breast cancer cell. Chem J
Chinese Univ. 38:860–865. 2017.
|
|
34
|
Daniel A, Prakasarao A and Ganesan S:
Near-infrared Raman spectroscopy for estimating biochemical changes
associated with different pathological conditions of cervix.
Spectrochim Acta Part A. 190:409–416. 2018. View Article : Google Scholar
|