Introduction
Pancreatic cancer is a leading fatal neoplasm and
the even at the early stage, invasion of the surrounding organs and
metastases often are already present (1,2). The
biological properties of pancreatic cancer are characteristic; it
is richer in fibrous stroma in the tumor tissue than other
carcinomas (3), but nevertheless
this ‘desmoplastic change’ is prominent, the tumor cells are able
to invade the hard interstitium easily.
Various cellular signals are involved in the
regulation of invasion by pancreatic cancer cells. For example, the
epithelial mesenchymal transition (EMT) and the interaction between
the cancer cells and stroma are important. It has been suggested
that bone morphogenetic protein (BMP), a member of the transforming
growth factor-β (TGF-β) family, and various cytokines contribute to
these mechanisms (4,5). On the other hand, in order to acquire
invasiveness, the cancer cells must be motile and able to break
down the surrounding hard stroma. The control of motility is a
feature of TGF-β and degradation of the stroma involves various
matrix metalloproteinases (MMPs). Many past reports about
this invasive phenomenon have examined the relationship between the
expression of individual factors and invasiveness. However, this
approach requires time and effort to identify the factors involved.
In order to solve these problems, it would be useful to first
establish highly invasive cells and then to identify the molecules
that are highly expressed in these cells, as a means of analyzing
comprehensively the factors that regulate invasiveness. Methods for
establishing highly invasive cells include in vitro studies
using an invasion assay (IA method) and in vivo studies
using transplantation into nude mice (6). The latter combines the two phenomena of
invasion and metastasis and the mechanism is complicated. In the IA
method, it is considered that various molecules are secreted when
the cells migrate into the gel and that factors regulating motility
also must be involved. The IA method was adopted for this study
because it seems to be a useful approach that, in several respects,
is most suitable for establishing highly invasive cells.
The multistep carcinogenesis of pancreatic cancer is
proposed as follows: a tumor (pancreatic intraepithelial neoplasm:
PanIN) develops from normal tissue and progresses to PanIN-1
(hyperplasia), PanIN-2 (atypia) and PanIN-3 (carcinoma-in situ), as
genetic mutations accumulate. Eventually, it becomes invasive
pancreatic cancer (1). Previous
studies have shown that KRAS, CDKN2A, TP53, and SMAD4
are the four major genes mutated in pancreatic cancer cells,
through the sequencing of a vast array of cancer-related genes in
invasive pancreatic cancer. In addition, it has been suggested that
twelve cell signaling pathways involving these genes are involved
in the development of cancer (7).
Genetic studies of pancreatic cancer have developed dramatically,
and many significant biological and clinical interpretations have
been made (8), but other genetic
abnormalities remain to be described. In addition, there are many
questions about how these signal transductions, directly or
indirectly, define the characteristics of cancer cells and, in
particular, control their invasiveness. From this point of view,
finding a gene that controls invasiveness and determines the poor
prognosis of pancreatic cancer will also contribute to, for
example, the development of a molecular targeted therapeutic drug
for future treatment.
Here, in order to search for factors that contribute
to the invasiveness of pancreatic cancer, we attempted to establish
multiple human pancreatic cancer cell lines with various capacities
for infiltration. Furthermore, gene expression changes were
analyzed comprehensively in these cells and genes that were
specifically up-regulated in the cell lines that had acquired high
invasiveness were examined.
Materials and methods
Cell lines and cell culture
The following six human pancreatic cancer-derived
cell lines were used: PANC-1, AsPC-1, KP-3, BxPC-3, TCC-PAN2, and
MIA PaCa-2. AsPC-1, BxPC-3 and MIA PaCa-2 were obtained from the
American Type Culture Collection (ATCC), PANC-1 and KP-3 from
Kyusyu Cancer Center and TCC-PAN2 from the Japanese Collection of
Research Bioresources Cell Bank. We originally recognized PANC-1
cells as other cells, but STR analysis showed that they were of the
completely same origin as PANC-1 cells. Each cell line was
maintained in RPMI-1640 culture medium (GIBCO Laboratories) with
10% (v/v) fetal bovine serum (FBS) and 100 IU/mL penicillin and 100
µg/mL streptomycin. The cells were cultured at 37°C in 5%
CO2.
Establishment of highly invasive cell
lines
Corning® BioCoatTM Matrigel®
Invasion chambers (Corning) were used to establish highly invasive
cell lines from the above pancreatic cancer cell lines. The chamber
consists of two parts, with an 8 µm hole at the bottom of the upper
chamber (UC) and a thin polyethylene terephthalate membrane coated
with matrix (the concentration is not disclosed by the
manufacturer) on the surface. The cells were seeded at 2.5 ×
104 in the UCs and incubated at 37°C, 5% CO2
for 24 hours. Thereafter, only the cells that had migrated into the
lower chamber (LC) were collected and cultured in a 100 mm diameter
dish to increase their numbers. These cells were seeded in the UC
again and the operation was repeated three times. The final cell
line was designated as selected (S) and the original cell line was
used as the parent (P) in the following experiments.
Real-time monitoring of invasion
ability
In order to evaluate the infiltration ability of the
P and S cells, infiltration was measured in real time using the
xCelligence system (ACEA Biosciences), following the manufacturer's
instructions. Specifically, each cell line was maintained in
serum-free RPMI 1640 medium for 4 hours before the measurement. The
UCs of CIM-plates (Cell Invasion/Migration-Plate 16) were coated
with Matrigel® Basement Membrane Matrix (Corning)
diluted 20 times and allowed to stand at 37°C for 4 hours. The LC
contained RPMI 1640 medium with 10% FBS, which acted as a trigger
for infiltration. For each cell type (P and S), 2 × 10⁴
cells were seeded in the UC and the resultant cell index was
measured every 10 minutes for up to 48 hours, during incubation
under 37°C, 5% CO2 conditions.
RNA and protein isolation
Cells were harvested from sub-confluent monolayers
and total cytoplasmic RNA was extracted using ISOGEN (Nippon Gene).
The integrity of the RNA was evaluated using an Agilent 2100
Bioanalyzer (Agilent Technologies,). Concentrations were measured
with a NanoDrop 1000 (Thermo Fisher Scientific, Inc.). Protein
extraction was performed using similar subconfluent cells. After
washing twice with phosphate buffered saline (pH 7.4),
intracellular proteins were extracted using Complete Lysis-M
(Roche) according to the manufacturer's instructions. The protein
concentrations were calculated using a Coomassie Protein Assay kit
and Thermo Multiskan FC (Thermo Fisher Scientific, Inc.) by
measuring the absorbance at 595 nm with a known concentration of
bovine serum protein as the standard.
Microarray analysis
In order to obtain biotin labeled cRNA, total RNA
was amplified, labeled, and purified using a GeneChip®
3′IVT Express kit (Affymetrix; Thermo Fisher Scientific, Inc.)
according to the manual. All samples were profiled on the
GeneChip® Human Genome U133 Plus v2.0 Array platform,
array hybridization was performed using a Hybridization Oven 640
and washing was performed in a Fluidics Station 450. Slides were
scanned using a GeneChip Scanner 3000 7G and Command Console
Software 3.1 (Affymetrix; Thermo Fisher Scientific, Inc.) with
default settings. The resulting data were analyzed using the MAS
5.0 algorithm of Gene Spring Software v12.5 (Agilent Technologies)
and roughly extracted genes exhibiting a Fold Change (FC; [S] vs.
[P]) >2. Volcano plot and heat map were also made by
Transcriptome Analysis Console (TAC) v3.1 software (Affymetrix)
adapting a default algorithm one-way between-subject ANOVA
(unpaired) and a filter criteria ANOVA P-value <0.05.
Validation of reverse
transcription-quantitative PCR (RT-qPCR)
Quantitative PCR was used to evaluate the relative
expression of the selected genes using cDNA from each cell line.
First, we obtained cDNA using a Transcriptor Universal cDNA Master
kit (Roche), according to the manufacturer's instructions. Next,
quantitative PCR was conducted using a FastStart Essential DNA
Green Master (Roche). According to the manufacturer's protocol,
each cDNA and specific primer (Table
I) were adjusted to final concentrations of 2.5 ng/µL and 500
nM, respectively, and then mixed in a total volume of 20 µL. We
used a LightCycler® 480 (Roche) for reaction by setting
denaturation at 95°C for 10 sec, annealing at 60°C for 10 sec, and
extension at 72°C for 15 sec per cycle, with 45 cycles. Analysis
was conducted using LightCycler Nano Software (Roche). The relative
expression levels of mRNA were calculated relative to the those of
β-actin, a housekeeping gene, based on quantitative cycles (Cq) and
using the relative Cq (2−ΔΔCq) method (9).
 | Table I.Primers used for reverse-transcription
quantitative PCR. |
Table I.
Primers used for reverse-transcription
quantitative PCR.
| Gene name | Forward sequence
(5′-3′) | Reverse sequence
(5′-3′) |
|---|
| IL-32 |
AGCTGGAGGACGACTTCAAA |
AGAGCAGCAGAAACTCTGGA |
| PTX3 |
CATCCAGTGAGACCAATGAG |
GTAGCCGCCAGTTCAGCATT |
| ARHGDIB |
AGTACGACGTGATCGTGCTG |
AAATGGACAAAGATGATGAGAGTCTA |
| PCYT1B |
TAGAGCACACATGCCCACAG |
GACACTGGCAGTTGGTTTCA |
Western blot analysis
After adjusting the protein concentration, 10 µg of
each protein sample was separated by sodium dodecyl
sulfate-polyacrylamide gel electrophoresis with 4–15% gradient
gels, followed by analysis using a Trans-Blot Turbo Transfer Pack
(BioRad) and Trans-blot Turbo Blotting System (BioRad). For
immunoblotting, the primary antibody reaction was performed by
stirring with Can Get Signal Solution1 (Toyobo) at room temperature
for 1 hour. The IL-32 antibody was a rabbit polyclonal anti-IL-32
antibody (dilution, 1:1000; cat. no. 11079–1-AP; Proteintech). The
secondary antibody reaction was performed using a goat anti-rabbit
IgG, horseradish peroxidase-linked antibody (dilution, 1:10000;
cat. no. 7074S; CST Japan, Japan). Anti-β actin antibody (dilution,
1:3000; cat. no. A5316; Sigma) was used as a loading control
followed by the reaction with the corresponding horseradish
peroxidase-linked secondary antibody (dilution, 1:10000; cat. no.
7076S; CST Japan). Detection and visualization were performed with
an ImageQuant LAS500 (GE Healthcare) system using ECL Prime Western
Blotting detection reagent (GE Healthcare) as the chemiluminescence
detection reagent.
Immunocytochemical study
The S and P cultures of BxPC-3 cells were collected
by centrifugation, and the cell pellets were fixed 15% citrated
buffered formalin fixed and were paraffin embedded (FFPE). The thin
sections were immunohistochemically reacted with IL-32 antibody
(dilution, 1:100; cat. no. 11079-1-AP; Proteintech) and then the
immunoperoxidase reactions were performed using a BenchMark GX
automated IHC/ISH slide staining system (Roche), according to the
manufacturer's protocols.
Statistical analysis
Statistical analysis was conducted using Student's
t-test. P<0.05 was considered to indicate a statistical
significant difference and P<0.1, significant tendency.
Results
Establishment of highly invasive cell
lines
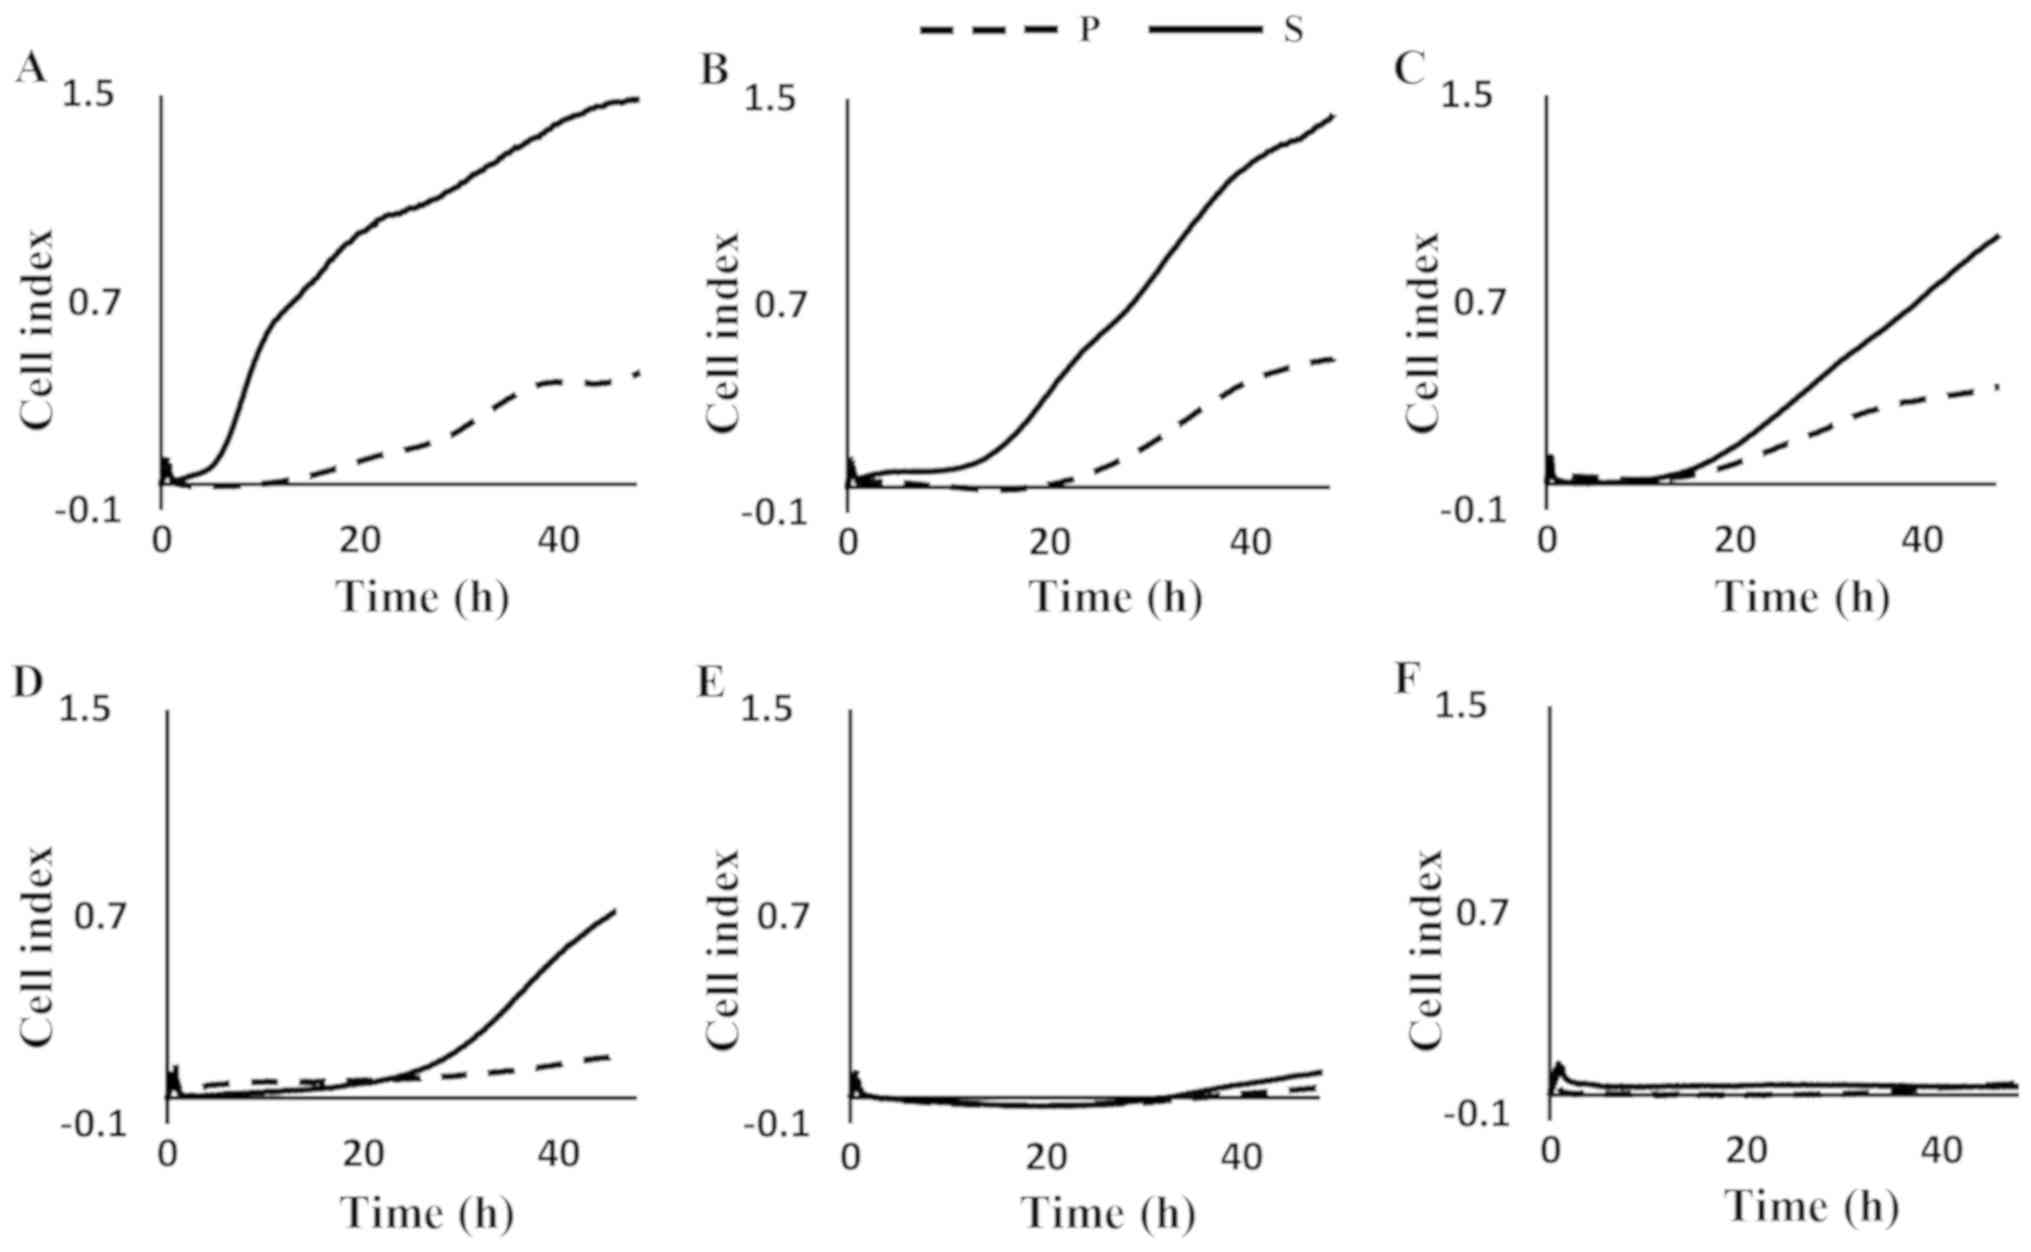
Highly invasive cell lines with obvious differences
between P and S were obtained from the parental PANC-1, KP3,
BxPC-3, and TCC-PAN2 cells (Fig. 1).
In particular, PANC-1 showed a high cell index soon after the
fourth round of selection (S) and this showed a tendency to
increase thereafter. Although the other three cell lines did not
show a clear increase over P immediately after selection, the value
showed a clear increase after 10 hours for KP3 and BxPC-3 and after
20 hours for TCC-PAN2. On the other hand, for the AsPC-1 and MIA
PaCa-2 lines, there was no tendency for invasion to increase even
after the fourth round of selection. The first four cell lines
formed the highly invasive group and the other two, the low
invasive group.
Search for genes involved in enhanced
invasiveness
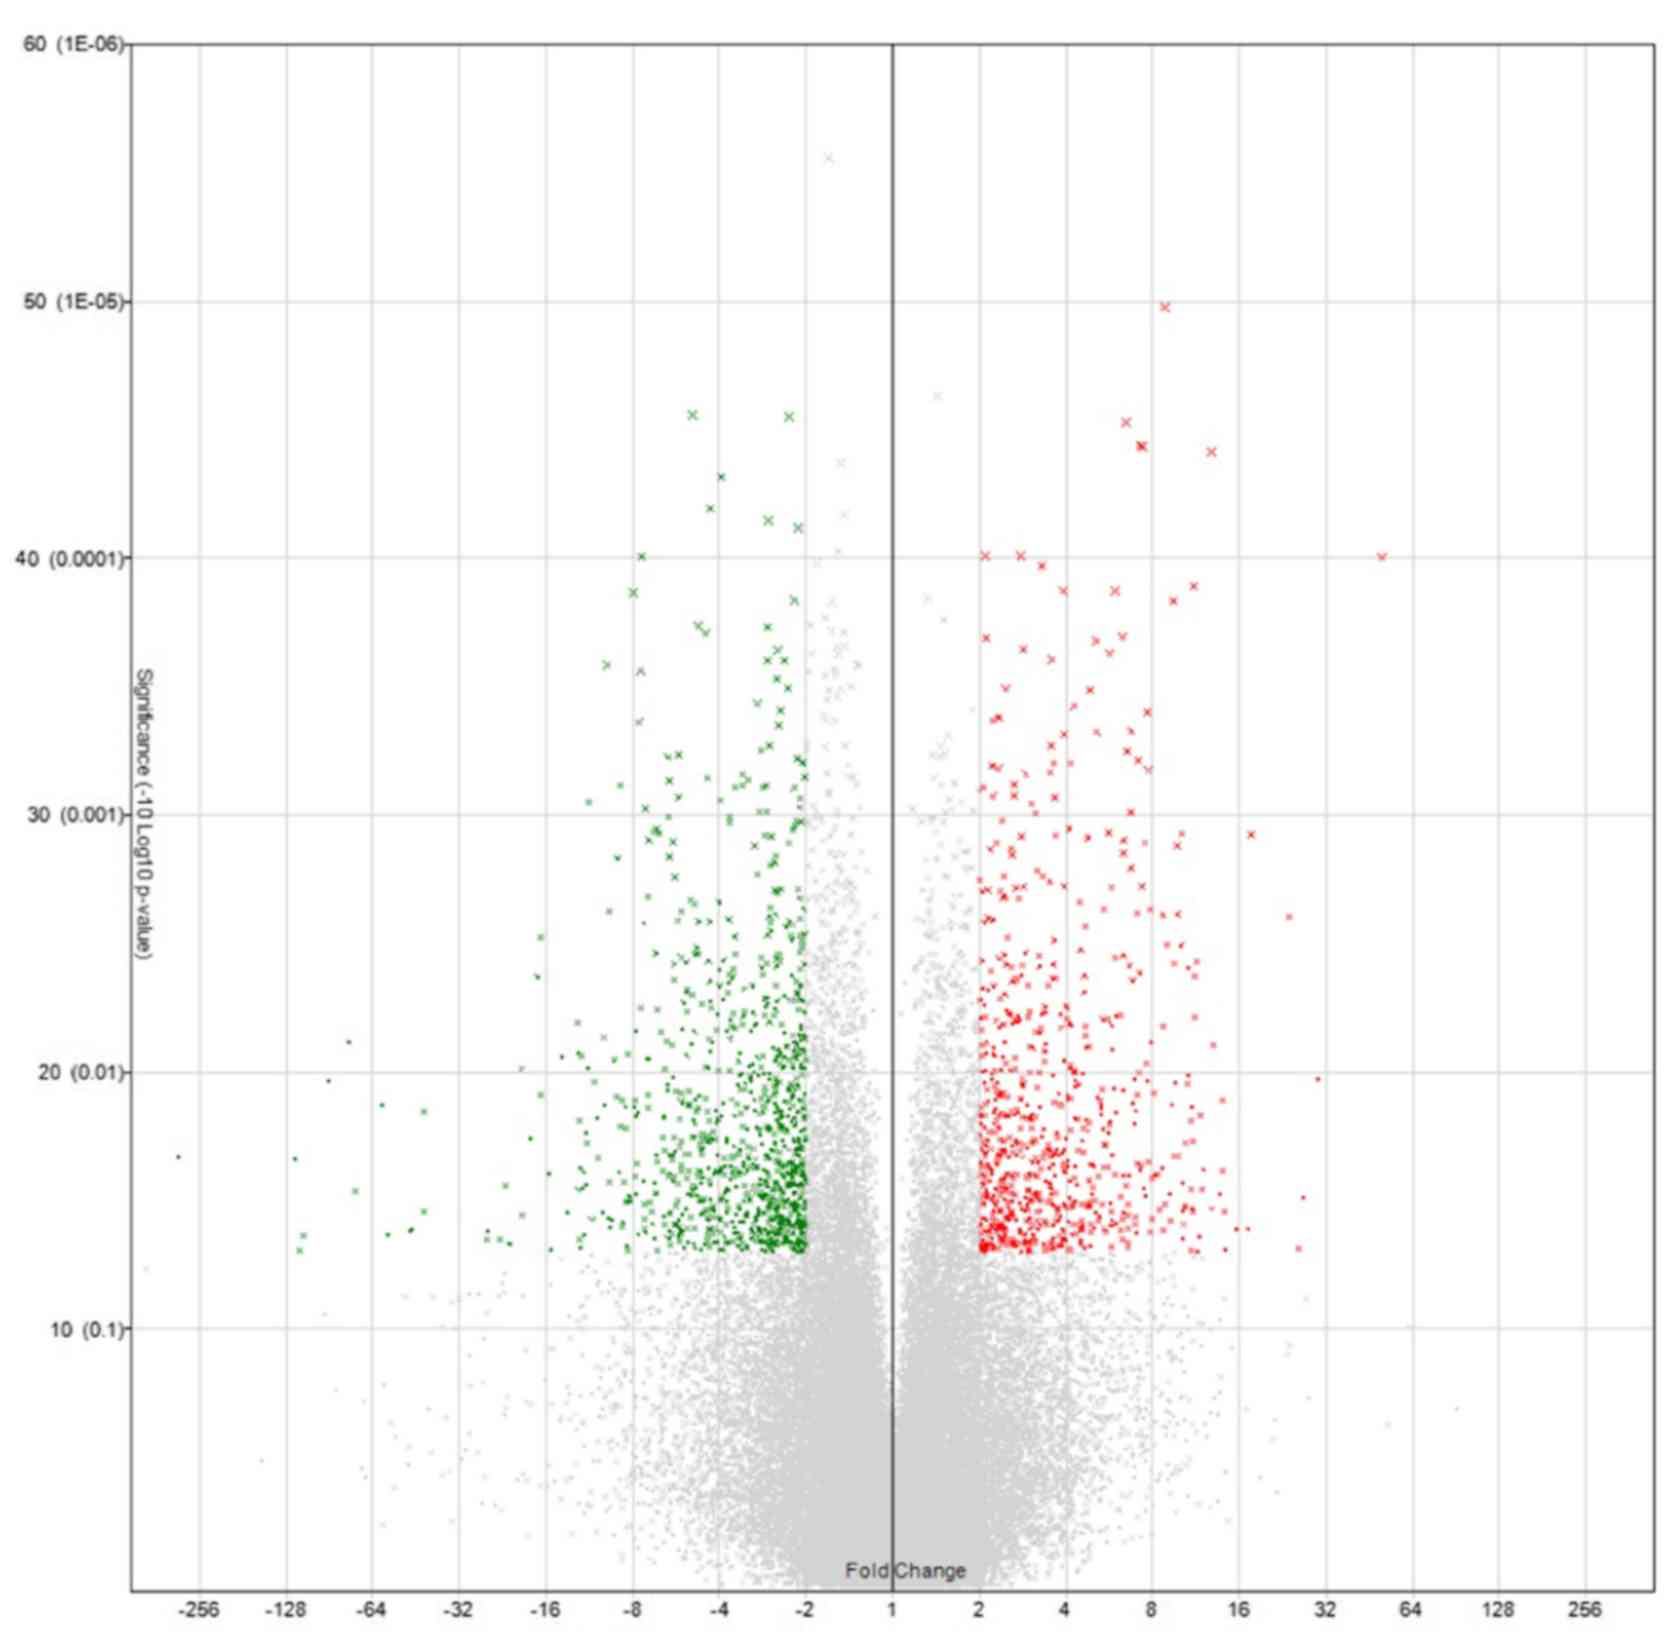
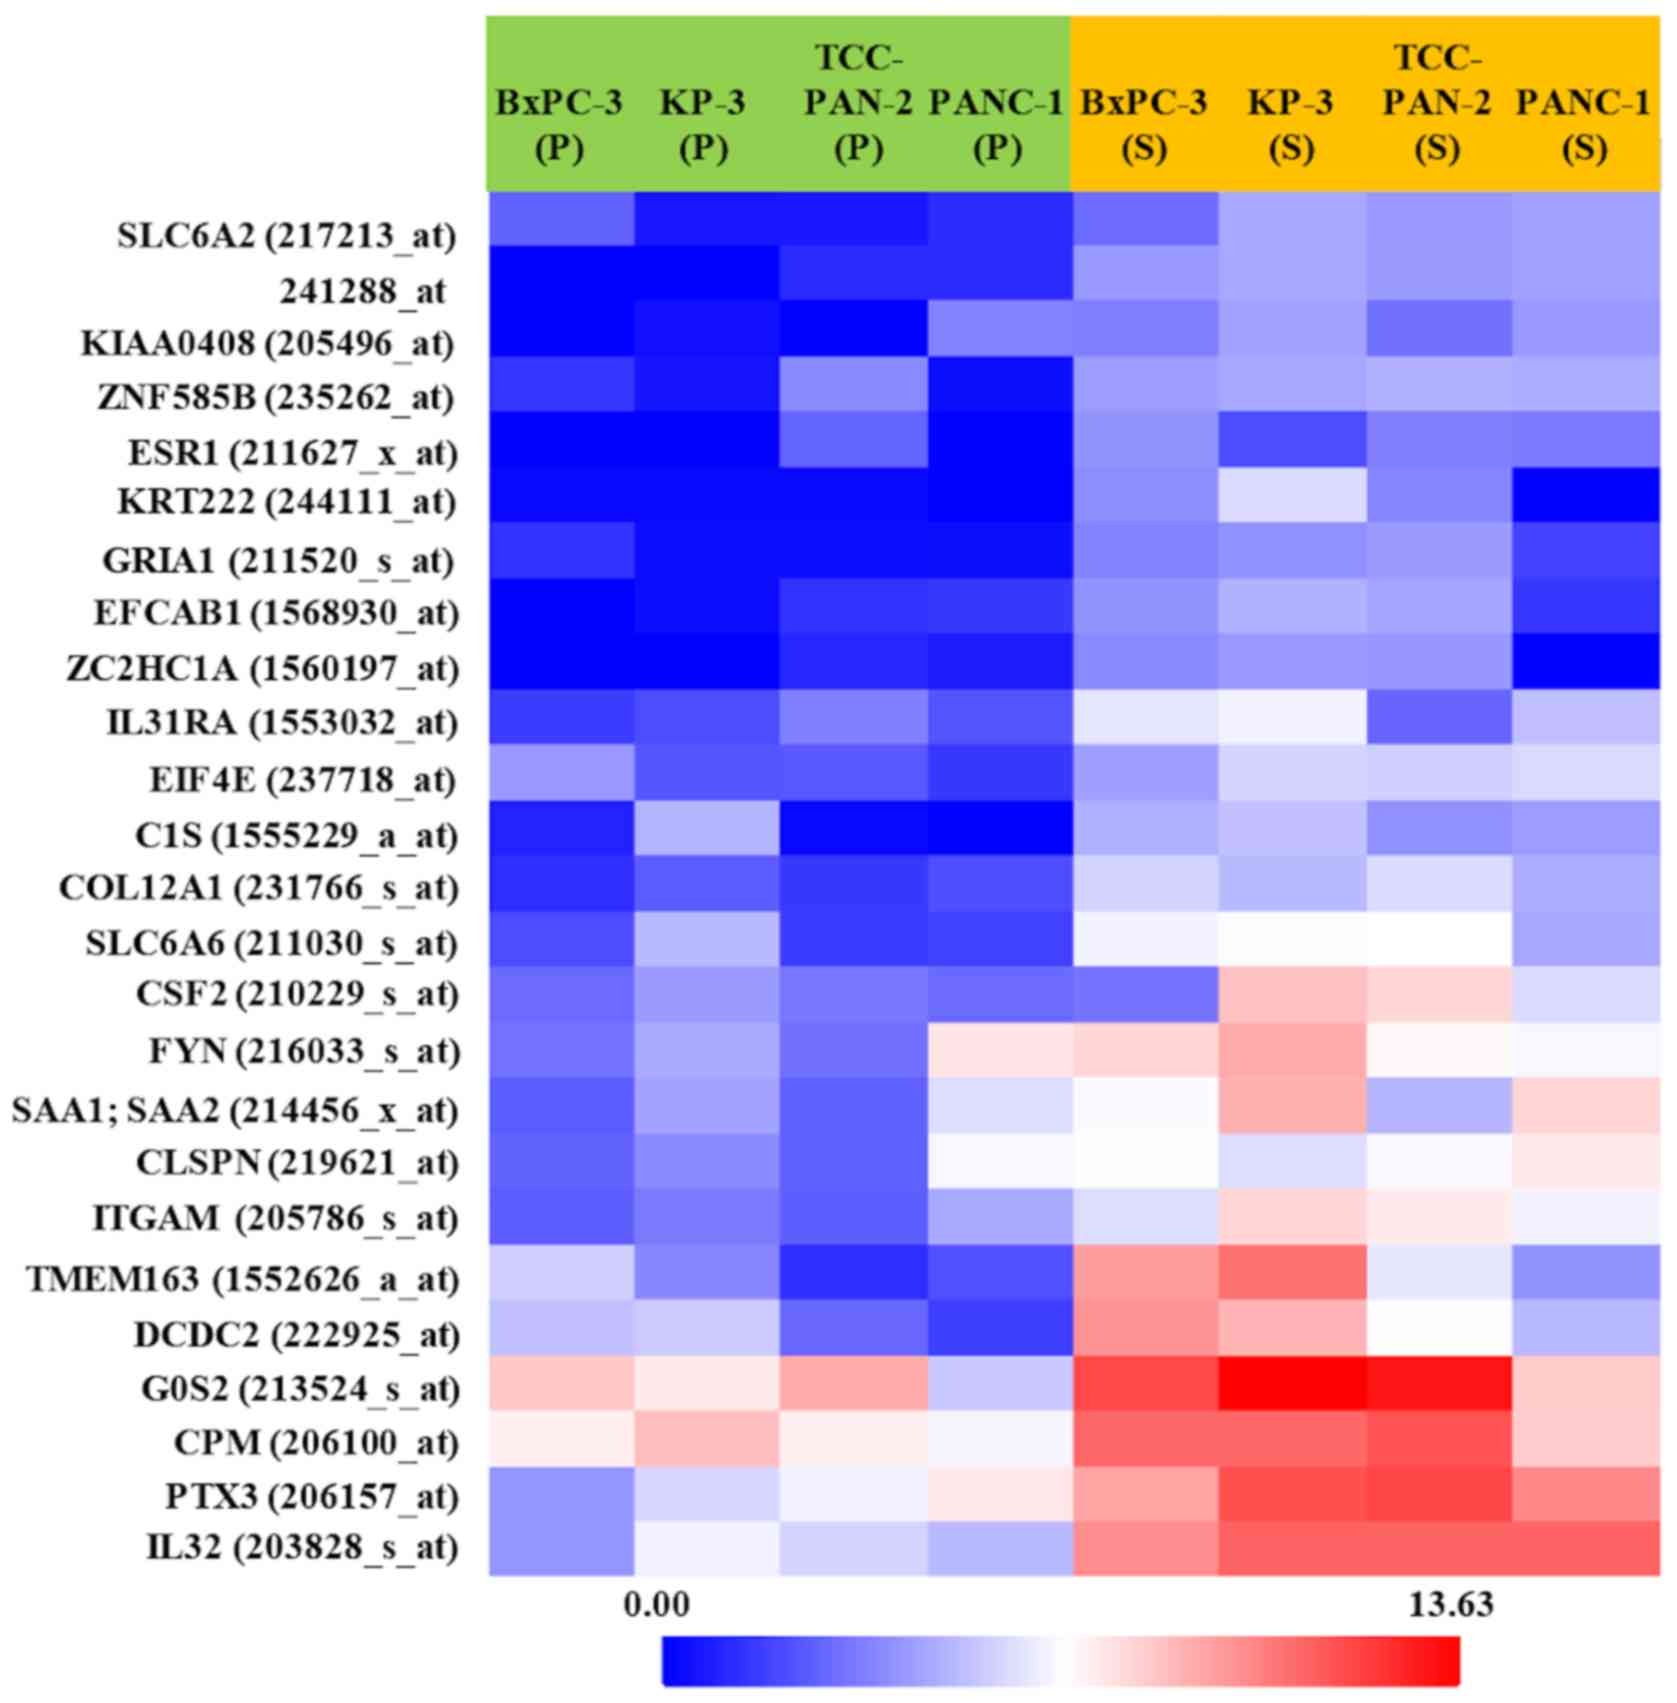
Expression changes of 38,500 genes were analyzed.
These analyzed genes were shown in Volcano plot and heat map
(Figs. 2 and 3). Among them, the genes whose expression
was clearly enhanced in S compared to P in the four highly invasive
cell lines, and not enhanced in either S or P in the two low
invasive cell lines, were roughly extracted. Table II shows the 20 genes selected in
descending order of FC value. Furthermore, genes with a high FC
value in the highly invasive cells, and which had been thought to
be possibly involved in metastasis and invasiveness in previous
studies, were selected. Finally, the genes IL-32, PTX3,
ARHGDIB, and PCYT1B were selected.
| Table II.20 genes arranged in descending order
of FC in a comparison of S and P in the high invasive group. |
Table II.
20 genes arranged in descending order
of FC in a comparison of S and P in the high invasive group.
| Probe set ID | FC (S vs P) | Gene symbol | Entretz Gene ID | Chromosomal
location | UniGene ID |
|---|
| 203828_s_at | 42.25 | IL32 | 9235 | chr16 p13.3 | Hs. 943 |
| 229641_at | 27.23 | CCBE1 | 147372 | chr18 q21.32 | Hs. 34333 |
| 206157_at | 25.48 | PTX3 | 5806 | chr3 q25.32 | Hs. 591286 |
| 230831_at | 23.83 | FRMD5 | 84978 | chr15 q15.3 | Hs. 578544 |
| 1552626_a_at | 21.23 | TMEM163 | 81615 | chr2 q21.3 | Hs. 369471 |
| 206343_s_at | 17.39 | NRG1 | 3084 | chr8 p12 | Hs. 453951 |
| 213524_s_at | 17.05 | G0S2 | 50486 | chr1 q32.2 | Hs. 432132 |
| 203699_s_at | 15.19 | DIO2 | 1734 | chr14 q31.1 | Hs. 202354 |
| 212158_at | 14.85 | SDC2 | 6383 | chr8 q22.1 | Hs. 1501 |
| 222925_at | 13.87 | DCDC2 | 51473 | chr6 p22.3 | Hs. 61345 |
| 205786_s_at | 13.09 | ITGAM | 3684 | chr16 p11.2 | Hs. 172631 |
| 241288_at | 12.99 |
|
| chr6 p21.1 |
|
| 209270_at | 11.94 | LAMB3 | 3914 | chr1 q32.2 | Hs. 497636 |
| 229800_at | 11.88 | DCLK1 | 9201 | chr13 q13.3 | Hs. 507755 |
| 211030_s_at | 11.84 | SLC6A6 | 6533 | chr3 p25.1 | Hs. 529488 |
| 201288_at | 11.65 | ARHGDIB | 397 | chr12 p12.3 | Hs. 504877 |
| 210118_s_at | 11.30 | IL1A | 3552 | chr2 q14.1 | Hs. 1722 |
| 215303_at | 11.22 | DCLK1 | 9201 | chr13 q13.3 | Hs. 507755 |
| 231766_s_at | 10.95 | COL12A1 | 1303 | chr6 q14.1 | Hs. 101302 |
| 208230_s_at | 10.41 | NRG1 | 3084 | chr8 p12 | Hs. 453951 |
Validation by RT-PCR
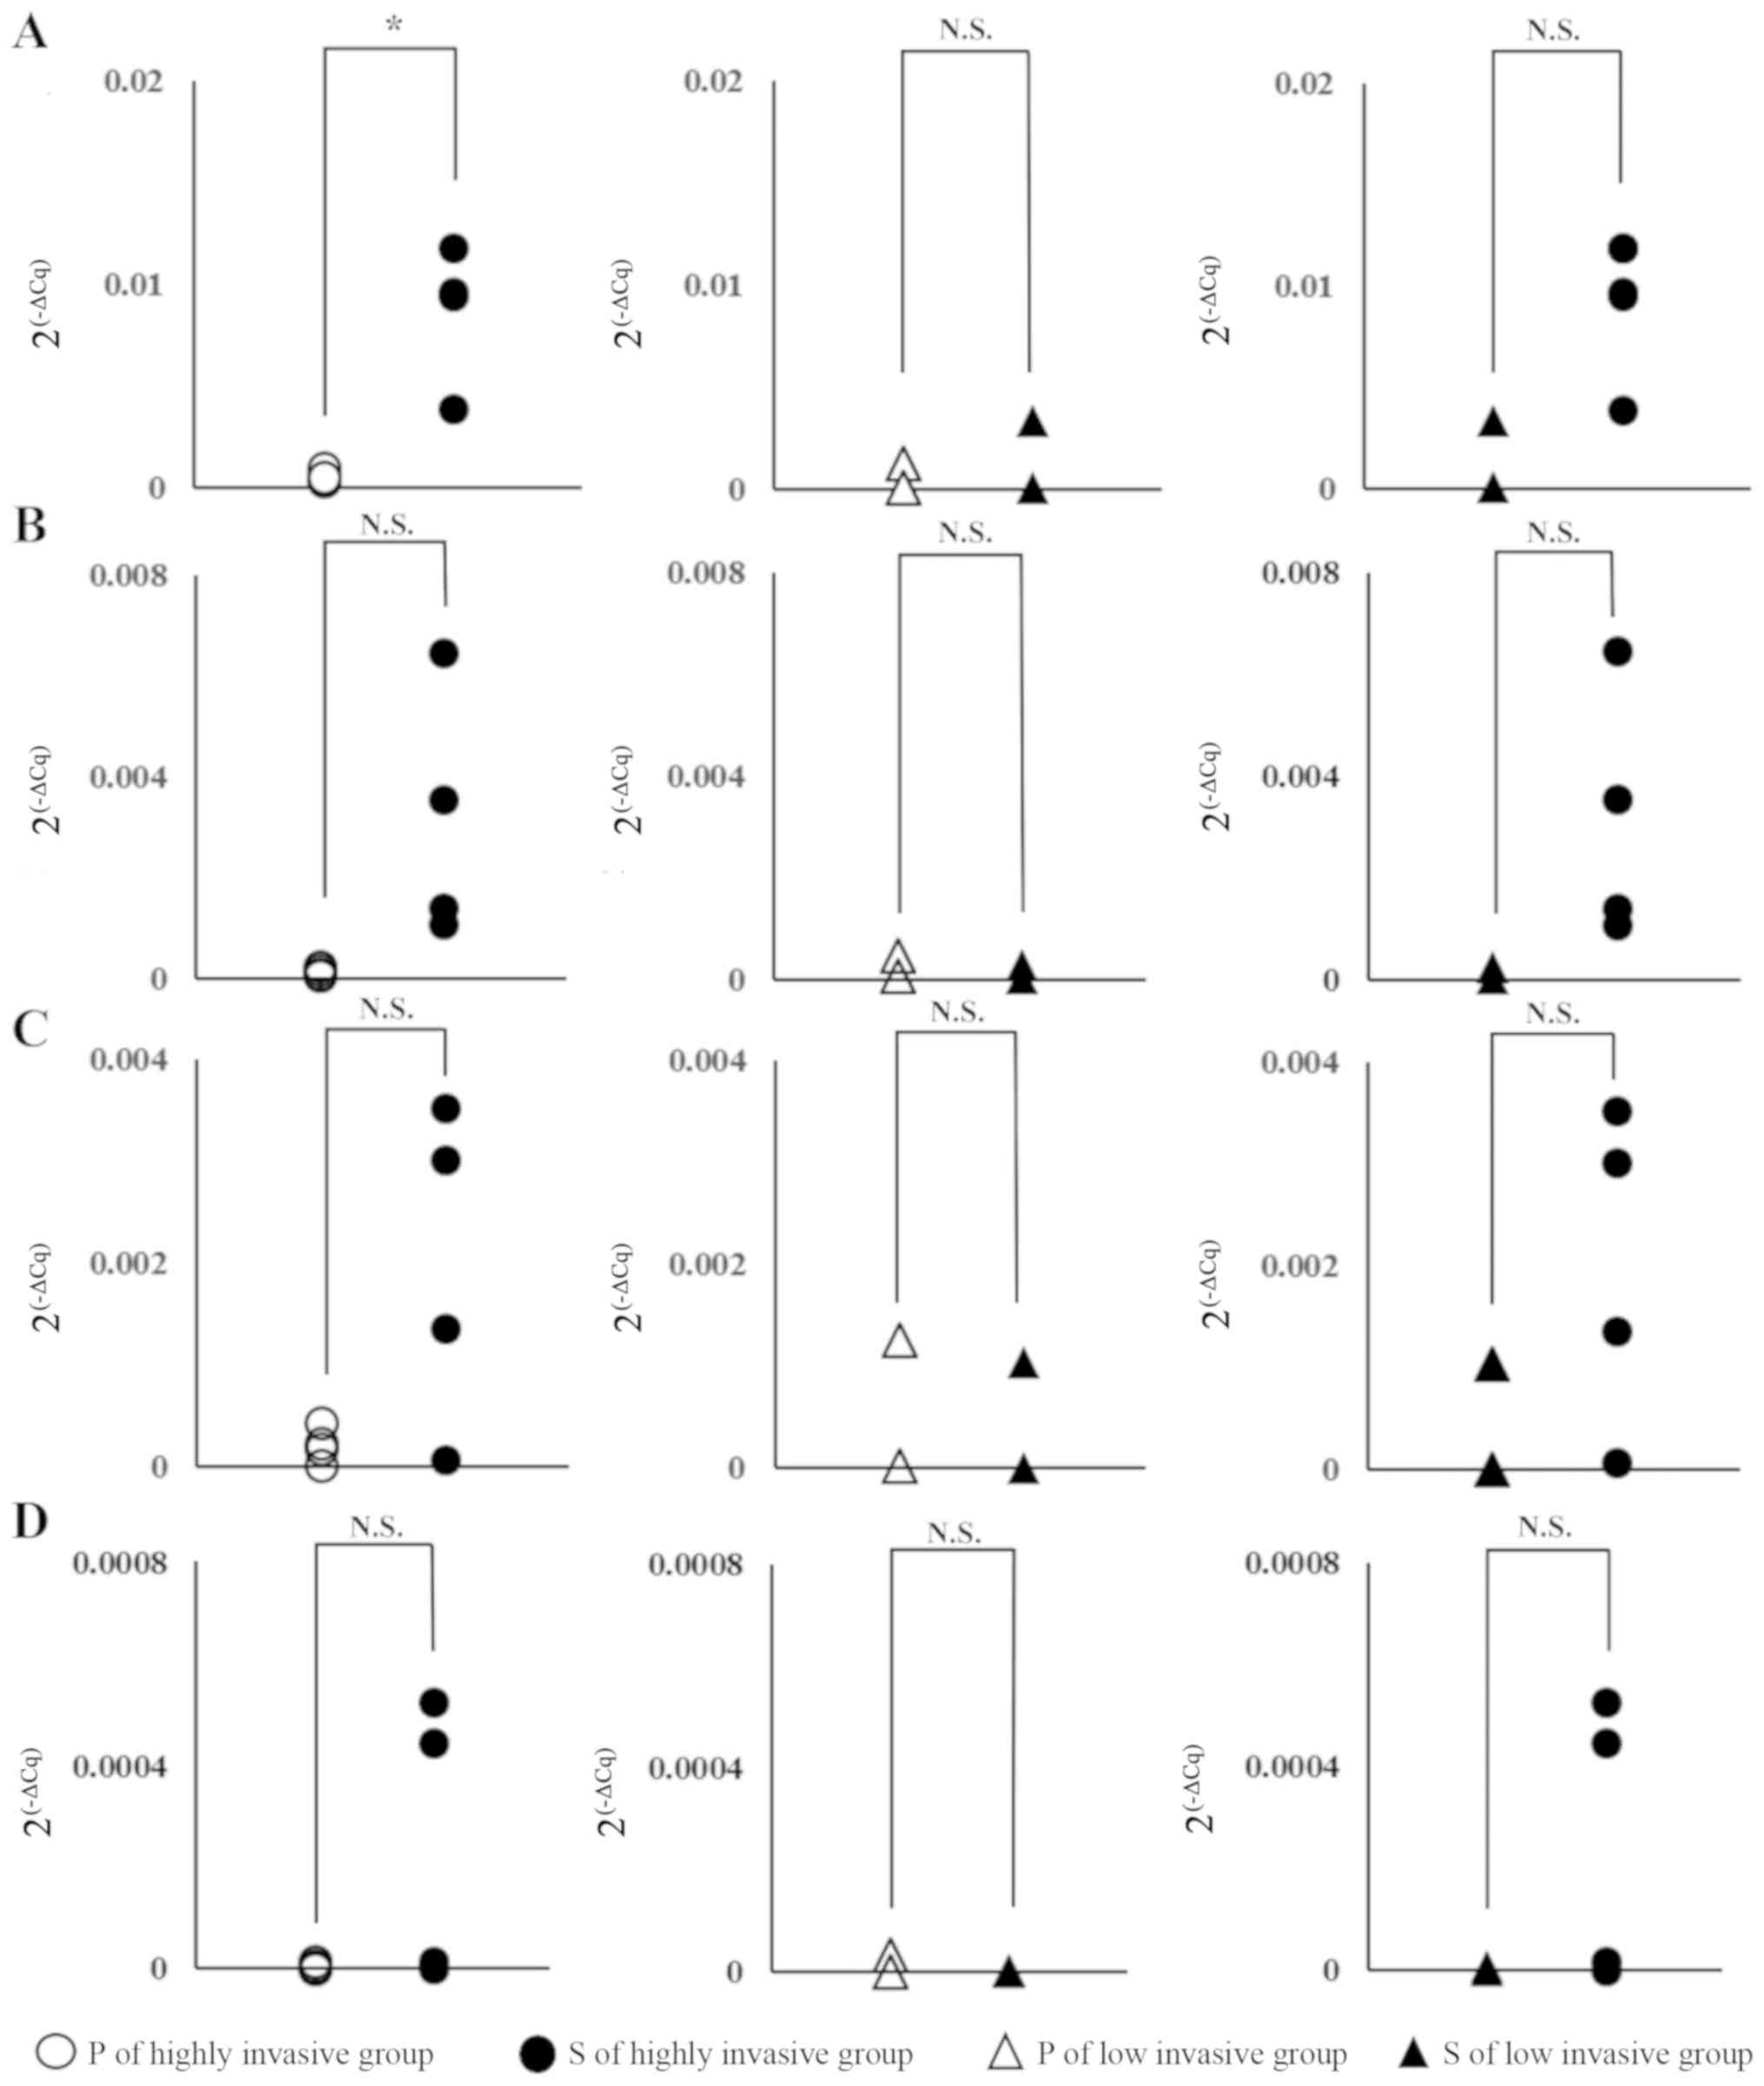
The relative expression levels of the above genes
were measured by RT-PCR. When P and S were compared, although there
was a difference depending on the gene, in the highly invasive
group, expression tended to be enhanced in S cells and, in
particular, IL-32 showed statistically significant
enhancement (Fig. 4, left column).
On the other hand, in the low invasive group, no significant
difference was found between P and S for any of the genes (Fig. 4, middle column). Moreover, in the
highly invasive group S and the low invasive group S cells,
comparison of IL-32 and PTX3 showed a significant
tendency for higher levels of expression in the highly invasive
group. On the other hand, in ARHGHDIB and PCYT1B
cells, although there is a large difference in expression depending
on the cell, each gene expression within BxPC-3 and PANC-1 tended
to be low and no significant difference was observed in the
expression level between S of highly invasive group and P of highly
invasive group or S of low invasive group (Fig. 4, left and right column).
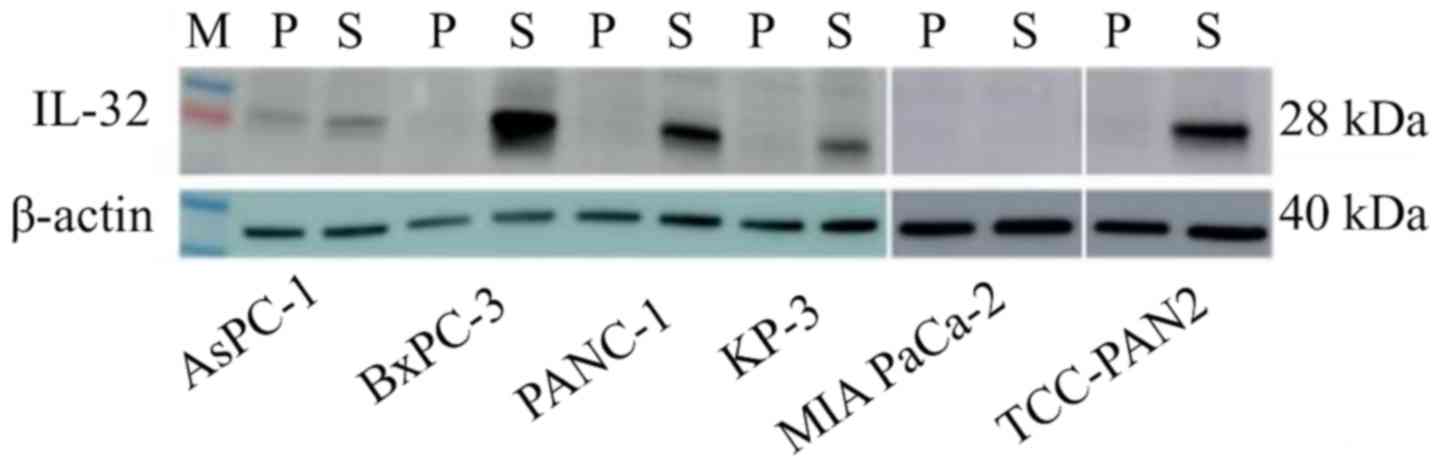
Protein expression
In RT-PCR, IL-32 showed significant gene
expression differences between the highly invasive group and the
low invasive group, so it was judged that this gene is strongly
related to invasiveness. In addition, western blotting was
performed to confirm the expression of the gene at the protein
level (Fig. 5). IL-32 was highly
expressed in the S lines of the highly invasive group, compared to
P. On the other hand, in the low invasive group, expression of
IL-32 was hardly observed in either P or S.
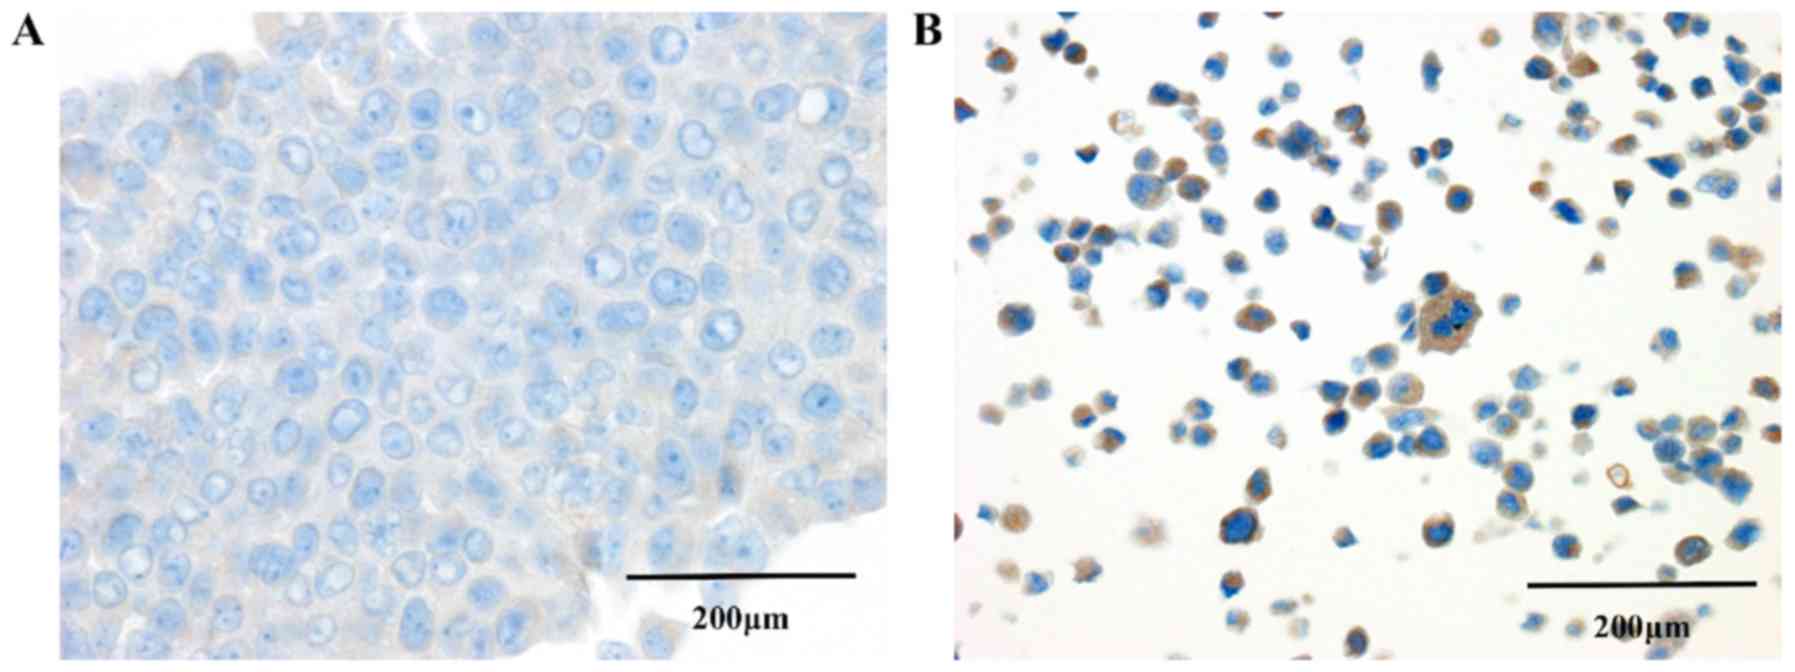
Immunocytochemical study
In order to confirm the expression of IL-32 in
pancreatic cancer cells, immunocytochemical studies were performed
using BxPC-3, which was one of the highly invasive group (Fig. 6). Structural comparison of P and S
showed that P cells had tightly adhered to each other, but the
adherences of S cells were low and showed solitariness. In S cells,
IL-32 expression were observed in the cytoplasm of many cells,
whereas in contrast there was almost no expression in P cells
Discussion
Pancreatic cancer has an extremely poor prognosis
with the highest mortality rate of all neoplasms (10). It is ranked seventh in terms of the
number of cancer deaths and it has been estimated that around
330,000 people died of the disease in 2012. Morbidity rates are
also on the increase and are expected to rank second by 2030
(11). Pancreatic cancer spreads
easily at the early stage of local lesions, often resulting in
distant metastases and, even if the cancer is diagnosed clinically,
often it is already difficult to achieve complete surgical
resection (2). Although various
novel findings on the basis of pancreatic cancer have accumulated
recently, application to the clinical field has not been achieved
completely. Therefore, further studies of the biological properties
of pancreatic cancer that may contribute to the development of
novel therapeutics are needed.
One biological feature of pancreatic cancer is the
dense interstitium, comprising abundant fibrous components and
known as the desmoplastic response. It has been suggested that this
highly fibrotic reaction inhibits the entry of immune cells and
anticancer drugs into the tumor tissue. This reaction may
contribute to the progression of pathogenesis through certain cell
signaling pathways (12). On the
other hand, the desmoplasia might be expected to have the opposite
effect on tumor progression, especially invasion and metastasis.
However, in fact, while pancreatic cancer cells form a hard stroma
in tumor tissue, the tumor cells infiltrate this easily. So what
are the mechanisms and factors involved in regulating this high
invasiveness? Many factors that regulate the cancer cell invasion
have been reported for pancreatic cancer, including MMP, TGF-β and
other molecules (4,5). Unfortunately, these alone cannot
explain the high invasiveness of pancreatic cancer. Therefore, we
conducted research using a new method to identify factors that
control the high invasiveness of pancreatic cancer cells.
In most studies of the molecules involved in
invasiveness, the predicted factors have been selected first and
examined to determine their influence on invasiveness. However,
this approach requires a substantial amount of time and effort to
identify the factors involved in invasion. In order to identify
candidate molecules from a large number of factors that may be
involved, it may be considered best and effective to find these
target molecules by comprehensively analyzing gene expression in
cells with varying degrees of invasiveness. In this study, we used
the IA method to establish four highly invasive cell lines from six
pancreatic cancer cell lines. Although, in each case, the original
P cell line is an established cell line, it may be in a state in
which cell populations with various characteristics are mixed. By
selecting highly invasive cell from the total population, it may be
possible to investigate changes occurring in these cells. On the
other hand, the lines AsPC-1 and MIA PaCa-2 did not provide cells
with enhanced invasiveness. One of them, MIA PaCa-2, has been
reported to have low metastatic potential in a liver metastasis
assay in nude mice (13) and it may
be that this cell line is inherently inferior in its ability to
metastasize or invade.
From a comprehensive genetic analysis, the
expression levels of four genes, IL-32, PTX3, ARHGDIB and
PCYT1B, were found to be enhanced in all S cells showing
high invasiveness, greater than the original P cells with low
invasive potential. Validation with real time PCR also confirmed
that these genes had tended to increased expression in highly
invasive cells. Above all, the upregulation of IL-32 gene
expression was remarkable, 42 times in terms of fold-change. In
addition, IL-32 was markedly increased in highly invasive cells at
the level of protein expression. Furthermore, in our another
experiment, immunohistochemical examination of IL-32 in pancreatic
cancer tissue showed high expression in tumor cells and many tumor
cells at the invasive front showed a tendency for high IL-32
expression, but only a small number of cells expressed IL-32 in
normal tissues (data not shown). These findings suggest that the
invasive properties of tumor cell are strongly correlated with
IL-32 expression.
IL-32 is a relatively recently discovered member of
the IL family and was reported in 2005 as an inflammatory cytokine
involved in the induction of TNF-α and IL-8 (14). So far, nine isoforms (α, β, γ, δ, ε,
ζ, η, θ, small) have been reported as splice variants. Recently,
several papers have reported the association between IL-32 and
tumors, such as involvement in the development and invasiveness of
hepatocellular carcinoma (15) and
breast cancer (16). On the other
hand, it has also been reported that cases of renal cell carcinoma
with high IL-32 expression have a better prognosis (17). These apparently contradictory results
may stem from differences not only in the biological properties of
individual isoforms but also in the mechanisms of expression or
action, which may vary among different tumor tissues (18). Regarding the involvement of IL-32 in
pancreatic diseases, it has reported that expression of IL-32 was
enhanced in chronic pancreatitis and, especially, in pancreatic
cancer cells (19). On the other
hand, it has also been reported that overexpression of IL-32α
suppresses EMT in pancreatic cancer (20). As a general view of the association
between IL-32 and EMT, IL-32γ promoted EMT via Akt and NFκB
signaling, and IL-32β is via STAT3, whereas IL-32α and IL-32θ are
thought to suppress STAT3 signaling and then block EMT. Thus, each
isoform of IL-32 seems to exhibit various functions in an
organ-specific manner.
In conclusion, IL-32 is known to be involved in many
neoplastic lesions and also in disease progression in pancreatic
cancer. In our study, among those cells showing increased
expression in common with a high invasiveness in the invasion
assay, it was revealed that IL-32 expression has a positive
correlation with invasiveness. In the future, it will be necessary
to confirm that IL-32 expression truly controls the invasiveness of
pancreatic cancer. For example, it is necessary to determine
whether the invasion ability can be reduced by knockdown using
siRNA against IL-32 and whether or not low invasive cells in
which IL-32 is forcibly expressed have enhanced invasiveness.
Evaluating the expression of IL-32 comparing high metastatic
pancreatic cancer and normal tissue is also one of the things we
should do. We would like to accumulate many cases and examine the
behavior of IL-32 at each stage of pancreatic cancer. In addition,
it is necessary to investigate in detail what position IL-32 plays
in the signaling pathways for invasion and what role it plays. We
are currently studying this and hypothesized that although details
are under study, IL-32 improves invasion ability of pancreatic
cancer cell through upregulating EMT. We also assume that NFĸB and
STAT3 signal pathway may also involve in increased invasiveness. We
will make these hypotheses more systematic in the future
report.
Acknowledgements
The authors would like to thank Miss Sayoko
Sumiyoshi and Miss Miho Metoki (Department of Diagnostic Pathology,
Faculty of Medicine, Academic Assembly, University of Toyama), who
are medical students, for providing useful advice through their
research on IL-32.
Funding
This study was supported by Japan Society for the
Promotion of Science (JSPS) Grants-in-Aid for Scientific Research
(KAKENHI; grant no. 16K08707).
Availability of data and materials
The datasets used and/or analyzed during the present
study are available from the corresponding author on reasonable
request.
Authors' contributions
KT and JI designed the study, and KT mainly
performed the experiments and wrote the initial draft of the
manuscript. JI also contributed to interpretation of data, and
assisted in the preparation of the manuscript. AS, HH and TNi
engaged in the collection of some experimental data and they also
gave technical and intellectual advice on the acquired data,
especially in the interpretation of microarray assays and RT-PCR.
AN, ST, TM and TNa advised on the construction of the study design
and especially on the interpretation of data on invasion assessment
and critically reviewed the manuscript. All authors have read and
admitted the final manuscript.
Ethics approval and consent to
participate
Not applicable.
Patient consent for publication
Not applicable.
Competing interests
The authors declare that they have no competing
interests.
References
|
1
|
Vincent A, Herman J, Schulick R, Hruban RH
and Goggins M: Pancreatic cancer. Lancet. 378:607–620. 2011.
View Article : Google Scholar : PubMed/NCBI
|
|
2
|
Kleeff J, Korc M, Apte M, La Vecchia C,
Johnson CD, Biankin AV, Neale RE, Tempero M, Tuveson DA, Hruban RH,
et al: Pancreatic cancer. Nat Rev Dis Primers. 2:160222016.
View Article : Google Scholar : PubMed/NCBI
|
|
3
|
Pelosi E, Castelli G and Testa U:
Pancreatic Cancer: Molecular characterization, clonal evolution and
cancer stem cells. Biomedicines. 5:52017.
|
|
4
|
Luo J, Chen XQ and Li P: The role of TGF-β
and its receptors in gastrointestinal cancers. Transl Oncol.
12:475–484. 2019. View Article : Google Scholar : PubMed/NCBI
|
|
5
|
Miyazono K, Katsuno Y, Koinuma D, Ehata S
and Morikawa M: Intracellular and extracellular TGF-β signaling in
cancer: Some recent topics. Front Med. 12:387–411. 2018. View Article : Google Scholar : PubMed/NCBI
|
|
6
|
Kawamata H, Furihata T, Omotehara F, Sakai
T, Horiuchi H, Shinagawa Y, Imura J, Ohkura Y, Tachibana M, Kubota
K, et al: Identification of genes differentially expressed in a
newly isolated human metastasizing esophageal cancer cell line,
T.Tn-AT1, by cDNA microarray. Cancer Sci. 94:699–706. 2003.
View Article : Google Scholar : PubMed/NCBI
|
|
7
|
Jones S, Zhang X, Parsons DW, Lin JC,
Leary RJ, Angenendt P, Mankoo P, Carter H, Kamiyama H, Jimeno A, et
al: Core signaling pathways in human pancreatic cancers revealed by
global genomic analyses. Science. 321:1801–1806. 2008. View Article : Google Scholar : PubMed/NCBI
|
|
8
|
Iacobuzio-Donahue CA, Velculescu VE,
Wolfgang CL and Hruban RH: Genetic basis of pancreas cancer
development and progression: Insights from whole-exome and
whole-genome sequencing. Clin Cancer Res. 18:4257–4265. 2012.
View Article : Google Scholar : PubMed/NCBI
|
|
9
|
Livak KJ and Schmittgen TD: Analysis of
relative gene expression data using real-time quantitative PCR and
the 2(-Delta Delta C(T)) Method. Methods. 25:402–408. 2001.
View Article : Google Scholar : PubMed/NCBI
|
|
10
|
Ilic M and Ilic I: Epidemiology of
pancreatic cancer. World J Gastroenterol. 22:9694–9705. 2016.
View Article : Google Scholar : PubMed/NCBI
|
|
11
|
Rahib L, Smith BD, Aizenberg R, Rosenzweig
AB, Fleshman JM and Matrisian LM: Projecting cancer incidence and
deaths to 2030: The unexpected burden of thyroid, liver, and
pancreas cancers in the United States. Cancer Res. 74:2913–2921.
2014. View Article : Google Scholar : PubMed/NCBI
|
|
12
|
Laklai H, Miroshnikova YA, Pickup MW,
Collisson EA, Kim GE, Barrett AS, Hill RC, Lakins JN, Schlaepfer
DD, Mouw JK, et al: Genotype tunes pancreatic ductal adenocarcinoma
tissue tension to induce matricellular fibrosis and tumor
progression. Nat Med. 22:497–505. 2016. View Article : Google Scholar : PubMed/NCBI
|
|
13
|
Sugimoto Y, Morita R, Hikiji K, Imura G,
Ogata Y, Yasuda D, Kono A and Iguchi H: Alteration of the CDKN2A
gene in pancreatic cancers: Is it a late event in the progression
of pancreatic cancer? Int J Oncol. 13:669–676. 1998.PubMed/NCBI
|
|
14
|
Kim SH, Han SY, Azam T, Yoon DY and
Dinarello CA: Interleukin-32: A cytokine and inducer of TNFalpha.
Immunity. 22:131–142. 2005. View Article : Google Scholar : PubMed/NCBI
|
|
15
|
Kang YH, Park MY, Yoon DY, Han SR, Lee CI,
Ji NY, Myung PK, Lee HG, Kim JW, Yeom YI, et al: Dysregulation of
overexpressed IL-32α in hepatocellular carcinoma suppresses cell
growth and induces apoptosis through inactivation of NF-κB and
Bcl-2. Cancer Lett. 318:226–233. 2012. View Article : Google Scholar : PubMed/NCBI
|
|
16
|
Wang S, Chen F and Tang L: IL-32 promotes
breast cancer cell growth and invasiveness. Oncol Lett. 9:305–307.
2015. View Article : Google Scholar : PubMed/NCBI
|
|
17
|
Lee HJ, Liang ZL, Huang SM, Lim JS, Yoon
DY, Lee HJ and Kim JM: Overexpression of IL-32 is a novel
prognostic factor in patients with localized clear cell renal cell
carcinoma. Oncol Lett. 3:490–496. 2012. View Article : Google Scholar : PubMed/NCBI
|
|
18
|
Sloot YJE, Smit JW, Joosten LAB and
Netea-Maier RT: Insights into the role of IL-32 in cancer. Semin
Immunol. 38:24–32. 2018. View Article : Google Scholar : PubMed/NCBI
|
|
19
|
Nishida A, Andoh A, Inatomi O and Fujiyama
Y: Interleukin-32 expression in the pancreas. J Biol Chem.
284:17868–17876. 2009. View Article : Google Scholar : PubMed/NCBI
|
|
20
|
Chen J, Wang S, Su J, Chu G, You H, Chen
Z, Sun H, Chen B and Zhou M: Interleukin-32α inactivates JAK2/STAT3
signaling and reverses interleukin-6-induced epithelial-mesenchymal
transition, invasion, and metastasis in pancreatic cancer cells.
OncoTargets Ther. 9:4225–4237. 2016. View Article : Google Scholar
|