Introduction
Colorectal cancer (CRC) is the third most common
cause of cancer-associated mortality worldwide and is a common
neoplastic disease in the United State in 2020 (1,2).
Similarly to numerous other types of cancer, the development of CRC
from benign adenoma to malignant carcinoma is thought to result
from the long-term accumulation of mutations during the course of
disease progression (3). Since the
survival rate of patients with CRC is closely associated with the
time of diagnosis and the stage of the tumor (4), it is increasingly important to identify
specific factors involved in disease progression that serve as
prognostic markers. A good experimental model that covers a wide
range of malignancies would facilitate the identification and
validation of these CRC markers.
It has been proposed that cancer stem cells (CSCs),
representing a subpopulation of cancer cells with self-renewal
features that promote tumor growth and resistance to chemotherapy,
are the most malignant subset of cells and are responsible for the
recurrence and metastasis of CRC (5,6). Sphere
forming assay is a method that has been commonly used to identify
CSCs (7–13). The history of the method can be
traced to the late 1960s, when it was used to study neurogenesis in
neural stem cells (7). Specifically,
the sphere-forming assay was initially used to identify cells with
higher neurogenic potential with respect to both clonality and
multipotent differentiation (8).
This assay has now been employed to investigate stem cells in a
variety of normal tissues (8).
Scientists have adopted the sphere-forming assay to form
tumorspheres for numerous types of cancer, including prostate
(9) brain (10), breast (11) and colorectal (12,13)
cancer. These tumorspheres have been reported to have similar
self-renewal characteristics and to express the same canonical
stemness markers, such as Nanog, as normal stem cells (14). A limitation, however, exists for the
use of tumorspheres induced by sphere-forming assay as platforms to
study CRC progression. Because these cancer cell lines are normally
maintained in long-term adherent culture, the phenotypes induced by
sphere-forming assays might only reflect properties of transient
states (due to loss of attachment, difference in growth factor
composition, etc), and not stable properties of the cells (15).
In order to overcome the aforementioned limitations,
the present study used a repeated sphere-forming assay as a
strategy to select a malignant subpopulation that was
phenotypically stable. Conceptually, this strategy is similar to
the previous establishment of a series of metastatic cell lines
using repeated invasion assays (16,17).
Such model cell lines have been used to identify genes or cellular
phenotypes that are associated with metastasis (17,18). In
the present study, as opposed to invasion assays, sphere-forming
assays were used as repeated method for the generation of malignant
lines. Through this repeated assay, a malignant clone from the CRC
HCT116 cell line has been generated. RNA sequencing (RNA-seq) was
used to compare transcriptomes between the selected clone and its
parental cell line, and to identify any genes responsible for
malignancy, both in vitro and in vivo.
Materials and methods
Cell culture, sphere-forming assay and
preparation of sphere-derived adherent cells (SDACs)
The human CRC HCT116 cell line was obtained from the
Bioresource Collection and Research Center (Hsinchu, Taiwan) and
maintained in McCoy's 5A medium (Gibco; Thermo Fisher Scientific,
Inc.) supplemented with 10% FBS (HyClone; GE Healthcare Life
Sciences) and 1% penicillin/streptomycin at 37°C in a humidified
incubator with 5% CO2. For sphere formation, cells were
plated at a density of 1,000 cells/well in 24-well ultra-low
attachment plates (Corning, Inc.) and cultured in stem cell medium
for 14 days at the aforementioned conditions. The stem cell medium
consisted of serum-free DMEM/F12 medium (1:1; Gibco; Thermo Fisher
Scientific, Inc.) supplemented with 50X B27 supplement (Gibco;
Thermo Fisher Scientific, Inc.), 100X minimum essential medium
non-essential amino acids (Gibco; Thermo Fisher Scientific, Inc.),
100 mM sodium pyruvate (Gibco; Thermo Fisher Scientific, Inc), 200
mM L-glutamine (Gibco; Thermo Fisher Scientific, Inc), 25 mg/ml
insulin (Gibco; Thermo Fisher Scientific, Inc.), 20 ng/ml epidermal
growth factor, 10 ng/ml basic fibroblast growth factor and 100 U/ml
penicillin/streptomycin. To prepare SDACs, TrypLE Express (Gibco;
Thermo Fisher Scientific, Inc.) was used to dissociate spheres by
pipetting up and down repeatedly, and single cells were collected
by centrifugation at 750 × g for 5 min in room temperature.
Subsequently, the cells were resuspended in DMEM/F12 medium
supplemented with 10% FBS and 1% penicillin/streptomycin, and
cultured for 14 days at 37°C in a humidified incubator with 5%
CO2 before the next sphere-forming assay round. For the
time-course experiment to characterize the transient properties of
SDCSCs, SDACs were prepared from G1S cells (using TrypLE Express to
dissociate spheres and centrifugation at 750 × g for 5 min to
collect single cells) and resuspended in DMEM/F12 medium
supplemented with 10% FBS and 1% penicillin/streptomycin, and
cultured for 1, 3, 7 and 14 days before being harvested for total
RNA and protein lysates for further analysis.
Microscopy
Phase-contrast images of sphere-derived CSC-like
cells (SDCSCs) and SDACs were obtained using an inverted Axio
Observer Z1 fluorescence microscope (Zeiss AG) (×10/0.30, ×63/0.75)
with a CoolSnap HQ2 camera (Photometrics; Taiwan Instrument Co.,
Ltd.). ZEN 2 (Zeiss AG) was used for image acquisition and
subsequent analysis.
RNA extraction and reverse
transcription-quantitative PCR (RT-qPCR)
Total RNA was extracted from human CRC HCT116 cell
line using phenol (Sigma-Aldrich; Merck KGaA)/chloroform
(Avantor®) and reverse-transcribed (25°C for 5 min; 46°C
for 20 min; and 95°C for 1 min) into cDNA using the iScript cDNA
Synthesis kit (Bio-Rad Laboratories, Inc.). qPCR was performed
using a SYBR Green kit (Roche Diagnostics) on a CFX96 qRT-PCR
machine (Bio-Rad Laboratories, Inc.) as follows: 95°C for 10 sec;
57°C for 10 sec; 72°C for 30 sec; 40 cycles. Relative mRNA levels
were calculated according to the 2−ΔΔCT method (19). GAPDH was used as the
housekeeping gene. To validate the CSC-like properties of SDCSCs
and the reliability of our assay, the canonical stemness marker
Nanog was used, as it has been known to be upregulated in CRC CSCs
(13). Another two stemness markers,
octamer-binding transcription factor 4 (OCT4) and leucine-rich
repeat-containing G-protein coupled receptor 5 (LGR5), were used
for further confirmation. The primer sequences were as follows:
GAPDH forward, 5′-TGGTGAAGCAGGCGTCGGAG-3′ and reverse,
5′-GGTGGGGGACTGAGTGTGGC-3′; OCT4 forward,
5′-AGCTTGGGCTCGAGAAGGAT-3′ and reverse, 5′-AGAGTGGTGACGGAGACAGG-3′;
NANOG forward, 5′-ACAACTGGCCGAAGAATAGCA-3′ and reverse,
5′-GGTTCCCAGTCGGGTTCAC-3′; LGR5 forward, 5′-CTCCCAGGTCTGGTGTGTTG-3′
and reverse, 5′-GAGGTCTAGGTAGGAGGTGAAG-3′; and dipeptidase 1
(DPEP1) forward, 5′-CAAGTGGCCGACCATCTGG-3′ and reverse,
5′-GGGACCCTTGGAACACCATC-3′.
RNA-seq
Total RNA from human CRC HCT116 cell line was
determined by measuring the optical density (OD)260/OD280 (>1.8)
and OD260/OD230 (>1.6), respectively. Yield and quality were
assessed using an Agilent 2100 Bioanalyzer (Agilent Technologies,
Inc. USA). After the sample quality control procedures, mRNA from
human cell line HCT116 was enriched using oligo(dT) beads. First,
mRNA was fragmented randomly by adding fragmentation buffer (New
England BioLabs, Inc.), and then cDNA was synthesized using an mRNA
template and random hexamer primers, after which a custom
second-strand synthesis buffer (Illumina, Inc.), dNTPs, RNase H and
DNA polymerase I (New England BioLabs, Inc.) were added to initiate
second-strand synthesis. Secondly, after a series of terminal
repair reactions, ligation and sequencing adaptor ligation, the
double-stranded cDNA library was completed through size selection
and PCR enrichment. The libraries were pooled and analyzed on an
Illumina sequencer using the paired-end 150 bp RapidRun format to
generate 20 million total reads per sample. Raw RNA-seq reads from
the sequencing instrument were first trimmed based on the
low-quality tranche and were checked. Spliced Transcripts Alignment
to a Reference software STAR_2.5.2b (Illumina, Inc.) was used to
map spliced short-reads (RNA-seq reads) to the reference genome
(Ensembl GRCh38; http://asia.ensembl.org/Homo_sapiens/Info/Index).
Based on spliced alignments, transcript reconstruction and
estimations of transcript abundance were conducted using Cuffquant
(http://cole-trapnell-lab.github.io/cufflinks/). Gene
expression was normalized by calculating the number of RNA-seq
fragments per kilobase of transcript per total million fragments
mapped. Cuffdiff (version v2.2.1) was used to test the statistical
significance of observed changes and identify genes that were
differentially regulated at the transcriptional or
post-transcriptional levels (http://cole-trapnell-lab.github.io/cufflinks/).
Western blotting
Cells were washed with ice-cold PBS. Total protein
was extracted with radioimmunoprecipitation assay buffer (EMD
Millipore) supplemented with protease and phosphatase inhibitors
(Roche Diagnostics GmbH). Protein concentrations were determined
using a Bradford protein assay kit (Bio-Rad Laboratories, Inc.). A
total of 30 µg protein/lane was separated on a 10% gel using
SDS-PAGE and transferred onto Immunobilon-P polyvinylidene
difluoride membranes (Merck KGaA). The membranes were washed in PBS
with 10% Tween 20 (PBST). After blocking with 5% skimmed milk in
PBST for 1 h at room temperature, the membranes were incubated with
anti-Nanog (1:500; cat. no. SC-293121; Santa Cruz Biotechnology,
Inc.), anti-DPEP1 (1:1,000; cat. no. 38797; Signalway Antibody LLC)
and anti-GAPDH (1:5,000; cat. no. GTX627408; GeneTex International
Corporation) antibodies overnight at 4°C. After incubation with the
corresponding horseradish peroxidase-conjugated secondary antibody
(anti-rabbit, cat. no. A120-101P; anti-mouse, cat. no. A90-116P;
1:5,000; Bethyl Laboratories, Inc.) for 1 h at room temperature,
immunoreactive proteins were detected using an enhanced
chemiluminescence detection system (EMD Millipore).
Lentivirus production and
transduction
The stable embryonic kidney cell 293T obtained from
the Bioresource Collection and Research Center was used for
lentiviral production. The short hairpin (sh)RNA plasmids targeting
DPEP1 (shDPEP1 #1 is clone TRCN0000046649 and shDPEP1 #2 is clone
TRCN0000441304) and non-targeting shRNA plasmids (pLAS.Void;
scrambled sequence, 5′-AGTTCAGTTACGATATCATGT-3′) were obtained from
the National RNAi Core Facility (Taipei, Taiwan) and prepared for
lentiviral transduction. TurboFect™ Transfection Reagent (Thermo
Fisher Scientific, Inc) was used for transfection in accordance
with the manufacturers' protocol. Initially, lentiviruses were
produced and collected after 24 h transduction with 293T cells.
After 24 h of infection, cells (G8D-shDPEP1) were treated with
puromycin (2 µg/ml) to select for a pool of drug-resistant
clones.
Xenograft tumorigenicity assay
All animal experimental procedures and methods were
performed in accordance with the relevant guidelines and
regulations of the 3Rs and animal welfare. All animal protocols
were approved by the Academia Sinica Institutional Animal Care and
Utilization Committee (Protocol ID, 18-08-1222). Mice were housed
in washed polysulfone micro-isolator cages in a
specific-pathogen-free facility, with controlled light (12 h
light/dark), constant temperature (22°C) and humidity (55±5%),
ventilation rate of 15 times/h and were provided standard mouse
chow (Autoclavable Rodent Diet 5010; LabDiet) and water ad libitum.
Xenograft tumorigenicity was determined as previously described
(20). Briefly, HCT116 cells at
different tumorsphere generations (G0 or G8D) or with different
treatments [G8D with scramble shRNA (non-targeting negative control
shRNA) or shDPEP1 viral infection] were harvested, washed with PBS
and resuspended in DMEM/F12 medium. Cells (1×10²) were
injected subcutaneously into the right and left flank regions of
6-week-old male NOD/SCID/λ (NSG) mice (Genomic Research Center,
Taipei, Taiwan). A total of 19 mice were used (~25 g). The mice
were injected on both flank regions and divided into two groups.
The first group of mice (n=9) was injected with G0 on the left and
G8D on the right. The second group of mice (n=10) was injected with
shDPEP1 on the left and scramble shRNA on the right. The maxima
observed tumor size was ~0.6 cm3. CO2 was
used as the euthanasia agent and delivered to the cage in a
controllable fashion at a flow rate of 30% volume displacement per
min. All mice were euthanized 28 days after injection, the tumors
were surgically excised and weighed, and their volume was measured.
Tumor volumes were calculated according to the formula [(π/6) ×
width2 × length].
Statistical analysis
All statistical analyses were performed using
GraphPad Prism (v.6.0; GraphPad Software, Inc.). Unpaired t-test
was used to determine differences between 2 groups. One-way ANOVA
followed by Tukey's post hoc test was used to compare differences
among ≥3 groups, whereas ANOVA followed by Dunnett's post hoc test
was used to compare ≥2 experimental groups with a single control.
P<0.05 was considered to indicate a statistically significant
difference.
Results
Selection of a cancer cell line using
repeated sphere-forming assays
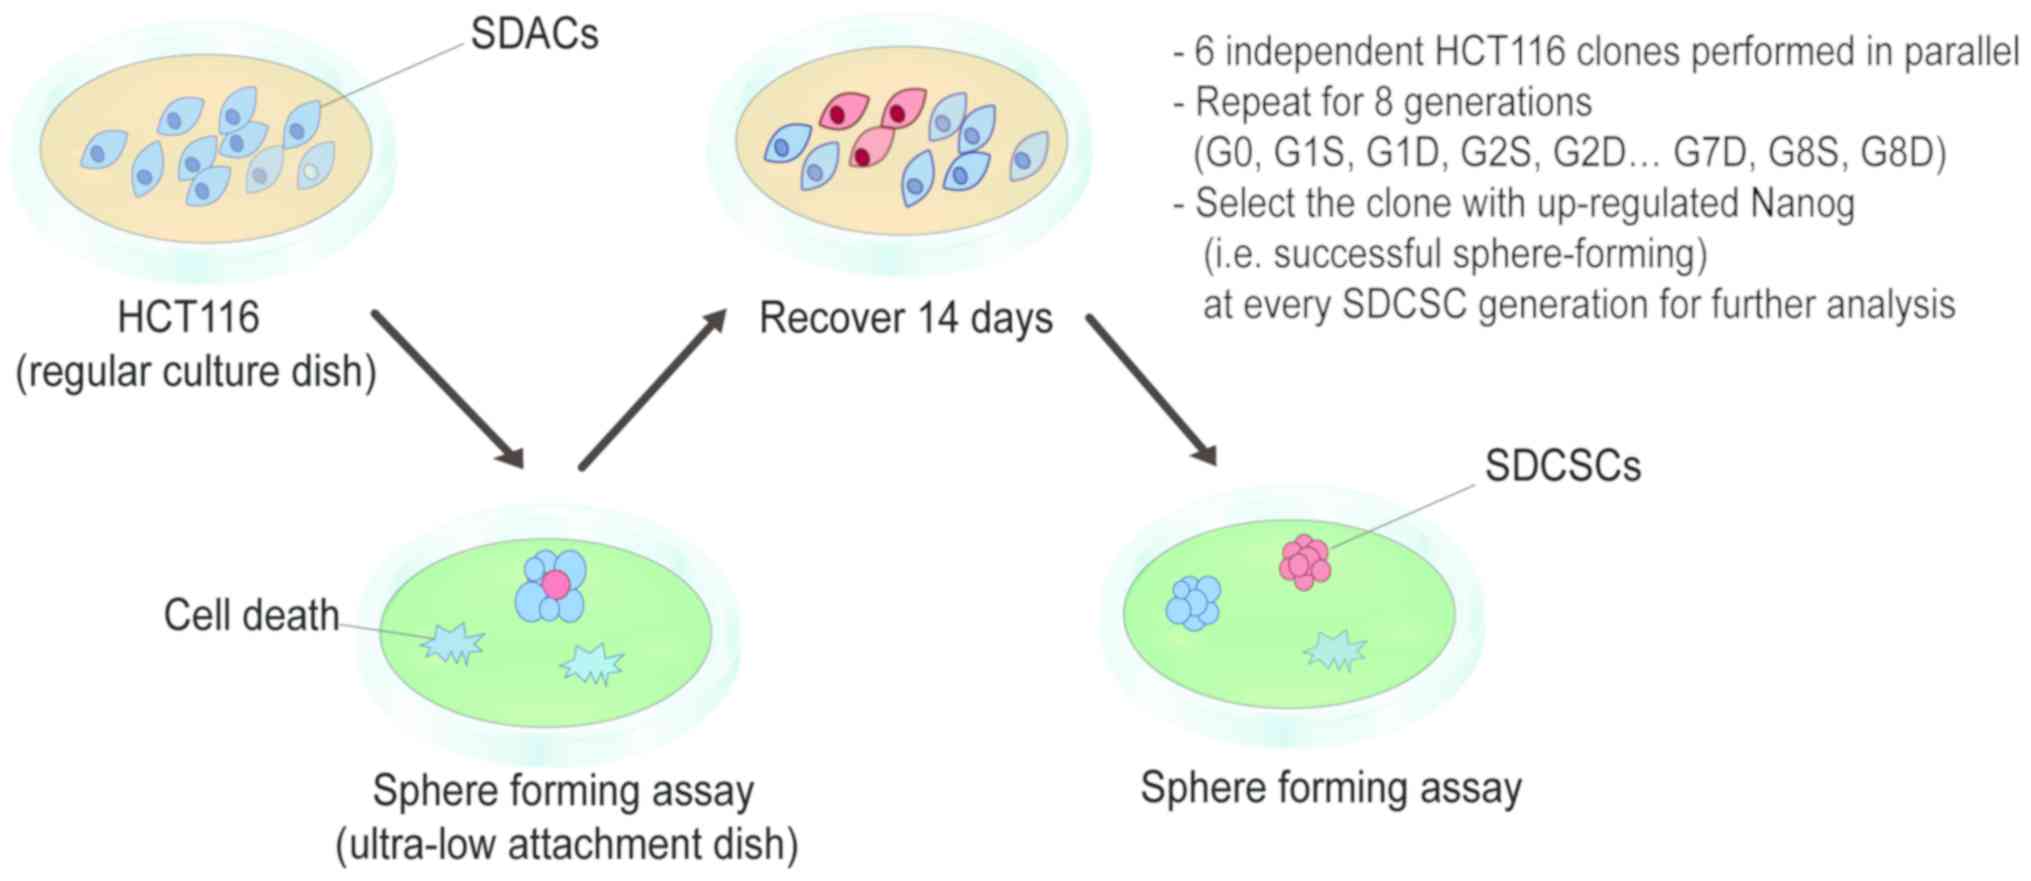
The experimental design of the present study is
illustrated in Fig. 1. Using an
ultra-low attachment dish, tumorspheres were generated using the
sphere-forming assay. Whereas the majority of cells died during
culture, a small population (CSC-like cells) was able to form
spheres. These SDCSCs were isolated, and a portion was collected
and subjected to experimental validation. The remaining cells were
dissociated and re-plated onto a regular dish as SDACs. Some SDACs
were frozen in stock vials at −80°C, while others were allowed to
expand, and after recovery for 14 days, cells were again cultured
in an ultra-low attachment dish to form spheres for the next round
of selection (Fig. 1). For
simplicity, ‘generation’ was abbreviated as ‘G’, ‘SDCSCs’ as ‘S’
and ‘SDACs’ as ‘D’. For example, first-generation SDCSCs were
designated as ‘G1S’ and first-generation SDACs as ‘G1D’.
The human CRC HCT116 cell line was used as the model
cell line in the present study. At the beginning of the assay,
HCT116 cells were subjected to a one-time homogenizing
sphere-forming assay and re-plated as adherent cells. These
homogenized HCT116 cells were considered parental and designated
‘G0’. Beginning with this parental line, repeated sphere-forming
assays and recovery procedures were performed for the generation of
SDCSCs and SDACs. A total of six independent HCT116 clones were
subjected to the sphere-forming and recovery procedures in parallel
for eight repeated stages. The eighth-generation SDCSCs and SDACs
were designated as G8S and G8D, respectively.
Canonical stemness markers are
transiently expressed in SDCSCs
To validate that SDCSCs generated from the
aforementioned repeated sphere-forming assay were CSC-like
tumorspheres at every generation, the expression levels of the
canonical stemness marker Nanog (21) were analyzed via RT-qPCR. SDACs and
SDCSCs from G0 (parental) to G8 were collected. Among the six
independent HCT116 clones, one clone (clone 1) exhibited a marked
upregulation of Nanog expression in SDCSCs at every generation
compared with Nanog expression at G0 (Fig. 2A). In addition, another HCT116 clone
(clone 2) exhibited a similar upregulation of Nanog expression in
SDCSCs at six out of eight generations (Fig. S1; except for the
first and second generations, where the Nanog levels were
comparable in SDCSCs and SDACs). The variation in Nanog expression
may result from differences in sphere-forming efficiency. Since
Nanog upregulation was observed at every generation in clone 1,
this was selected for further analysis. The upregulation of Nanog
in SDCSCs appeared to only be transient, as the Nanog expression
level in SDACs at every generation was close to that in G0 SDACs
(Fig. 2A). Subsequently, a
time-course experiment was performed. The G1S spheres were
collected and re-plated onto a regular dish as adherent cells that
were harvested at days 1, 3, 7 and 14. Nanog expression was
markedly increased in SDACs at day 1 compared with SDCSCs, but
gradually decreased from days 3 to 14 in SDACs, at both the mRNA
(Fig. 2B; P<0.0001, P<0.05,
P<0.05 and P<0.01 for day 1, 3, 7 and 14, respectively) and
protein levels (Fig. 2C). This
transient pattern suggested that the upregulation of this marker
may be a consequence of the sphere-forming assay and may therefore
depend on the sphere state, rather than being a stable phenotype of
the cells. In addition, we also observed similar transient
upregulation of stemness genes in SDCSCs using a stem cell marker
of the intestinal epithelium, LGR5 (22), and another pluripotent marker, OCT4
(21) (Fig. 2D). This result indicated that such
transient upregulation was not limited to a single stemness
gene.
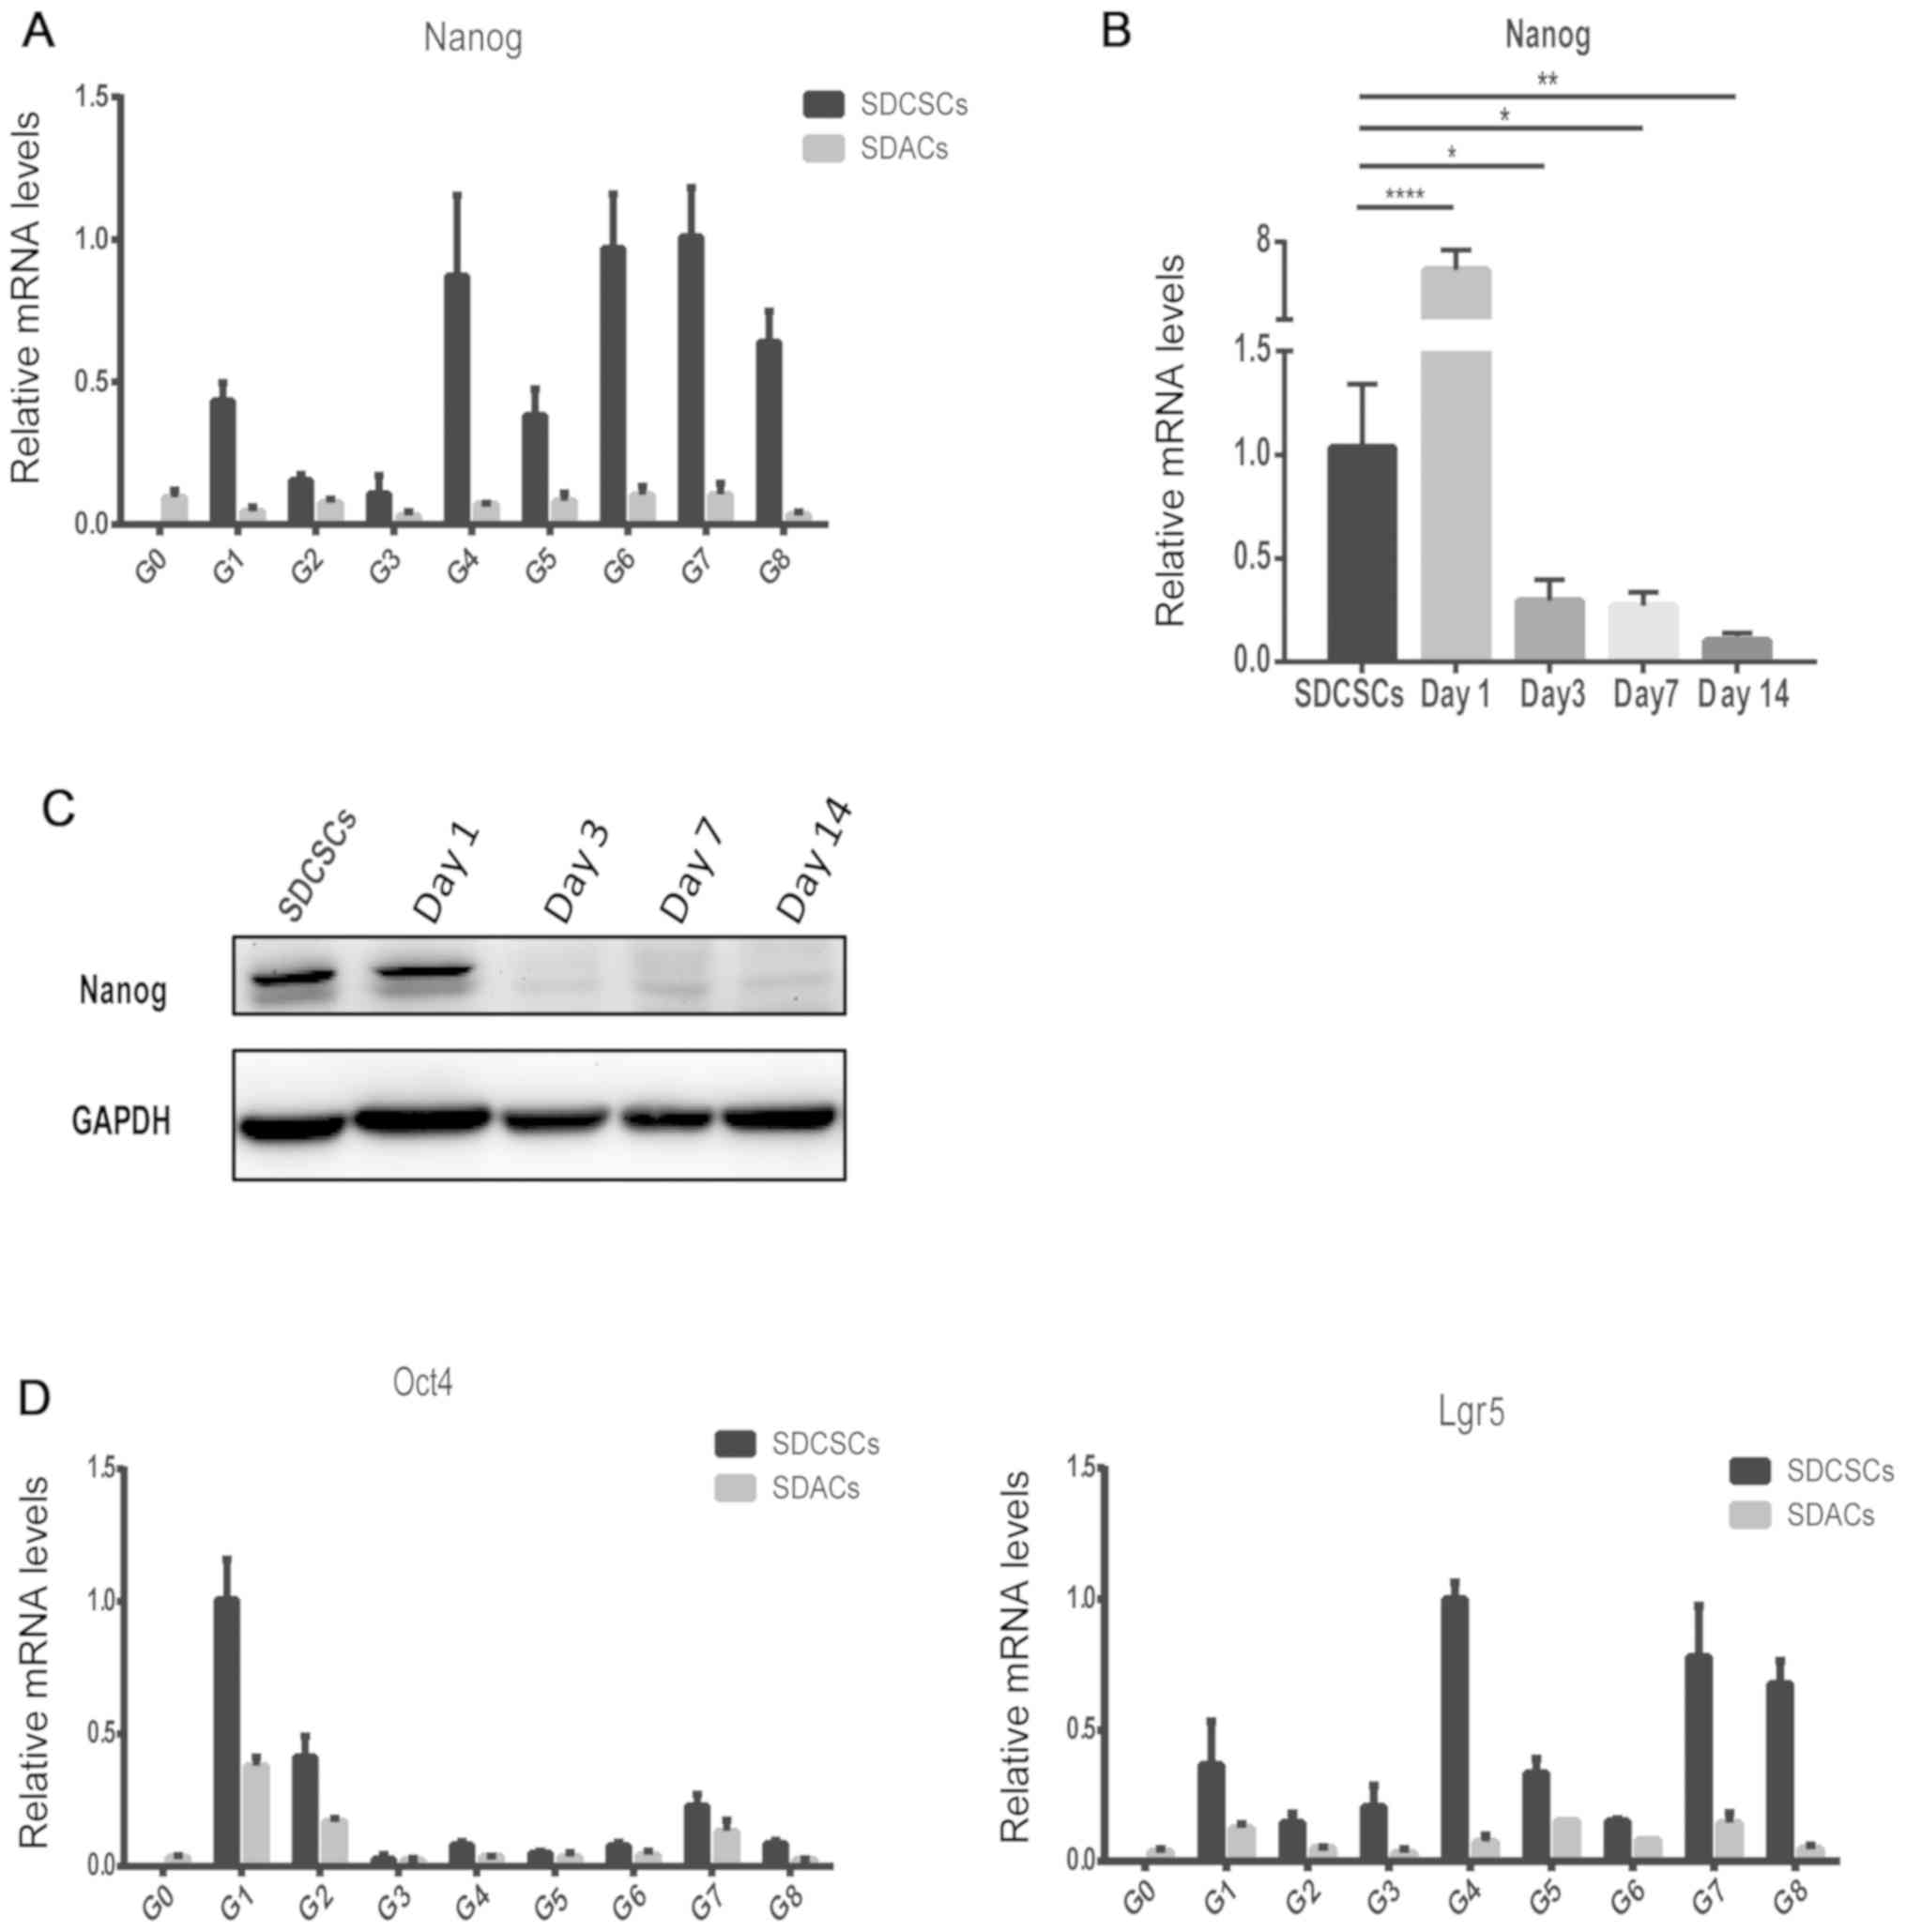 | Figure 2.Validation of the repeated
sphere-forming and recovery assay using stemness markers. (A)
Expression levels of Nanog mRNA in SDCSCs and SDACs from G0
(parental) to G8 were analyzed via RT-qPCR. (B) RNA was collected
from SDCSCs at days 1, 3, 7 and 14 after re-plating as SDACs. The
expression levels of Nanog mRNA were analyzed via RT-qPCR.
Significant differences were determined by ANOVA followed by
Dunnett's post hoc test. *P<0.05; **P<0.01; ****P<0.0001.
(C) Proteins were collected from SDCSCs at days 1, 3, 7 and 14
after re-plating as SDACs. Nanog protein expression was detected by
western blotting. GAPDH was used as the internal control. (D)
Expression levels of Oct4 and Lgr5 mRNA in SDCSCs and SDACs from G0
(parental) to G8, as analyzed by RT-qPCR. Data are presented as the
mean ± SD (n=3). GAPDH was used as the reference gene. SDCSCs,
sphere-derived cancer stem cell-like cells; SDACs, sphere-derived
adherent cells; G, generation; RT-qPCR, reverse
transcription-quantitative PCR; Oct4, octamer-binding transcription
factor 4; Lgr5, leucine-rich repeat-containing G-protein coupled
receptor 5. |
Sphere-forming capacity increases
significantly after eight rounds of selection
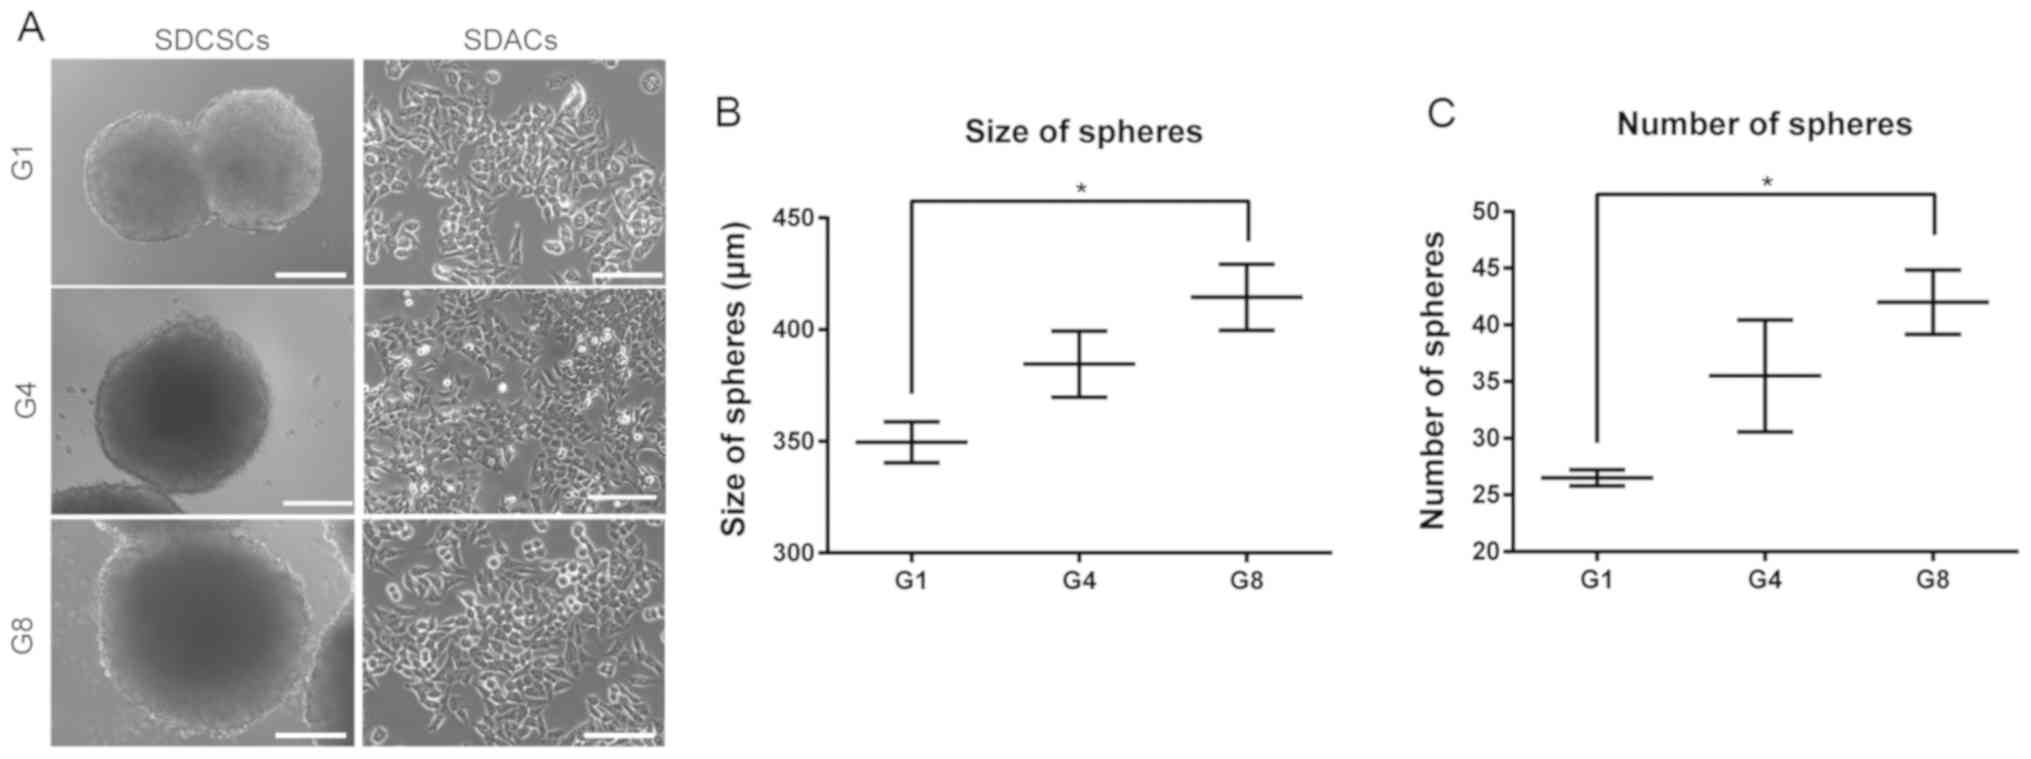
In order to analyze whether repetitive rounds of
selection would result in a phenotypically more malignant cell
line, the sphere-forming capacities of first-, fourth- and
eighth-generation cells were compared in vitro. While the
morphologies of SDACs were similar among G1D, G4D and G8D cells
(Fig. 3A), the size and number of
spheres that formed increased gradually from G1S to G4S to G8S
(P<0.05; Fig. 3B and C). The
present in vitro validation confirmed that the repeated
sphere-forming and recovery procedures were able to generate
functionally more malignant cells.
RNA sequencing identifies DPEP1 as a
highly expressed gene in the selected clone
The increased sphere-forming capacity at G8
suggested that the present repeated sphere-forming assay was able
to select for a more malignant subpopulation (Fig. 3). Therefore, the present study aimed
to identify any stably upregulated genes in the selected clone that
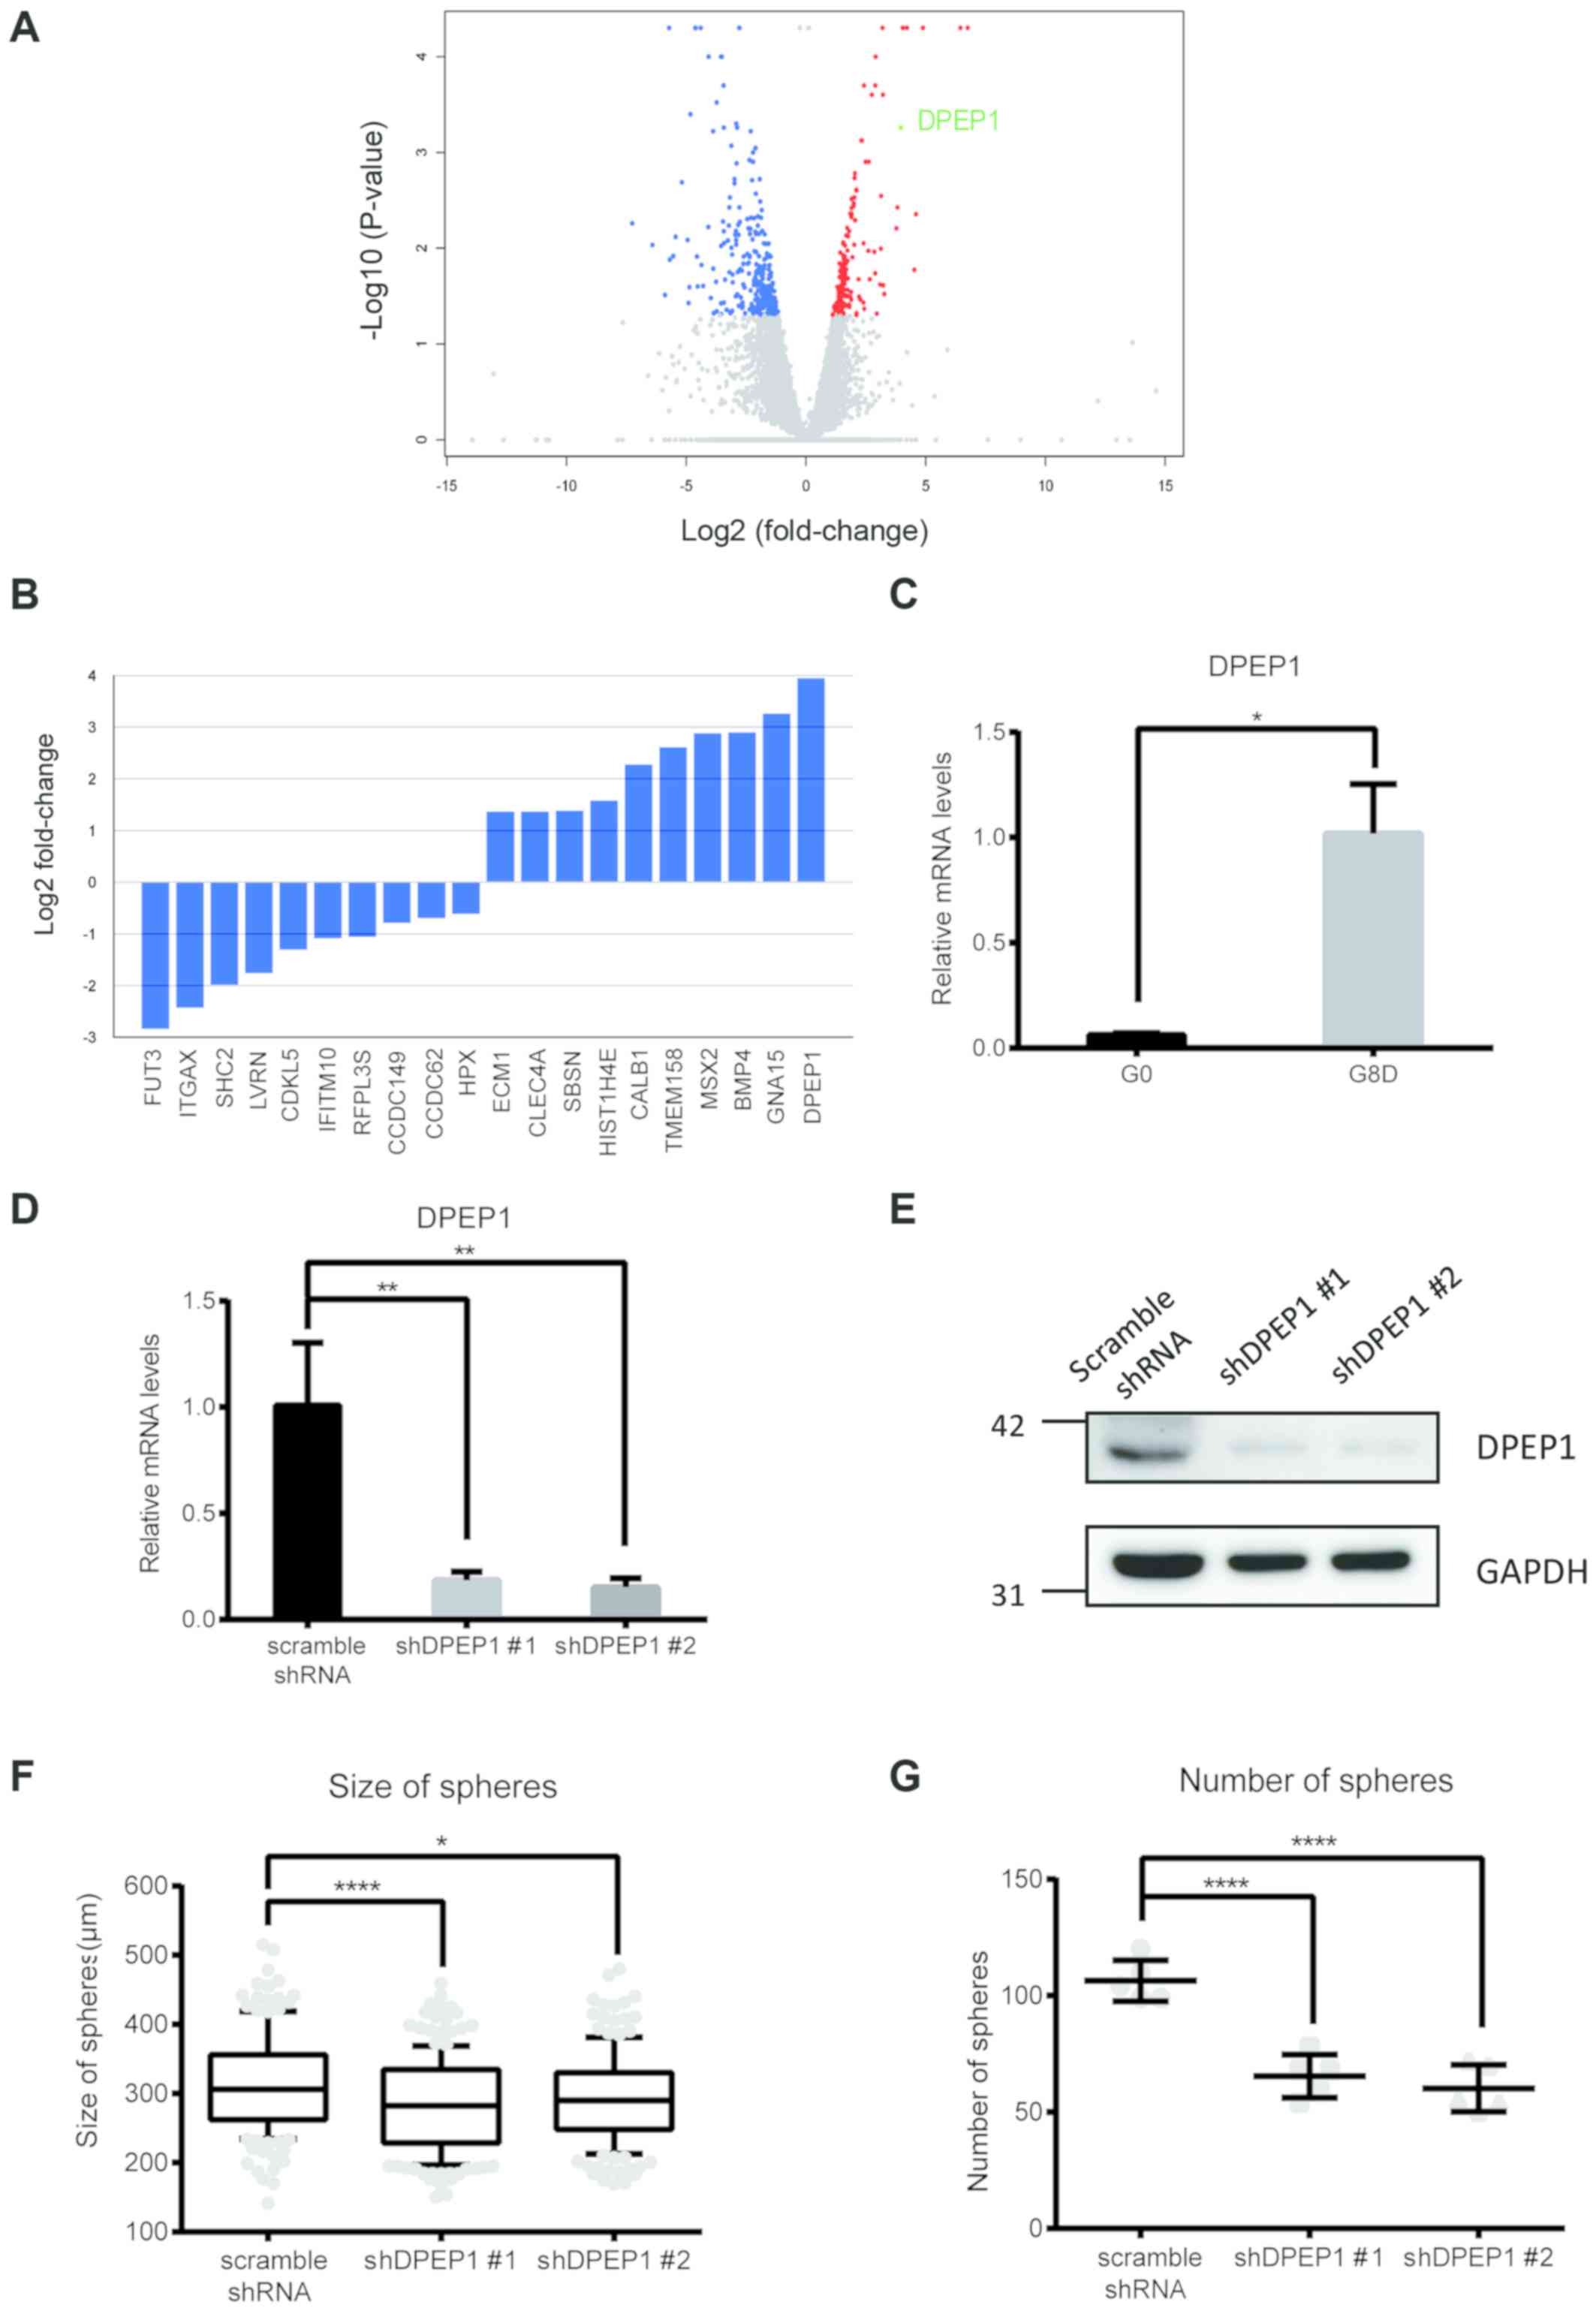
may be responsible for this phenotype. Compared with G0 cells, RNA
sequencing was performed to identify genes differentially expressed
in G8D, including 202 significantly upregulated genes (red dots)
and 289 downregulated genes (blue dots; Fig. 4A). Candidate genes were selected
based on the differential expression in both sphere and adherent
states (G8S > G1S > G0 and G8D > G0), and the top 10
upregulated or downregulated protein-coding genes are listed in
Fig. 4B. DPEP1, the top-ranked gene
that encodes the DPEP1 enzyme, which has been implicated in the
progression of colon cancer malignancy (23–25), was
selected for further analysis. The upregulation of DPEP1 mRNA in
G8D cells was confirmed via RT-qPCR (P<0.05; Fig. 4C). In addition, DPEP1 was similarly
upregulated in clone 2 (P<0.01; Fig. S2). There were two
different lentiviral shRNAs that were used to stably knockdown
DPEP1 in G8D cells in the present study. Knockdown efficiency was
confirmed at both the mRNA (P<0.01 for shDPEP1 #1 and #2;
Fig. 4D) and protein levels
(Fig. 4E). DPEP1 knockdown led to a
significant decrease in the sphere-forming capacity of G8D cells
(Fig. 4F; P<0.0001 and P<0.05
for shDPEP1 #1 and #2, respectively; Fig. 4G; P<0.0001 for shDPEP1 #1 and #2),
suggesting that the high expression level of DPEP1 may promote
colorectal cancer malignancy.
Eighth-generation SDACs exhibits
enhanced DPEP1-dependent tumorigenicity in vivo
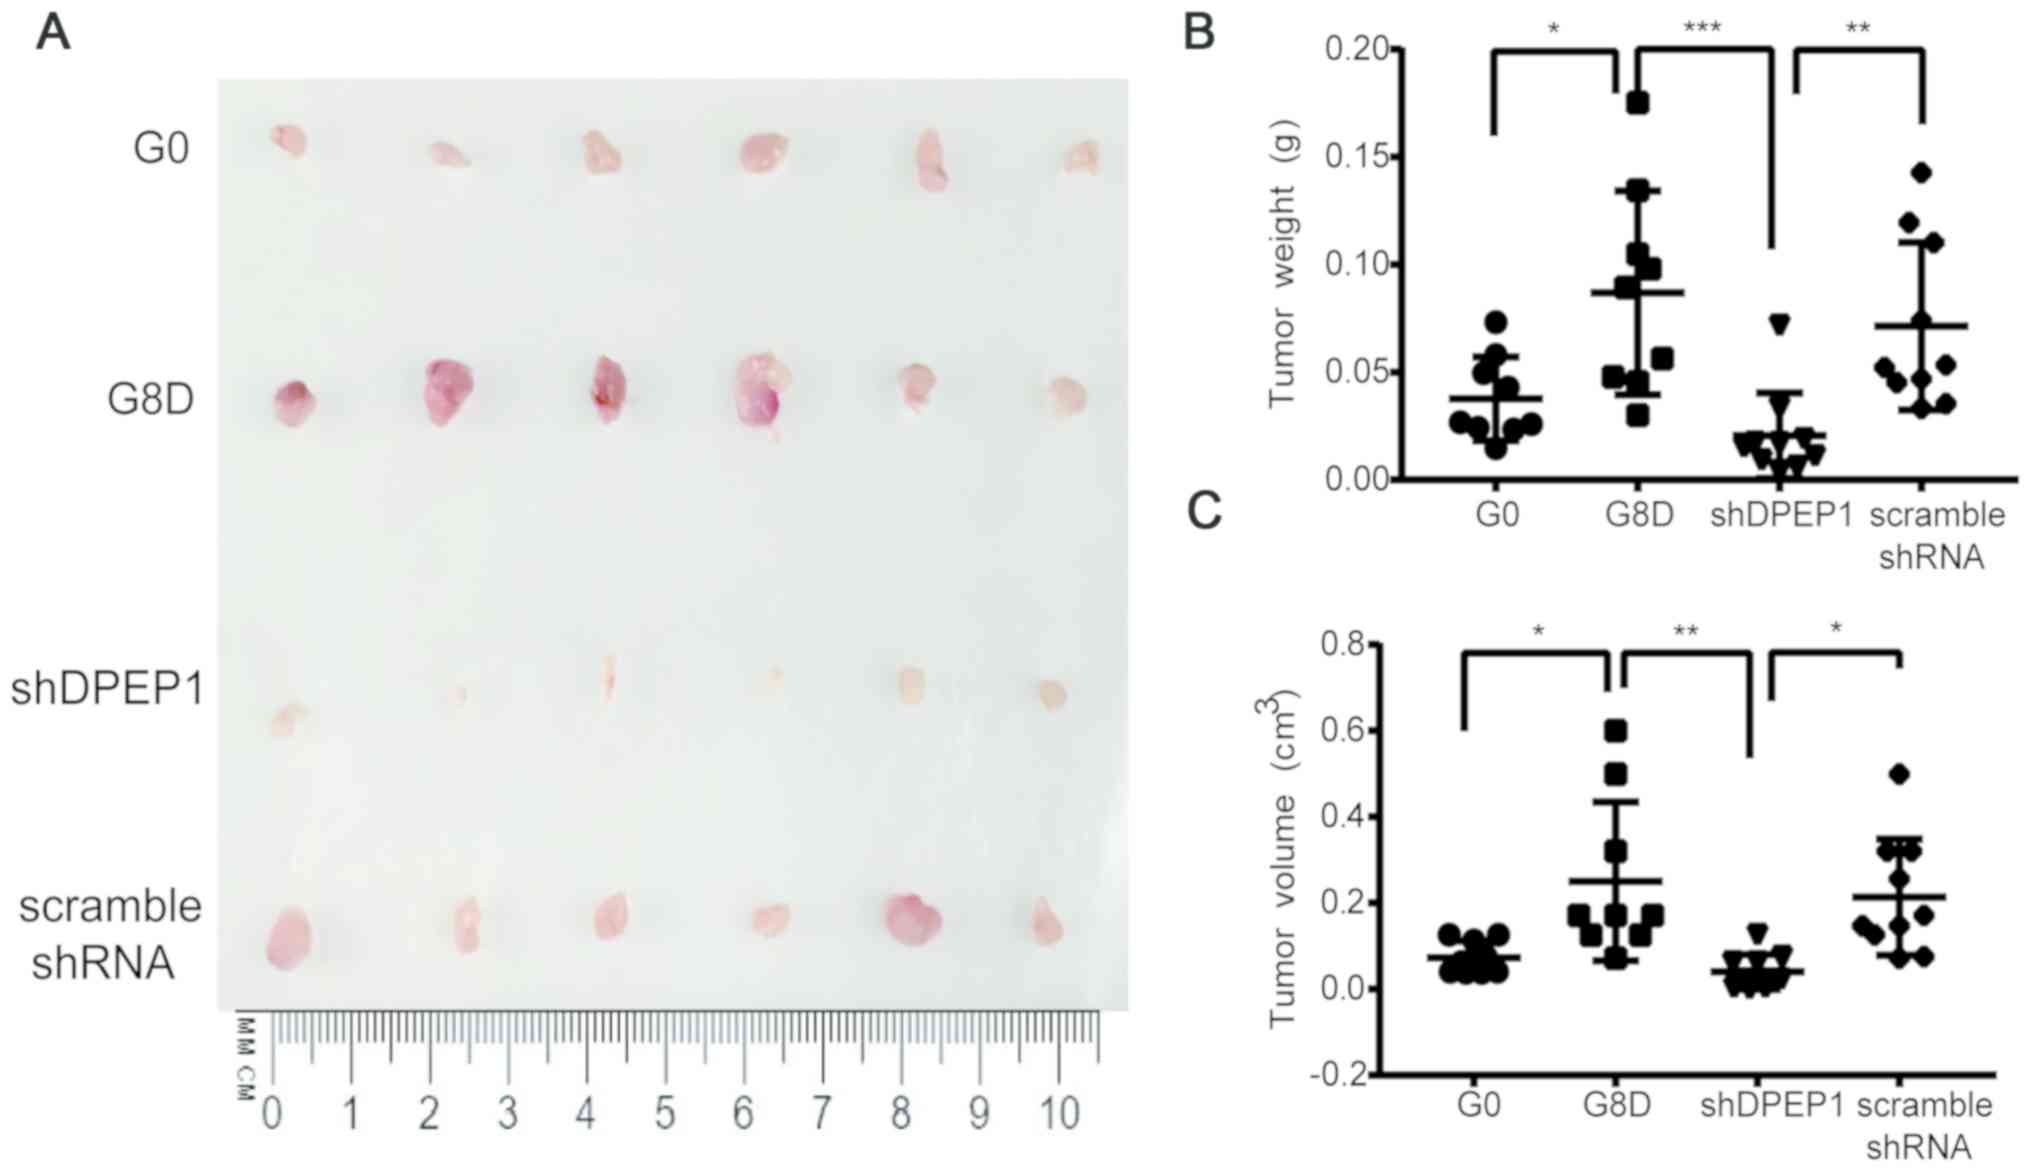
To investigate whether the selected clone possessed
enhanced DPEP1-dependent tumorigenicity in vivo, tumor
growth was examined in a xenograft model using severely
immunodeficient NSG mice (26). As
presented in Fig. 5A, tumor size
(e.g., tumor weight and volume) was markedly increased using G8D
cells when compared with using G0 cells, indicating a stronger
tumorigenicity after eight rounds of selection. Additionally,
DPEP1-knockdown in G8D cells greatly decreased tumorigenicity,
which was similar to that using G0 cells (Fig. 5A-C; P<0.05, P<0.001 and
P<0.01 for G0 vs. G8D, G8D vs. shDPEP1 and shDPEP1 vs. scramble
shRNA, respectively; Fig. 5C;
P<0.05, P<0.01 and P<0.05 for G0 vs. G8D, G8D vs. shDPEP1
and shDPEP1 vs. scramble shRNA, respectively). Overall, these data
confirmed that the repeated sphere-forming strategy used in the
present study may successfully select a highly tumorigenic clone.
DPEP1 was stably upregulated in G8D cells and may be responsible
for the elevated tumorigenicity.
Discussion
Stem cells are defined by their ability to
self-renew and differentiate into a variety of cell types (27). The concept has expanded from
embryonic stem cells to adult stem cells to CSCs (28). The sphere-forming assay is
traditionally used to identify cells that possess stem cell
characteristics (8), as well as to
characterize CSCs (9). Previously,
when cancer cells were cultured as tumorspheres (CSC-like cells),
later generations were reported to be more tumorigenic than
parental cells (29). However, since
cells in tumorspheres are temporarily cultured in a condition that
is different from their long-term adherent culture, it is likely
that the phenotypes measured merely reflect an acute state. In
other words, the expression levels of stemness markers (e.g.
SRY-Box Transcription Factor 2, OCT4 and Nanog) and properties
(e.g. tumor-initiating capability, multi-drug resistance) may only
be transient (15). The present
study indicated that the expression levels of the three canonical
stem cell markers, Nanog, Oct4 and Lgr5, were upregulated in
tumorspheres (SDCSCs), but their expression decreased to levels
close to parental ones when the spheres were re-plated as SDACs.
Based on the present finding, an alternative ‘intermittent’
strategy was adopted. Specifically, after 14 days of sphere
formation, cells were allowed to rest in the adherent state for 14
days before the next sphere-forming assay. Using this experimental
strategy, cell lines were generated and stable phenotypes were
identified. Another benefit of the present strategy was that cells
could be expanded and stored in the resting SDAC state and could be
recovered at every generation, in contrast to continuous
propagation as with tumorspheres (29), which only lasted for a limited
duration (data not shown). Theoretically, the assay may be
performed for infinite generations using the intermittent
strategy.
Using the intermittent strategy, a clone was
isolated after eight rounds of sphere formation that was more
tumorigenic in its adherent state than the parental line. Since the
number of selection rounds was relatively small, it is probable
that the selected clone (G8D) represented a pre-existing
subpopulation within the heterogeneous parental line. However,
given the genomic instability of cancer cells, it is likely that
increasing the number of selection rounds may allow for the
accumulation of new mutations during the course of the experiment.
Therefore, the present system has the potential to be used in
‘experimental cancer evolution’ studies, as being proposed in a
previous perspective article (30).
In this case, the hypoxic microenvironment within the tumorsphere
may serve as the selection pressure that drives evolution towards a
potentially more devastating phenotype (31). Given the previous success achieved
with the study of the experimental evolution of multicellularity
(stemness) from unicellular Saccharomyces cerevisiae
(32) and Chlamydomonas
(33), it seems reasonable that it
may be possible to experimentally induce the evolution of stable
stemness in cancer and produce a stable CSC-like line, which would
be a good experimental model for drug screening for anti-CSC
agents.
To demonstrate that the present procedure may be
valuable to identify cancer-associated genes, a transcriptomic
analysis was performed, identifying DPEP1 as the top differentially
expressed gene. DPEP1 was first identified as a tumor suppressor in
the kidney (34) and it has been
negatively associated with the development of breast (35) and pancreatic carcinoma (36). However, in CRC, DPEP1 is considered
to be a positive regulator, as its expression levels are higher in
tumors compared with those in paired adjacent colorectal tissues
(23), and in tumor tissues compared
with those in normal mucosa (24,25).
Additionally, high DPEP1 levels are associated with less survival
time in patients with CRC (23). In
the present study, DPEP1 was responsible for the elevated
sphere-forming capacity in vitro and tumorigenicity in
vivo during evolution of the HCT116 clone. The current results
support the view that high DPEP1 levels are associated with CRC
malignancy and further strengthen the concept of using DPEP1
expression as a CRC prognostic marker. Mechanistically, it has been
reported that DPEP1 promotes cell proliferation in vitro
(23). Since DPEP1 is a matrix
metalloproteinase, it may also promote tumor growth in vivo
by degrading matrix barriers to enhance cell migration and
angiogenesis (37). Further
investigations are required to clarify the contribution of DPEP1 to
in vivo tumor growth.
Acknowledgements
The authors would like to thank Technology Commons
(College of Life Science, National Taiwan University) for use of
the Leica TCS SP5 confocal microscope. The authors would also like
to thank the Pathology Core Laboratory (Academia Sinica) for
assisting with the animal experiments.
Funding
The present study was funded by the Ministry of
Science and Technology (grant nos. 102-2311-B-002-041-MY3,
108-3114-Y-001-002, 108-2811-B-001-581, 109-0210-01-18-02,
108-2314-B-001-006-MY3) and Academia Sinica (grant nos.
AS-SUMMIT-108, AS-SUMMIT-109 and AS-KPQ-109-BioMed).
Availability of data and materials
The datasets used and/or analyzed during the present
study are available from the corresponding author on reasonable
request.
Authors' contributions
PL performed the animal experiments and analyzed the
RNA-seq data. TC performed the repeated sphere-forming experiments.
CF characterized DPEP1. HL performed animal experiments. YC
performed the lentiviral knockdown experiments. CN and MH assisted
in the animal experiments. PL, JL and HH directed the project,
analyzed and interpreted the data, and wrote the manuscript. All
authors read and approved the final manuscript.
Ethics approval and consent to
participate
All animal experimental procedures and methods were
performed in accordance with the relevant guidelines and
regulations. All animal protocols were approved by Academia Sinica
Institutional Animal Care and Utilization Committee (Protocol ID,
18-08-1222).
Patient consent for publication
Not applicable.
Competing interests
The authors declare that they have no competing
interests.
Glossary
Abbreviations
Abbreviations:
|
CRC
|
colorectal cancer
|
|
CSCs
|
cancer stem cells
|
|
DPEP1
|
dipeptidase 1
|
|
SDACs
|
sphere-derived adherent cells
|
|
SDCSCs
|
sphere-derived cancer stem cell-like
cells
|
References
|
1
|
Siegel RL, Miller KD and Jemal A: Cancer
statistics, 2020. CA Cancer J Clin. 70:7–30. 2020. View Article : Google Scholar : PubMed/NCBI
|
|
2
|
Bhandari A, Woodhouse M and Gupta S:
Colorectal cancer is a leading cause of cancer incidence and
mortality among adults younger than 50 years in the USA: A
SEER-based analysis with comparison to other young-onset cancers. J
Investig Med. 65:311–315. 2017. View Article : Google Scholar : PubMed/NCBI
|
|
3
|
Harrison S and Benziger H: The molecular
biology of colorectal carcinoma and its implications: A review.
Surgeon. 9:200–210. 2011. View Article : Google Scholar : PubMed/NCBI
|
|
4
|
Siegel R, Ward E, Brawley O and Jemal A:
Cancer statistics, 2011: The impact of eliminating socioeconomic
and racial disparities on premature cancer deaths. CA Cancer J
Clin. 61:212–236. 2011. View Article : Google Scholar : PubMed/NCBI
|
|
5
|
Vaiopoulos AG, Kostakis ID, Koutsilieris M
and Papavassiliou AG: Colorectal cancer stem cells. Stem Cells.
30:363–371. 2012. View Article : Google Scholar : PubMed/NCBI
|
|
6
|
Dean M, Fojo T and Bates S: Tumour stem
cells and drug resistance. Nat Rev Cancer. 5:275–284. 2005.
View Article : Google Scholar : PubMed/NCBI
|
|
7
|
Altman J: Autoradiographic and
histological studies of postnatal neurogenesis. IV. Cell
proliferation and migration in the anterior forebrain, with special
reference to persisting neurogenesis in the olfactory bulb. J Comp
Neurol. 137:433–457. 1969. View Article : Google Scholar : PubMed/NCBI
|
|
8
|
Pastrana E, Silva-Vargas V and Doetsch F:
Eyes wide open: A critical review of sphere-formation as an assay
for stem cells. Cell Stem Cell. 8:486–498. 2011. View Article : Google Scholar : PubMed/NCBI
|
|
9
|
Bahmad HF, Cheaito K, Chalhoub RM, Hadadeh
O, Monzer A, Ballout F, El-Hajj A, Mukherji D, Liu YN, Daoud G and
Abou-Kheir W: Sphere-formation assay: Three-dimensional in vitro
culturing of prostate cancer stem/progenitor sphere-forming cells.
Front Oncol. 8:3472018. View Article : Google Scholar : PubMed/NCBI
|
|
10
|
Singh SK, Clarke ID, Terasaki M, Bonn VE,
Hawkins C, Squire J and Dirks PB: Identification of a cancer stem
cell in human brain tumors. Cancer Res. 63:5821–5828.
2003.PubMed/NCBI
|
|
11
|
Ponti D, Costa A, Zaffaroni N, Pratesi G,
Petrangolini G, Coradini D, Pilotti S, Pierotti MA and Daidone MG:
Isolation and in vitro propagation of tumorigenic breast cancer
cells with stem/progenitor cell properties. Cancer Res.
65:5506–5511. 2005. View Article : Google Scholar : PubMed/NCBI
|
|
12
|
Ricci-Vitiani L, Lombardi DG, Pilozzi E,
Biffoni M, Todaro M, Peschle C and De Maria R: Identification and
expansion of human colon-cancer-initiating cells. Nature.
445:111–115. 2007. View Article : Google Scholar : PubMed/NCBI
|
|
13
|
Todaro M, Alea MP, Di Stefano AB,
Cammareri P, Vermeulen L, Iovino F, Tripodo C, Russo A, Gulotta G,
Medema JP and Stassi G: Colon cancer stem cells dictate tumor
growth and resist cell death by production of interleukin-4. Cell
Stem Cell. 1:389–402. 2007. View Article : Google Scholar : PubMed/NCBI
|
|
14
|
Amsterdam A, Raanan C, Schreiber L,
Freyhan O, Fabrikant Y, Melzer E and Givol D: Differential
localization of LGR5 and Nanog in clusters of colon cancer stem
cells. Acta Histochem. 115:320–329. 2013. View Article : Google Scholar : PubMed/NCBI
|
|
15
|
Yakisich JS, Azad N, Kaushik V and Iyer
AKV: Cancer cell plasticity: Rapid reversal of chemosensitivity and
expression of stemness markers in lung and breast cancer
tumorspheres. J Cell Physiol. 232:2280–2286. 2017. View Article : Google Scholar : PubMed/NCBI
|
|
16
|
Chu YW, Yang PC, Yang SC, Shyu YC, Hendrix
MJ, Wu R and Wu CW: Selection of invasive and metastatic
subpopulations from a human lung adenocarcinoma cell line. Am J
Respir Cell Mol Biol. 17:353–360. 1997. View Article : Google Scholar : PubMed/NCBI
|
|
17
|
Yang CF, Tsai WY, Chen WA, Liang KW, Pan
CJ, Lai PL, Yang PC and Huang HC: Kinesin-5 Contributes to
Spindle-length scaling in the evolution of cancer toward
metastasis. Sci Rep. 6:357672016. View Article : Google Scholar : PubMed/NCBI
|
|
18
|
Chen JJ, Peck K, Hong TM, Yang SC, Sher
YP, Shih JY, Wu R, Cheng JL, Roffler SR, Wu CW and Yang PC: Global
analysis of gene expression in invasion by a lung cancer model.
Cancer Res. 61:5223–5230. 2001.PubMed/NCBI
|
|
19
|
Livak KJ and Schmittgen TD: Analysis of
relative gene expression data using real-time quantitative PCR and
the 2(-Delta Delta C(T)) method. Methods. 25:402–408. 2001.
View Article : Google Scholar : PubMed/NCBI
|
|
20
|
Morton CL and Houghton PJ: Establishment
of human tumor xenografts in immunodeficient mice. Nat Protoc.
2:247–250. 2007. View Article : Google Scholar : PubMed/NCBI
|
|
21
|
Liu A, Yu X and Liu S: Pluripotency
transcription factors and cancer stem cells: Small genes make a big
difference. Chin J Cancer. 32:483–487. 2013.PubMed/NCBI
|
|
22
|
de Sousa e Melo F, Kurtova AV, Harnoss JM,
Kljavin N, Hoeck JD, Hung J, Anderson JE, Storm EE, Modrusan Z,
Koeppen H, et al: A distinct role for Lgr5(+) stem cells in primary
and metastatic colon cancer. Nature. 543:676–680. 2017. View Article : Google Scholar : PubMed/NCBI
|
|
23
|
Hao JJ, Zhi X, Wang Y, Zhang Z, Hao Z, Ye
R, Tang Z, Qian F, Wang Q and Zhu J: Comprehensive proteomic
characterization of the human colorectal carcinoma reveals
signature proteins and perturbed pathways. Sci Rep. 7:424362017.
View Article : Google Scholar : PubMed/NCBI
|
|
24
|
Eisenach PA, Soeth E, Röder C, Klöppel G,
Tepel J, Kalthoff H and Sipos B: Dipeptidase 1 (DPEP1) is a marker
for the transition from low-grade to high-grade intraepithelial
neoplasia and an adverse prognostic factor in colorectal cancer. Br
J Cancer. 109:694–703. 2013. View Article : Google Scholar : PubMed/NCBI
|
|
25
|
Park SY, Lee SJ, Cho HJ, Kim TW, Kim JT,
Kim JW, Lee CH, Kim BY, Yeom YI, Lim JS, et al: Dehydropeptidase 1
promotes metastasis through regulation of E-cadherin expression in
colon cancer. Oncotarget. 7:9501–9512. 2016. View Article : Google Scholar : PubMed/NCBI
|
|
26
|
Shultz LD, Lyons BL, Burzenski LM, Gott B,
Chen X, Chaleff S, Kotb M, Gillies SD, King M, Mangada J, et al:
Human lymphoid and myeloid cell development in NOD/LtSz-scid IL2R
gamma null mice engrafted with mobilized human hemopoietic stem
cells. J Immunol. 174:6477–6489. 2005. View Article : Google Scholar : PubMed/NCBI
|
|
27
|
Kolios G and Moodley Y: Introduction to
stem cells and regenerative medicine. Respiration. 85:3–10. 2013.
View Article : Google Scholar : PubMed/NCBI
|
|
28
|
Kim WT and Ryu CJ: Cancer stem cell
surface markers on normal stem cells. BMB Rep. 50:285–298. 2017.
View Article : Google Scholar : PubMed/NCBI
|
|
29
|
Cao L, Zhou Y, Zhai B, Liao J, Xu W, Zhang
R, Li J, Zhang Y, Chen L, Qian H, et al: Sphere-forming cell
subpopulations with cancer stem cell properties in human hepatoma
cell lines. BMC Gastroenterol. 11:712011. View Article : Google Scholar : PubMed/NCBI
|
|
30
|
Taylor TB, Johnson LJ, Jackson RW,
Brockhurst MA and Dash PR: First steps in experimental cancer
evolution. Evol Appl. 6:535–548. 2013. View Article : Google Scholar : PubMed/NCBI
|
|
31
|
Yun Z and Lin Q: Hypoxia and regulation of
cancer cell stemness. Adv Exp Med Biol. 772:41–53. 2014. View Article : Google Scholar : PubMed/NCBI
|
|
32
|
Ratcliff WC, Denison RF, Borrello M and
Travisano M: Experimental evolution of multicellularity. Proc Natl
Acad Sci USA. 109:1595–1600. 2012. View Article : Google Scholar : PubMed/NCBI
|
|
33
|
Ratcliff WC, Herron MD, Howell K, Pentz
JT, Rosenzweig F and Travisano M: Experimental evolution of an
alternating Uni- and multicellular life cycle in Chlamydomonas
reinhardtii. Nat Commun. 4:27422013. View Article : Google Scholar : PubMed/NCBI
|
|
34
|
Austruy E, Cohen-Salmon M, Antignac C,
Béroud C, Henry I, Nguyen VC, Brugières L, Junien C and Jeanpierre
C: Isolation of kidney complementary DNAs down-expressed in Wilms'
tumor by a subtractive hybridization approach. Cancer Res.
53:2888–2894. 1993.PubMed/NCBI
|
|
35
|
Green AR, Krivinskas S, Young P, Rakha EA,
Paish EC, Powe DG and Ellis IO: Loss of expression of chromosome
16q genes DPEP1 and CTCF in lobular carcinoma in situ of the
breast. Breast Cancer Res Treat. 113:59–66. 2009. View Article : Google Scholar : PubMed/NCBI
|
|
36
|
Zhang G, Schetter A, He P, Funamizu N,
Gaedcke J, Ghadimi BM, Ried T, Hassan R, Yfantis HG, Lee DH, et al:
DPEP1 inhibits tumor cell invasiveness, enhances chemosensitivity
and predicts clinical outcome in pancreatic ductal adenocarcinoma.
PLoS One. 7:e315072012. View Article : Google Scholar : PubMed/NCBI
|
|
37
|
Deryugina EI and Quigley JP: Matrix
metalloproteinases and tumor metastasis. Cancer Metastasis Rev.
25:9–34. 2006. View Article : Google Scholar : PubMed/NCBI
|