Introduction
Prostate cancer (PCa) is the most common malignant
tumor and the second leading cause of cancer-associated mortality
among men in the Western world (1).
In 2015, 60,300 new cases of PCa were diagnosed in China, leading
to 26,000 mortalities (2). In
patients treated with radical prostatectomy (RP) or radiation
therapy for localized PCa, biochemical recurrence (BCR) is defined
as two consecutive prostate-specific antigen (PSA) values ≥0.2
ng/ml after RP, or a PSA level ≥2.0 ng/ml above the nadir after
external beam radiation therapy or brachytherapy (3). The rate of BCR following RP has been
estimated to be 20–40% (4). In the
absence of secondary treatment, patients with BCR have an
approximate median period of 5–8 years prior to clinical
progression; among these, 32–45% will succumb to PCa within 15
years (5).
In order to facilitate BCR assessment, evaluate
prognosis and individualize patient follow-up, it is critical to
identify patients with a high-risk of BCR following RP. However,
the current risk stratification methods, which are mainly based on
clinicopathological parameters, only partially address the observed
variation in clinical outcomes and are not accurate enough to
predict high-risk BCR (6). With the
development of next-generation sequencing, several genomic
biomarkers have been identified and used as prognostic factors and
predictive signatures (7,8).
The Gleason system was developed by Donald Gleason
between 1966–1974 and was used to evaluate the degree of malignance
of PCa (9). In previous years,
multiple studies have described that PCa with a Gleason score (GS)
of 6 is unable to metastasize or cause cancer-associated mortality,
in addition to having a low risk rate for BCR after RP (10–12).
Although patients with GS ≥7 are at a much higher risk for disease
progression compared with patients with GS=6, even patients with GS
≥8 can experience favorable oncological outcomes, such as BCR risk
and survival time, which highlights the heterogeneity of PCa
(13,14). Furthermore, patients with GS 3+4 PCa
have similar outcomes compared with patients with GS=6 (15). Therefore, it was hypothesized that
the genomic features of GS=6 PCa, which may also be shared with GS
≥7 PCa, could be harnessed to further stratify PCa into
conventional, intermediate and high-risk PCa.
The aim of the present study was to identify
differentially expressed genes (DEGs) between patients with PCa and
GS=6 and GS ≥7, using The Cancer Genome Atlas (TCGA) data. These
DEGs were used to construct and validate an PCa signature (PCasig)
that could identify patients with a high-risk of BCR using Cox
regression analysis. In addition, the present study aimed to
analyze the biological signaling pathway associated with the PCasig
using Gene Ontology (GO) and Kyoto Encyclopedia of Genes and
Genomes (KEGG) pathway enrichment analysis. Lastly, the endogenous
expression of the genes identified in the PCasig was determined in
PCa and normal prostate cell lines.
Materials and methods
Data preparation and processing
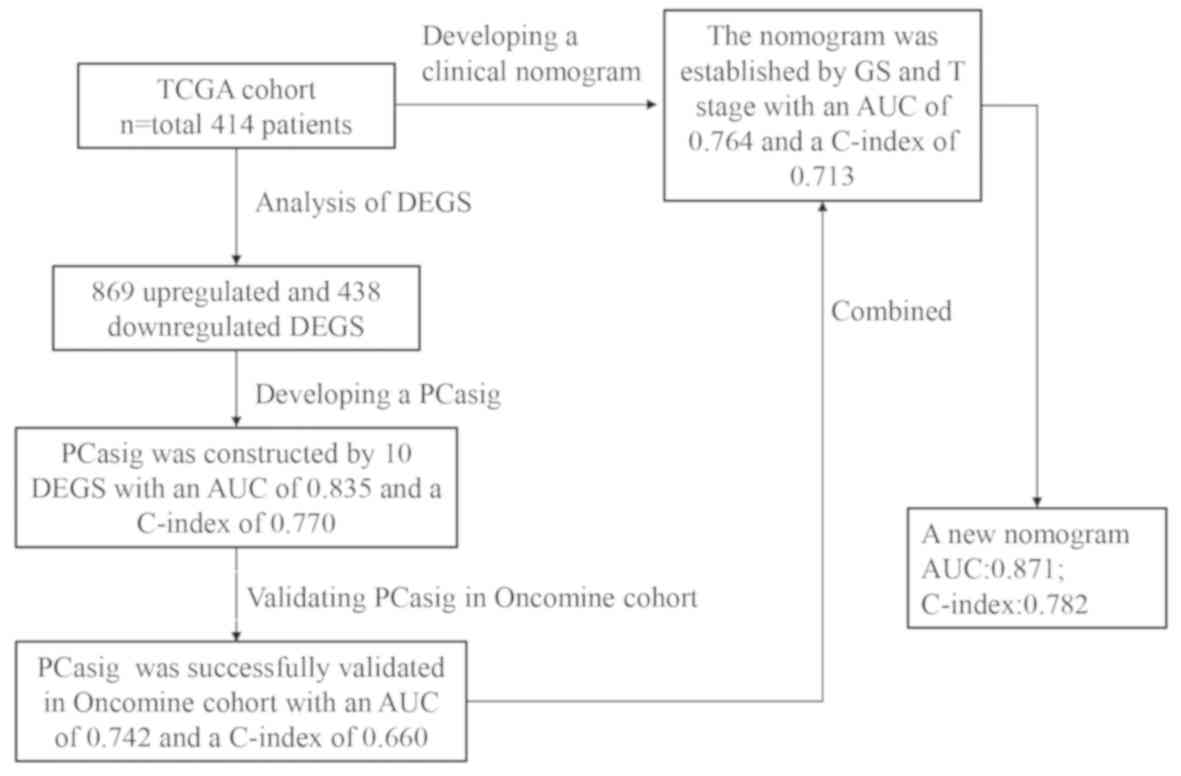
A flowchart of the analysis conducted in the present
study is shown in Fig. 1.
High-throughput RNA sequencing (RNA-seq) data, with RNA-seq data
(HTSeq-Counts) and corresponding clinicopathological parameters of
patients with PCa after RP were obtained from TCGA (https://tcga-data.nci.nih.gov/tcga/), and served
as the discovery cohort (TCGA-PRAD). Taylor Prostate 3, another
gene expression array of human PCa datasets, was obtained from
Oncomine (https://www.oncomine.org/resource/login.html) and
served as the validation cohort. The inclusion criteria were as
follows: i) Pathologically confirmed diagnosis of prostate
adenocarcinoma; ii) complete record of clinicopathological
parameters, including follow-up time, age, GS, pathological T and N
stage, clinical M stage, situation of residual tumor, and time to
BCR; and iii) RNA-seq data. The exclusion criteria were as follows:
i) Pathologic result was not prostate adenocarcinoma; ii) missing
clinicopathological parameters, including follow-up time, age, GS,
pathological T and N stage, clinical M stage (16), situation of residual tumor, and time
to BCR; and iii) no RNA-seq data.
A total of 414 patients with both RNA-seq data and
corresponding clinicopathological information were included in the
discovery cohort and 377 of them had a GS ≥7. The median age of
patients in the discovery cohort was 61 years (age range, 41–78
years). A total of 138 patients with RNA-seq data and corresponding
clinicopathological parameters were included in the validation
cohort, and 97 of them had a GS ≥7. The median age of patients in
the validation cohort was 58 years (age range, 37–73 years).
Development and validation of the
PCasig
The DEGs in GS=6 and GS ≥7 PCa were analyzed in the
discovery cohort using the edgeR package (version 3.30.0;
http://www.bioconductor.org/packages/release/bioc/html/edgeR.html)
in R software (version 3.5.2; http://www.r-project.org), with |log2 [fold change
(FC)]|>1.0 and a false discovery rate of 0.05 used as the
threshold values. The significant DEGs were considered to be
candidate genes for further analysis.
The RNA-seq data were normalized using the
transcripts per million (TPM) method and a log2-based
transformation (log2TPM) for further survival analysis.
Univariate Cox proportional hazards (PH) regression analysis was
used to analyze the association between the expression levels of
the DEGs and time to BCR in patients with GS ≥7. P<0.05 was
considered to indicate a statistically significant difference. The
least absolute shrinkage and selection operator (LASSO) method was
utilized to screen significant DEGs and to avoid overfitting the
model. The LASSO method can effectively solve the computational
difficulties of estimation in high-dimensional and low-sample size
environments (17).
Based on the results of the LASSO analysis,
multivariate Cox analysis was performed to identify a PCasig and
calculate the risk score of each patient, using weighted estimators
corresponding to each gene expression level. All patients were
divided into low and high score groups according to the median risk
score. Kaplan-Meier curves and a log-rank test were used to assess
the prognostic effect of the prognosis risk score. The PCasig was
applied to the validation cohort to determine whether it could
discriminate high-risk BCR patients. PCasig performance was
assessed by time-dependent receiver operating characteristic (ROC)
curve analysis within 3 and 5 years, and the concordance index
(C-index).
In the present study, the ‘survival’ package was
installed for the R software version 3.5.2 (R Core Team; http://www.R-project.org/). The ‘survival’ package
(v3.1–12; http://cran.r-project.org/web/packages/survival/index.html)
was used to perform Cox regression analysis. In addition, the
following packages were used: i) ‘glmnet’ for LASSO Cox analysis
(version 4.0; http://cran.r-project.org/web/packages/glmnet/index.html);
ii) ‘survminer’ for survival curves (v0.4.7; http://cran.r-project.org/web/packages/survminer/index.html);
iii) ‘survival ROC’ to obtain the area under the curve (AUC)
(v1.0.3; http://cran.r-project.org/web/packages/survivalROC/index.html);
and i) ‘rms’ to calculate the C-index (v5.1–4; http://cran.r-project.org/web/packages/rms/).
Association and comparison of the
PCasig with the clinicopathological parameters
Univariate and multivariate analysis using Cox
regression models was conducted in the discovery cohort to test the
prognostic effect of each parameter and their dependencies. The
present study compared the prognostic performance of the PCasig
against the clinical nomogram constructed using clinicopathological
parameters with respect to time to BCR. P<0.05 was considered to
indicate a statistically significant difference.
Incremental predictive value of the
PCasig for the clinical nomogram
In order to evaluate whether the PCasig could
improve the predictive performance, a new nomogram was constructed,
by adding the PCasig into the clinical nomogram, as a prognostic
factor. Therefore, the incremental value of the PCasig as an
additional candidate predictor was evaluated, the AUC and the
calibration curve were derived, and the net reclassification
improvement (NRI) was calculated using ‘nricens’ package (version
1.6; http://cran.r-project.org/web/packages/nricens/)
(18).
Prognostic effect of the PCasig in
different GS subgroups
The present study also evaluated whether the PCasig
was a significant predictor of BCR compared with other
clinicopathological parameters in different GS subgroups. Cox
regression and Kaplan-Meier curve analyses were performed in the
GS=7 and GS ≥8 subgroups.
Functional enrichment analysis
GO and KEGG pathway enrichment analysis of PCasig
were performed using the ‘cluster profiler’ package (version
3.16.0; http://bioconductor.org/packages/release/bioc/html/clusterProfiler.html)
to examine the GO terms and pathways. P<0.05 was considered to
indicate a statistically significant enrichment.
Cell lines and culture
Human PCa cell lines (PC-3, DU145, 22RV1, C4-2 and
LNCaP) were purchased from The Cell Bank of Type Culture Collection
of the Chinese Academy of Sciences. All the PCa cell lines were
cultured in RPMI-1640 medium supplemented with 10% fetal bovine
serum (cat. no. 10099; Gibco, Thermo Fisher Scientific, Inc.).
Normal prostatic epithelial cells RWPE-1 were purchased from the
American Type Culture Collection and cultured in Keratinocyte Serum
Free Medium (cat. no. 10744-019) supplemented with 5 ng/ml
epidermal growth factor (cat. no. 10450-013) and 1%
penicillin/streptomycin (cat. no. 15140-122; all purchased from
Gibco; Thermo Fisher Scientific, Inc.). All cells were incubated at
37°C in 5% CO2.
RNA extraction and RT-quantitative PCR
assays
Total RNA was extracted from cells with RNAiso Plus
reagent (cat. no. 9109; Takara Bio, Inc.) and cDNA was
reverse-transcribed using the PrimeScript RT reagent kit (cat. no.
RR047A; Takara Bio, Inc.) according to the manufacturer's
instructions. The temperature protocol was as follows: 37°C for 15
min and 85°C for 5 sec for one cycle. Quantitative PCR analysis was
performed using the One Step TB Green® PrimeScript™ PLUS
RT-PCR kit (Perfect Real Time) (cat. no. RR096A; Takara Bio, Inc.),
with a 7500 Fast Real-Time RCR system (Applied Biosystems; Thermo
Fisher Scientific, Inc.). The thermocycling conditions were as
follows: 95°C for 5 sec, 55°C for 30 sec, 72°C for 30 sec and
repeats for 40 cycles. Each measurement was performed in triplicate
and the results were normalized to the GAPDH internal control. The
2−ΔΔCq method was used to calculate the relative
expression levels of target genes (19). All primer sequences are presented in
Table SI.
Statistical analysis
Statistical analyses were conducted using SPSS
version 19.0 software (IBM Corp.). All experiments were performed
in triplicate and numerical data are presented as the mean ±
standard deviation. Differences among PCa and normal prostate cells
were analyzed by one-way ANOVA, and the Dunnett test was used as
the post hoc test. Kaplan-Meier curves and the log-rank tests were
used to assess associations between PCaSig expression and BCR. Cox
proportional hazards analysis was performed to assess the relative
impacts of different groups (high vs. low level) on BCR. The
concordance index (C-index) was used to evaluate the discriminatory
powers of the signature. And calibration plot was used as an
internal validation of the nomogram. P<0.05 was considered to
indicate a statistically significant difference.
Results
Differential gene expression
profiles
A total of 1,307 DEGs between the GS=6 and GS ≥7
groups were identified in the TCGA discovery cohort, according to
the cut-off points of P<0.05 and |log2(FC)|>1.0. Among these,
869 were upregulated and 438 were downregulated (Fig. 2).
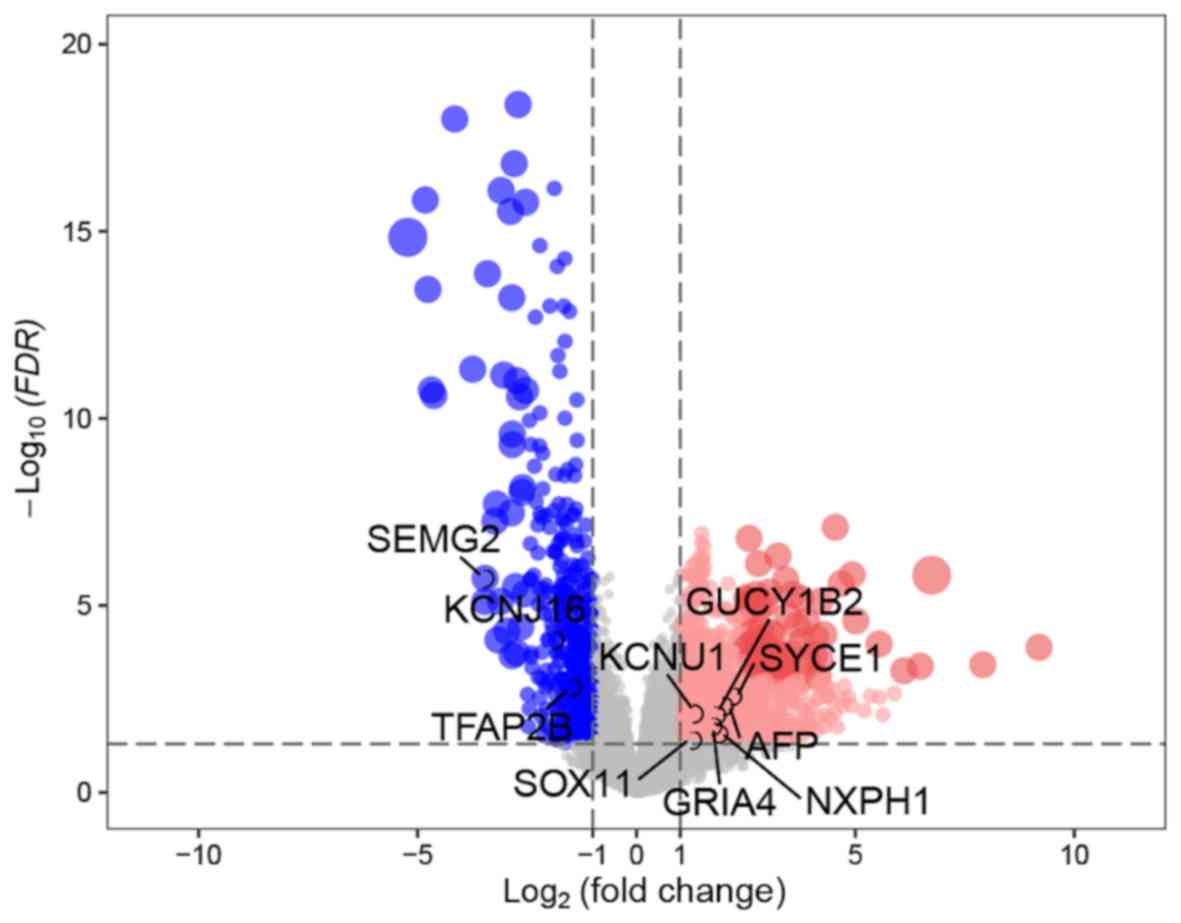 | Figure 2.Volcano plots of differentially
expressed genes in tissues from patients with GS=6 and tissues from
patients with GS ≥7. The x-axis represents the log2-scaled fold
change, whereas the y-axis indicates the log-scaled P-value. Each
symbol corresponds to a different gene, with red dots representing
upregulated genes and blue dots representing downregulated genes
according to the following thresholds: Adjusted P<0.05; and log2
(fold change)=1. GS, Gleason score; FDR, false discovery rate;
KCNU1, potassium calcium-activated channel subfamily U member 1;
SEMG2, semenogelin 2; SOX11, SRY-box transcription factor 11;
KCNJ16, potassium inwardly rectifying channel subfamily J member
16; AFP, α-fetoprotein; GUCY1B2, guanylate cyclase 1 soluble
subunit β 2 (pseudogene); TFAP2B, transcription factor AP-2 β;
GRIA4, glutamate ionotropic receptor AMPA type subunit 4; SYCE1,
synaptonemal complex central element protein 1; NXPH1,
neurexophilin 1. |
Development and validation of the
PCasig
The clinicopathological characteristics in both the
discovery and validation cohorts are presented in Table SII. The mean follow-up time was 31.4
months (range, 1.0–167.5 months) and 43.0 months (range 1.4–126.0
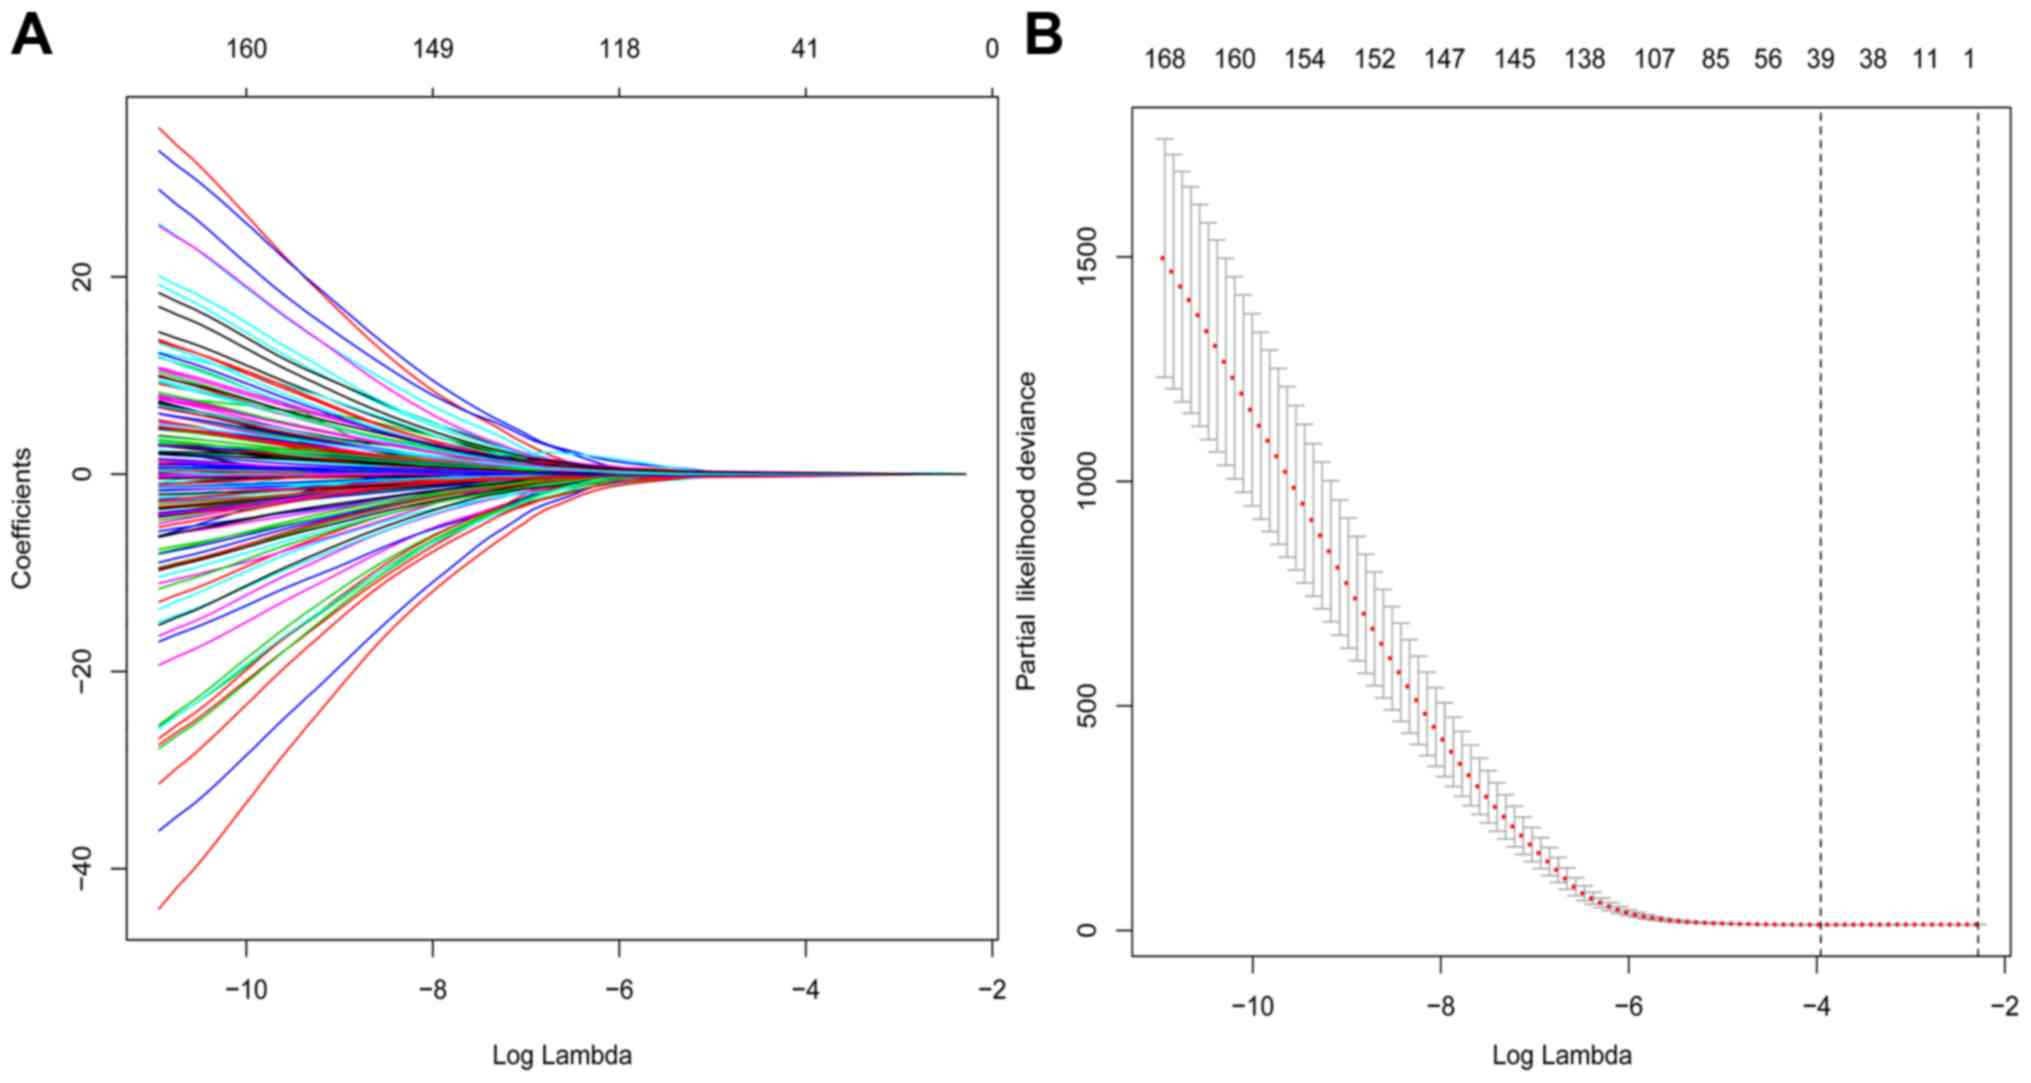
months), respectively. Among the 1,307 DEGs, 171 prognostic genes
were identified using univariate Cox regression analysis in TCGA
cohort, while 39 prognostic genes were identified by LASSO Cox
using 10-fold cross-validation with minimum criteria (Fig. 3).
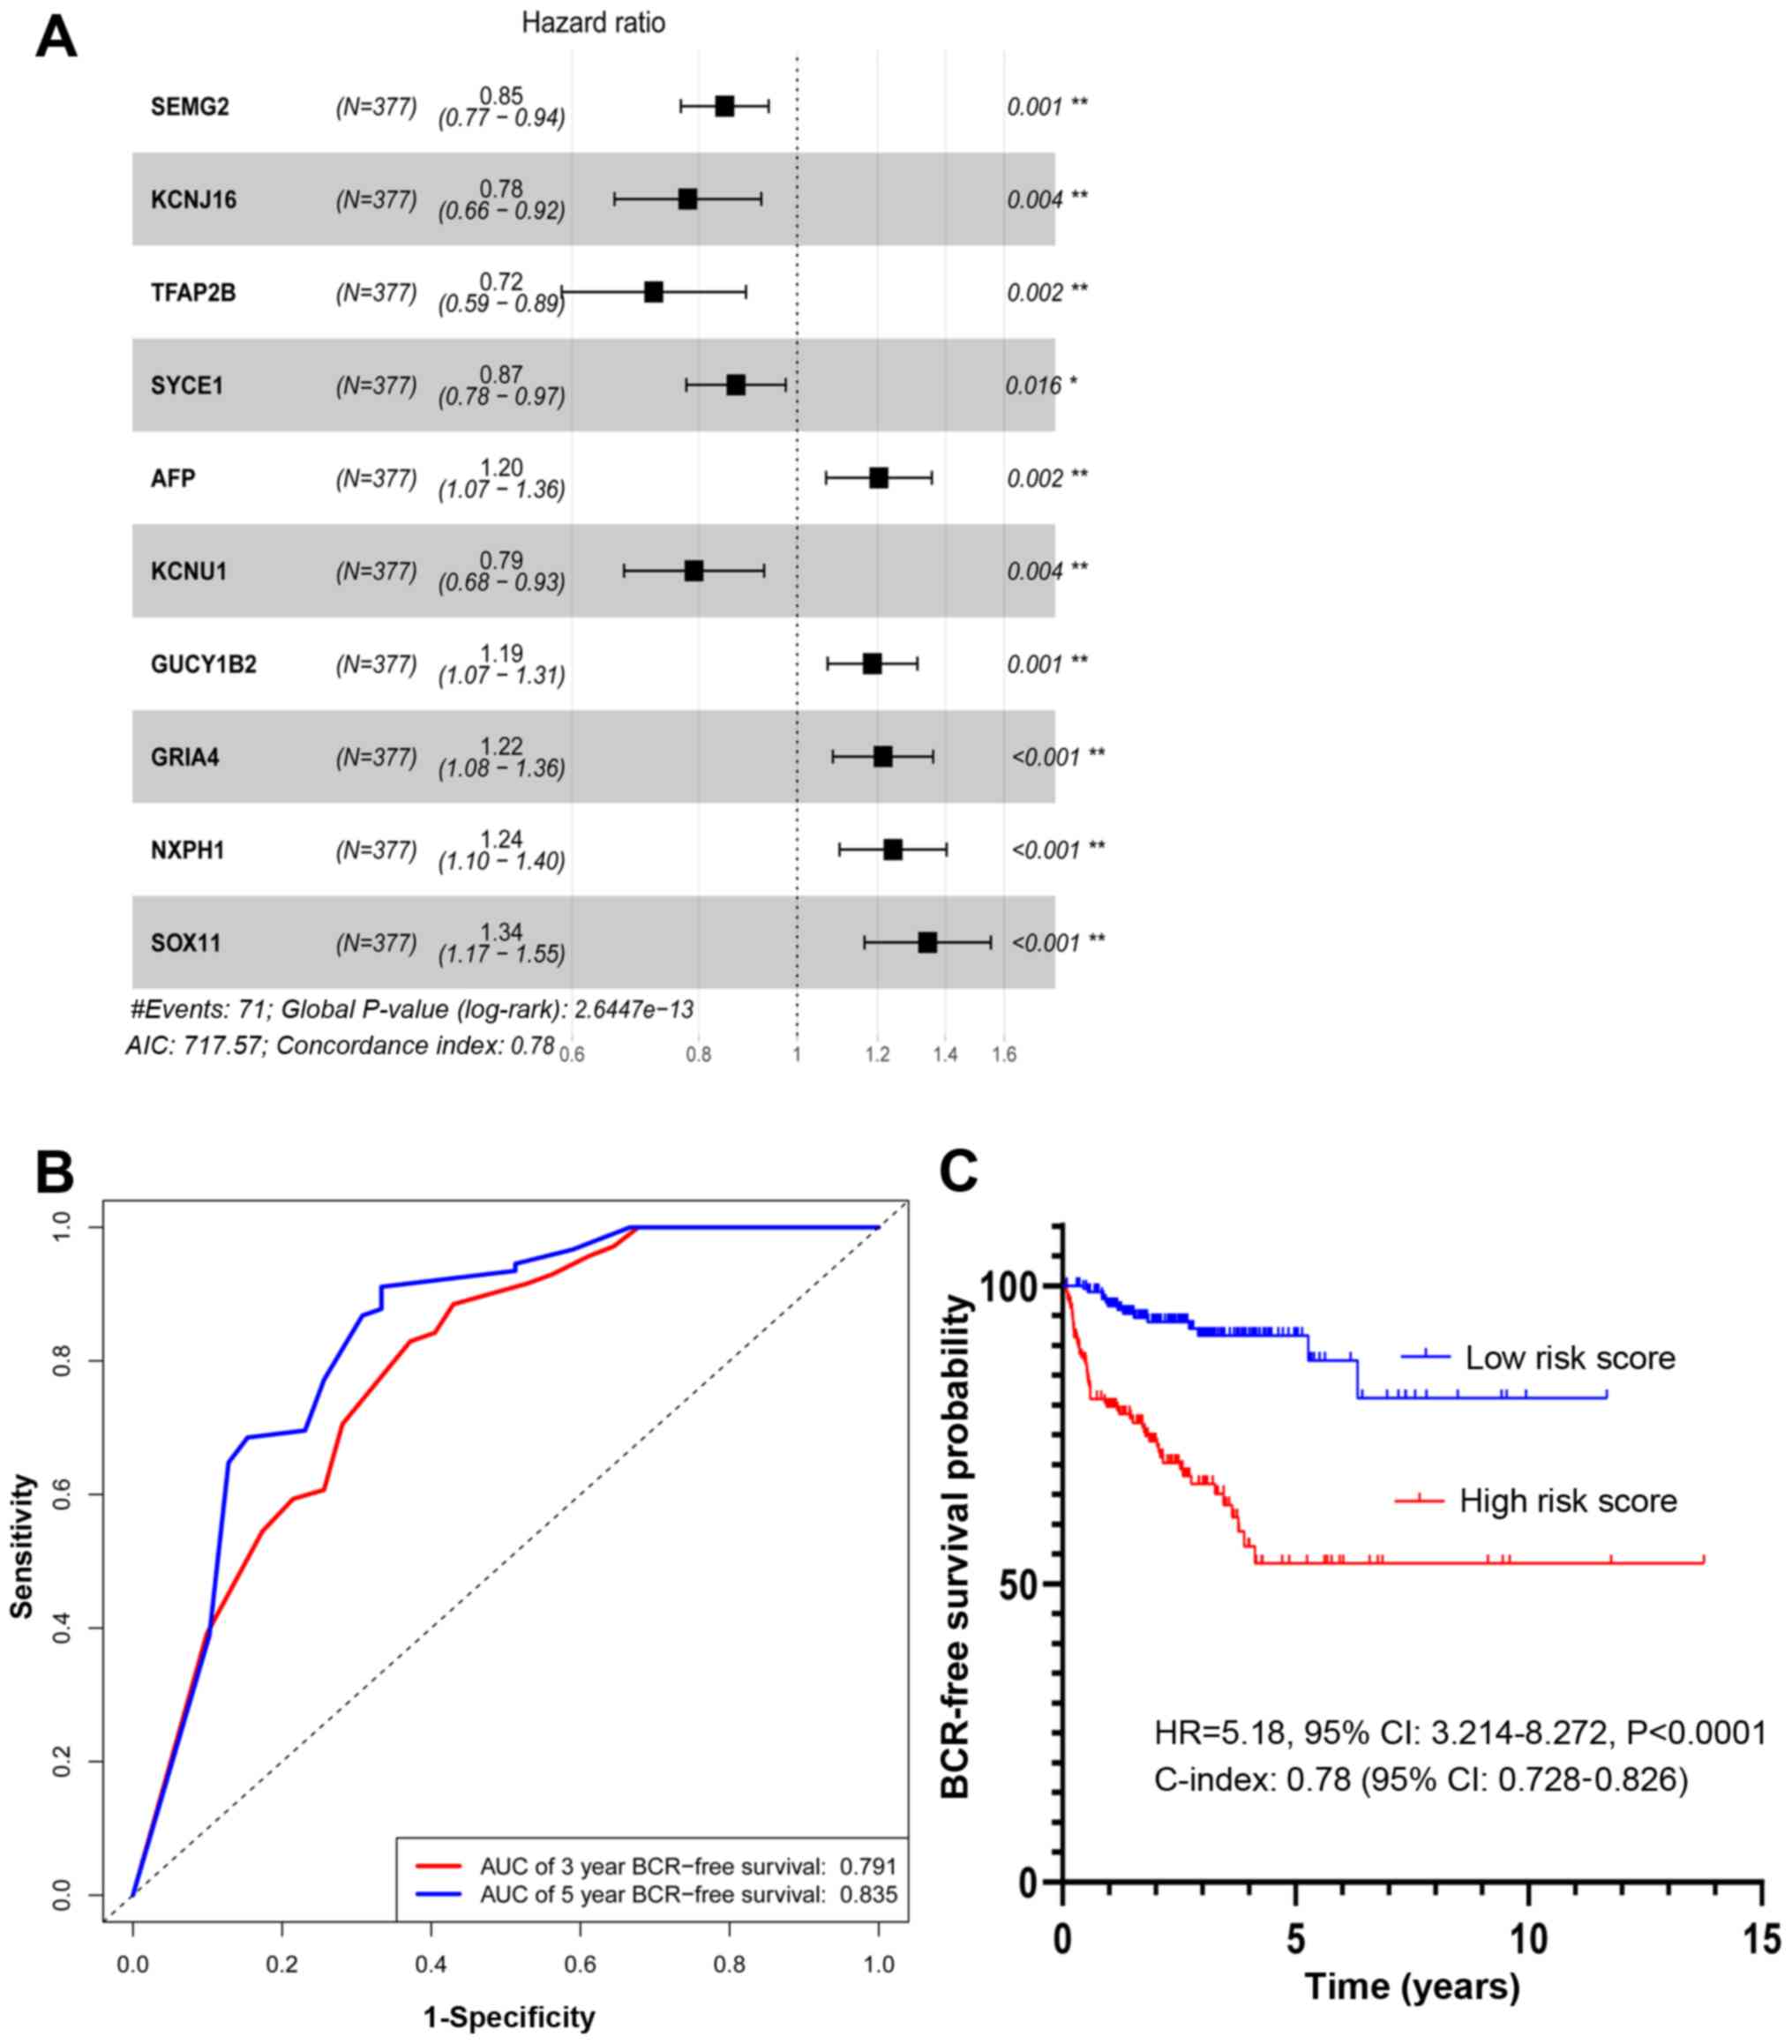
A total of 10 prognostic genes, including potassium
calcium-activated channel subfamily U member 1 (KCNU1), semenogelin
2 (SEMG2), SRY-box transcription factor 11 (SOX11), potassium
inwardly rectifying channel subfamily J member 16 (KCNJ16),
α-fetoprotein (AFP), guanylate cyclase 1 soluble subunit β 2
(GUCY1B2), transcription factor AP-2 β (TFAP2B), glutamate
ionotropic receptor AMPA type subunit 4 (GRIA4), synaptonemal
complex central element protein 1 (SYCE1) and neurexophilin 1
(NXPH1), were identified by multivariate Cox regression analysis
(Fig. 4A).
SEMG2, KCNJ16, TFAP2B, SYCE1 and KCNU1 were
associated with a hazard ratio (HR) <1. By contrast, AFP,
GUCY1B2, GRIA4, NXPH1 and SOX11 had a HR >1. The differential
expression of the 10 prognostic genes between patients with GS=6
and patients with GS ≥7 is presented as a heatmap (Fig. S1).
The AUC for the PCasig was 0.791 and 0.835 for 3-
and 5-year BCR-free survival, respectively (Fig. 4B). The PCasig had a C-index of 0.78
(95% CI, 0.728–0.826).
The risk score for each patient was calculated as
follows: (−0.16× SEMG2 expression level) + (−0.25× KCNJ16
expression level) + (−0.321× TFAP2B expression level) + (−0.14×
SYCE1 expression level) + (−0.23× KCNU1 expression level) + (0.19×
AFP expression level) + (0.17× GUCY1B2 expression level) + (0.20×
GRIA4 expression level) + (0.22× NXPH1 expression level) + (0.30×
SOX11 expression level). A total of 377 patients with GS ≥7 were
divided into a high and a low-score group based on the median of
the score distribution. This stratification of the risk score was
associated with a hazard ratio (HR) of 5.18 (high vs. low; 95% CI,
3.241–8.272; P<0.0001; Fig.
4C).
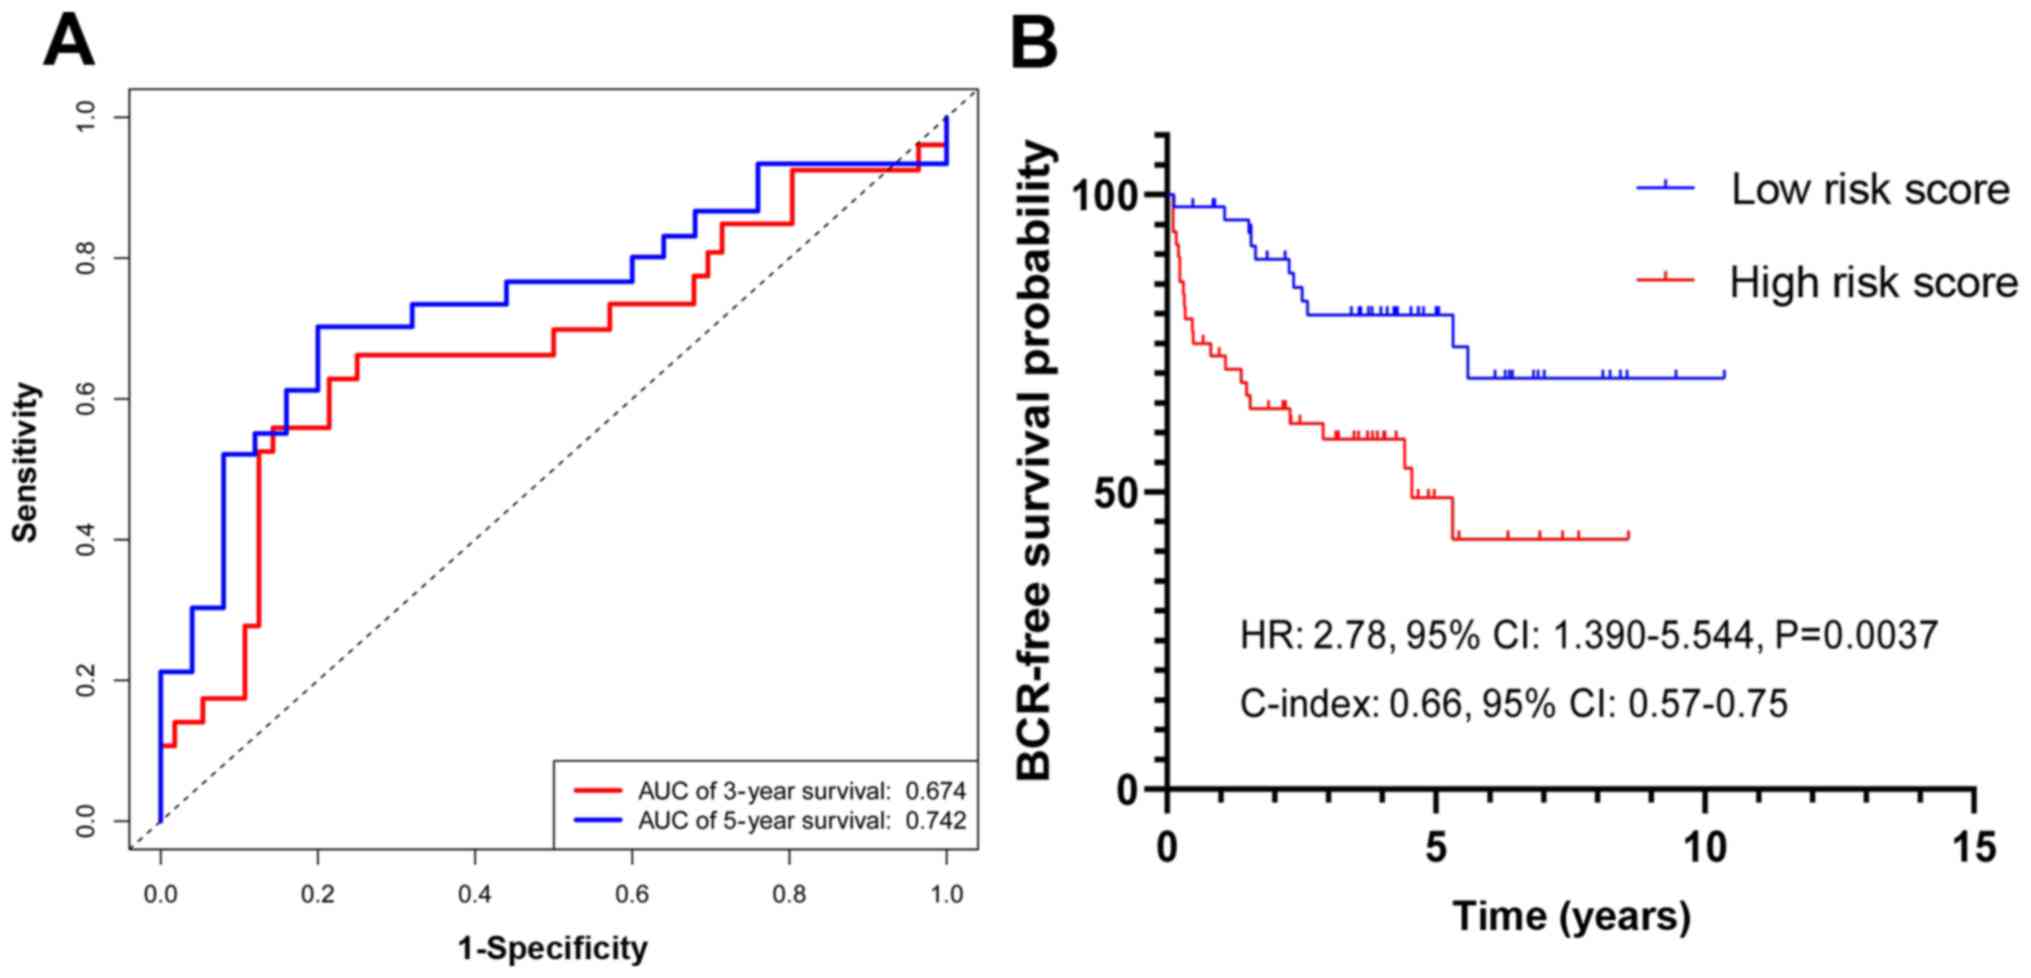
In the validation cohort, the PCasig identified
patients with a high-risk of BCR with an AUC of 0.761 for 5-year
BCR-free survival time (Fig. 5A) and
a C-index of 0.66. The BCR risk of GS ≥7 patients in the high-score
group was significantly higher compared with that in the low-score
group (HR, 2.78; 95% CI, 1.39–5.54; P=0.0037; Fig. 5B).
Association and comparison of the
PCasig with clinicopathological parameters
PCasig and clinicopathological parameters were
analyzed using univariate and multivariate Cox regression analysis
(Tables I and SIII). Regarding the PH Assumption, the
P-value of seven factors, including age, GS, T, stage, N stage,
Clinical M, residual tumor and the PCasig, was >0.05 and the PH
assumption could not be considered violated. The PCasig, GS and T
stage were identified as independent predictors of BCR following RP
in patients with GS ≥7.
 | Table I.Multivariate HR analysis for
clinicopathological variables and risk score in The Cancer Genome
Atlas cohort. |
Table I.
Multivariate HR analysis for
clinicopathological variables and risk score in The Cancer Genome
Atlas cohort.
|
| Multivariate Cox
1 | Multivariate Cox
2 |
|---|
|
|
|
|
|---|
| Variable and
intercept | HR (95% CI) | P-value | HR (95% CI) | P-value |
|---|
| GS |
|
3+4 | 1.00 |
| 1.00 |
|
|
4+3 | 2.56
(0.87–7.51) | 0.046 | 2.21
(0.77–6.36) | 0.09200 |
| ≥8 | 3.97
(1.46–10.73) | 0.0020 | 3.80
(1.45–9.93) | 0.00650 |
| PT |
| T2 | 1.00 |
| 1.00 |
|
|
T3a | 1.99
(0.77–5.08) | 0.020 | 2.94
(1.18–7.25) | 0.02000 |
| T3b +
T4 | 2.84
(1.09–7.37) | 0.0030 | 3.44
(1.40–8.48) | 0.00700 |
| PN |
| N0 | 1.00 |
| 1.00 |
|
| N1 | 135
(0–4.19×1055) | 0.91 | 120.00
(0.00–3.19×1045) | 0.92000 |
| NX | 0.47
(0.11–1.94) | 0.29 | 0.37
(0.11–1.04) | 0.39000 |
| Risk score |
|
Low | NA |
| 1.00 |
|
|
High | NA |
| 3.34
(1.87–6.00) | <0.00010 |
A clinical nomogram was constructed based on the GS
and T stage (Fig. 6A). The AUCs at
the 3- and 5-year BCR-free survival time points were 0.726 and
0.764, respectively (Fig. 6B). The
C-index of the nomogram was 0.713 (95% CI, 0.654–0.772). The BCR of
patients with GS ≥7 in the high risk score group was significantly
higher, compared with that of patients in the low score group (HR,
4.15; 95% CI, 2.56–64; P<0.001; Fig.
6C).
Incremental predictive value of the
PCasig for the clinical nomogram
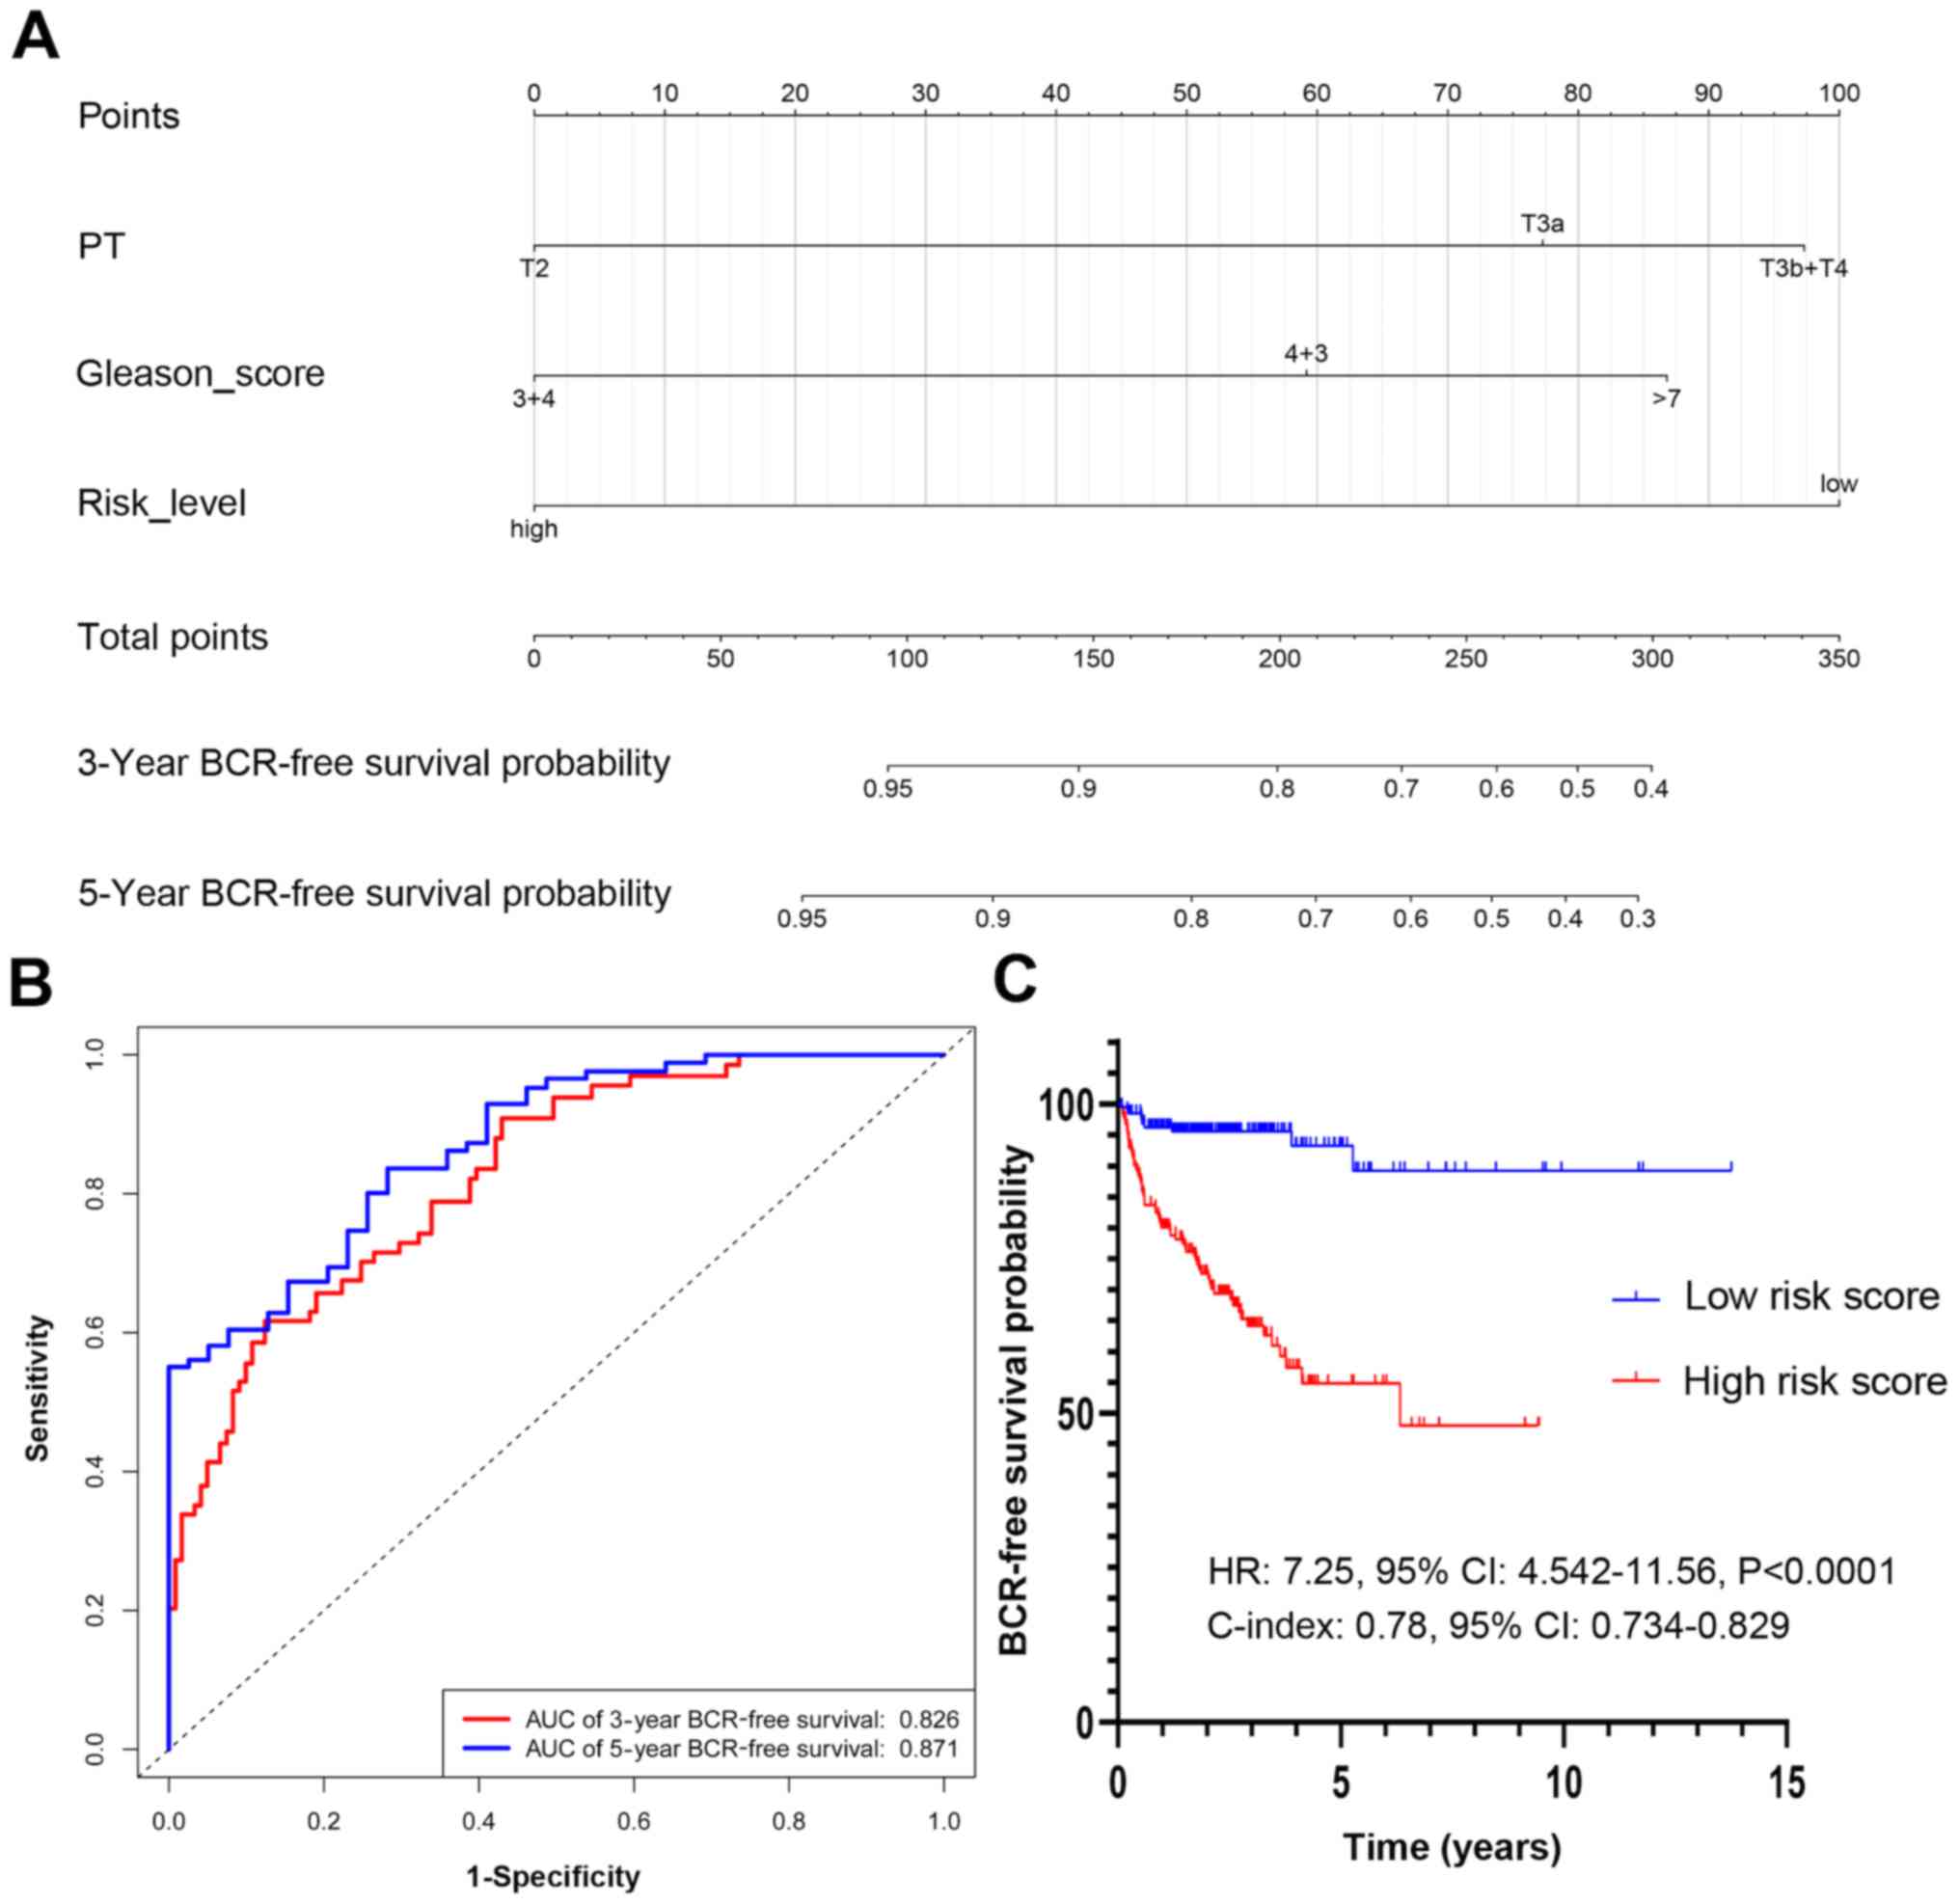
A new nomogram was constructed and included the risk
score, in addition to GS and T stage (Fig. 7A). With the PCasig, the new nomogram
yielded an AUC of 0.826 at the 3-year BCR-free survival time point,
and 0.871 at the 5-year time point (Fig.
7B). The C-index was 0.78 (95% CI, 0.734–0.829). The BCR risk
of patients with GS ≥7 in the high risk score group was
significantly higher compared with that of patients in the low
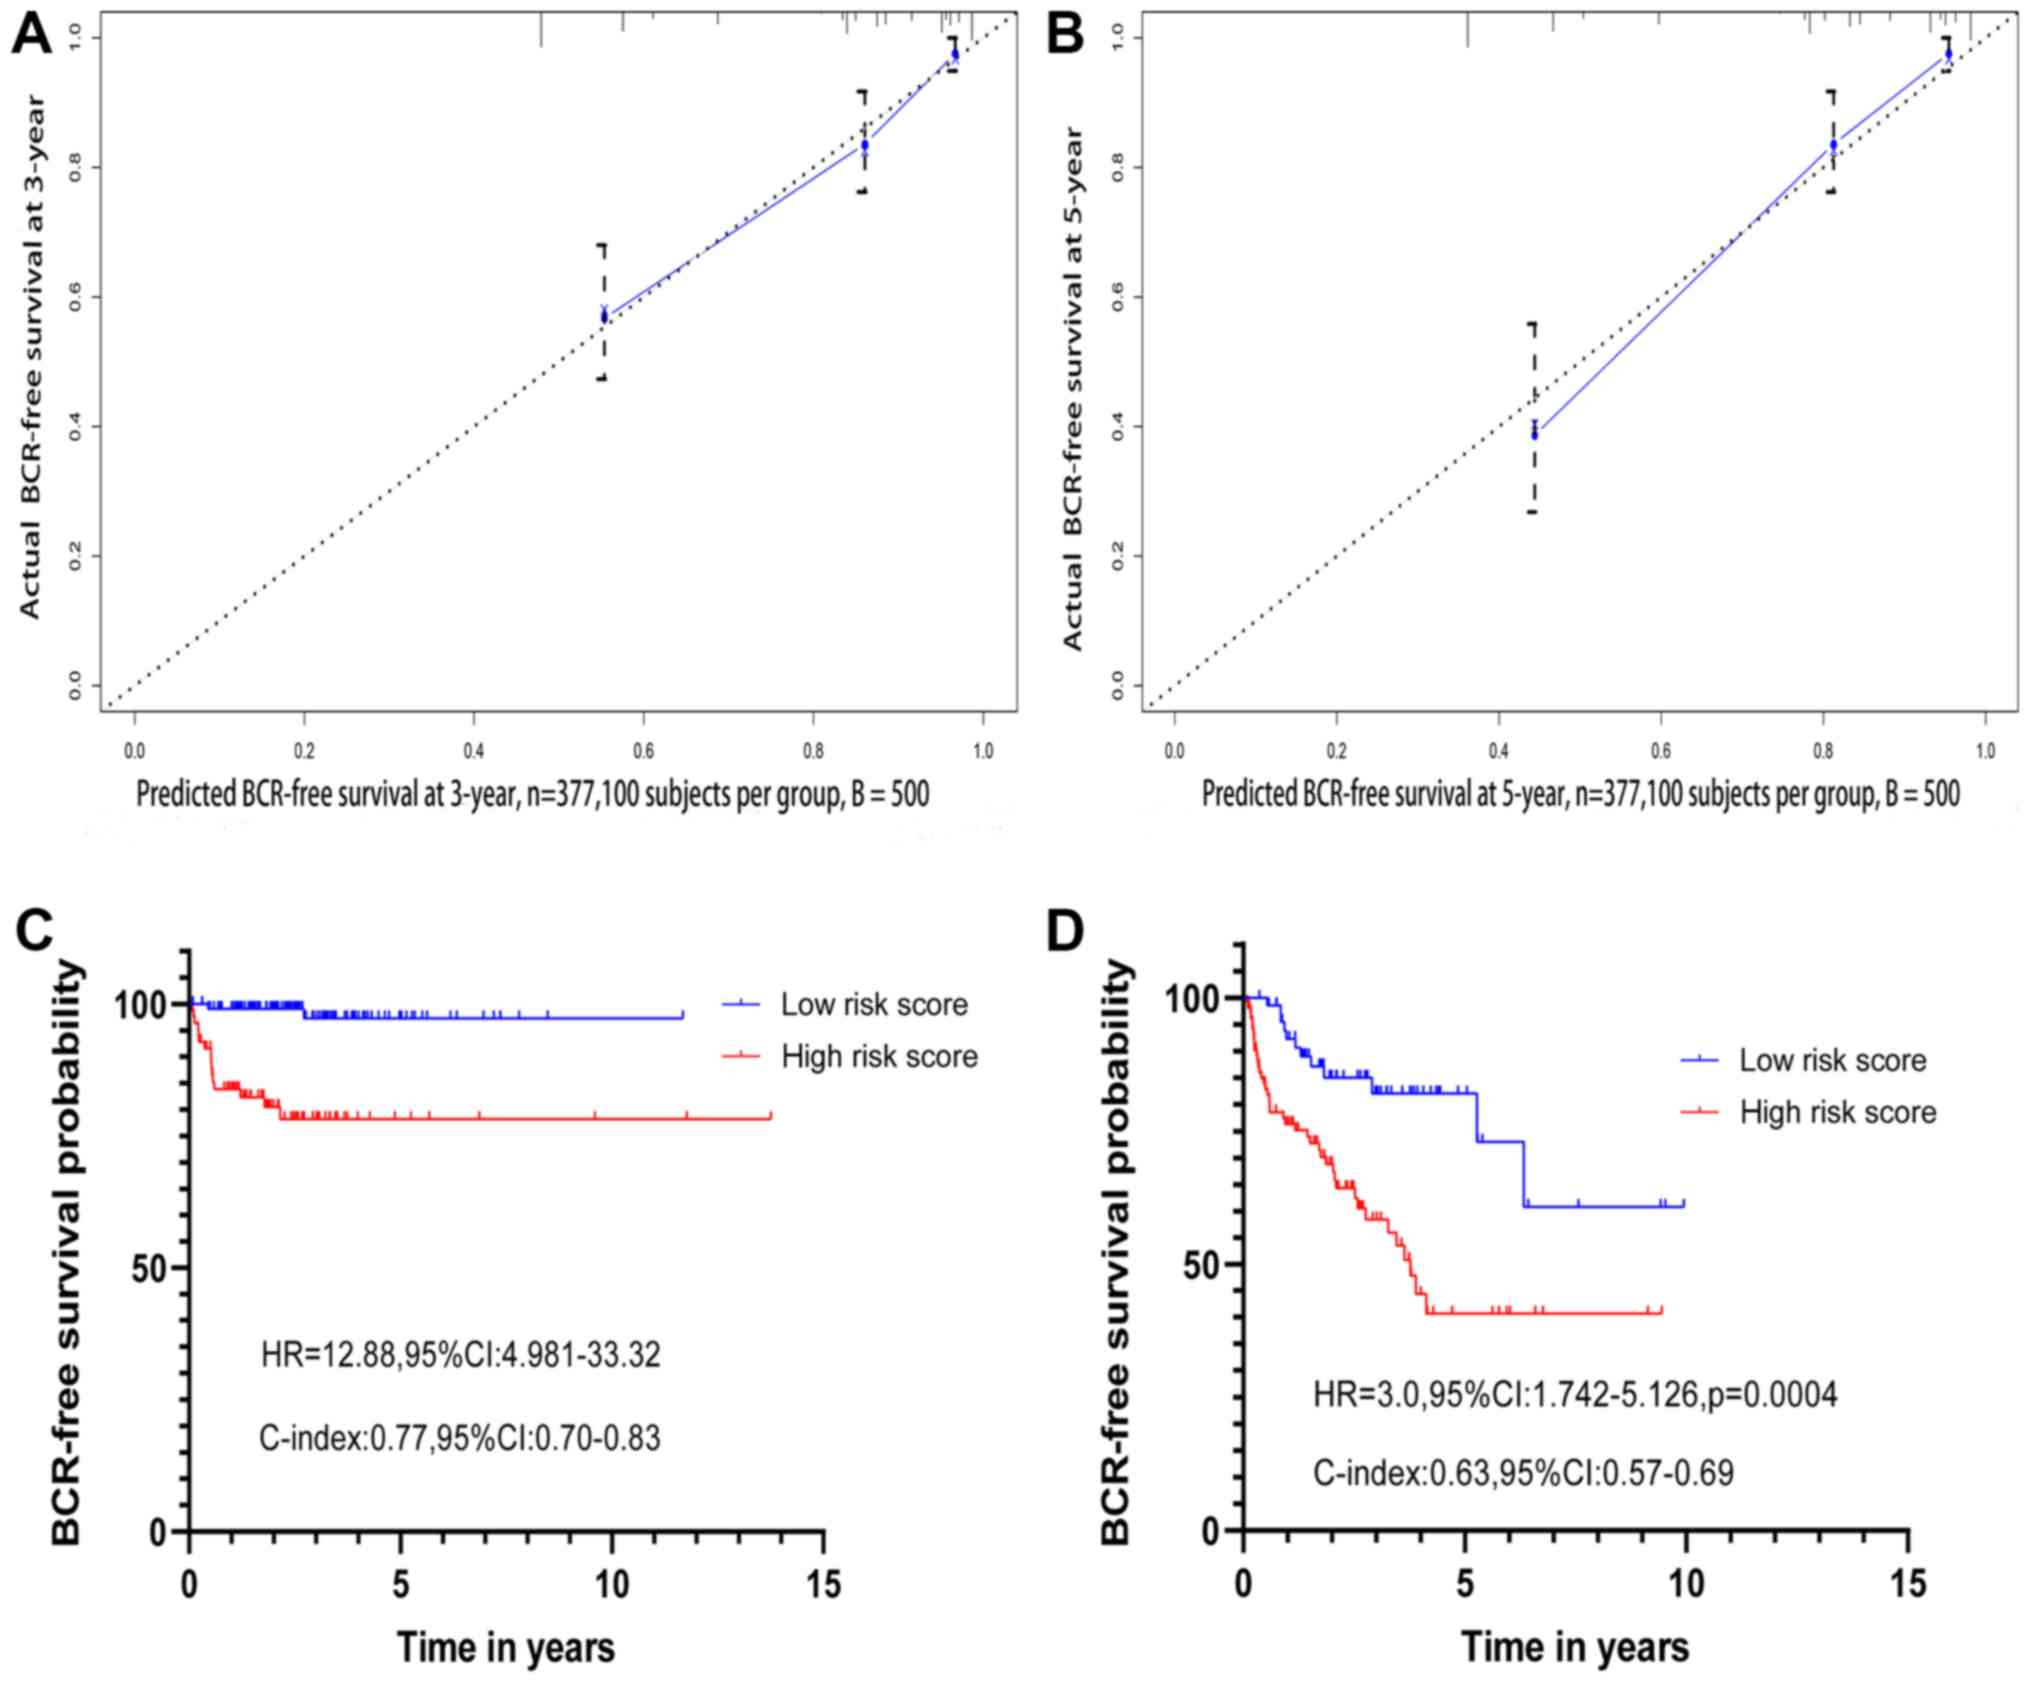
score group (HR, 7.25; 95% CI, 4.54–11.56; P<0.0001; Fig. 7C). The BCR-free survival rate
predicted using the new nomogram was positively associated with the
actual observed rate (Fig. 8A and
B).
The NRI (NRI, 0.75; P<0.0001, event NRI, 0.66;
non-event NRI, 0.09) indicated that the performance was
significantly improved after the integration of the PCasig into the
clinical nomogram. For patients with BCR, the proportion of
reclassification significantly increased by 0.66 (P<0.001),
indicating an improvement of 66% with the incorporation of the
PCasig. For BCR-free patients, the proportion of reclassification
significantly increased by 0.09 (P<0.001), indicating an
improvement of 9% (Fig. S2).
Prognostic effect of the risk score in
different GS subgroups
When limiting the univariate and multivariate
analyses to patients with GS=7 in the discovery cohort, the PCasig
remained the most significant predictor of BCR compared with the
other clinicopathological parameters analyzed in the present study
(HR, 9.29; 95% CI, 2.08–41.30; P=0.0034; Table II). Additionally, as indicated in
Table III, the PCasig remained the
most significant predictor of BCR in the GS ≥8 subgroup (HR, 3.01;
95% CI, 1.58–5.75; P=0.0008).
| Table II.Cox regression analysis for PCasig
and clinicopathological variables in the GS=7 subgroup from The
Cancer Genome Atlas dataset. |
Table II.
Cox regression analysis for PCasig
and clinicopathological variables in the GS=7 subgroup from The
Cancer Genome Atlas dataset.
|
| Univariate Cox | Multivariate
Cox |
|---|
|
|
|
|
|---|
| Variable and
intercept | HR (95% CI) | P-value | HR (95% CI) | P-value |
|---|
| Age, years |
|
|
|
|
|
≤65 | 1.00 |
| NA |
|
|
>65 | 2.48
(0.88–7.00) | 0.08500 | NA |
|
| PT |
|
|
|
|
| T2 | 1.00 |
| 1.00 |
|
|
T3a | 5.20
(1.45–18.80) | 0.01100 | 3.87
(1.04–14.30) | 0.04300 |
| T3b +
T4 | 4.40
(1.00–19.00) | 0.05100 | 2.24
(0.41–12.10) | 0.34000 |
| PN |
|
|
|
|
| N0 | 1.00 |
| 1.00 |
|
| N1 | 6.22
(2.19–17.60) | <0.00010 | 4.70
(1.33–16.80) | 0.01600 |
| NX | 8.20
(0.070–4.19) | 0.56000 | 0.10
(0.11–6.43) | 0.85000 |
| Clinical M |
|
|
|
|
| M0 | 1.00 |
| NA |
|
| M1 |
3.90×10⁻⁸ (0.00–2.43) | 0.99000 | NA |
|
| Residual tumor |
|
|
|
|
| R0 | 1.00 |
|
|
|
| R1 or
R2 | 0.50
(0.12–2.00) | 0.36200 | NA |
|
| RX |
3.30×10⁻⁸ (0.00–1.97) | 0.99800 | NA |
|
| Risk score |
|
|
|
|
|
Low | 1.00 |
| 1.00 |
|
|
High | 13.00
(3.13–12.91) | <0.00010 | 9.29
(2.08–41.30) | 0.00340 |
| Table III.Cox regression analysis for PCasig
and clinicopathological variables in the GS≥8 subgroup from The
Cancer Genome Atlas dataset. |
Table III.
Cox regression analysis for PCasig
and clinicopathological variables in the GS≥8 subgroup from The
Cancer Genome Atlas dataset.
|
| Univariate Cox | Multivariate
Cox |
|---|
|
|
|
|
|---|
| Variable and
intercept | HR (95% CI) | P-value | HR (95% CI) | P-value |
|---|
| Age, years |
|
|
|
|
|
≤65 | 1.00 |
| NA |
|
|
>65 | 0.90
(0.51–1.56) | 0.71400 | NA |
|
| PT |
|
|
|
|
| T2 | 1.00 |
| 1.00 |
|
|
T3a | 2.23
(0.64–7.70) | 0.01100 | 2.40
(0.69–8.40) | 0.16000 |
|
T3b+T4 | 3.88
(1.19–12.60) | 0.02400 | 4.02
(1.20–13.10) | 0.02100 |
| PN |
|
|
|
|
| N0 | 1.00 |
| NA |
|
| N1 | 0.98
(0.54–1.77) | 0.95000 | NA |
|
| NX | 0.29
(0.04–2.18) | 0.23000 | NA |
|
| Clinical M |
|
|
|
|
| M0 | 1.00 |
| NA |
|
| M1 | 0.43
(0.050–3.15) | 0.41000 | NA |
|
| Residual tumor |
|
|
|
|
| R0 | 1.00 |
| NA |
|
| R1 or
R2 | 1.59
(0.92–2.77) | 0.09000 | NA |
|
| RX | 0.24
(0.03–1.80) | 0.17000 | NA |
|
| Risk score |
|
|
|
|
|
Low | 1.00 |
| 1.00 |
|
|
High | 3.00
(1.57–5.73) | 0.00082 | 3.01
(1.58–5.75) | 0.00080 |
The PCasig was used to divide patients with GS=7
(n=201) in the discovery cohort into low- and high-risk groups with
a significant BCR difference (high vs. low; HR, 12.88; 95% CI,
4.981–33.32; P<0.0001) with a C-index of 0.77 (Fig. 8C). The PCasig was also used to divide
patients with GS ≥8 into low and high-risk groups, which had a
significantly different BCR risk (high vs. low; HR, 3.0; 95% CI,
1.742–5.126; P=0.0004) with a C-index of 0.63 (Fig. 8D).
Functional enrichment analysis
A total of 17 GO terms, including biological
processes, cellular components and molecular functions, and five
KEGG signaling pathways were enriched for the 9 mRNAs, as indicated
in Table SIV. GO terms and KEGG
pathway analysis demonstrated that the 9 mRNAs associated gene sets
regulated ‘transmembrane receptor protein serine/threonine kinase
signaling pathway’, ‘BMP signaling pathway’, ‘cation channel
complex’ and ‘ion channel complex’, ‘RNA polymerase II core
promoter sequence-specific DNA binding’, ‘RNA polymerase II
transcription coactivator activity’, ‘nicotine addiction and
amphetamine addiction’.
Expression of the genes analyzed in
PCa and normal prostate cell lines
To verify whether the genes identified in the PCasig
might be involved in PCa oncogenesis, the endogenous mRNA
expression of all 9 genes was measured in five tumor-derived PCa
cell lines (PC-3, DU145, 22RV1, LNCaP and C4-2) and a normal
prostate cell line (RWPE-1) by quantitative PCR analysis. The
results demonstrated that these genes exhibited relatively
different expression in PCa cells compared with in normal prostate
cell lines (Fig. 9).
 | Figure 9.Endogenous expression of the 9 mRNAs.
Expression of 9 mRNAs was measured using reverse
transcription-quantitative PCR in five prostate cancer (PC-3,
DU145, 22Rv1, LNCaP and C4-2) and one normal prostate (RWPE-1) cell
lines. GAPDH was used as an internal reference. *P<0.05,
**P<0.01, ***P<0.001 vs. RWPE-1. (A) KCNU1, (B) SEMG2, (C)
SOX11 (D) KCNJ16, (E) AFP, (F) TFAP2B, (G) GRIA4, (H) SYCE1, (I)
NXPH1. ns, not significant; KCNU1, potassium calcium-activated
channel subfamily U member 1; SEMG2, semenogelin 2; SOX11, SRY-box
transcription factor 11; KCNJ16, potassium inwardly rectifying
channel subfamily J member 16; AFP, α-fetoprotein; TFAP2B,
transcription factor AP-2 β; GRIA4, glutamate ionotropic receptor
AMPA type subunit 4; SYCE1, synaptonemal complex central element
protein 1; NXPH1, neurexophilin 1. |
Discussion
BCR prognostic tools are essential for the
improvement of current treatment options for PCa and to reduce
PCa-associated mortality for patients experiencing BCR following RP
(5). Although previous studies have
identified numerous potential biomarkers associated with prognosis
and PCa progression, few of these markers have been applied in a
clinical setting (20).
In the present study, the PCasig was developed using
Cox regression and LASSO Cox analyses for the individualized
prediction of BCR in patients with GS ≥7 from a TCGA dataset and
validated in an Oncomine cohort. The PCasig consisted of 10 genes,
including SEMG2, SOX11, AFP, KCNJ16, TFAP2B, SYCE1, KCNU1, GUCY1B2,
GRIA4 and NXPH1. The signature may be used to classify patients
with PCa into groups with low- and high-risk of BCR, which had
significant differences in 3- and 5-year BCR-free survival time,
with AUCs of 0.826 and 0.871, respectively. These results suggested
that the PCasig could serve as a predictor of BCR-free survival.
Additionally, a clinical nomogram was constructed for comparison
with the PCasig in the TCGA cohort, revealing improved performance
of the clinical nomogram after incorporation of the PCasig (the
PCasig vs. clinical nomogram; AUC, 0.835 vs. 0.764; C-index: 0.777
vs. 0.713). To assess the independence of the PCasig in predicting
BCR-free survival, univariate and multivariate Cox regression
analyses were performed and the risk scores of patients based on
the PCasig maintained a good association with BCR-free survival.
The PCasig was combined with clinicopathological data to construct
a nomogram to predict BCR after RP. Incorporating the PCasig and
clinical factors into the nomogram significantly improved the
performance of the clinical nomogram in predicting BCR after RP,
facilitating the construction of an individualized treatment for
BCR after RP. The NRI (NRI, 0.75; P<0.001, event NRI, 0.66;
non-event NRI, 0.09) indicated that performance was significantly
improved following the integration of the PCasig into the clinical
nomogram. The subgroup analysis further indicated a good prognostic
value of the PCasig, regardless of GS. In addition, the endogenous
mRNA expression of genes in the PCasig were measured in PCa cell
lines and normal prostate cells, providing a basis for further
functional studies on the role of these genes in PCa. Overall, the
present findings highlighted the added value of the PCasig for the
prediction of BCR in patients with PCa.
Previous studies have investigated the functional
role of the 10 genes in the PCasig in cancer progression. For
example, SEMG2 has been previously identified as a biomarker for
lung cancer (21). SOX11 acts as a
transcriptional regulator after forming a protein complex with
other proteins. SOX11 overexpression can suppress proliferation,
invasion and migration of PCa cells in vitro (22). AFP is a major plasma protein produced
by the yolk sac and the liver during fetal life. The aberrant
expression in adults is often associated with hepatoma or teratoma
(23). It has been previously
reported that AFP is negatively regulated by AT-binding
transcription factor 1 (ATBF1) (24). Sun et al (25), reported that loss of ATBF1 is one
mechanism that defines the progression in PCa. KCNJ16 is a
potassium channel gene, which functions in fluid and pH balance
regulation. Downregulation of KCNJ16 may lead to an imbalance in
ion concentration between the extracellular and intracellular
compartments, and influence tumor progression through multiple
paths, including cell adhesion or migration, angiogenesis and
apoptosis (26). TFAP2B
transcription factor is a member of the AP-2 family, which serves
an important role in cell apoptosis and autophagy (27). TFAP2B is also detectable in
endometrial cancer, and patients with low TFAP2B expression have a
worse prognosis compared with patients with high TFAP2B expression
(28). SYCE1 consists of two lateral
elements and a central region formed by transverse elements and a
central element. In addition, SYCE1 may interact with chromosome 14
open reading frame 39 serving a role in the early stages of meiosis
and the cell cycle (29).
Furthermore, it has been suggested that SYCE1 may be a promising
immunotherapy approach for lung adenocarcinoma (30). The potassium voltage-gated ion
channel KCNU1 is regulated by calcium ion levels, which is critical
for human fertility (31). KCNU1 may
be activated by both intracellular pH and membrane voltage that
mediates the export of K+ (32). GUCY1B2 is considered a pseudogene
with a frameshift mutation on the Genbank website (https://cipotato.org/genebankcip/) and its role
in PCa is not yet fully understood (33). Excitatory neurotransmitter receptor
GRIA4 has been identified as a biomarker for colorectal cancer,
which may vary in signal transduction properties (34,35).
NXPH1 functions as a secreted protein that promotes cell adhesion
(36). High expression of NXPH1 is
associated with poor prognosis in patients with breast cancer
(37). Therefore, since these genes
appear to serve several biological functions in multiple human
malignancies, understanding the underlying role of each of these 10
genes in PCa would provide novel insights into the functional
relevance of the PCasig.
However, there are some limitations in the present
study. Firstly, since TCGA and Oncomine lack data regarding
pre-surgical serum PSA, an association between PSA and BCR could
not be determined. Secondly, future experimental studies should be
conducted to examine the functional role of the genes identified in
the present study and validate their expression at the protein
level.
In conclusion, the present study identified a gene
cluster that may act as an independent prognostic factor, or
signature, with greater prognostic value for all patients
regardless of GS, which can significantly improve the performance
of clinical nomograms in predicting BCR of patients with PCa and GS
≥7.
Supplementary Material
Supporting Data
Acknowledgements
Not applicable.
Funding
The present study was supported by The National
Natural Science Foundation of China (grant no. 81600542), The
Guangdong Basic and Applied Basic Research Foundation (grant no.
2019A1515110033), The Distinguished Young Talents in Higher
Education Foundation of Guangdong Province (grant no.
2019KQNCX115), China Postdoctoral Science Foundation (grant no.
2019M662865) and achievement cultivation and clinical
transformation application cultivation projects of the First
Affiliated Hospital of Guangzhou Medical University (grant no.
ZH201908). Additional funding was provided by the Guangzhou Science
Technology and Innovation Commission (grant nos. 201604020001 and
No.201704020193), and The Project of Health and Family Planning
Commission of Guangzhou Municipality (grant no. 20181A010051).
Availability of data and materials
The datasets generated and/or analyzed during the
current study are available in the TCGA repository (https://portal.gdc.cancer.gov) and Oncomine website
(https://www.oncomine.org/resource/main.html).
Authors' contributions
YL and DG conceived of the study and participated in
its design and coordination. XW, DL, ML, CC, ZZ and ME contributed
to analysis and interpretation of data and were involved in
drafting the manuscript. All authors read and approved the final
manuscript.
Ethics approval and consent to
participate
Not applicable.
Patient consent for publication
Not applicable.
Competing interests
The authors declare that they have no competing
interests.
References
|
1
|
Siegel RL, Miller KD and Jemal A: Cancer
statistics, 2020. CA Cancer J Clin. 70:7–30. 2020. View Article : Google Scholar : PubMed/NCBI
|
|
2
|
Chen W, Zheng R, Baade PD, Zhang S, Zeng
H, Bray F, Jemal A, Yu XQ and He J: Cancer statistics in China,
2015. CA Cancer J Clin. 66:115–132. 2016. View Article : Google Scholar : PubMed/NCBI
|
|
3
|
Lalonde E, Ishkanian AS, Sykes J, Fraser
M, Ross-Adams H, Erho N, Dunning MJ, Halim S, Lamb AD, Moon NC, et
al: Tumour genomic and microenvironmental heterogeneity for
integrated prediction of 5-year biochemical recurrence of prostate
cancer: A retrospective cohort study. Lancet Oncol. 15:1521–1532.
2014. View Article : Google Scholar : PubMed/NCBI
|
|
4
|
Van den Broeck T, van den Bergh RCN, Arfi
N, Gross T, Moris L, Briers E, Cumberbatch M, De Santis M, Tilki D,
Fanti S, et al: Prognostic value of biochemical recurrence
following treatment with curative intent for prostate cancer: A
systematic review. Eur Urol. 75:967–987. 2019. View Article : Google Scholar : PubMed/NCBI
|
|
5
|
Brockman JA, Alanee S, Vickers AJ,
Scardino PT, Wood DP, Kibel AS, Lin DW, Bianco FJ Jr, Rabah DM,
Klein EA, et al: Nomogram predicting prostate cancer-specific
mortality for men with biochemical recurrence after radical
prostatectomy. Eur Urol. 67:1160–1167. 2015. View Article : Google Scholar : PubMed/NCBI
|
|
6
|
Fraser M, Berlin A, Bristow RG and van der
Kwast T: Genomic, pathological, and clinical heterogeneity as
drivers of personalized medicine in prostate cancer. Urol Onco.
33:85–94. 2015. View Article : Google Scholar
|
|
7
|
Burke HB: Predicting clinical outcomes
using molecular biomarkers. Biomark Cancer. 8:89–99. 2016.
View Article : Google Scholar : PubMed/NCBI
|
|
8
|
Amaro A, Esposito AI, Gallina A, Nees M,
Angelini G, Albini A and Pfeffer U: Validation of proposed prostate
cancer biomarkers with gene expression data: A long road to travel.
Cancer Metastasis Rev. 33:657–671. 2014. View Article : Google Scholar : PubMed/NCBI
|
|
9
|
Gleason DF and Mellinger GT: Prediction of
prognosis for prostatic adenocarcinoma by combined histological
grading and clinical staging. J Urol. 111:58–64. 1974. View Article : Google Scholar : PubMed/NCBI
|
|
10
|
Ross HM, Kryvenko ON, Cowan JE, Simko JP,
Wheeler TM and Epstein JI: Do adenocarcinomas of the prostate with
Gleason score (GS) </=6 have the potential to metastasize to
lymph nodes? Am J Surg Pathol. 36:1346–1352. 2012. View Article : Google Scholar : PubMed/NCBI
|
|
11
|
Epstein JI, Zelefsky MJ, Sjoberg DD,
Nelson JB, Egevad L, Magi-Galluzzi C, Vickers AJ, Parwani AV,
Reuter VE, Fine SW, et al: A contemporary prostate cancer grading
system: A validated alternative to the gleason score. Eur Urol.
69:428–435. 2016. View Article : Google Scholar : PubMed/NCBI
|
|
12
|
Esserman LJ, Thompson IM, Reid B, Nelson
P, Ransohoff DF, Welch HG, Hwang S, Berry DA, Kinzler KW, Black WC,
et al: Addressing overdiagnosis and overtreatment in cancer: A
prescription for change. Lancet Oncol. 15:e234–e242. 2014.
View Article : Google Scholar : PubMed/NCBI
|
|
13
|
Yin Y, Zhang Q, Zhang H, He Y and Huang J:
Molecular signature to risk-stratify prostate cancer of
intermediate risk. Clin Cancer Res. 23:6–8. 2017. View Article : Google Scholar : PubMed/NCBI
|
|
14
|
Beauval JB, Roumiguié M, Filleron T,
Benoit T, de la Taille A, Malavaud B, Salomon L, Soulié M and
Ploussard G: Biochemical recurrence-free survival and pathological
outcomes after radical prostatectomy for high-risk prostate cancer.
BMC Urol. 16:262016. View Article : Google Scholar : PubMed/NCBI
|
|
15
|
Gearman DJ, Morlacco A, Cheville JC,
Rangel LJ and Karnes RJ: Comparison of pathological and oncologic
outcomes of favorable risk gleason score 3 + 4 and low risk gleason
score 6 prostate cancer: Considerations for active surveillance. J
Urol. 199:1188–1195. 2018. View Article : Google Scholar : PubMed/NCBI
|
|
16
|
Mohler JL, Antonarakis ES, Armstrong AJ,
D'Amico AV, Davis BJ, Dorff T, Eastham JA, Enke CA, Farrington TA,
Higano CS, et al: Prostate cancer, version 2.2019, NCCN clinical
practice guidelines in oncology. J Natl Compr Canc Netw.
17:479–505. 2019. View Article : Google Scholar : PubMed/NCBI
|
|
17
|
Kaneko S, Hirakawa A and Hamada C:
Enhancing the lasso approach for developing a survival prediction
model based on gene expression data. Comput Math Methods Med.
2015:2594742015. View Article : Google Scholar : PubMed/NCBI
|
|
18
|
Pencina MJ, D'Agostino RB Sr and
Steyerberg EW: Extensions of net reclassification improvement
calculations to measure usefulness of new biomarkers. Stat Med.
30:11–21. 2011. View
Article : Google Scholar : PubMed/NCBI
|
|
19
|
Livak KJ and Schmittgen TD: Analysis of
relative gene expression data using real-time quantitative PCR and
the 2(-Delta Delta C(T)) method. Methods. 25:402–408. 2001.
View Article : Google Scholar : PubMed/NCBI
|
|
20
|
Abou-Ouf H, Alshalalfa M, Takhar M, Erho
N, Donnelly B, Davicioni E, Karnes RJ and Bismar TA: Validation of
a 10-gene molecular signature for predicting biochemical recurrence
and clinical metastasis in localized prostate cancer. J Cancer Res
Clin Oncol. 144:883–891. 2018. View Article : Google Scholar : PubMed/NCBI
|
|
21
|
Luo WM, Wang ZY and Zhang X:
Identification of four differentially methylated genes as
prognostic signatures for stage I lung adenocarcinoma. Cancer Cell
Int. 18:602018. View Article : Google Scholar : PubMed/NCBI
|
|
22
|
Yao Z, Sun B, Hong Q, Yan J, Mu D, Li J,
Sheng H and Guo H: The role of tumor suppressor gene SOX11 in
prostate cancer. Tumour Biol. 36:6133–6138. 2015. View Article : Google Scholar : PubMed/NCBI
|
|
23
|
Hirschfield H, Bian CB, Higashi T,
Nakagawa S, Zeleke TZ, Nair VD, Fuchs BC and Hoshida Y: In vitro
modeling of hepatocellular carcinoma molecular subtypes for
anti-cancer drug assessment. Exp Mol Med. 50:e4192018. View Article : Google Scholar : PubMed/NCBI
|
|
24
|
Ninomiya T, Mihara K, Fushimi K, Hayashi
Y, Hashimoto-Tamaoki T and Tamaoki T: Regulation of the
alpha-fetoprotein gene by the isoforms of ATBF1 transcription
factor in human hepatoma. Hepatology. 35:82–87. 2002. View Article : Google Scholar : PubMed/NCBI
|
|
25
|
Sun X, Frierson HF, Chen C, Li C, Ran Q,
Otto KB, Cantarel BL, Vessella RL, Gao AC, Petros J, et al:
Frequent somatic mutations of the transcription factor ATBF1 in
human prostate cancer. Nat Genet. 37:407–412. 2005. View Article : Google Scholar : PubMed/NCBI
|
|
26
|
Pardo LA and Stühmer W: The roles of K(+)
channels in cancer. Nat Rev Cancer. 14:39–48. 2014. View Article : Google Scholar : PubMed/NCBI
|
|
27
|
Ren KW, Li YH, Wu G, Ren JZ, Lu HB, Li ZM
and Han XW: Quercetin nanoparticles display antitumor activity via
proliferation inhibition and apoptosis induction in liver cancer
cells. Int J Oncol. 50:1299–1311. 2017. View Article : Google Scholar : PubMed/NCBI
|
|
28
|
Wu H and Zhang J: Decreased expression of
TFAP2B in endometrial cancer predicts poor prognosis: A study based
on TCGA data. Gynecol Oncol. 149:592–597. 2018. View Article : Google Scholar : PubMed/NCBI
|
|
29
|
Gómez HL, Felipe-Medina N, Sánchez-Martin
M, Davies OR, Ramos I, García-Tuñón I, de Rooij DG, Dereli I, Tóth
A, Benavente R, et al: C14ORF39/SIX6OS1 is a constituent of the
synaptonemal complex and is essential for mouse fertility. Nat
Commun. 7:132982016. View Article : Google Scholar : PubMed/NCBI
|
|
30
|
Taguchi A, Taylor AD, Rodriguez J,
Çeliktaş M, Liu H, Ma X, Zhang Z, Wong CH, Chin H, Girard L, et al:
A search for novel cancer/testis antigens in lung cancer identifies
VCX/Y genes, expanding the repertoire of potential
immunotherapeutic targets. Cancer Res. 74:4694–4705. 2014.
View Article : Google Scholar : PubMed/NCBI
|
|
31
|
Geng Y, Ferreira JJ, Dzikunu V, Butler A,
Lybaert P, Yuan P, Magleby KL, Salkoff L and Santi CM: A genetic
variant of the sperm-specific SLO3 K+ channel has
altered pH and Ca2+ sensitivities. J Biol Chem.
292:8978–8987. 2017. View Article : Google Scholar : PubMed/NCBI
|
|
32
|
Shukla KK, Mahdi AA and Rajender S: Ion
channels in sperm physiology and male fertility and infertility. J
Androl. 33:777–788. 2012. View Article : Google Scholar : PubMed/NCBI
|
|
33
|
Bossini-Castillo L, de Kovel C, Kallberg
H, van 't Slot R, Italiaander A, Coenen M, Tak PP, Posthumus MD,
Wijmenga C, Huizinga T, et al: A genome-wide association study of
rheumatoid arthritis without antibodies against citrullinated
peptides. Ann Rheum Dis. 74:e152015. View Article : Google Scholar : PubMed/NCBI
|
|
34
|
Hauptman N, Jevšinek Skok D, Spasovska E,
Boštjančič E and Glavač D: Genes CEP55, FOXD3, FOXF2, GNAO1, GRIA4,
and KCNA5 as potential diagnostic biomarkers in colorectal cancer.
BMC Med Genomics. 12:542019. View Article : Google Scholar : PubMed/NCBI
|
|
35
|
Barault L, Amatu A, Siravegna G, Ponzetti
A, Moran S, Cassingena A, Mussolin B, Falcomatà C, Binder AM,
Cristiano C, et al: Discovery of methylated circulating DNA
biomarkers for comprehensive non-invasive monitoring of treatment
response in metastatic colorectal cancer. Gut. 67:1995–2005. 2018.
View Article : Google Scholar : PubMed/NCBI
|
|
36
|
Born G, Breuer D, Wang S, Rohlmann A,
Coulon P, Vakili P, Reissner C, Kiefer F, Heine M, Pape HC and
Missler M: Modulation of synaptic function through the
alpha-neurexin-specific ligand neurexophilin-1. Proc Natl Acad Sci
USA. 111:E1274–E1283. 2014. View Article : Google Scholar : PubMed/NCBI
|
|
37
|
Faryna M, Konermann C, Aulmann S, Bermejo
JL, Brugger M, Diederichs S, Rom J, Weichenhan D, Claus R, Rehli M,
et al: Genome-wide methylation screen in low-grade breast cancer
identifies novel epigenetically altered genes as potential
biomarkers for tumor diagnosis. FASEB J. 26:4937–4950. 2012.
View Article : Google Scholar : PubMed/NCBI
|