Introduction
Liver cancer, of which 75–85% of cases consist of
hepatocellular carcinoma (HCC), was the sixth most commonly
diagnosed cancer and the fourth leading cause of cancer-associated
death worldwide in 2018 (1). HCC is
one of the few types of cancer which has had a continued increase
in incidence over the last decade (2). The risk factors for HCC include chronic
infection with hepatitis C or hepatitis B virus, high alcohol
intake, aflatoxin B1, obesity, smoking and type 2 diabetes
(3–5). Hepatocarcinogenesis is considered to be
a multistep process evolving from normal to chronic
hepatitis/cirrhosis and dysplastic nodules to HCC (6,7).
Curative treatment options are limited to surgical resection of the
tumor or liver transplantation; however, >70% of patients with
HCC will encounter recurrence within 5 years after surgery
(8–10). The specific mechanisms underlying the
progression from healthy liver to chronic hepatitis/cirrhosis and
dysplastic nodules to HCC are still elusive. The investigation of
these mechanisms may help identify potential therapeutic targets to
prevent the development and recurrence of HCC and biomarkers of
these processes may help clinicians monitor this disease
progression.
Previously, with the development of high-throughput
and microarray technology, gene expression profiles have been used
to identify genes associated with the progression of HCC (11–13).
However, the majority of these studies focused on the screening of
differentially expressed genes without considering the correlations
between genes, despite the fact that genes with similar expression
patterns may be functionally related (14). Weighted gene co-expression network
analysis (WGCNA) can be used to analyze the associations between
gene sets and indicators of tumor progression, including tumor
stages and grades (15,16). In the present study, the various
stages of progression from healthy liver to chronic
hepatitis/cirrhosis and dysplastic nodules to HCC were treated as
phenotypes. It was hypothesized that the expression patterns of
certain genes would be closely associated with these
phenotypes.
According to the theory of the multistep process of
hepatocarcinogenesis (6,7) and WGCNA, the present study aimed to
identify network-centric genes associated with HCC progression by
constructing a co-expression network using gene expression profiles
from normal to chronic hepatitis/cirrhosis and dysplastic nodules
to HCC. Hyaluronan mediated motility receptor (HMMR) was identified
to exhibit a strong correlation with the progression of HCC and may
represent a promising marker for the prevention and treatment of
HCC.
Materials and methods
Data collection
The microarray dataset (GSE89377) of HCC was
retrieved from the Gene Expression Omnibus (GEO) database
(ncbi.nlm.nih.gov/geo/) using the R (http://www.R-project.org/) package GEOquery (17) in RStudio (http://www.rstudio.com/). The GSE89377 dataset was
collected using Illumina HumanHT-12 version 3.0 expression beadchip
(Illumina, Inc.) and was used to construct co-expression networks
and identify hub genes in the present study. There were 13 healthy
liver tissue samples and 94 tissues covering 9 stages of HCC
progression in the GSE89377 dataset, including low grade chronic
hepatitis (n=8), high grade chronic hepatitis (n=12), cirrhosis
(n=12), low grade dysplastic nodules (n=11), high grade dysplastic
nodules (n=11), early HCC (n=5), HCC with grade 1 (n=9), HCC with
grade 2 (n=12) and HCC with grade 3 (n=14). The gene expression
profiles had been normalized using quantile normalization with
GenPlex version 3.0 by Jung Woo Eun from The Catholic University of
Korea. An independent dataset including RNA-sequencing data and
clinical information was obtained from The Cancer Genome Atlas
(TCGA) database (cancer.gov/tcga) to further verify the association
of hub genes and clinical phenotypes. The gene expression profiles
of GSE87630 (18) based on the
GPL6947 dataset included 64 HCC and 30 non-tumor profiles used to
validate the aberrant expression of the hub genes. The gene
expression profiles of GSE87630 were processed using the lumi
package (19) in R. As these data
are publicly available and open-access, ethical approval was not
necessary for the present study.
Weighted gene co-expression network
construction
Probes were filtered by variance as recommended
(15), and the 4,881 probes with the
highest variance were selected from 48,803 probes. The ‘WGCNA’
package (15) was used to construct
a co-expression network for the 4,881 probes according to the
protocols of WGCNA and R software. First, Pearson's correlation
matrices were performed for all pair-wise genes. Subsequently, an
adjacency matrix was constructed using a power adjacency function
[αmn=Power
(Smnβ)=|Smn|β; αmn,
adjacency between two genes; Smn, Pearson's correlations
between two genes]. β is a soft-thresholding parameter that
emphasizes strong correlations between genes and penalizes weak
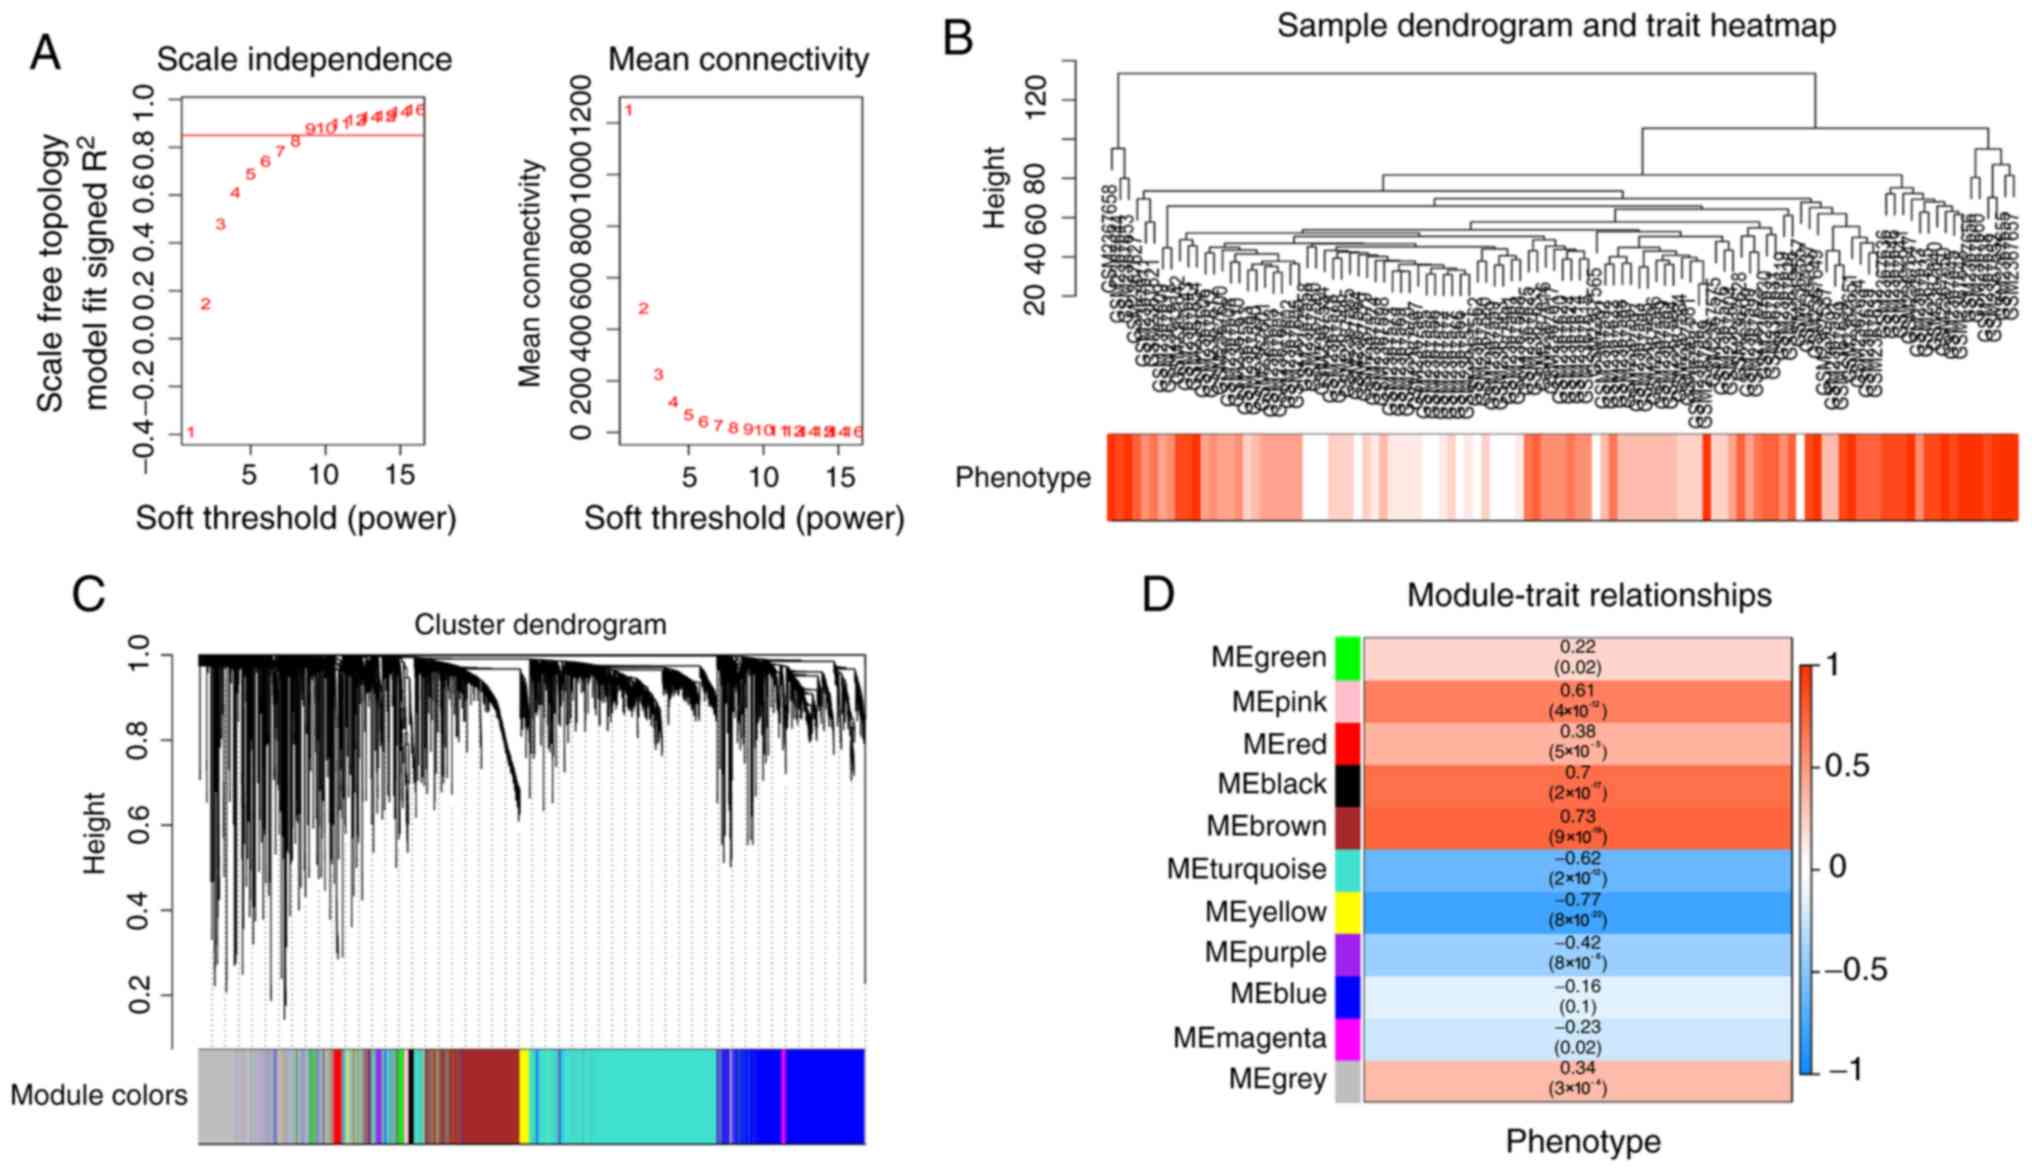
correlations. In the present study, the power of β=9 (scale-free
R2=0.85) was chosen in accordance with the scale-free
topology criterion (Fig. 1A). Next,
the adjacency was transformed into a topological overlap matrix
that measured the network connectivity of a gene, defined as the
sum of its adjacency with all other genes for network generation
(20). Finally, the
‘cutreeStaticColor’ function was applied to classify similar
expression genes into gene modules (minModuleSize=30;
mergeCutHeight=0.25).
Identification of clinically
significant modules and functional enrichment analysis
Gene significance (GS) was defined as the
log10 transformation of the P-value in the linear
regression between gene expression and HCC progress. Module
significance (MS) was the mean GS for all the genes in a module. In
general, the module with the absolute MS ranked first or second
(ranked by MS) amongst all modules was considered as the module
correlating with HCC progression. In the present study, the module
exhibiting the strongest positive correlation with HCC progression
was selected for further analysis and termed the primary module.
Module eigengenes (MEs) were considered as the major components in
the principal component analysis for each gene module and the
expression patterns of all genes could be summarized into a single
characteristic expression profile within a given module. The
correlation between MEs and clinical traits was calculated to
identify the relevant module. As there is more potential of
oncogene as a marker or therapeutic target (21), the focus was on modules that are
positively associated with HCC progression. In addition, functional
Gene Ontology (GO) enrichment analysis and Kyoto Encyclopedia of
Genes and Genomes (KEGG) pathway analysis were performed using the
‘clusterProfiler’ R package (22) in
order to uncover the biologic function of genes in the primary
module. P-value [adjusted by false discovery rate (FDR)]<0.01
was set as the cutoff criteria.
Identification of hub genes
In the present study, hub genes in the primary
module were defined by module connectivity, measured by the
absolute value of the Pearson's correlation
(cor.geneModuleMembership ≥0.8) and clinical trait relationship,
measured by absolute value of the Pearson's correlation
(cor.geneTraitSignificance ≥0.7) (23). Furthermore, a protein-protein
interaction (PPI) network was constructed by uploading all genes in
the primary module to the Search Tool for the Retrieval of
Interacting Genes (STRING) database (24). Overall, 50 genes with the highest
connectivity degree were defined as hub genes in the PPI network.
The connectivity degree for each gene in the PPI network was
calculated using the ‘cytoHubba’ (25) plugin in Cytoscape version 3.6.1
software (26). The hub genes common
to both co-expression network and PPI networks were selected as
‘real’ hub genes and included for further analyses.
Hub gene validation and survival
analysis
The Human Protein Atlas (27) was used to validate the expression of
the hub genes at the protein level. The Human Protein Atlas is a
publicly available database, all data and images are available for
free download and non-commercial use. For validation of the
correlation of hub genes and HCC progression, 371 HCC samples from
TCGA database were analyzed to calculate the Pearson's correlation
coefficient between hub gene expression and certain
clinicopathological features. To evaluate the impact of the hub
genes on the prognosis of patients with HCC, overall and
disease-free survival rate were analyzed using Gene Expression
Profiling Interactive Analysis tools (GEPIA) (28). The predictive value for prognosis
between hub genes and routine clinicopathological factors were
compared using univariate and multivariate Cox regression analyses
in an HCC dataset from TCGA (TCGA-LIHC). These clinicopathological
factors comprised alpha feto protein (AFP) (29), vascular invasion (30), Ishak score (32), and tumor pathological staging
(33). P<0.05 were set as the
cut-off criteria for significance.
Gene set enrichment analysis
(GSEA)
371 HCC samples from RNA-sequencing data (displayed
as read counts) were divided into two groups (high vs. low)
according to the expression level of the candidate gene and the
median expression value was selected as the cut-off point. The
RNA-sequencing data was normalized using the limma package
(34) in R. To determine the
potential function of candidate gene, GSEA (35) was performed between the 2 groups.
Hallmark gene sets summarize and represent specific well-defined
biological states or processes and display coherent expression.
These gene sets were generated by a computational methodology based
on identifying overlaps between gene sets in other MSigDB
collections (36) and retaining
genes that display coordinate expression. Thus, the Hallmark gene
sets (37) were selected as the
reference gene sets. FDR <0.05 was set as the cut-off
criteria.
Statistical analysis
The expression levels of the hub genes were analyzed
using unpaired Student's t-tests in the comparison of two groups.
ANOVA and Dunnett's post-hoc test were used for multiple
comparisons using the multcomp package
(CRAN.R-project.org/package=multcomp) in R. Univariate/multivariate
Cox proportional hazards analyses and Kaplan-Meier survival
analysis with log-rank method were used to compare survival between
the two groups of patients. P<0.05 was considered to indicate a
statistically significant difference.
Results
Weighted co-expression network
construction and primary module identification
Overall, 13 healthy liver samples and 94 samples
from different stages (low grade chronic hepatitis, high grade
chronic hepatitis, cirrhosis, low grade dysplastic nodules, high
grade dysplastic nodules, early HCC, HCC with grade 1, HCC with
grade 2 and HCC with grade 3) of HCC progression were included in
co-expression analysis (Fig. 1B). In
the present study, the power of β=9 (scale free R2=0.85)
was selected as the soft-threshold to ensure a scale-free network
(Fig. 1A) and 11 modules were
identified (Fig. 1C). The highest
association between module and phenotype was revealed to be between
the yellow module and clinical phenotype (r=−0.77;
P=8×10⁻²²; Fig. 1D);
however, the brown module and clinical phenotype exhibited the
highest positive correlation (r=0.73; P=9×10⁻¹⁹;
Fig. 1D). This indicated that the
brown module genes may be oncogenes and the yellow module genes may
be tumor suppressor genes. As there is more potential of oncogene
as a marker or therapeutic target (21), the brown module was selected and
included in subsequent analyses.
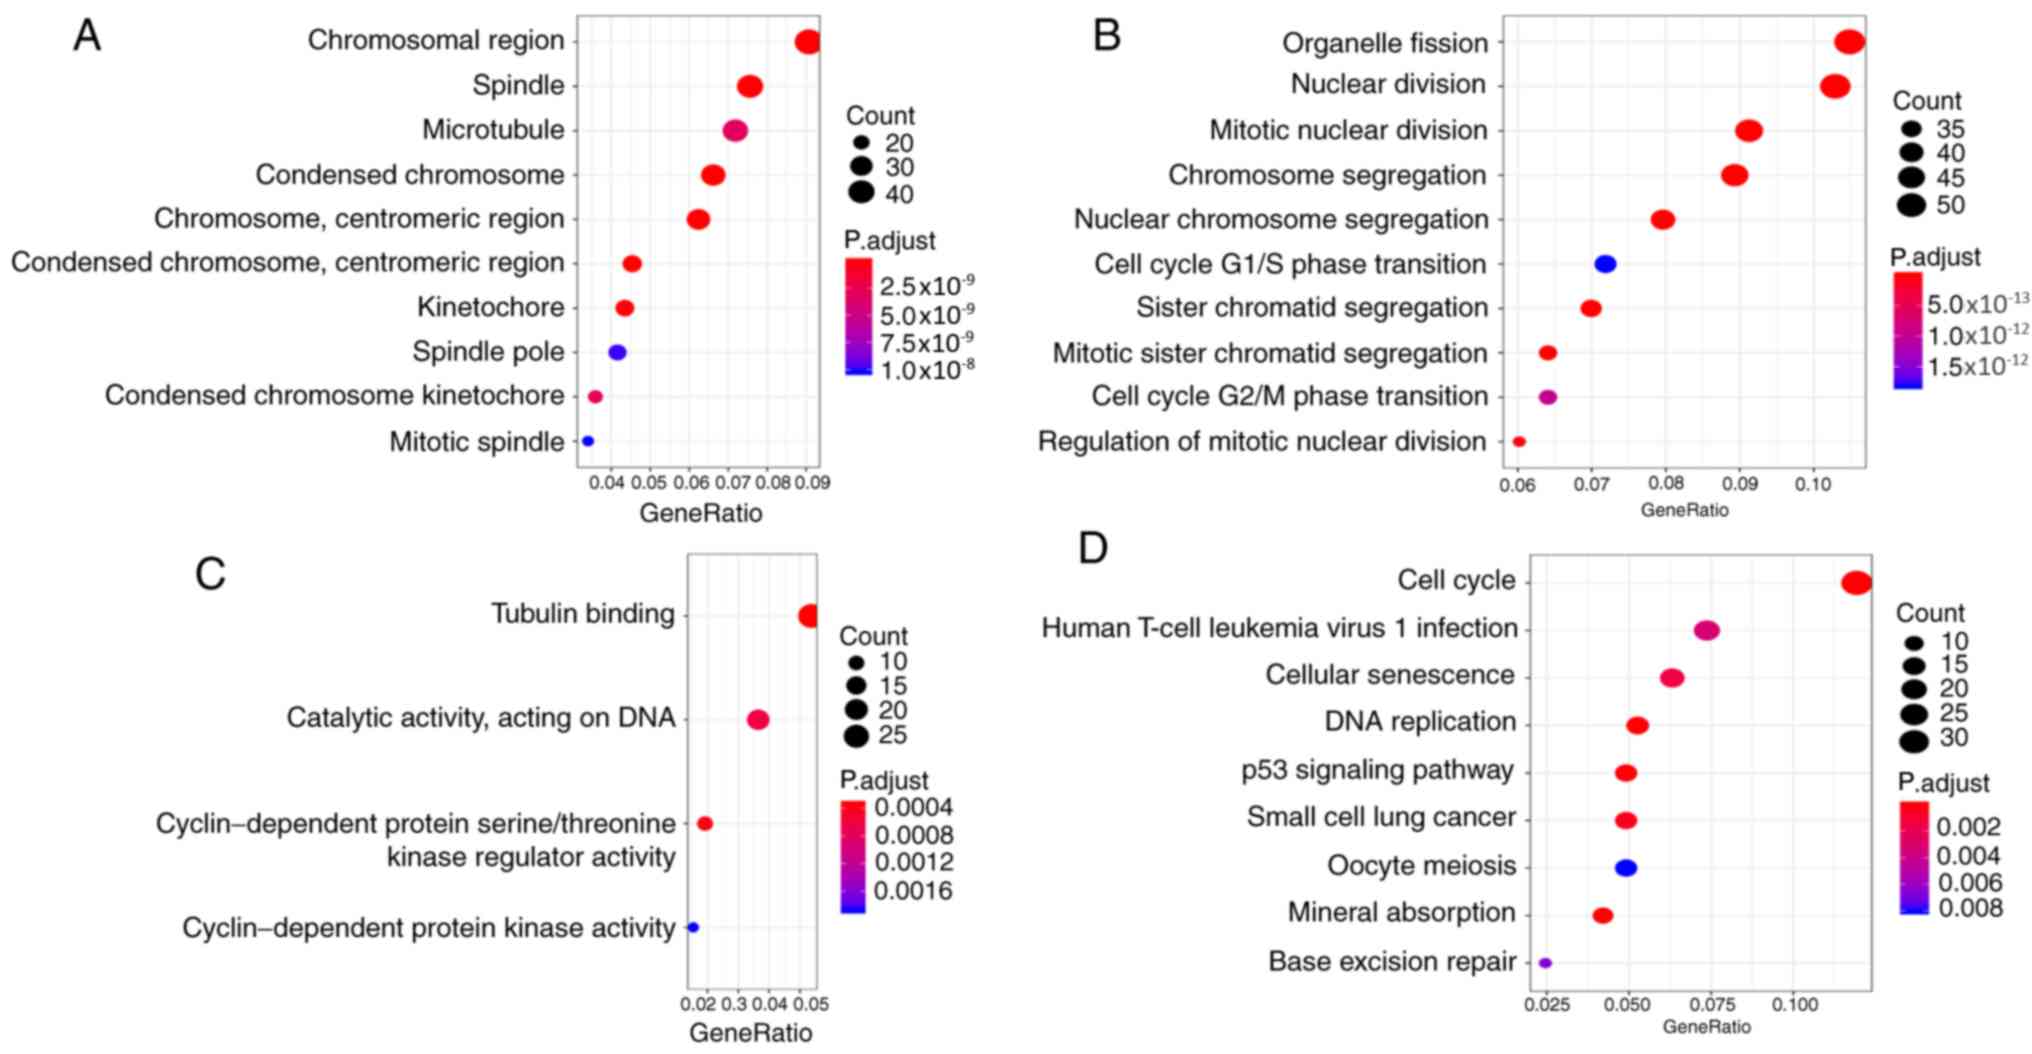
To explore the biological relevance of the brown
module, GO and KEGG enrichment analyses were performed for 671
genes using the ‘clusterProfiler’ package. GO enrichment analyses
contained three parts: Cellular component (CC; Fig. 2A); biological process (BP; Fig. 2B); and molecular function (MF;
Fig. 2C). The brown module genes
were involved in mitotic-related CCs and BPs, such as
‘microtubule’, ‘nuclear division’ and ‘cell cycle G2/M phase
transition’. While the brown module genes were involved in
kinase-related MFs, such as ‘cyclin-dependent protein kinase
activity’. The results of enrichment analyses indicated that the
brown module genes were involved in various cancer-associated
pathways (Fig. 2D), such as ‘cell
cycle’ and ‘p53 signaling pathway’. The brown module genes
associated with HCC are also involved in some viral
infection-related pathways, such as human T-cell leukemia virus 1
infection.
Identification of hub genes
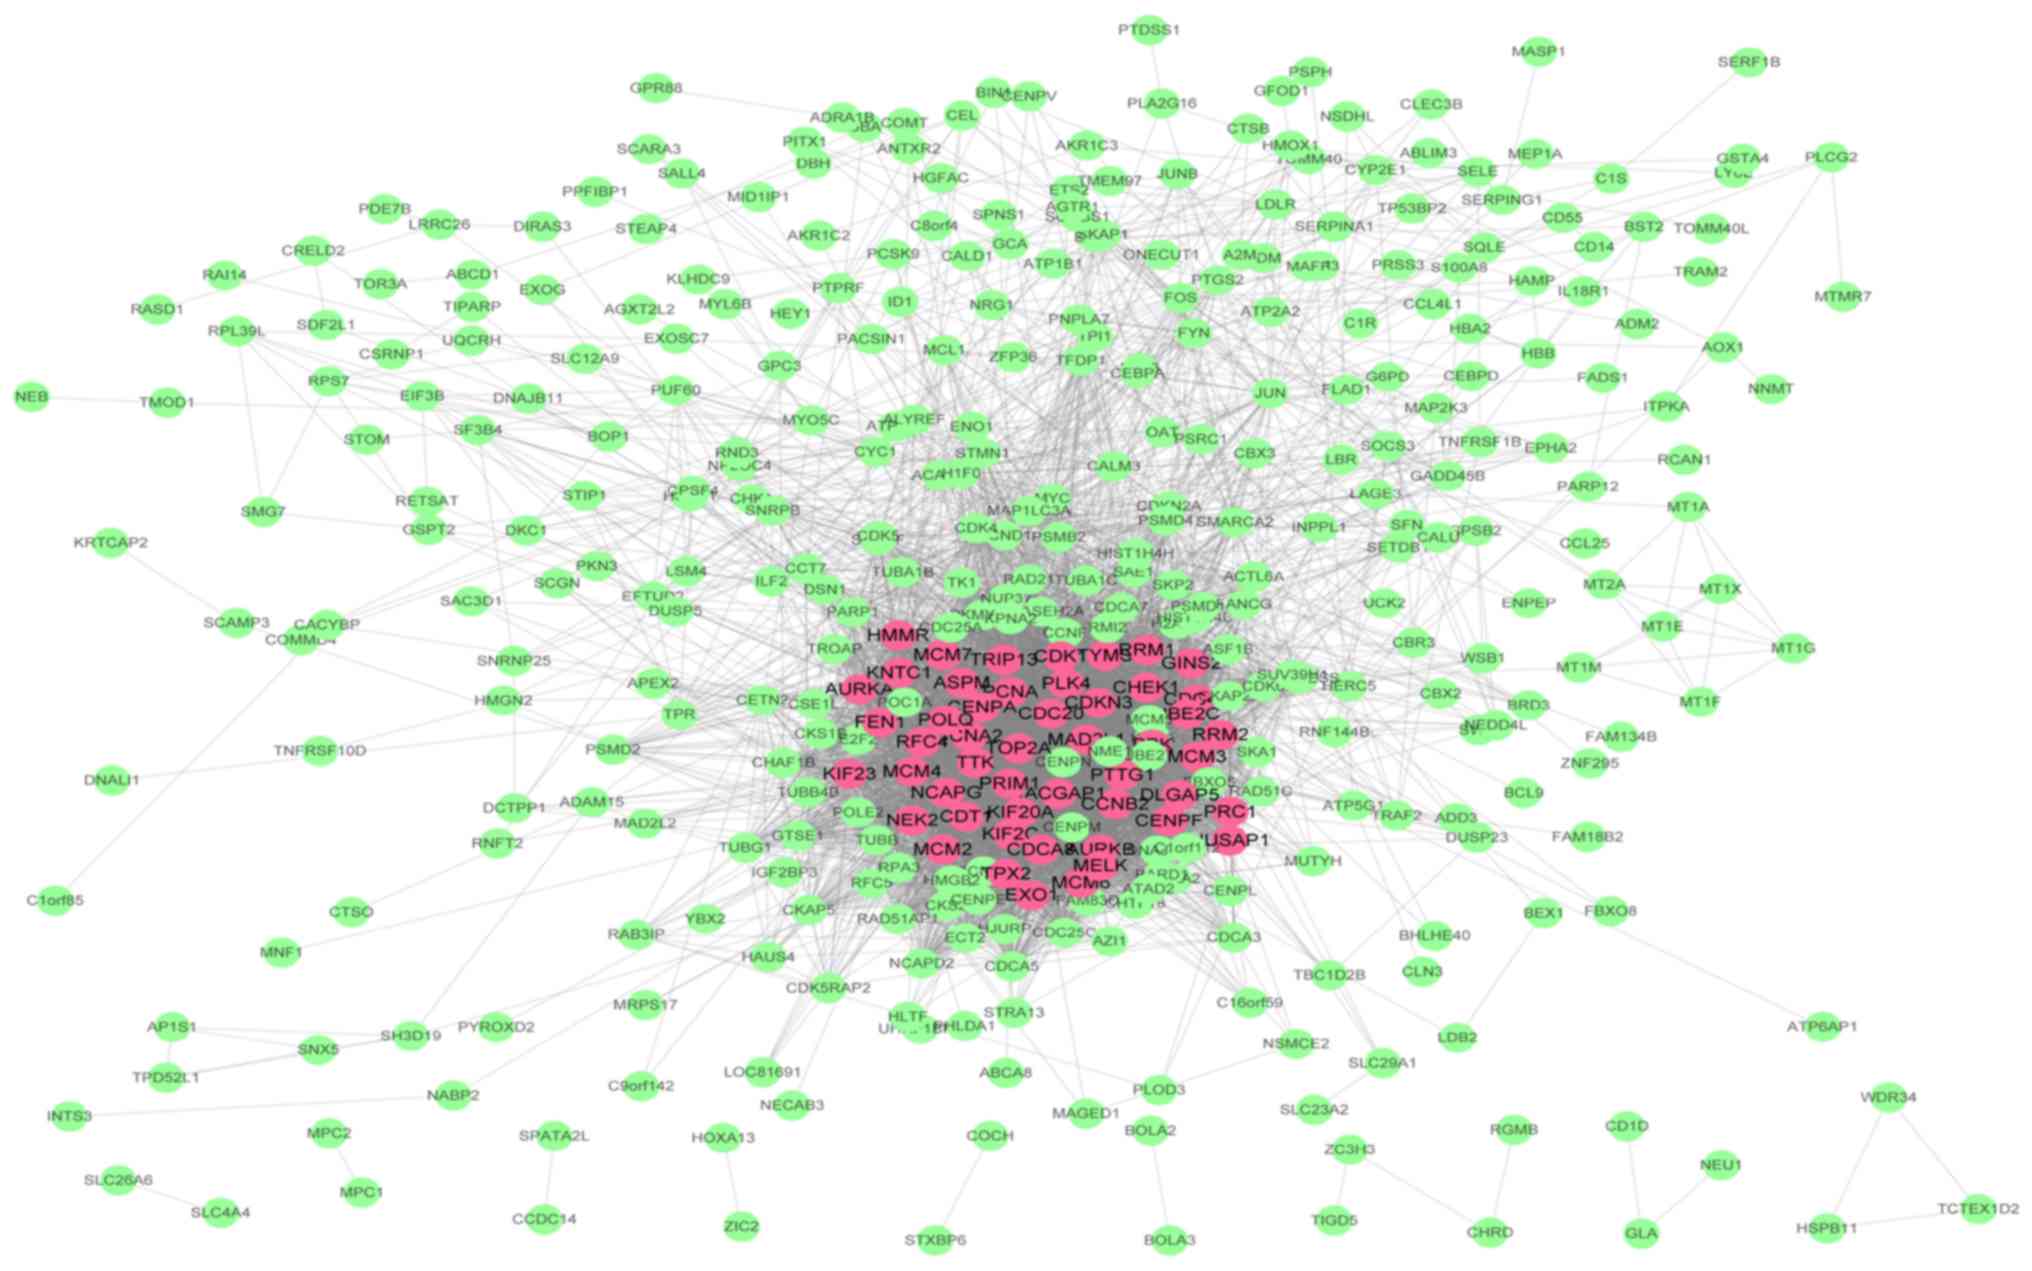
In the present study, 20 genes with high
connectivity (cor.geneModuleMembership; ≥0.8) and high clinical
trait relationship (cor.geneTraitSignificance; ≥0.7) in the brown
module were selected as hub genes in WGCNA. A PPI network (Table SI; Fig.
3) was constructed using Cytoscape according to the STRING
database and 50 genes with the highest connectivity degree were
defined as hub genes in the PPI network. Then, a total of 10 genes
(TOP2A, CDC20, CCNB2, PRC1, UBE2C, PTTG1, KIF20A, HMMR, NUSAP1 and
RACGAP1) common to both the co-expression network and the PPI
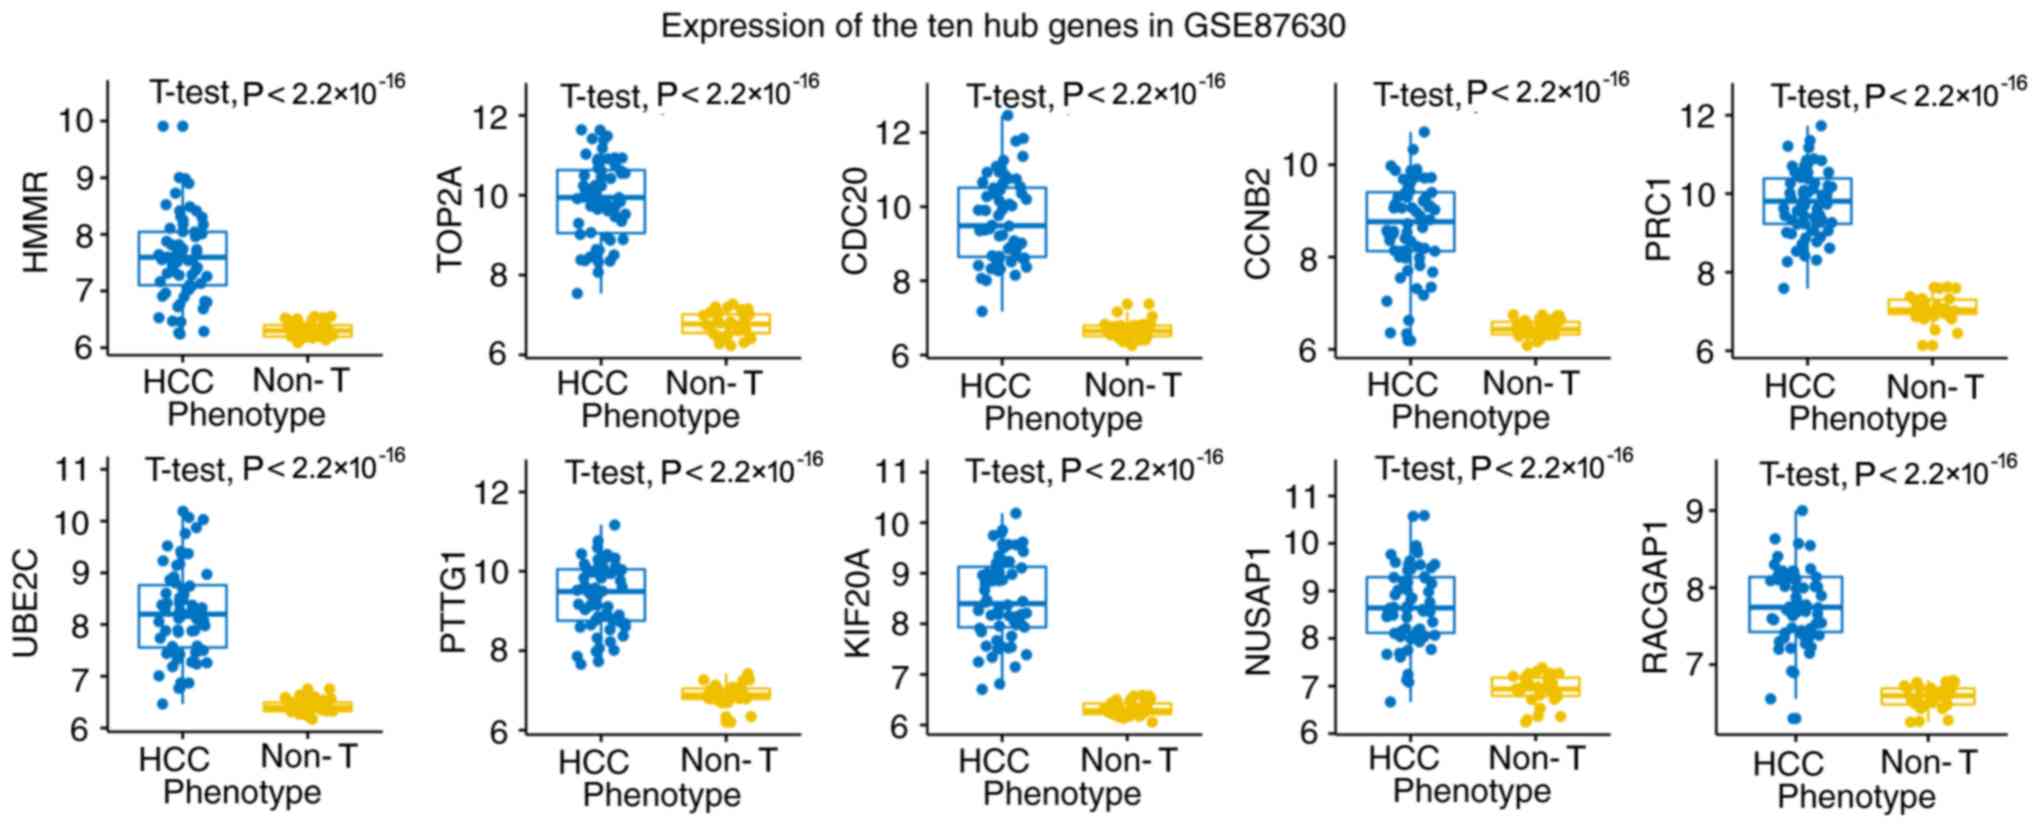
network were selected as ‘real’ hub genes (Table I). The aberrant expression data of
the 10 hub genes were validated in an independent data set
(Fig. 4). HMMR was selected as the
candidate gene for further analysis due to the few existing reports
about its role in HCC.
 | Table I.Common hub genes in the brown module
from weighted gene co-expression network analysis in GSE89377 and
PPI network. |
Table I.
Common hub genes in the brown module
from weighted gene co-expression network analysis in GSE89377 and
PPI network.
|
|
| Weighted gene
co-expression network analysis | PPI network |
|---|
|
|
|
|
|
|---|
| Probe | Gene |
cor.geneModuleMembership |
cor.geneTraitSignificance | Connectivity
degree |
|---|
| ILMN_1686097 | TOP2A | 0.956 | 0.748 | 142 |
| ILMN_1663390 | CDC20 | 0.961 | 0.724 | 121 |
| ILMN_1801939 | CCNB2 | 0.962 | 0.712 | 111 |
| ILMN_1728934 | PRC1 | 0.962 | 0.725 | 102 |
| ILMN_1714730 | UBE2C | 0.954 | 0.710 | 97 |
| ILMN_1753196 | PTTG1 | 0.946 | 0.706 | 92 |
| ILMN_1695658 | KIF20A | 0.938 | 0.715 | 92 |
| ILMN_1781942 | HMMR | 0.916 | 0.706 | 97 |
| ILMN_1726720 | NUSAP1 | 0.933 | 0.709 | 86 |
| ILMN_2077550 | RACGAP1 | 0.959 | 0.717 | 83 |
Hub gene validation and survival
analysis
The expression of HMMR at the mRNA and protein
levels were both significantly higher in HCC tissue compared with
healthy liver tissue (Fig. 5A-C). In
the GSE89377 dataset, HMMR exhibited diagnostic efficiency for HCC
with an area under curve (AUC)=0.949, sensitivity=0.875 and
specificity=0.910 (Fig. 5D). Based
the results of WGCNA, the expression of HMMR was positively
correlated with the progression of HCC (cor.geneTraitSignificance
r=0.706; P=2.00×10⁻¹⁷). This correlation was validated
in the HCC dataset from TCGA (r=0.290; P=3.57×10⁻⁶;
Fig. 5E). The expression of HMMR was
positively correlated with HCC pathological stage (r=0.062;
P=0.008), tumor (T) stage (r=0.069; P=4.19×10⁻⁴) and
Ishak score (Pearson correlation coefficient=0.178; P=0.004;
Fig. 5E). Using GEPIA tools, it was
revealed that patients with higher expression levels of HMMR
exhibited significantly shorter overall survival (Fig. 5F, left) and disease-free survival
rate (Fig. 5F, right). Furthermore,
the expression of HMMR is an independent prognostic factor compared
with routine clinicopathological features, not only in overall
survival but also disease-free survival rate, in the HCC dataset
from TCGA (Tables II and III) (multivariate Cox regression analysis
P<0.05).
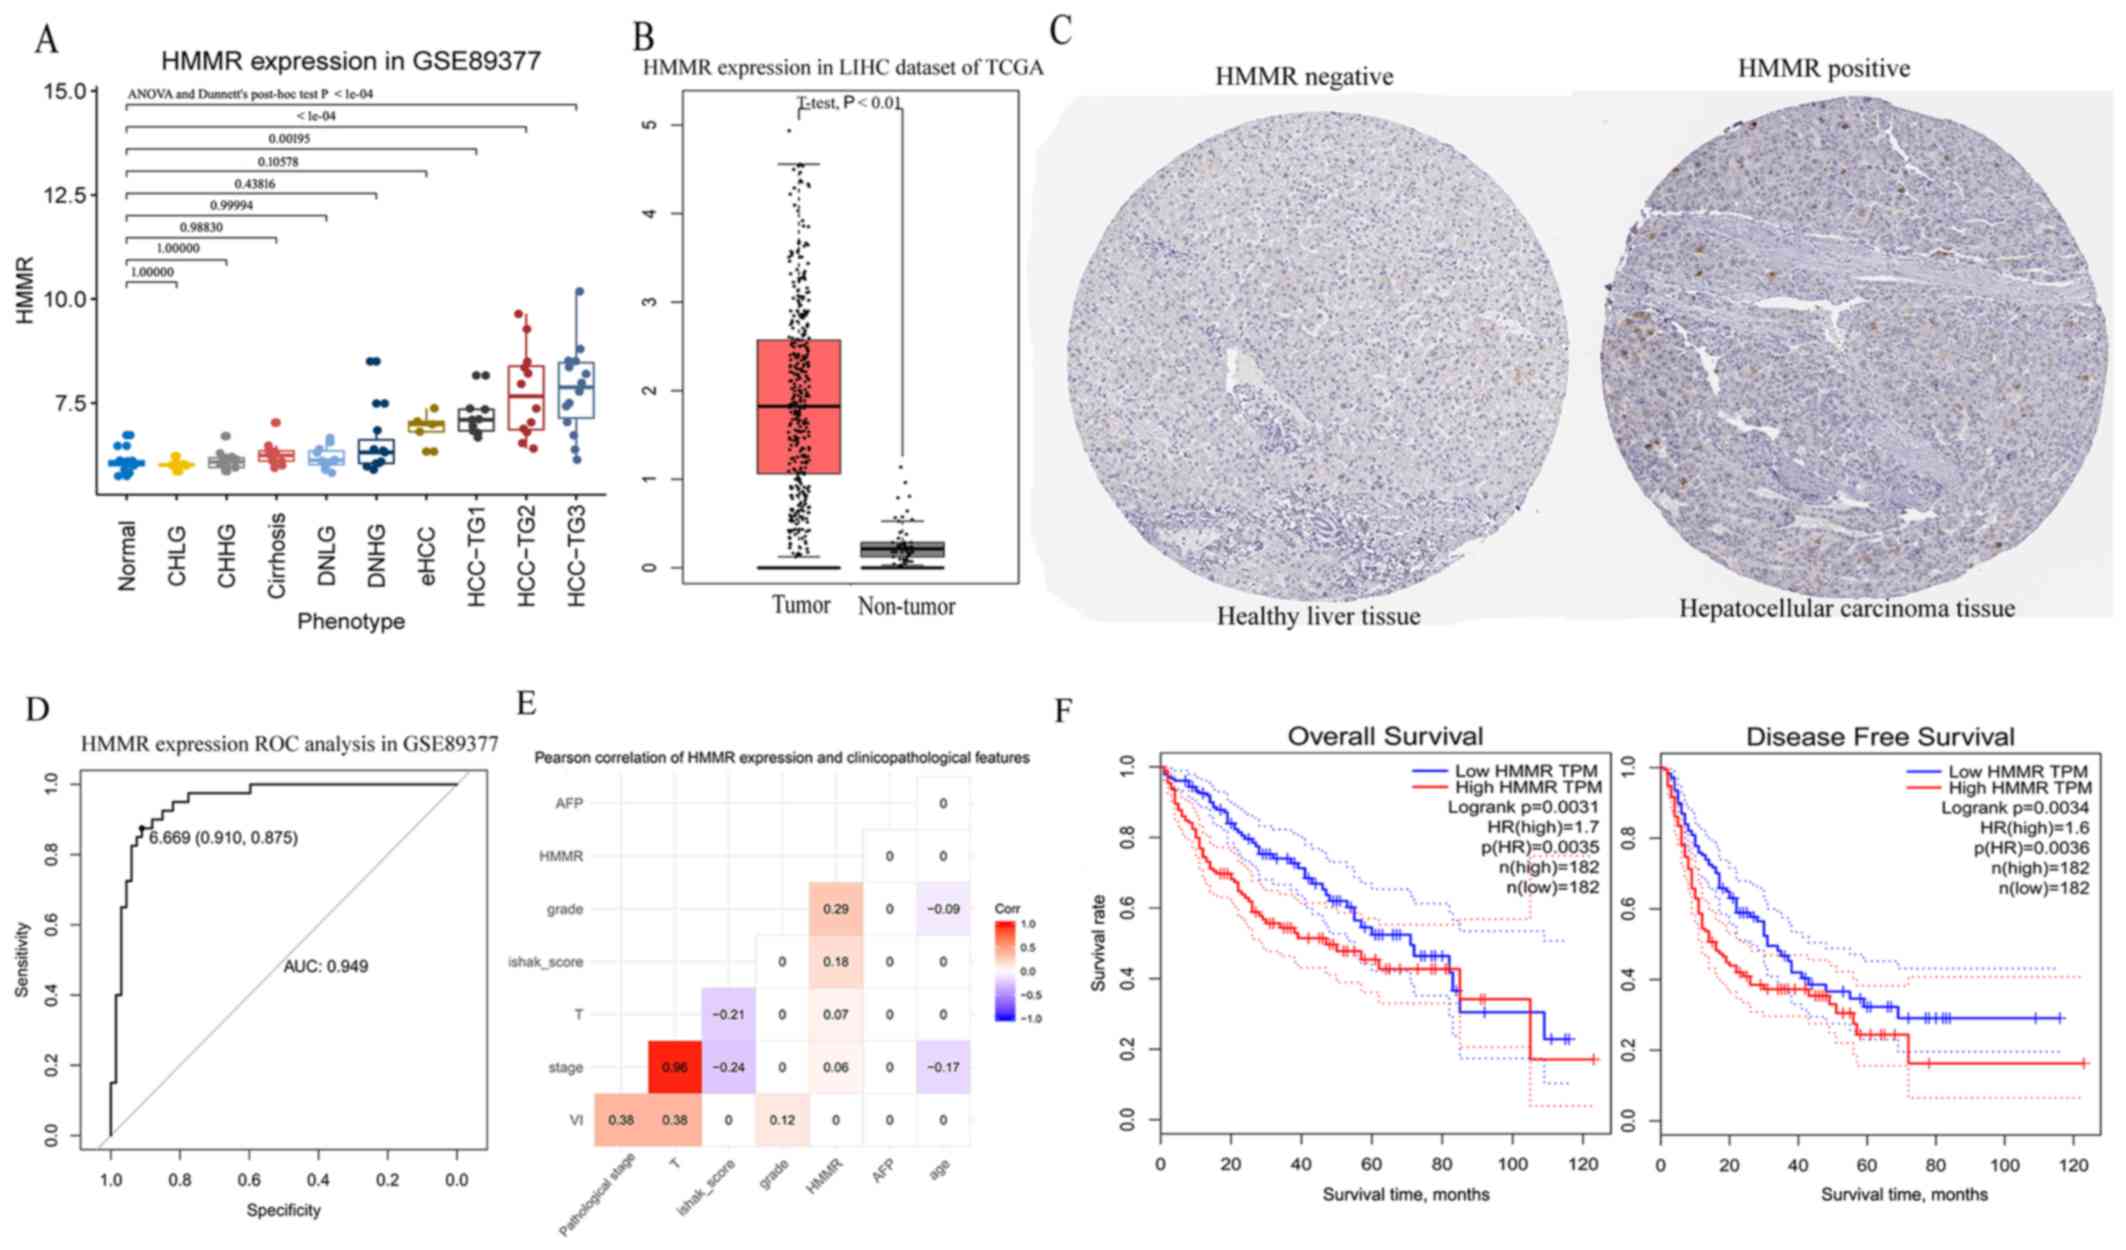 | Figure 5.Validation of aberrant expression of
HMMR at transcription and protein levels and the prognostic value
of HMMR in HCC. (A) Expression of HMMR at different pathological
stages from normal to chronic hepatitis/cirrhosis and dysplastic
nodules to HCC in the GSE89377 dataset. (B) Expression of HMMR
between tumor tissues and non-tumor tissues in hepatocellular
carcinoma dataset from TCGA. (C) HMMR protein was upregulated in
hepatocellular carcinoma
(images.proteinatlas.org/2433/6865_B_8_6.jpg) compared with healthy
liver tissue (images.proteinatlas.org/2433/6892_A_8_4.jpg)
(antibody CAB002433) using data from the Human Protein Atlas
database. The healthy liver tissue was from a female (patient ID:
1846) and the hepatocellular carcinoma tissue was from a male
(patient ID: 2325). (D) ROC curves of the expression of HMMR for
hepatocellular carcinoma diagnosis in the GSE89377 dataset. (E)
Pearson correlation between HMMR expression and routine
clinicopathological features. This shows the correlation
coefficient when P<0.01. (F) Kaplan-Meier curves obtained using
the median value of HMMR expression to separate patients into high-
and low-expression groups in Gene Expression Profiling Interactive
Analysis. HCC, hepatocellular carcinoma; HMRR, Hyaluronan mediated
motility receptor; LIHC, liver hepatocellular carcinoma; TCGA, The
Cancer Genome Atlas; ROC, receiver operating characteristic; HR,
hazard ratio; T, tumor; CHLG, chronic hepatitis with low grade;
CHHG, chronic hepatitis with high grade; DNLG, dysplastic nodules
with low grade; DNHG, dysplastic nodules with high grade; eHCC,
early hepatocellular carcinoma; HCC-TG1, hepatocellular carcinoma
with grade 1; HCC-TG2, hepatocellular carcinoma with grade 2;
HCC-TG3, hepatocellular carcinoma with grade 3. |
| Table II.Univariate and multivariate COX
regression analyses for overall survival in hepatocellular
carcinoma dataset of The Cancer Genome Atlas. |
Table II.
Univariate and multivariate COX
regression analyses for overall survival in hepatocellular
carcinoma dataset of The Cancer Genome Atlas.
|
| Univariate
analysis | Multivariate
analysis |
|---|
|
|
|
|
|---|
| Factors | P-value | HR | HR, 95% CI | P-value | HR | HR, 95% CI |
|---|
| Sex (male vs.
female) | 0.262 | 1.225 | 0.859–1.745 | – | – | – |
| Age, years (>65
vs. ≤65) | 0.186 | 1.265 | 0.893–1.791 | – | – | – |
| AFP, ng/ml (>20
vs. ≤20) (29) | 0.026a | 1.641 | 1.061–2.540 | 0.563 | 1.150 | 0.716–1.846 |
| Vascular invasion
(positive vs. negative) (30) | 0.155 | 1.351 | 0.892–2.047 | – | – | – |
| Child-pugh score
(B/C vs. A) (31) | 0.184 | 1.614 | 0.796–3.270 | – | – | – |
| Ishak score (5–6
vs. 0–4) (32) | 0.497 | 0.829 | 0.483–1.424 | – | – | – |
| Tumor Grade (G3/4
vs. G1/2) | 0.542 | 1.119 | 0.780–1.604 | – | – | – |
| Pathological T
stage (T3/4 vs. T1/2) (33) |
<0.001a | 2.537 | 1.783–3.609 | 0.889 | 1.153 | 0.155–8.607 |
| Pathological stage
(III/IV vs. I/II) (33) |
<0.001a | 2.446 | 1.687–3.545 | 0.634 | 1.620 | 0.222–11.808 |
| HMMR expression
level (high vs. low) |
<0.001a | 2.136 | 1.498–3.044 | 0.007a | 1.917 | 1.192–3.085 |
| Table III.Univariate and multivariate Cox
regression analyses for disease-free survival in HCC dataset of
TCGA. |
Table III.
Univariate and multivariate Cox
regression analyses for disease-free survival in HCC dataset of
TCGA.
|
| Univariate
analysis | Multivariate
analysis |
|---|
|
|
|
|
|---|
| Clinicopathological
factors | P-value | HR | HR (95% CI) | P-value | HR | HR (95% CI) |
|---|
| Sex (male vs.
female) | 0.919 | 1.019 | 0.714–1.454 |
|
|
|
| Age, years (>65
vs. ≤65) | 0.081 | 1.043 | 0.739–1.472 |
|
|
|
| AFP, ng/ml (>20
vs. ≤20) (29) | 0.496 | 1.149 | 0.771–1.712 |
|
|
|
| Vascular invasion
(positive vs. negative) (30) | 0.029a | 1.540 | 1.045–2.268 | 0.397 | 1.198 | 0.788–1.821 |
| Child-pugh score
(B/C vs. A) (31) | 0.246 | 1.542 | 0.742–3.204 |
|
|
|
| Ishak score (5–6
vs. 0–4) (32) | 0.623 | 1.116 | 0.721–1.727 |
|
|
|
| Tumor Grade (G3/4
vs. G1/2) | 0.829 | 1.039 | 0.733–1.474 |
|
|
|
| Pathological T
stage (T3/4 vs. T1/2) (33) |
<0.001b | 2.940 | 2.071–4.173 | 0.518 | 0.512 | 0.067–3.902 |
| Pathological stage
(III/IV vs. I/II) (34) |
<0.001b | 2.885 | 2.009–4.142 | 0.126 | 4.769 | 0.644–35.330 |
| HMMR expression
level (high vs. low) | 0.002b | 1.697 | 1.213–2.373 | 0.038a | 1.527 | 1.024–2.277 |
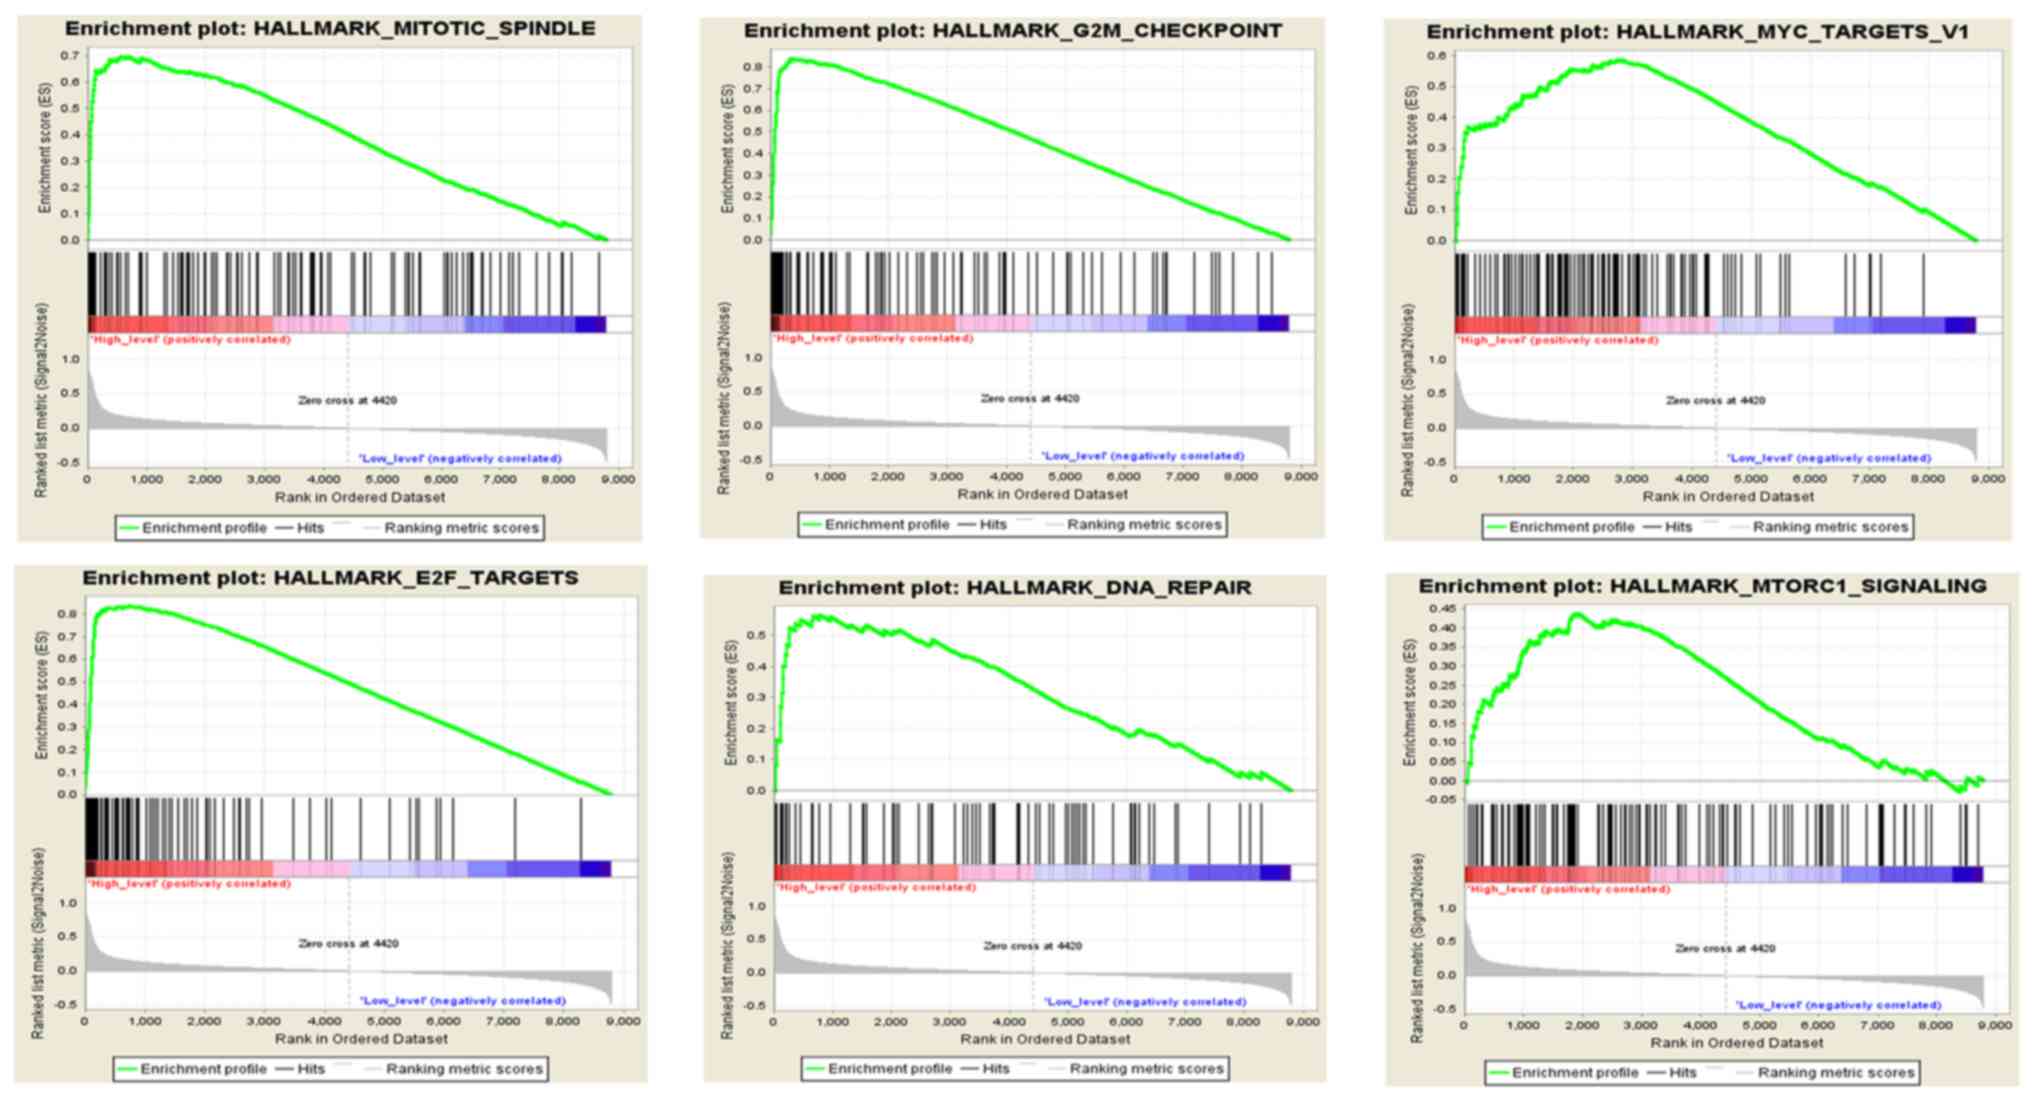
GSEA
To analyze the function of HMMR in HCC, GSEA was
conducted to compare HMMR with hallmark gene sets. 371 HCC samples
were divided into two groups (high vs. low) according to the HMMR
median expression level (2.62). Under the cut-off criteria of FDR
<0.05, a total of 8 functional gene sets were enriched. Overall,
6 representative gene sets were significantly associated with
cancer, including ‘mitotic spindle’, ‘G2/M checkpoint’,
‘MYC targets v1’, ‘E2F targets’, ‘DNA repair’ and ‘mTORC1
signaling’ (Fig. 6).
Discussion
In previous years, the concept of multi-step human
hepatocarcinogenesis has been well documented (6,7,38). Chronic liver inflammation can result
in repeated cell injury, death and regeneration cycles, resulting
in subsequent epigenetic and genetic alterations of hepatocytes
(39). Phenotypically abnormal
precursor hepatic lesions, including cirrhotic nodules, low-grade
dysplastic nodules and high-grade dysplastic nodules
dedifferentiate and gradually evolve to HCC (40). This process exists on a biologic
continuum and may occur simultaneously at various rates throughout
the liver; however, the specific molecular mechanisms underlying
this process are yet to be elucidated. In the present study,
several modules associated with this process were identified using
WGCNA. In particular, genes in the brown module exhibited a strong
positive correlation with this process, indicating that gene
expression in the module gradually increase as the process
progresses. Functional enrichment analysis revealed that genes in
the brown module significantly influenced cell cycle-associated
biological processes, for example ‘cell cycle G2/M phase
transition’, ‘cell cycle G1/S phase transition’ and
‘mitotic nuclear division’, and cancer-related pathways, including
‘p53 signaling pathway’ and ‘cell cycle’.
Markers which accurately reflect the process from
normal to chronic hepatitis/cirrhosis and dysplastic nodules to HCC
are lacking in clinical practice and novel candidate molecules are
needed. In the present study, according to the theory of the
multistep process of hepatocarcinogenesis and WGCNA, a total of 10
hub genes common to the primary module and PPI network were
selected as hub genes, including TOP2A, CDC20, CCNB2, PRC1, UBE2C,
PTTG1, KIF20A, HMMR, NUSAP1 and RACGAP1. Previous studies had
reported almost all ten genes to be associated with the progression
of HCC (41–49). HMMR was chosen as the candidate gene,
since few studies have identified its role in HCC (50). HMMR (also known as CD168/IHABP/RHAMM)
(51) is highly expressed in various
solid tumors and it is described as a cancer-associated antigen,
which is involved in both tumorigenesis and progression/metastasis
(52–56). HMMR was identified as a breast cancer
susceptibility gene (57) and was
once considered an ideal target antigen for immunotherapy of acute
myeloid leukemia (58); however, the association between HMMR and
HCC has been rarely reported.
In the present study, HMMR was significantly
upregulated in HCC tissue compared with healthy liver tissue at
both the mRNA and protein expression levels. HMMR is a promising
diagnostic biomarker for HCC (AUC=0.949; sensitivity=0.875;
specificity=0.910). In addition, the progression of HCC was
associated with the upregulation of HMMR. Notably, the expression
of HMMR was positively correlated with HCC tumor grade,
pathological stage, T stage and Ishak score. Patients with HCC with
higher expression levels of HMMR exhibited significantly shorter
overall survival and disease-free survival times. Moreover, the
expression of HMMR remained an independent prognostic factor
compared with routine clinicopathological features. The current
results indicated that HMMR may serve as a biomarker of HCC
progression. Thus, patients with HCC and high expression levels of
HMMR have a higher risk for recurrence and should be followed up
more frequently than the routine schedule.
In order to reveal the function of HMMR in HCC, GSEA
was performed. Overall, 6 representative gene sets, including
‘mitotic spindle’, ‘G2/M checkpoint’, ‘MYC targets v1’,
‘E2F targets’, ‘DNA repair’ and ‘mTORC1 signaling’, were
significantly associated with cancer and enriched in samples with
high expression levels of HMMR. This indicates that HMMR may
interact with these genes or pathways to promote the progression of
HCC. The present findings may improve our understanding of the role
of HMMR in HCC and inform future research.
Notably, there were certain limitations to the
present study. Firstly, the expression of HMMR was quantified and
the values may vary on different platforms. The establishment of a
standard is required before being applied to clinical practice.
Secondly, as the present study only performed a bioinformatic
analysis, including GSEA analysis to help identify the function of
HMMR in HCC, it is not clear whether HMMR expression is causal or
merely a biomarker of HCC progression. Whether HMMR can be used as
a therapeutic target for HCC requires further molecular
experimental verification.
In conclusion, the present study revealed that
patients with HCC with high expression of HMMR exhibit a less
favorable prognosis, suggesting that HMMR may serve an important
role in HCC and has potential as a biomarker of HCC diagnosis and
progression.
Supplementary Material
Supporting Data
Acknowledgements
Not applicable.
Funding
This research was supported by the Youth Science
Foundation of Guangxi Medical University, Nanning, China (grant no.
GXMUYSF 201716).
Availability of data and materials
The dataset of GSE89377 and GSE87630 are available
from the Gene Expression Omnibus (https://www.ncbi.nlm.nih.gov/geo). The dataset of
TCGA-LIHC are available from The Cancer Genome Atlas
(cancer.gov/tcga).
Authors' contributions
YL designed the study and reviewed the manuscript.
DL and XB analyzed the data and wrote the manuscript. ZG and QZ
assisted with analyzing the data and writing the manuscript. All
authors read and approved the final manuscript.
Ethics approval and consent to
participate
Not applicable.
Patient consent for publication
Not applicable.
Competing interests
The authors declare that they have no competing
interests.
References
|
1
|
Bray F, Ferlay J, Soerjomataram I, Siegel
RL, Torre LA and Jemal A: Global cancer statistics 2018: GLOBOCAN
estimates of incidence and mortality worldwide for 36 cancers in
185 countries. CA Cancer J Clin. 68:394–424. 2018. View Article : Google Scholar : PubMed/NCBI
|
|
2
|
Forner A, Reig M and Bruix J:
Hepatocellular carcinoma. Lancet. 391:1301–1314. 2018. View Article : Google Scholar : PubMed/NCBI
|
|
3
|
Heidelbaugh JJ and Bruderly M: Cirrhosis
and chronic liver failure: Part I. Diagnosis and evaluation. Am Fam
Physician. 74:756–762. 2006.PubMed/NCBI
|
|
4
|
Alter MJ: Epidemiology of hepatitis C
virus infection. World J Gastroenterol. 13:2436–2441. 2007.
View Article : Google Scholar : PubMed/NCBI
|
|
5
|
El-Serag HB, Hampel H and Javadi F: The
association between diabetes and hepatocellular carcinoma: A
systematic review of epidemiologic evidence. Clin Gastroenterol
Hepatol. 4:369–380. 2006. View Article : Google Scholar : PubMed/NCBI
|
|
6
|
Marquardt JU, Seo D, Andersen JB, Gillen
MC, Kim MS, Conner EA, Galle PR, Factor VM, Park YN and
Thorgeirsson SS: Sequential transcriptome analysis of human liver
cancer indicates late stage acquisition of malignant traits. J
Hepatol. 60:346–353. 2014. View Article : Google Scholar : PubMed/NCBI
|
|
7
|
Kudo M: Multistep human
hepatocarcinogenesis: Correlation of imaging with pathology. J
Gastroenterol. 44 (Suppl 19):S112–S118. 2009. View Article : Google Scholar
|
|
8
|
Rahbari NN, Mehrabi A, Mollberg NM, Müller
SA, Koch M, Büchler MW and Weitz J: Hepatocellular carcinoma:
Current management and perspectives for the future. Ann Surg.
253:453–469. 2011. View Article : Google Scholar : PubMed/NCBI
|
|
9
|
Hasegawa K, Kokudo N, Makuuchi M, Izumi N,
Ichida T, Kudo M, Ku Y, Sakamoto M, Nakashima O, Matsui O and
Matsuyama Y: Comparison of resection and ablation for
hepatocellular carcinoma: A cohort study based on a Japanese
nationwide survey. J Hepatol. 58:724–729. 2013. View Article : Google Scholar : PubMed/NCBI
|
|
10
|
Poon RT, Fan ST, Lo CM, Liu CL and Wong J:
Long-term survival and pattern of recurrence after resection of
small hepatocellular carcinoma in patients with preserved liver
function: Implications for a strategy of salvage transplantation.
Ann Surg. 235:373–382. 2002. View Article : Google Scholar : PubMed/NCBI
|
|
11
|
Cheng J, Wei D, Ji Y, Chen L, Yang L, Li
G, Wu L, Hou T, Xie L, Ding G, et al: Integrative analysis of DNA
methylation and gene expression reveals hepatocellular
carcinoma-specific diagnostic biomarkers. Genome Med. 10:422018.
View Article : Google Scholar : PubMed/NCBI
|
|
12
|
Kalinich M, Bhan I, Kwan TT, Miyamoto DT,
Javaid S, LiCausi JA, Milner JD, Hong X, Goyal L, Sil S, et al: An
RNA-based signature enables high specificity detection of
circulating tumor cells in hepatocellular carcinoma. Proc Natl Acad
Sci USA. 114:1123–1128. 2017. View Article : Google Scholar : PubMed/NCBI
|
|
13
|
Sia D, Jiao Y, Martinez-Quetglas I, Kuchuk
O, Villacorta-Martin C, Castro de Moura M, Putra J, Camprecios G,
Bassaganyas L, Akers N, et al: Identification of an immune-specific
class of hepatocellular carcinoma, based on molecular features.
Gastroenterology. 153:812–826. 2017. View Article : Google Scholar : PubMed/NCBI
|
|
14
|
Tavazoie S, Hughes JD, Campbell MJ, Cho RJ
and Church GM: Systematic determination of genetic network
architecture. Nat Genet. 22:281–285. 1999. View Article : Google Scholar : PubMed/NCBI
|
|
15
|
Langfelder P and Horvath S: WGCNA: An R
package for weighted correlation network analysis. BMC
Bioinformatics. 9:5592008. View Article : Google Scholar : PubMed/NCBI
|
|
16
|
Chen L, Yuan L, Qian K, Qian G, Zhu Y, Wu
CL, Dan HC, Xiao Y and Wang X: Identification of biomarkers
associated with pathological stage and prognosis of clear cell
renal cell carcinoma by co-expression network analysis. Front
Physiol. 9:3992018. View Article : Google Scholar : PubMed/NCBI
|
|
17
|
Davis S and Meltzer PS: GEOquery: A bridge
between the gene expression omnibus (GEO) and BioConductor.
Bioinformatics. 23:1846–1847. 2007. View Article : Google Scholar : PubMed/NCBI
|
|
18
|
Woo HG, Choi JH, Yoon S, Jee BA, Cho EJ,
Lee JH, Yu SJ, Yoon JH, Yi NJ, Lee KW, et al: Integrative analysis
of genomic and epigenomic regulation of the transcriptome in liver
cancer. Nat Commun. 8:8392017. View Article : Google Scholar : PubMed/NCBI
|
|
19
|
Du P, Kibbe WA and Lin SM: Lumi: A
pipeline for processing Illumina microarray. Bioinformatics.
24:1547–1548. 2008. View Article : Google Scholar : PubMed/NCBI
|
|
20
|
Yip AM and Horvath S: Gene network
interconnectedness and the generalized topological overlap measure.
BMC Bioinformatics. 8:222007. View Article : Google Scholar : PubMed/NCBI
|
|
21
|
Yu G, Wang LG, Han Y and He QY:
clusterProfiler: An R package for comparing biological themes among
gene clusters. OMICS. 16:284–287. 2012. View Article : Google Scholar : PubMed/NCBI
|
|
22
|
Horvath S and Dong J: Geometric
interpretation of gene coexpression network analysis. PLoS Comput
Biol. 4:e10001172008. View Article : Google Scholar : PubMed/NCBI
|
|
23
|
Szklarczyk D, Gable AL, Lyon D, Junge A,
Wyder S, Huerta-Cepas J, Simonovic M, Doncheva NT, Morris JH, Bork
P, et al: STRING v11: Protein-protein association networks with
increased coverage, supporting functional discovery in genome-wide
experimental datasets. Nucleic Acids Res. 47(D1): D607–D613. 2019.
View Article : Google Scholar : PubMed/NCBI
|
|
24
|
Chin CH, Chen SH, Wu HH, Ho CW, Ko MT and
Lin CY: cytoHubba: Identifying hub objects and sub-networks from
complex interactome. BMC Syst Biol. 8 (Suppl 4):S112014. View Article : Google Scholar : PubMed/NCBI
|
|
25
|
Shannon P, Markiel A, Ozier O, Baliga NS,
Wang JT, Ramage D, Amin N, Schwikowski B and Ideker T: Cytoscape: A
software environment for integrated models of biomolecular
interaction networks. Genome Res. 13:2498–2504. 2003. View Article : Google Scholar : PubMed/NCBI
|
|
26
|
Uhlen M, Fagerberg L, Hallstrom BM,
Lindskog C, Oksvold P, Mardinoglu A, Sivertsson Å, Kampf C,
Sjöstedt E, Asplund A, et al: Proteomics. Tissue-based map of the
human proteome. Science. 347:12604192015. View Article : Google Scholar : PubMed/NCBI
|
|
27
|
Tang Z, Li C, Kang B, Gao G, Li C and
Zhang Z: GEPIA: A web server for cancer and normal gene expression
profiling and interactive analyses. Nucleic Acids Res 45 (W1).
W98–W102. 2017. View Article : Google Scholar
|
|
28
|
Nomura F, Ohnishi K and Tanabe Y: Clinical
features and prognosis of hepatocellular carcinoma with reference
to serum alpha-fetoprotein levels. Analysis of 606 patients.
Cancer. 64:1700–1707. 1989. View Article : Google Scholar : PubMed/NCBI
|
|
29
|
Llovet JM, Schwartz M and Mazzaferro V:
Resection and liver transplantation for hepatocellular carcinoma.
Semin Liver Dis. 25:181–200. 2005. View Article : Google Scholar : PubMed/NCBI
|
|
30
|
Cholongitas E, Papatheodoridis GV, Vangeli
M, Terreni N, Patch D and Burroughs AK: Systematic review: The
model for end-stage liver disease-should it replace Child-Pugh's
classification for assessing prognosis in cirrhosis? Aliment
Pharmacol Ther. 22:1079–1089. 2005. View Article : Google Scholar : PubMed/NCBI
|
|
31
|
Ishak K, Baptista A, Bianchi L, Callea F,
De Groote J, Gudat F, Denk H, Desmet V, Korb G, MacSween RN, et al:
Histological grading and staging of chronic hepatitis. J Hepatol.
22:696–699. 1995. View Article : Google Scholar : PubMed/NCBI
|
|
32
|
Sobin LH, Gospodarowicz MK and Wittekind
C: TNM classification of malignant tumours. 7th edition. John Wiley
& Sons; 2009
|
|
33
|
Ritchie ME, Phipson B, Wu D, Hu Y, Law CW,
Shi W and Smyth GK: Limma powers differential expression analyses
for RNA-sequencing and microarray studies. Nucleic Acids Res.
43:e472015. View Article : Google Scholar : PubMed/NCBI
|
|
34
|
Mootha VK, Lindgren CM, Eriksson KF,
Subramanian A, Sihag S, Lehar J, Puigserver P, Carlsson E,
Ridderstråle M, Laurila E, et al: PGC-1alpha-responsive genes
involved in oxidative phosphorylation are coordinately
downregulated in human diabetes. Nat Genet. 34:267–273. 2003.
View Article : Google Scholar : PubMed/NCBI
|
|
35
|
Subramanian A, Tamayo P, Mootha VK,
Mukherjee S, Ebert BL, Gillette MA, Paulovich A, Pomeroy SL, Golub
TR, Lander ES and Mesirov JP: Gene set enrichment analysis: A
knowledge-based approach for interpreting genome-wide expression
profiles. Proc Natl Acad Sci USA. 102:15545–15550. 2005. View Article : Google Scholar : PubMed/NCBI
|
|
36
|
Liberzon A, Birger C, Thorvaldsdóttir H,
Ghandi M, Mesirov JP and Tamayo P: The molecular signatures
database (MSigDB) hallmark gene set collection. Cell Syst.
1:417–425. 2015. View Article : Google Scholar : PubMed/NCBI
|
|
37
|
Niu ZS, Niu XJ, Wang WH and Zhao J: Latest
developments in precancerous lesions of hepatocellular carcinoma.
World J Gastroenterol. 22:3305–3314. 2016. View Article : Google Scholar : PubMed/NCBI
|
|
38
|
Batts KP and Ludwig J: Chronic hepatitis.
An update on terminology and reporting. Am J Surg Pathol.
19:1409–1417. 1995. View Article : Google Scholar : PubMed/NCBI
|
|
39
|
Choi JY, Lee JM and Sirlin CB: CT and MR
imaging diagnosis and staging of hepatocellular carcinoma: Part I.
Development, growth, and spread: Key pathologic and imaging
aspects. Radiology. 272:635–654. 2014. View Article : Google Scholar : PubMed/NCBI
|
|
40
|
Wong N, Yeo W, Wong WL, Wong NL, Chan KY,
Mo FK, Koh J, Chan SL, Chan AT, Lai PB, et al: TOP2A overexpression
in hepatocellular carcinoma correlates with early age onset,
shorter patients survival and chemoresistance. Int J Cancer.
124:644–652. 2009. View Article : Google Scholar : PubMed/NCBI
|
|
41
|
Li J, Gao JZ, Du JL, Huang ZX and Wei LX:
Increased CDC20 expression is associated with development and
progression of hepatocellular carcinoma. Int J Oncol. 45:1547–1555.
2014. View Article : Google Scholar : PubMed/NCBI
|
|
42
|
Gao CL, Wang GW, Yang GQ, Yang H and
Zhuang L: Karyopherin subunit-α 2 expression accelerates cell cycle
progression by upregulating CCNB2 and CDK1 in hepatocellular
carcinoma. Oncol Lett. 15:2815–2820. 2018.PubMed/NCBI
|
|
43
|
Chen J, Rajasekaran M, Xia H, Zhang X,
Kong SN, Sekar K, Seshachalam VP, Deivasigamani A, Goh BK, Ooi LL,
et al: The microtubule-associated protein PRC1 promotes early
recurrence of hepatocellular carcinoma in association with the
Wnt/β-catenin signalling pathway. Gut. 65:1522–1534. 2016.
View Article : Google Scholar : PubMed/NCBI
|
|
44
|
Ieta K, Ojima E, Tanaka F, Nakamura Y,
Haraguchi N, Mimori K, Inoue H, Kuwano H and Mori M: Identification
of overexpressed genes in hepatocellular carcinoma, with special
reference to ubiquitin-conjugating enzyme E2C gene expression. Int
J Cancer. 121:33–38. 2007. View Article : Google Scholar : PubMed/NCBI
|
|
45
|
Molina-Jimenez F, Benedicto I, Murata M,
Martín-Vílchez S, Seki T, Antonio Pintor-Toro J, Tortolero M,
Moreno-Otero R, Okazaki K, Koike K, et al: Expression of pituitary
tumor-transforming gene 1 (PTTG1)/securin in hepatitis B virus
(HBV)-associated liver diseases: Evidence for an HBV X
protein-mediated inhibition of PTTG1 ubiquitination and
degradation. Hepatology. 51:777–787. 2010. View Article : Google Scholar : PubMed/NCBI
|
|
46
|
Lu M, Huang X, Chen Y, Fu Y, Xu C, Xiang
W, Li C, Zhang S and Yu C: Aberrant KIF20A expression might
independently predict poor overall survival and recurrence-free
survival of hepatocellular carcinoma. IUBMB Life. 70:328–335. 2018.
View Article : Google Scholar : PubMed/NCBI
|
|
47
|
Zhang M, Yang D, Liu X, Liu Y, Liang J, He
H, Zhong K, Lin L, Tao G, Zhang C and Zhou J: Expression of Nusap1
in the surgical margins of hepatocellular carcinoma and its
association with early recurrence. Nan Fang Yi Ke Da Xue Xue Bao.
33:937–938, inside back cover, 2013 (In Chinese). PubMed/NCBI
|
|
48
|
Yang XM, Cao XY, He P, Li J, Feng MX,
Zhang YL, Zhang XL, Wang YH, Yang Q, Zhu L, et al: Overexpression
of Rac GTPase activating protein 1 contributes to proliferation of
cancer cells by reducing hippo signaling to promote cytokinesis.
Gastroenterology. 155:1233–1249 e22. 2018. View Article : Google Scholar : PubMed/NCBI
|
|
49
|
Wurmbach E, Chen YB, Khitrov G, Zhang W,
Roayaie S, Schwartz M, Fiel I, Thung S, Mazzaferro V, Bruix J, et
al: Genome-wide molecular profiles of HCV-induced dysplasia and
hepatocellular carcinoma. Hepatology. 45:938–947. 2007. View Article : Google Scholar : PubMed/NCBI
|
|
50
|
Willemen Y, Van den Bergh JM, Bonte SM,
Anguille S, Heirman C, Stein BM, Goossens H, Kerre T, Thielemans K,
Peeters M, et al: The tumor-associated antigen RHAMM (HMMR/CD168)
is expressed by monocyte-derived dendritic cells and presented to T
cells. Oncotarget. 7:73960–73970. 2016. View Article : Google Scholar : PubMed/NCBI
|
|
51
|
Rein DT, Roehrig K, Schondorf T, Lazar A,
Fleisch M, Niederacher D, Bender HG and Dall P: Expression of the
hyaluronan receptor RHAMM in endometrial carcinomas suggests a role
in tumour progression and metastasis. J Cancer Res Clin Oncol.
129:161–164. 2003. View Article : Google Scholar : PubMed/NCBI
|
|
52
|
Kalmyrzaev B, Pharoah PD, Easton DF,
Ponder BA and Dunning AM; SEARCH Team, : Hyaluronan-mediated
motility receptor gene single nucleotide polymorphisms and risk of
breast cancer. Cancer Epidemiol Biomarkers Prev. 17:3618–3620.
2008. View Article : Google Scholar : PubMed/NCBI
|
|
53
|
Buttermore ST, Hoffman MS, Kumar A,
Champeaux A, Nicosia SV and Kruk PA: Increased RHAMM expression
relates to ovarian cancer progression. J Ovarian Res. 10:662017.
View Article : Google Scholar : PubMed/NCBI
|
|
54
|
Koelzer VH, Huber B, Mele V, Iezzi G,
Trippel M, Karamitopoulou E, Zlobec I and Lugli A: Expression of
the hyaluronan-mediated motility receptor RHAMM in tumor budding
cells identifies aggressive colorectal cancers. Hum Pathol.
46:1573–1581. 2015. View Article : Google Scholar : PubMed/NCBI
|
|
55
|
Ishigami S, Ueno S, Nishizono Y, Matsumoto
M, Kurahara H, Arigami T, Uchikado Y, Setoyama T, Arima H, Yoshiaki
K, et al: Prognostic impact of CD168 expression in gastric cancer.
BMC Cancer. 11:1062011. View Article : Google Scholar : PubMed/NCBI
|
|
56
|
Pujana MA, Han JD, Starita LM, Stevens KN,
Tewari M, Ahn JS, Rennert G, Moreno V, Kirchhoff T, Gold B, et al:
Network modeling links breast cancer susceptibility and centrosome
dysfunction. Nat Genet. 39:1338–1349. 2007. View Article : Google Scholar : PubMed/NCBI
|
|
57
|
Snauwaert S, Vanhee S, Goetgeluk G,
Verstichel G, Van Caeneghem Y, Velghe I, Philippé J, Berneman ZN,
Plum J, Taghon T, et al: RHAMM/HMMR (CD168) is not an ideal target
antigen for immunotherapy of acute myeloid leukemia. Haematologica.
97:1539–1547. 2012. View Article : Google Scholar : PubMed/NCBI
|