Introduction
Perineural invasion (PNI), which is characterized by
the presence of cancer cells along nerves and/or within the
epineurial, perineurial and endoneurial spaces of the neuronal
sheath (1), have been reported in
numerous types of cancer, including pancreas, colon, rectum and
prostate (1,2). Among these types of cancer, pancreatic
ductal adenocarcinoma (PDAC) is associated with the highest rate of
incidence of PNI. According to our previous meta-analysis (3) from 1998 to 2012, the overall incidence
of PNI was 78.8% (range: 50.9–91.9%). PNI is also associated with
recurrence and poor prognosis (3).
In several cases PNI may be accompanied by pain, and a number of
molecules involved PNI are implicated in pain generation, such as
nerve growth factor (4). Targeting
these molecules may alleviate pain and decrease PNI, which could
potentially improve treatment outcomes (2). A previous study (5) demonstrated that the nervous system
participates in all stages of PDAC, including those that precede
the appearance of cancer; which indicates that early interventions
targeting the peripheral nervous system may present a novel
strategy for treatment and the early diagnosis of PDAC.
To identify molecular markers associated with PNI,
global gene expression level profiling has been used to investigate
differentially expressed genes (DEGs) in nerve-invading and
non-invading types of cancer cells. Koide et al (6) compared the gene expression level
profiles between five pancreatic cancer cell lines (CAPAN-1,
CAPAN-2, HPAFII, SW1990 and ASPC-1) with a high or low frequency of
PNI. It was reported that CD74 is a candidate molecule involved in
perineural invasion. Using an ex vivo model of PNI, Abiatari
et al (7) distinguished
highly nerve-invasive and non-invasive cancer cell clones in three
pancreatic cancer cell lines (Panc-1, Colo357 and T3M4).
Genome-wide transcriptome analyses identified several DEGs between
the two cancer cell clones, which included kinesin family member 14
(KIF14) and Rho-GDP dissociation inhibitor β (ARHGDIβ). In the
present study, gene expression profiling was used to identify
changes in gene expression levels associated with PNI in five
pancreatic cancer cell lines. In addition, Kyoto Encyclopedia of
Genes and Genomes (KEGG) pathway enrichment analysis and functional
annotation, and protein-protein interaction (PPI) network analysis
were performed to identify hub genes associated with PNI. The
results were verified using the GSE102238 dataset. The tissue
microarray demonstrated that fibroblast growth factor 2 (FGF2) was
associated with PNI in pancreatic cancer. It was hypothesized that
the DEGs associated with PNI could identify molecular alterations
and potential therapeutic targets for PDAC.
Materials and methods
Cell culture
The human ASPC-1, CAPAN-2, CFPAC-1, HPAC, PANC-1 and
SW1990 pancreatic cancer cell lines were obtained from the Cell
Resource Center of Shanghai Institute of Life Sciences, Chinese
Academy of Sciences. The normal human pancreatic duct epithelial
(HPDE) cell line was a gift from Professor Zhigang Zhang (State Key
Laboratory of Oncogenes and Related Genes, Shanghai Cancer
Institute, Shanghai Jiao Tong University, Shanghai, China). All
cells were maintained in the indicated medium supplemented with 10%
(v/v) FBS (Stemcell Technologies, Inc.) and 1% antibiotics
(penicillin and streptomycin) at 37°C in a humidified incubator
with 5% CO2. DMEM medium (Gibco; Thermo Fisher
Scientific, Inc.) was used for HPDE, PANC-1 and SW1990; RPMI-1640
medium (Gibco; Thermo Fisher Scientific, Inc.) was used for ASPC-1,
CAPAN-2 and HPAC; and Iscove's Modified Dulbecco's Medium (Gibco;
Thermo Fisher Scientific, Inc.) was used for CFPAC-1.
In vivo model of PNI
All animal experiments were performed in accordance
with the NIH Guide for the Care and Use of Laboratory Animals and
approved by the Research Ethics Committee of East China Normal
University (approval no. 20141204). The in vivo PNI model
was established as previously described (8). Briefly, 4-week-old nude athymic mice
[Balb/c; 17 male and 18 female, supplied by the jsj lab (www.jsj-lab.com)] were anesthetized using isoflurane
(induced with 3% isoflurane and maintained using 1.5% isoflurane),
and the right sciatic nerve was exposed. Pancreatic cancer cells
were injected into the periphery of the sciatic nerve.
Micro-injection of 5 µl cell suspension at a concentration of
1×10⁵ cells/ml was performed using a 10 µl microsyringe
(Gaoge, Shanghai). A total of 35 mice were randomly divided into
seven groups used (n=5 for each group). Mice were maintained in a
specific pathogen-free animal laboratory and kept in a room at
18–23°C with 40–60% humidity, with free access to food and water on
a 12 h day/night cycle. Intra-cage ammonia levels were maintained
at 25 parts per million. The variables mainly included those that
assessed the severity of PNI, including limb function and sciatic
nerve function index. As the general condition and tumor size of
the mice, especially the latter, may affect PNI, the mouse weight
and tumor volume were also measured. All variables were measured
weekly for 7 weeks. The tumor volume was calculated as V=(LxWxW)/2,
where V is the tumor volume, L is the tumor length and W is the
tumor width. Limb function and sciatic nerve function index were
measured to assess the severity of PNI (8). Limb function was graded according to
the severity of the limb paralysis from 4 (normal) to 1 (total paw
paralysis), according 3 (slight paralysis) and 2 (severe
paralysis). The mice were lightly touched to stimulate movement and
the limb function was measured. The sciatic nerve function index
was calculated as the difference in spread length between the first
and fifth toes of the hind limbs of the mouse before and after
tumor invasion. Prior to tumor invasion, the limb can stretch and
the spread length was considered to be normal. When the sciatic
nerve was invaded by the tumor, the limb contracted and the spread
length was decreased. Spread length was measured using vernier
caliper.
After 7 weeks, animals were sacrificed using an
overdose of CO2. Briefly, a flow rate of 4 l/min was
used to displace 40% of the total cage volume, which resulted in
insensibility before exposure to fatal concentrations (<40%).
The mice were exposed for 5 min and death was confirmed by
observing the lack of respiration and cardiovascular movements in a
room with normal air ventilation for at least 10 min. Mouse tumors
and nerve samples were collected in slices (5 µm) to investigate
the severity of nerve invasion. The frequency of PNI was analyzed
according to the extent of sciatic nerve involvement, which was
assessed via gross observation and immunohistochemistry.
Data collection
The microarray expression dataset (GSE26088) was
obtained from the Gene Expression Omnibus (GEO) (ncbi.nlm.nih.gov/geo/), which includes 20 pancreatic
cancer cell lines (9). The data of
the five cell lines were adopted and divided into two groups
according to their PNI ability. The expression data of raw CEL
files were normalized, log2 transformed and background adjusted
utilizing a Bioconductor package Robust MultiArray Average (RMA)
through R 3.2.0 software (10). The
normalized data were then analyzed using linear models for
microarray data (version 3.26.8) and a modified t-test
incorporating the Benjamini-Hochberg multiple hypotheses correction
technique.
GSE102238 (11),
which was also downloaded from the GEO database, was used as the
verification dataset to confirm the DEG results. GSE102238 contains
100 samples, including 50 PDAC tumors and 50 matching adjacent
non-cancerous tissue samples obtained from resected pancreas.
Samples were divided into two groups according to PNI status stated
in the dataset: PNI (n=28 pairs) and non-PNI (n=22 pairs).
Normalization and analysis of data were also performed.
Functional enrichment analysis of
DEGs
The criteria for selection of PNI-associated DEGs
were: i) Fold-change >1.50 or <0.66; ii) P<0.05. To
determine the enriched biological Gene Ontology (GO) terms and
pathways of the identified DEGs the Database for Annotation,
Visualization and Integrated Discovery server (v6.8; david.ncifcrf.gov) was used, according to the standard
enrichment computation method. P<0.05 was selected as the
cut-off value for enriched functions and pathways.
PPI network and subnetwork
analysis
PNI-associated DEGs were uploaded into the
NetworkAnalyst (http://www.networkanalyst.ca) database (12,13) to
determine the PPI network to identify hub genes. PPI network
analysis included three steps. The first step is to identify genes
or proteins of interest, such as differentially expressed genes.
Secondly, these inputs (also known as seed proteins) were used to
search and retrieve interactions from a curated PPI database. For
each seed protein, a search algorithm was performed to identify
proteins that directly interact with the seed proteins (first-order
interactors). If the default network constructed with first-order
interactors is small, users can search for higher-order
interactions. When there are too many seed proteins and the default
network is too large to be visualized, users can choose to focus
only on networks within these seed proteins (zero-order
interactors). In the present study, only interacting pairs
containing ≥1 DEG were selected to construct the PPI network, with
a confidence score >0.90, as the cut-off value. The third step
is network analysis which included two approaches. The topology
analysis search for important nodes (hub genes), which are useful
as biomarkers or therapeutic targets. The results from network
analysis was subsequently validated by other well-established
approaches, including GO or KEGG pathway enrichment analysis
(12,13).
Clinical tissue microarrays
The Human PDAC tissue microarray containing 205
cases of tumor and matched non-tumor tissues, as described by Yang
et al (14). Non-tumor tissue
1–2 cm away from the tumor tissue was used as the control,
therefore it was difficult to ensure that non-tumor tissues were
normal pancreatic tissues. It is possible that small portion of the
non-tumor tissues were chronic pancreatitis tissues. Only patients
with complete follow-up data for >2 years were included in the
present study. The follow-up data included postoperative treatment,
tumor marker and imaging examination, such as CT, MRI and PET-CT.
In total, 12 cases, which were lost within two years after
operation, were excluded. Tumors were classified using the
Tumor-Node-Metastasis (TNM) classification criteria, according to
the American Joint Committee on Cancer (8th edition) (15). Patients with TNM stage IV were
excluded from the analysis (n=13), as were patients who died of
perioperative complications, such as serious pancreatic leakage,
bleeding and systemic infections (n=23). Finally, 157 cases with
complete follow-up data were included. Tumor differentiation, nodal
metastasis and lymphovascular invasion were determined according to
pathological results. PNI was defined as PDAC cell infiltration of
the perineural space between the perineurium and endoneurium of the
peripheral nerve in directly contact with the endoneurium and
intraneural invasion (6). The
present study was approved by the Research Ethics Committee of
Renji Hospital, School of Medicine, Shanghai Jiao Tong University
(Shanghai, China). Written informed consent was provided by all
patients prior to enrolment.
Immunohistochemistry (IHC)
analysis
IHC staining was performed as previously described
(16). Biomarker expression levels
were detected using a commercially available rabbit polyclonal
antibody against FGF2 (1:200; cat no. ab126861; Abcam). FGF2
expression levels were scored according to staining intensity and
proportion. The intensity score was classified as 0 (no staining),
1 (weak staining), 2 (moderate staining) or 3 (strong staining).
The proportion score, based on the percentage of tumor cells, was
classified as 0 (<5%), 1 (6–35%), 2 (36–70%) or 3 (>70%). The
final score was calculated using the proportion and the staining
intensity scores and classified as follows: -, 0–1; +, 2–3; ++, 4–6
and +++, >6. Low expression levels were defined as a total score
<4; high expression levels were defined as a total score ≥4. The
low expression group included ‘-’ and ‘+’, while the high
expression group included ‘++’ and ‘+++’.’ The mouse monoclonal
antibody against PGP9.5 (1:500; cat. no. ab8189; Abcam) was used as
a pan-neuronal marker.
Reverse transcription-quantitative
(RT-q)PCR
RT-qPCR was performed as previously described
(14) using the aforementioned cell
lines and GAPDH as an internal control. Data was quantified using
the 2−ΔΔCq method (17).
The primer sequences used were as follows: FGF2 forward,
5′-AGAAGAGCGACCCTCACATCA-3′ and reverse,
5′-CGGTTAGCACACACTCCTTTG-3′; catenin α 2 (CTNNA2) forward,
5′-GGACGCTAACAGTGGAAAGG-3′ and reverse,
5′-GAGTGGCTTGCTCTACAGAGG-3′; and GAPDH forward,
5′-GCATTGCCCTCAACGACCAC-3′ and reverse,
5′-CCACCACCCTGTTGCTGTAG-3′.
Western blot analysis
Western blot analysis was performed as previously
described (16) using the
aforementioned cell lines and anti-FGF2 (1:1,000; cat. no.
ab126861; Abcam). GAPDH (1:1,000; cat. no. KC-5G4; Kangchen BioTech
Co., Ltd.) was used as an internal control. The protein level was
quantified by the ImageJ (version 1.52k, National Institutes of
Health) software. The mean levels for the high PNI ability group
were compared with the mean level in the low ability group.
Data mining using the cancer genome
atlas (TCGA)
TCGA public database (hgserver1.amc.nl/cgi-bin/r2/main.cgi) was used to
validate the association between FGF2 expression levels and overall
survival. Specifically, the dataset ‘Tumor Pancreatic
adenocarcinoma, TCGA-178’ was analyzed online. In total, 32 out of
178 patients were excluded due to incomplete follow-up data.
Statistical analysis
SPSS software (version 17.0; SPSS, Inc.) was used
for statistical analysis. Graphical representations were
constructed using GraphPad Prism (version 6; GraphPad Software,
Inc.). All data were presented as the mean ± SD from three
independent experiments. χ2 test was used to analyze the
categorical variables. Numerical variables between two groups were
assessed using two-tailed unpaired Student's t-test. In the
analysis of variables between high and low PNI ability cells, the
overall mean in each group was calculated, rather than for each
individual cell line. The comparison of multiple groups was
determined using parametric one-way ANOVA with Bonferroni's post
hoc test. Survival curves were plotted using the Kaplan-Meier
method, and differences were analyzed via the log-rank test using
SPSS version 17.0 (IBM, Corp.). P<0.05 (two-sided) was
considered to indicate a statistically significant difference.
Results
PNI ability of cancer cell lines
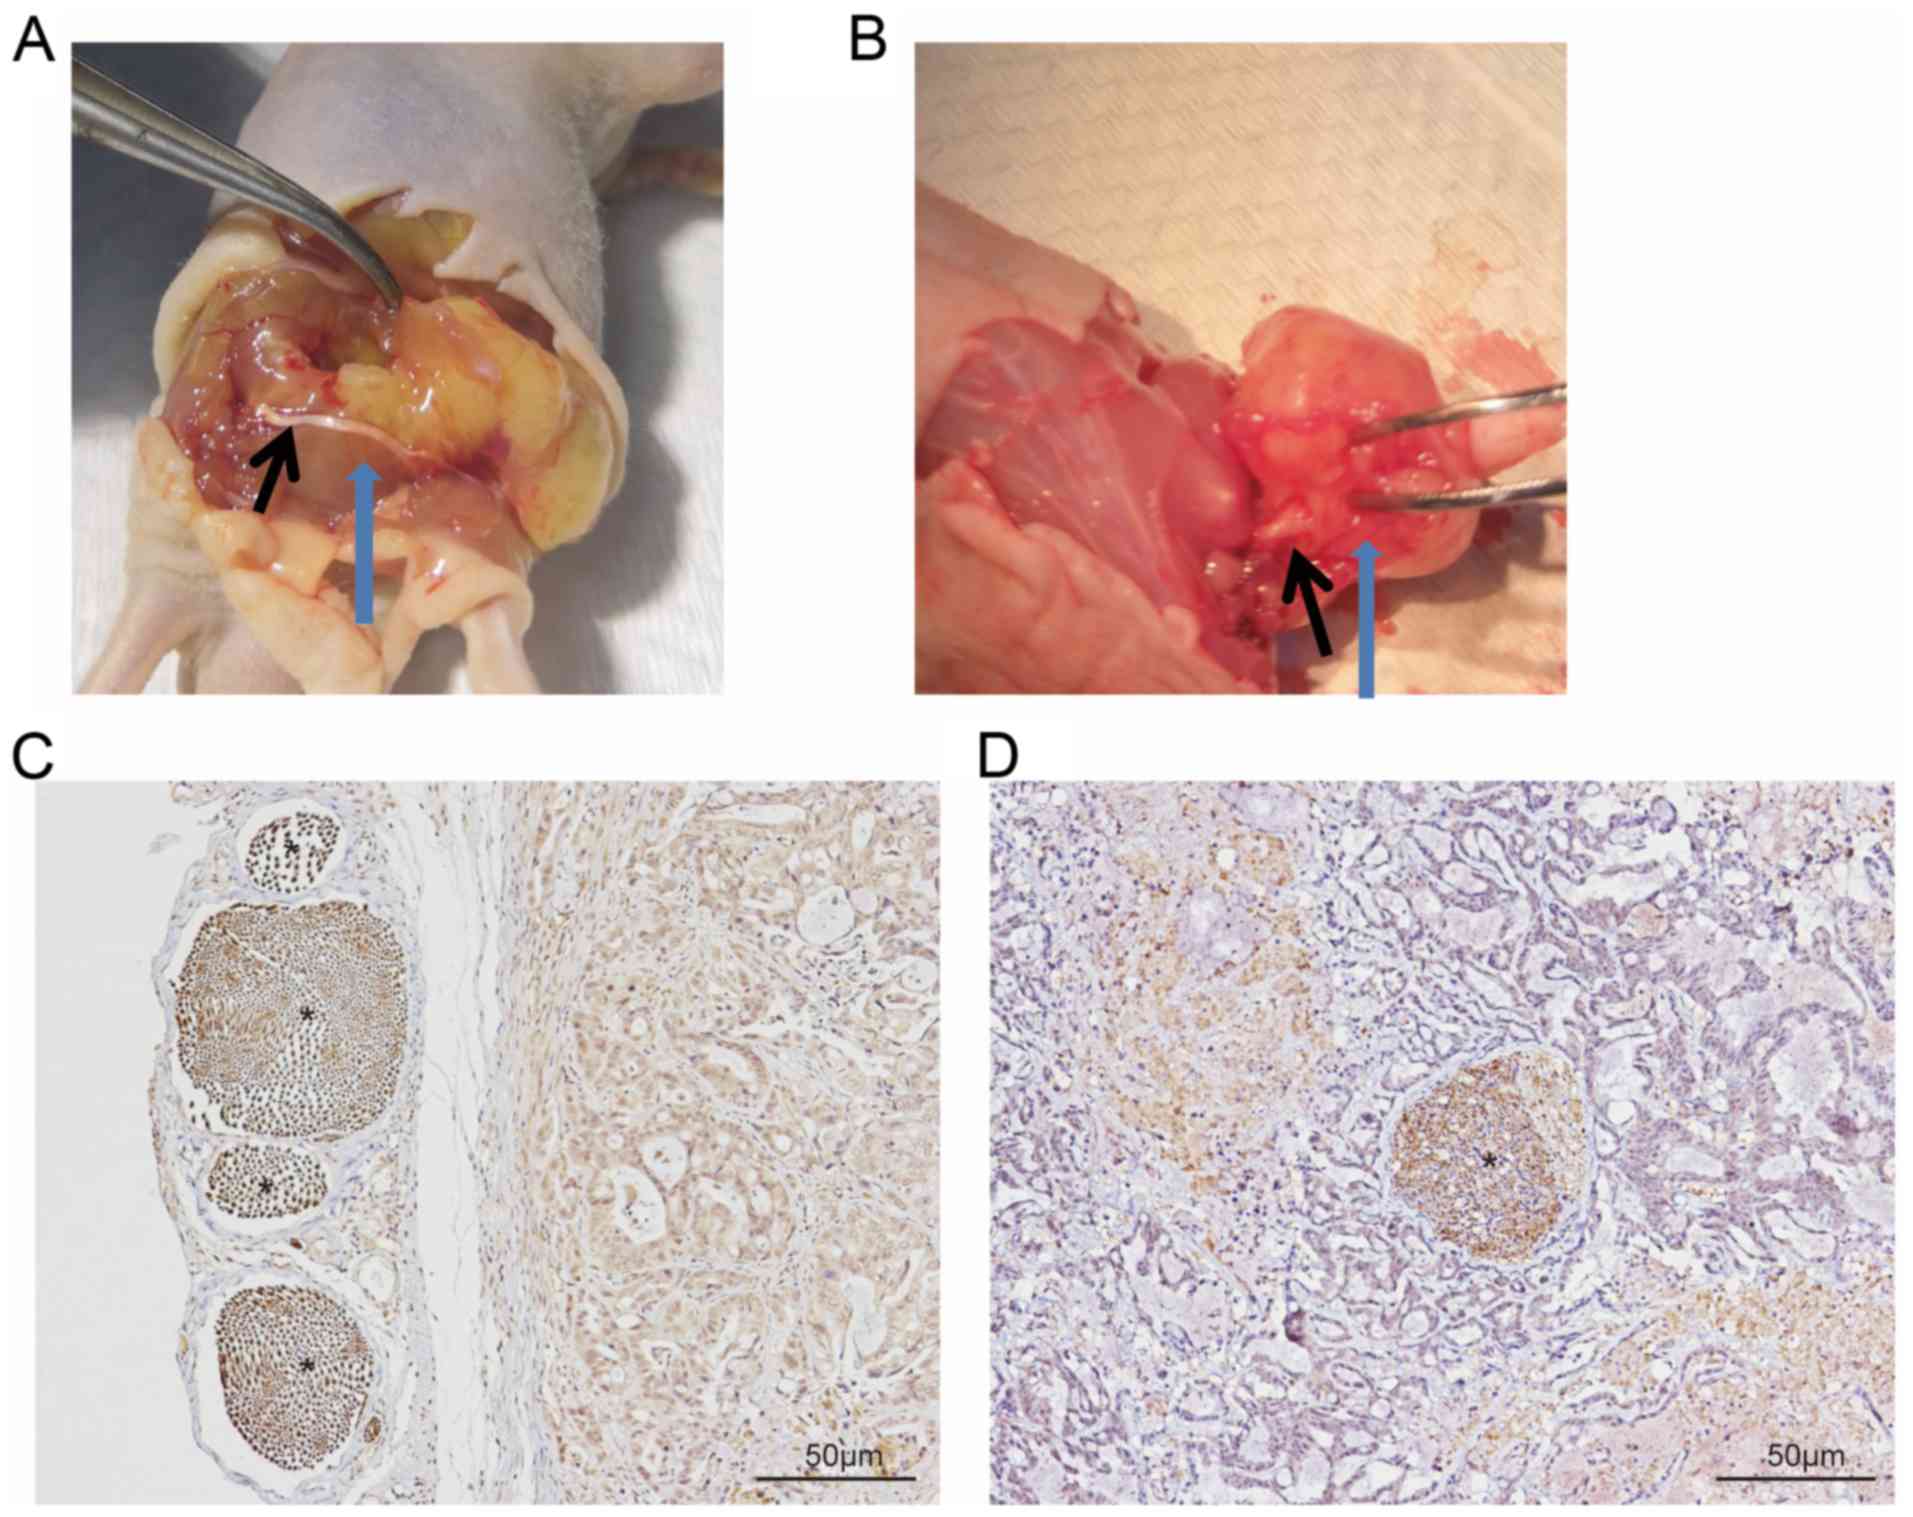
Following dissection, nerve involvement was
classified as running superficial of (Fig. 1A and C) or within (Fig. 1B and D) the tumor. The latter was
considered to indicate PNI. PNI was observed in all five mice
injected with the PANC-1 cell line, whereas it was only observed in
three mice injected with the CFPAC-1 and CAPAN-2 cell lines, and in
two mice with the HPAC cells. By contrast, PNI was not observed in
mice injected with the SW1990 or ASPC-1 cell lines. No tumor
formation was observed in the HPDE control group. The cell lines
were subsequently divided into two groups: High (comprising PANC-1,
CFPAC and CAPAN-2) and low PNI ability group (comprising SW1990 and
ASPC-1). Limb function of the mice in the high PNI group was
significantly lower compared with that in the low PNI group
(2.6±1.1 vs. 3.3±0.5; P=0.036). Sciatic nerve function index and
tumor length, width and volume were presented in Table I.
 | Table I.Characteristics of two PNI ability
group in vivo at 7 weeks. |
Table I.
Characteristics of two PNI ability
group in vivo at 7 weeks.
|
| PNI ability |
|
|---|
|
|
|
|
|---|
| Variable | High (n=15) | Low (n=10) | P-value |
|---|
| Cell line | PANC-1, CFPAC-1,
CAPAN-2 | SW1990, ASPC-1 |
|
| Mean mouse weight,
week 0, g ± SD | 18.86±0.38 | 19.00±0.39 | 0.383 |
| Mean mouse weight,
week 7, g ± SD | 24.95±0.97 | 25.58±0.74 | 0.094 |
| Mean tumor length,
mm ± SD | 10.44±2.36 | 10.66±2.40 | 0.823 |
| Mean tumor width,
mm ± SD | 7.99±1.56 | 8.62±2.06 | 0.390 |
| Mean tumor volume,
mm3 ± SD | 365.35±193.48 | 447.82±228.87 | 0.342 |
| Mean left SNFI, mm
± SD | 9.67±0.36 | 9.46±0.25 | 0.139 |
| Mean right SNFI, mm
± SD | 7.10±1.76 | 8.27±0.95 | 0.044a |
| Mean limb function
± SD | 2.60±1.10 | 3.30±0.50 | 0.036a |
Identification of PNI-associated
DEGs
Differential expression analysis of the two PNI
ability groups identified 445 DEGs (fold-change >1.50 or
<0.66; P<0.05), among which 176 (39.6%) were upregulated, and
269 (60.4%) were downregulated in the high PNI group compared with
the low PNI group. The top 10 genes in the up- and downregulated
groups are presented in Table II.
Sulfatase 2 (SULF2) has previously been reported to be associated
with PNI (18), but the other genes
were not be reported previously. And the top 10 upregulated and
downregulated genes were selected for further validation.
| Table II.Top 10 up- and downregulated
DEGs. |
Table II.
Top 10 up- and downregulated
DEGs.
| A, Upregulated
DEGs |
|---|
|
|---|
| Gene symbol | Description | Fold-change | P-value |
|---|
| BNIP3 | BCL2 interacting
protein 3 | 5.58 | 0.001235 |
| EFEMP1 | EGF-containing
fibulin-like extracellular matrix protein 1 | 3.73 | 0.006757 |
| GNB4 | G protein subunit β
4 | 3.65 | 0.001084 |
| NETO2 | Neuropilin and
tolloid-like 2 | 3.55 | 0.000477 |
| LY75 | Lymphocyte antigen
75 | 3.34 | 0.010767 |
| TSHZ3 | Teashirt zinc
finger homeobox 3 | 3.24 | 0.001838 |
| LIMS3 | LIM zinc finger
domain-containing 3 | 3.19 | 0.0000414 |
| TMSB15B | Thymosin β 15B | 3.01 | 0.003074 |
| NAP1L5 | Nucleosome assembly
protein 1-like 5 | 2.90 | 0.000186 |
| CLDN10 | Claudin 10 | 2.86 | 0.007955 |
|
| B, Downregulated
DEGs |
|
| SPON1 | Spondin
1 | 0.22 |
0.0000353 |
|
| CDH11 | Cadherin 11 | 0.22 | 0.0173247 |
| SDPR | Caveolae-associated
protein 2 | 0.31 | 0.0000935 |
| SOSTDC1 | Sclerostin
domain-containing 1 | 0.31 | 0.0012579 |
| LUM | Lumican | 0.33 | 0.0286506 |
| IL1B | Interleukin 1
β | 0.35 | 0.0179449 |
| ESM1 | Endothelial cell
specific molecule 1 | 0.36 | 0.0003328 |
| CCL20 | C-C motif chemokine
ligand 20 | 0.36 | 0.0003672 |
| SULF2 | Sulfatase 2 | 0.36 | 0.0227548 |
| PDE4B | Phosphodiesterase
4B | 0.37 | 0.0005664 |
Functional annotation of
PNI-associated DEGs
The significantly enriched GO terms were ranked
according to the P-value. The top five ranked terms for the three
different GO sub-ontologies (cellular component, biological
process, and molecular function) are presented in Table III. The results of KEGG pathway
enrichment analysis for the up- and downregulated genes are
presented in Table IV. A total of
eight pathways exhibited significant differences (P<0.05).
Upregulated genes were involved in one pathway, whereas the
downregulated genes were involved in seven pathways. Considering
the total number of genes, 19 differential genes from two
downregulated and one upregulated pathways were selected for
further validation. Matrix metalloproteinase-1 (MMP-1) (19) and C-X-C motif chemokine ligand 12
(CXCL12) (20,21) have been previously reported to be
associated with PNI.
| Table III.Top 5 Gene Ontology enrichment
analysis of DEGs associated with PNI. |
Table III.
Top 5 Gene Ontology enrichment
analysis of DEGs associated with PNI.
| A, Upregulated
DEGs |
|---|
|
|---|
| Sub-ontology | Terms | P-value |
|---|
| MF | Calcium ion
binding | 0.017056 |
|
| Transcription
factor activity | 0.030121 |
|
| β-tubulin
binding | 0.036267 |
|
| Protein
heterodimerization activity | 0.041477 |
| BP | Cilium
morphogenesis | 0.028336 |
|
| Brown fat cell
differentiation | 0.029846 |
|
| Positive regulation
of epithelial to mesenchymal transition | 0.031598 |
|
| Cell death | 0.033012 |
|
| Positive regulation
of stress fiber assembly | 0.042919 |
|
| B, Downregulated
DEGs |
|
| MF | Heparin
binding |
0.001728 |
|
|
| Receptor
binding | 0.003766 |
|
| Calcium ion
binding | 0.005090 |
|
| Chemoattractant
activity | 0.005946 |
|
| Steroid hormone
receptor activity | 0.007413 |
| BP | Chemotaxis |
6.15×10⁻⁶ |
|
| Cell-cell
signaling |
9.42×10⁻⁶ |
|
| Positive regulation
of endothelial cell proliferation |
3.98×10⁻⁵ |
|
| Positive regulation
of mesenchymal cell proliferation | 0.000385 |
|
| Skeletal system
development | 0.000553 |
| CC | Extracellular
region |
1.51×10⁻⁸ |
|
| Extracellular
space |
5.45×10⁻⁷ |
|
| Proteinaceous
extracellular matrix |
1.07×10⁻⁶ |
|
| Integral component
of plasma membrane |
1.96×10⁻⁶ |
|
| Plasma
membrane | 0.001295 |
| Table IV.A total of eight KEGG pathways are
associated with PNI. |
Table IV.
A total of eight KEGG pathways are
associated with PNI.
| Regulation | ID | KEGG pathway | Gene count | P-value | Genes |
|---|
| Up | hsa04962 |
Vasopressin-regulated water
reabsorption | 3 | 0.044488 | DYNC1I1, CREB5,
DYNC2H1 |
| Down | hsa03320 | PPAR signaling
pathway | 5 | 0.012359 | MMP-1, PCK1, FABP3,
CD36, ACOX2 |
|
| hsa05200 | Pathways in
cancer | 12 | 0.015915 | CXCL12, GNGT1,
FZD4, MMP-1, GLI1, AR, FLT3, IGF1, CTNNA2, GNG4, FGFR1, FGF2 |
|
| hsa05144 | Malaria | 4 | 0.027847 | IL1B, HBB, CD36,
KLRK1 |
|
| hsa05323 | Rheumatoid
arthritis | 5 | 0.030419 | IL1B, CXCL12,
MMP-1, TEK, CCL20 |
|
| hsa05032 | Morphine
addiction | 5 | 0.033831 | PDE4D, GABRG2,
PDE4B, GNGT1, GNG4 |
|
| hsa04060 | Cytokine-cytokine
receptor interaction | 8 | 0.034815 | IL1B, FLT3, CCL20,
TNFSF9, CCR9, TNFRSF19, CCR5, CXCL12 |
|
| hsa04062 | Chemokine signaling
pathway | 7 | 0.038868 | CCR5, CXCL12,
CCL20, CCR9, CCL15, GNGT1, GNG4 |
Candidate hub genes associated with
PNI
The 445 PNI-associated DEGs were regarded as seed
proteins and introduced into the NetworkAnalyst database for PPI
network analysis. Due to the large amount of seed proteins, the
mode of zero-order interactors was selected, as aforementioned. A
total of four sub-networks, 265 nodes, 434 edges and 131 seeds were
identified. A total of 20 genes with gene degree >6 were
regarded as hub genes (Table V) and
were selected for further validation. C-C chemokine receptor type 5
(CCR5) has previously been associated with PNI (22). For genes identified in the PPI
subnetwork, the top two pathways were ‘Chemokine signaling pathway’
and ‘Pathways in cancer’ (Table
VI), which were also identified in the downregulated KEGG
pathway (Table IV).
| Table V.Hub genes associated with perineural
invasion. |
Table V.
Hub genes associated with perineural
invasion.
| Gene | Description | Degree |
|---|
| AR | Androgen
receptor | 32 |
| MAPT |
Microtubule-associated protein τ | 15 |
| TEK | TEK receptor
tyrosine kinase | 13 |
| SNCA | Synuclein α | 12 |
| UBE2E1 |
Ubiquitin-conjugating enzyme E2 E1 | 12 |
| GLI1 | GLI-Kruppel family
member GLI1 | 12 |
| FGFR1 | Fibroblast growth
factor receptor 1 | 11 |
| ITPR1 | Inositol
1,4,5-trisphosphate receptor type 1 | 11 |
| PRKG1 | Protein kinase,
cGMP-dependent, type I | 11 |
| CCR5 | C-C motif chemokine
receptor 5 | 10 |
| GNB4 | G protein subunit β
4 | 10 |
| WWTR1 | WW
domain-containing transcription regulator 1 | 10 |
| PGR | Progesterone
receptor | 8 |
| FGF2 | Fibroblast growth
factor 2 | 7 |
| TNS1 | Tensin 1 | 7 |
| NPSR1 | Neuropeptide S
receptor 1 | 7 |
| MITF |
Melanogenesis-associated transcription
factor | 6 |
| FLT3 | Fms-like tyrosine
kinase 3 | 6 |
| TGFB2 | Transforming growth
factor β 2 | 6 |
| Table VI.Top 10 KEGG pathways in
protein-protein interaction network analysis. |
Table VI.
Top 10 KEGG pathways in
protein-protein interaction network analysis.
| KEGG pathway | Number of
genes | P-value | False discovery
rate |
|---|
| Chemokine signaling
pathway | 189 |
5.50×10⁻²² |
1.19×10⁻¹⁹ |
| Pathways in
cancer | 310 |
8.34×10⁻²¹ |
9.05×10⁻¹⁹ |
| Prostate
cancer | 87 |
6.16×10⁻¹⁹ |
4.46×10⁻¹⁷ |
| Adherens
junction | 70 |
4.60×10⁻¹⁸ |
2.50×10⁻¹⁶ |
| Cholinergic
synapse | 95 |
1.10×10⁻¹⁵ |
4.78×10⁻¹⁴ |
| Gap junction | 89 |
2.61×10⁻¹⁴ |
8.08×10⁻¹³ |
| Chagas disease
(American trypanosomiasis) | 89 |
2.61×10⁻¹⁴ |
8.08×10⁻¹³ |
| Melanogenesis | 101 |
4.93×10⁻¹³ |
1.34×10⁻¹¹ |
| Chronic myeloid
leukemia | 73 |
4.70×10⁻¹² |
1.13×10⁻¹⁰ |
| GnRH signaling
pathway | 94 |
8.21×10⁻¹² |
1.78×10⁻¹⁰ |
Validation of DEGs and hub genes in
GSE102238
As described above, we adopted three methods to
select the genes associated with PNI. The first group included the
top 10 upregulated and downregulated genes from differential
expression analysis of the two PNI ability groups. The second group
included 19 differential genes from two downregulated (hsa03320:
PPAR signaling pathway; hsa05200: Pathways in cancer) and one
upregulated (hsa04962: Vasopressin-regulated water reabsorption)
KEGG pathways. The third group included 20 hub genes from PPI
network analysis. The genes were validated by comparing 28 PNI and
22 non-PNI tumors in the GSE102238 dataset (Table VII). These results demonstrated
that only two genes, FGF2 and CTNNA2, were differently expressed in
GSE102238.
| Table VII.Validation results using 28 PNI and
22 non-PNI tumors in the GSE102238 dataset. |
Table VII.
Validation results using 28 PNI and
22 non-PNI tumors in the GSE102238 dataset.
| A, Top 10 DEGs
(upregulated and downregulated) |
|---|
|
|---|
| Gene | FC | P-value |
|---|
| Upregulated
DEGs |
|
|
|
BNIP3 | 1.063 | 0.805 |
|
EFEMP1 | 1.160 | 0.493 |
|
GNB4 | 0.897 | 0.481 |
|
NETO2 | 1.047 | 0.787 |
|
LY75 | 0.880 | 0.414 |
|
TSHZ3 | 1.212 | 0.282 |
|
LIMS3 | N/A | N/A |
|
TMSB15B | 1.118 | 0.486 |
|
NAP1L5 | 1.116 | 0.400 |
|
CLDN10 | 1.067 | 0.837 |
| Downregulated
DEGs |
|
|
|
SPON1 | 1.339 | 0.329 |
|
CDH11 | 1.030 | 0.891 |
|
SDPR | 1.169 | 0.485 |
|
SOSTDC1 | 1.416 | 0.309 |
|
LUM | 1.092 | 0.573 |
|
IL1B | 0.851 | 0.524 |
|
ESM1 | 1.141 | 0.667 |
|
CCL20 | 0.730 | 0.406 |
|
SULF2 | 0.996 | 0.978 |
|
PDE4B | 0.763 | 0.188 |
|
| B, DEGs from
KEGG pathways |
|
| Gene | FC | P-value |
|
|
Vasopressin-regulated water reabsorption
(upregulated) |
|
|
|
DYNC1I1 | 1.081 | 0.584 |
|
CREB5 | 1.059 | 0.708 |
|
DYNC2H1 | 1.051 | 0.577 |
| PPAR signaling
pathway (downregulated) |
|
|
|
MMP1 | 0.583 | 0.172 |
|
PCK1 | 0.922 | 0.830 |
|
FABP3 | 0.870 | 0.368 |
|
CD36 | 0.949 | 0.865 |
|
ACOX2 | 1.053 | 0.509 |
| Pathways in cancer
(downregulated) |
|
|
|
CXCL12 | 1.061 | 0.794 |
|
GNGT1 | 1.479 | 0.266 |
|
FZD4 | 1.078 | 0.694 |
|
GLI1 | 1.349 | 0.233 |
|
FGFR1 | 1.196 | 0.243 |
| AR | 1.342 | 0.076 |
|
FLT3 | 1.002 | 0.990 |
|
IGF1 | 0.902 | 0.760 |
|
CTNNA2 | 0.888 | 0.049a |
|
GNG4 | 1.094 | 0.619 |
|
FGF2 | 1.451 | 0.038a |
|
| C, Hub
genes |
|
| Genes | FC | P-value |
|
|
FGF2 | 1.451 | 0.038a |
|
GLI1 | 1.349 | 0.233 |
|
NPSR1 | 0.942 | 0.914 |
|
CCR5 | 1.012 | 0.957 |
|
PDE4D | 0.919 | 0.664 |
|
TEK | 0.966 | 0.817 |
|
FGFR1 | 1.196 | 0.243 |
|
PGR | 1.237 | 0.239 |
|
TNS1 | 1.275 | 0.074 |
|
MAPT | 1.316 | 0.082 |
| AR | 1.342 | 0.076 |
|
FLT3 | 1.002 | 0.990 |
|
GNB4 | 0.897 | 0.481 |
|
UBE2E1 | 0.997 | 0.974 |
|
WWTR1 | 1.210 | 0.114 |
|
TGFB2 | 1.262 | 0.304 |
|
PRKG1 | 1.138 | 0.377 |
|
SNCA | 1.012 | 0.944 |
|
ITPR1 | 0.986 | 0.911 |
|
MITF | 0.946 | 0.598 |
Validation of protein and mRNA
expression levels
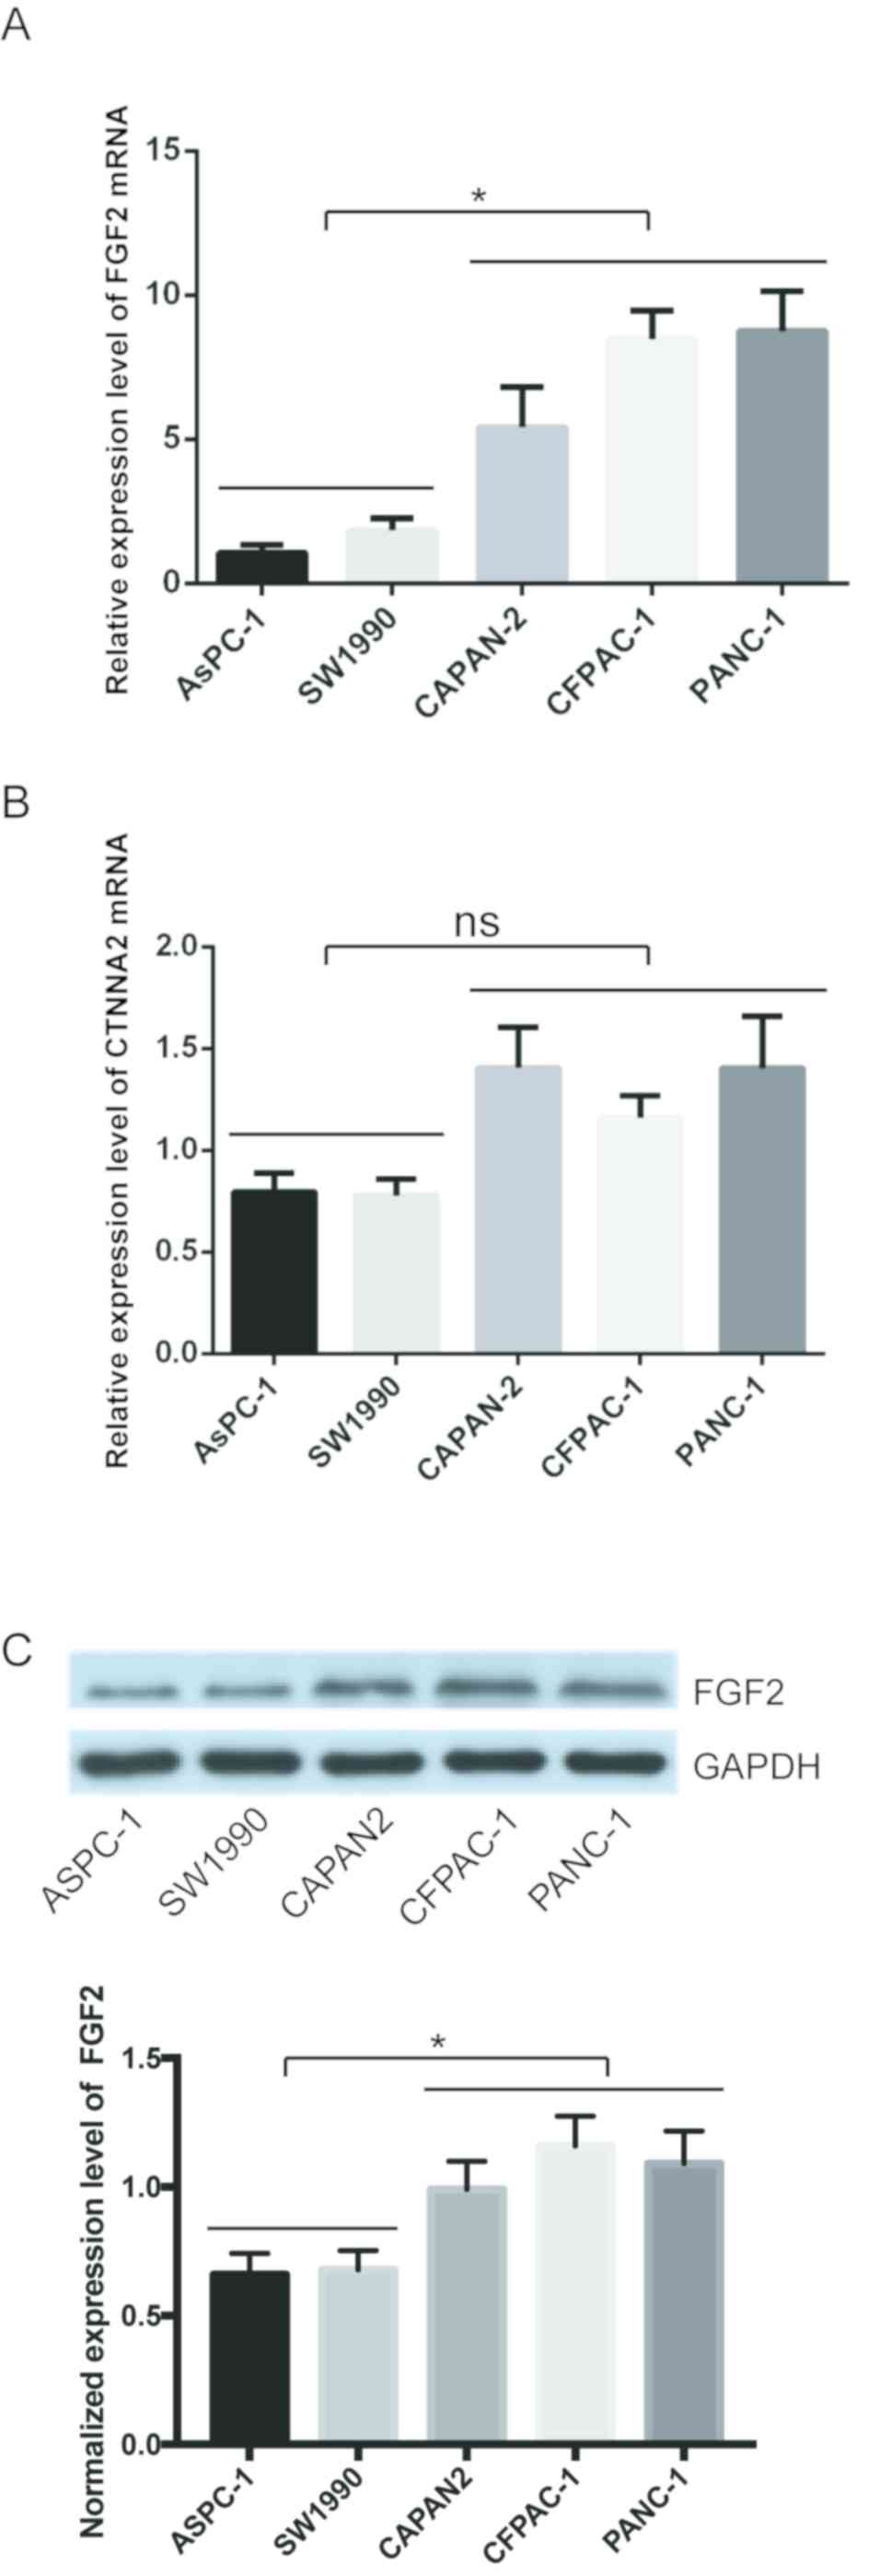
The expression levels of FGF2 and CTNNA2 in the
pancreatic cancer cell lines were subsequently validated. The mean
levels for the high PNI ability group were compared with the mean
levels in the low ability group. FGF2 mRNA expression levels were
significantly higher in the high PNI ability group compared with
that in the low PNI ability group (Fig.
2A). CTNNA2 mRNA expression levels were not significantly
different between the two groups (Fig.
2B). The protein expression level of FGF2 was also higher in
the high PNI ability group, using western blot analysis (Fig. 2C). FGF2 was selected for validation
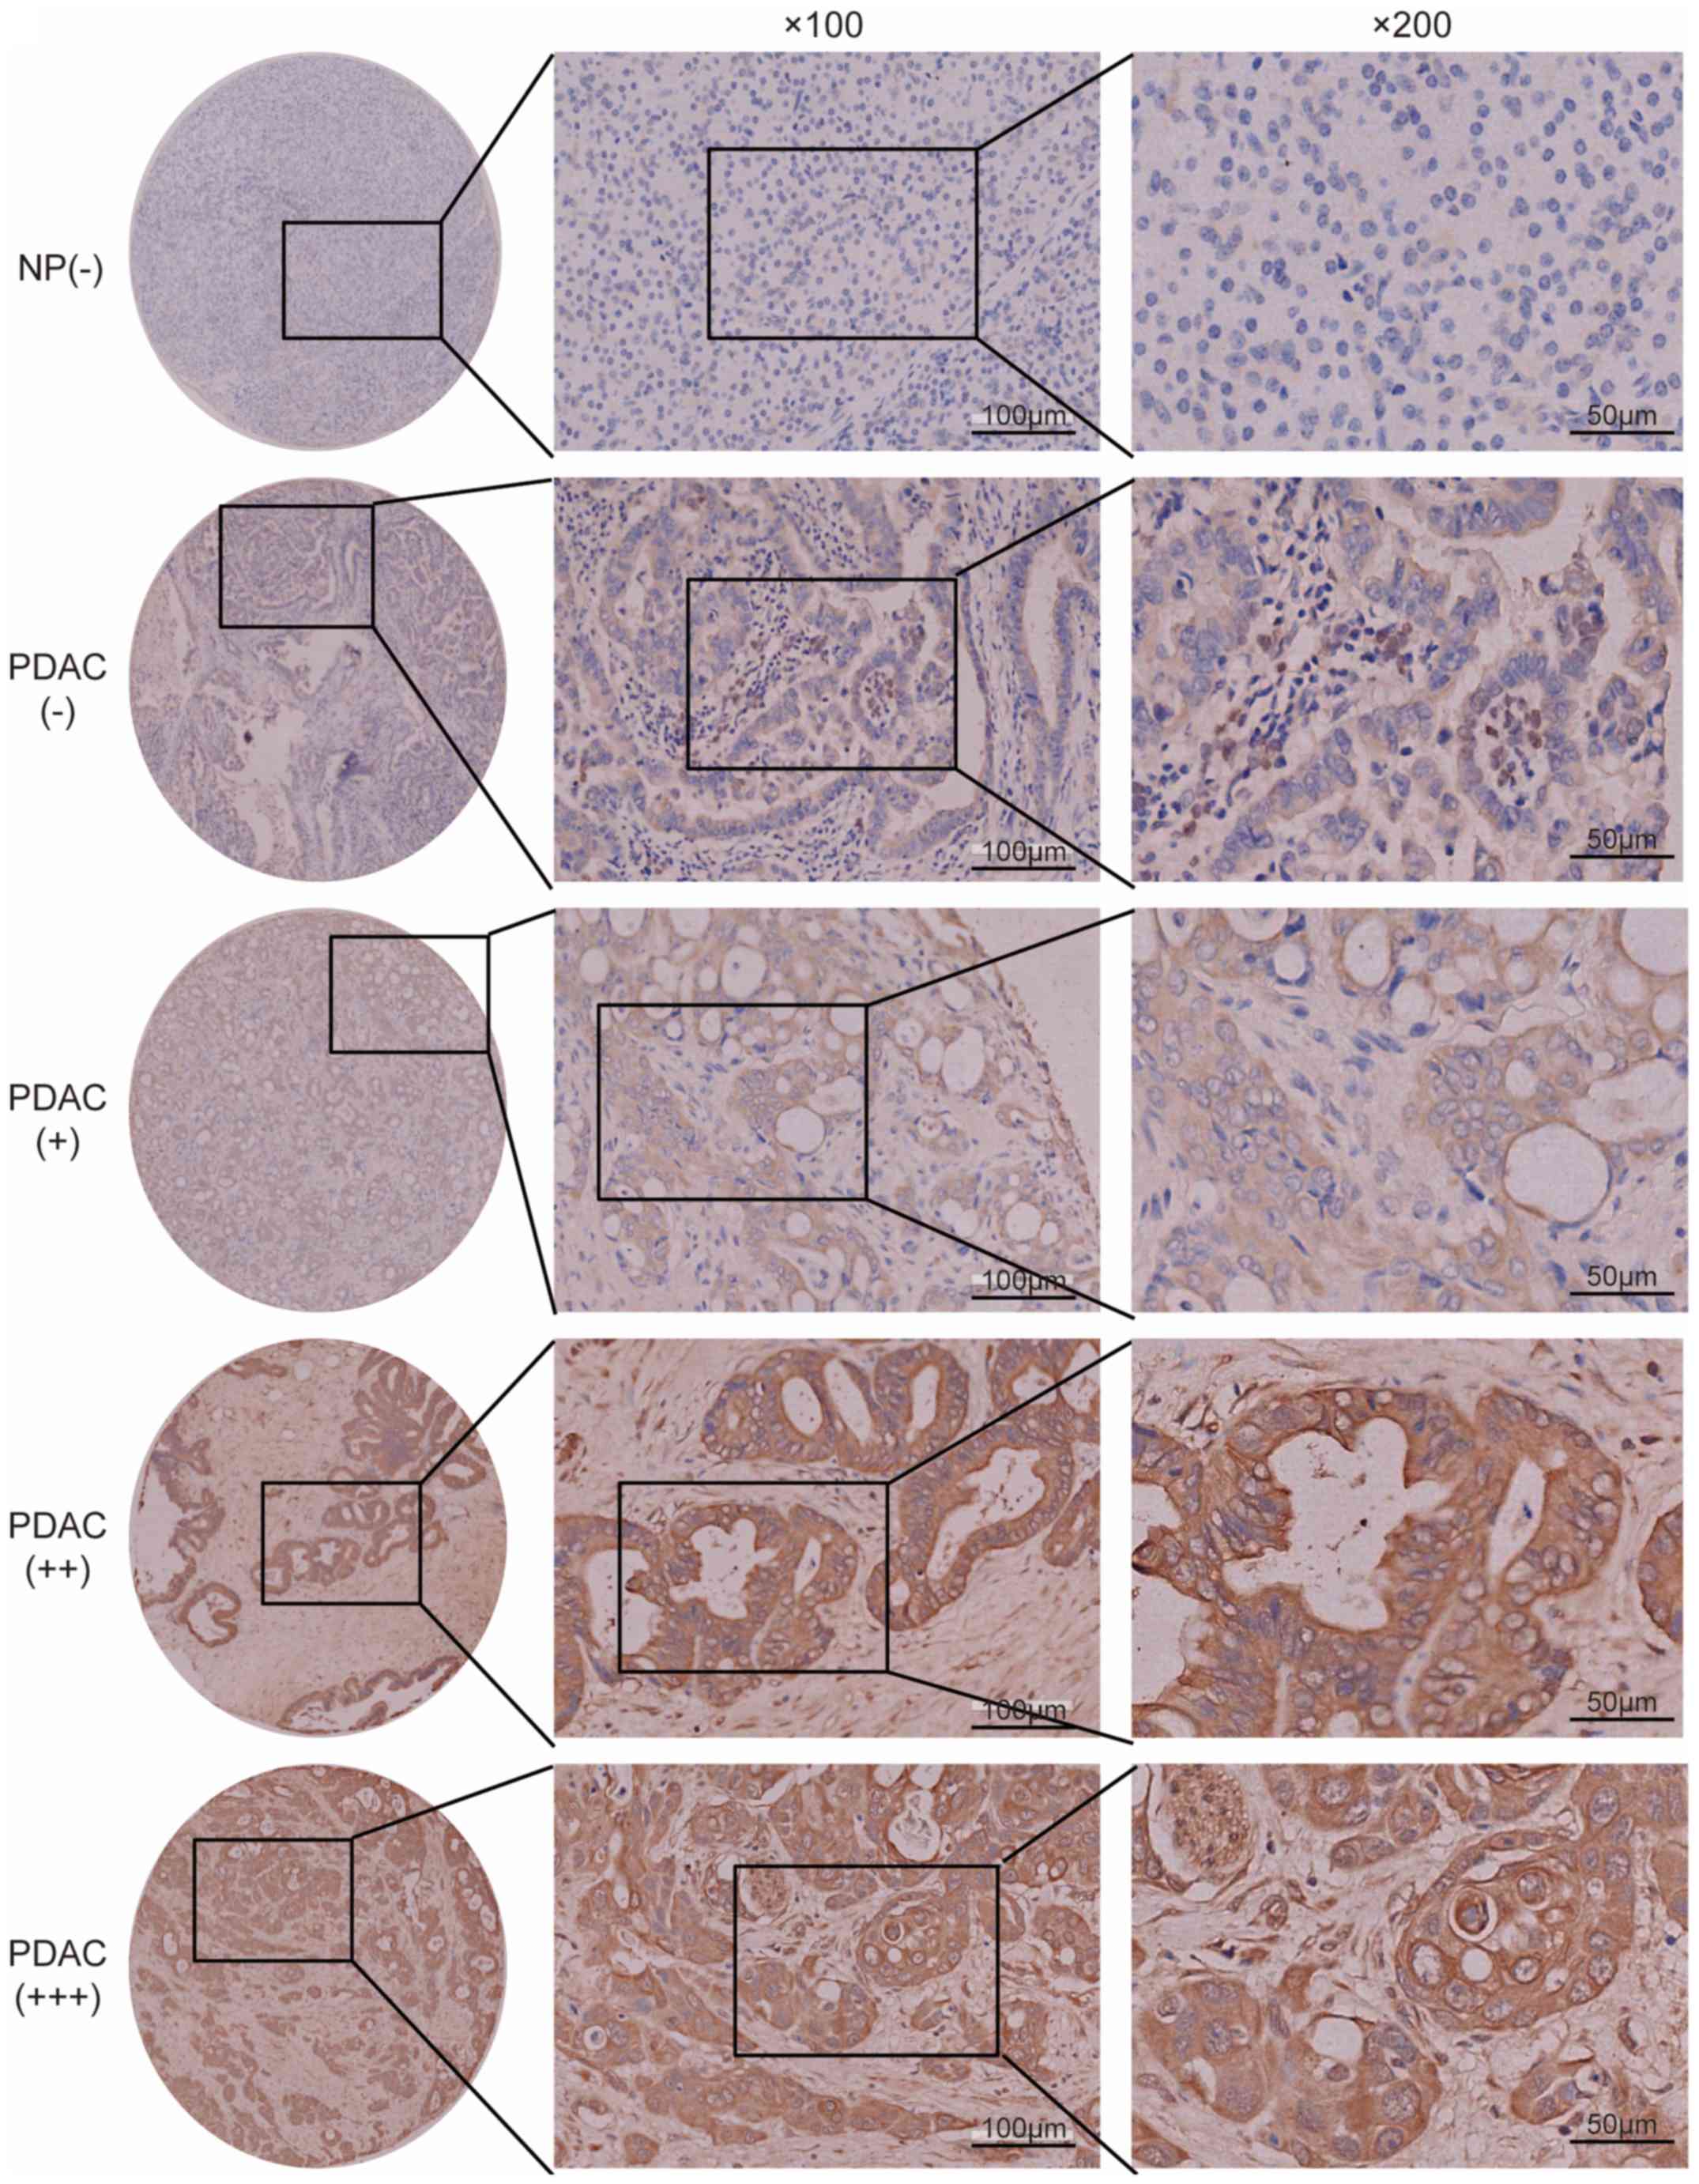
using tissue microarray analysis. Epithelial cells in normal
pancreas exhibited low FGF2 expression levels (Fig. 3). None of the non-tumor tissues
showed high FGF2 expression levels. In patients with PDAC, 31
(19.7%) cases exhibited a high expression level of FGF2, and 126
(80.3%) cases exhibited a low FGF2 expression level (Fig. 3). FGF2 expression levels in PDAC were
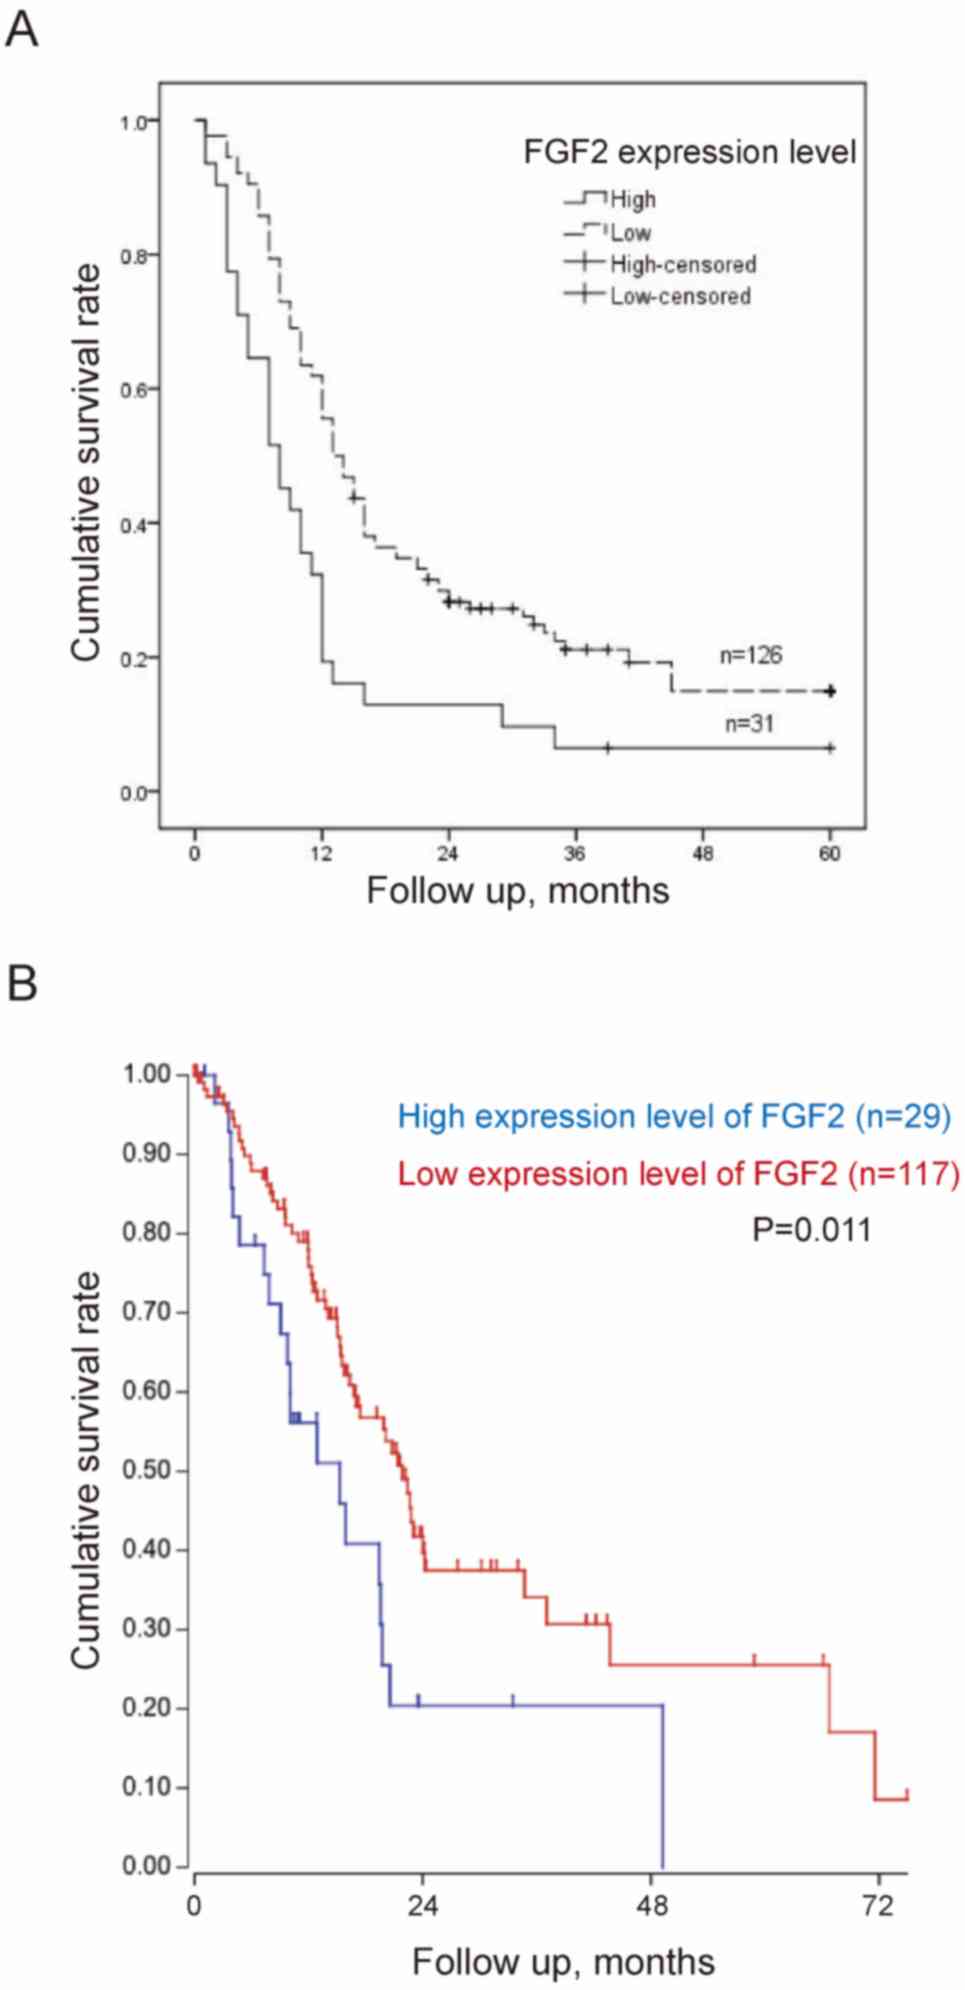
associated with PNI, tumor differentiation and TNM stage (Table VIII). Patients with high
expression levels of FGF2 had a significantly worse survival rate
compared with those with low expression levels [12.2 months; 95%
confidence interval (CI), 7.1–17.3 months, vs. 21.9 months; 95% CI,
18.5–25.4 months; P<0.001] (Fig.
4A). TCGA public database (Tumor Pancreatic adenocarcinoma,
TCGA-178) was used to validate the association between FGF2
expression levels and overall survival online. In TCGA public
database, 146 patients were followed up. And the patients were
divided into the high and low expression groups in a similar
proportion with Renji cohort. The results demonstrated that a high
expression level of FGF2 was associated with poor survival
(Fig. 4B).
| Table VIII.Association between FGF2 expression
levels and clinicopathological characteristics in patients with
pancreatic ductal adenocarcinoma. |
Table VIII.
Association between FGF2 expression
levels and clinicopathological characteristics in patients with
pancreatic ductal adenocarcinoma.
|
|
| Expression level of
FGF2 |
|
|---|
|
|
|
|
|
|---|
| Clinicopathological
characteristic | Total (n=157) | Positive, n=31
(19.7%) | Negative, n=126
(80.3%) |
P-valuea |
|---|
| Age, years, n
(%) |
|
|
| 0.332 |
|
≤65 | 73 | 12 (16.4) | 61 (83.6) |
|
|
>65 | 84 | 19 (22.6) | 65 (77.4) |
|
| Sex, n (%) |
|
|
| 0.191 |
|
Male | 90 | 21 (23.3) | 69 (76.7) |
|
|
Female | 67 | 10 (14.9) | 57 (85.1) |
|
| Tumor size, cm, n
(%) |
|
|
| 0.201 |
|
≤2.0 | 30 | 3 (10.0) | 27 (90.0) |
|
|
>2.0 | 127 | 28 (22.0) | 99 (78.0) |
|
| Tumor location, n
(%) |
|
|
| 0.628 |
|
Head | 107 | 20 (18.7) | 87 (81.3) |
|
|
Body/tail | 50 | 11 (22.0) | 39 (78.0) |
|
| Tumor
differentiation, n (%) |
|
|
| 0.013b |
|
Well/moderate | 101 | 14 (13.9) | 87 (86.1) |
|
|
Poor | 56 | 17 (30.4) | 39 (69.6) |
|
| Perineural
invasion, n (%) |
|
|
| 0.013b |
|
Absent | 44 | 3 (6.8) | 41 (93.2) |
|
|
Present | 113 | 28 (24.8) | 85 (75.2) |
|
| Nodal metastasis, n
(%) |
|
|
| 0.976 |
|
Absent | 106 | 21 (19.8) | 85 (80.2) |
|
|
Present | 51 | 10 (19.6) | 41(80.4) |
|
| Lymphovascular
invasion, n (%) |
|
|
| 0.843 |
|
Absent | 135 | 27 (20.0) | 108 (80.0) |
|
|
Present | 22 | 4 (18.2) | 18 (81.8) |
|
| Clinical stage, n
(%) |
|
|
| 0.046b |
|
I/II | 118 | 19 (16.1) | 99 (83.9) |
|
|
III | 39 | 11 (28.2) | 28 (71.8) |
|
Discussion
Identifying the molecular characteristics of PNI is
key for a greater understanding of tumor biology. Previous studies
have used pancreatic cancer cells (6,7) to
distinguish PNI-associated genes in cell lines with high or low PNI
ability. In the present study, pancreatic cancer cells were also
used to identify PNI-associated genes. To the best of our
knowledge, the present study is the first to use functional
enrichment and PPI network analysis to distinguish between
PNI-associated pathways and hub genes.
In the present study, ‘chemokine signaling pathway’
was the top pathway associated with PNI in the PPI network. A total
of four genes (SULF2, MMP-1, CXCL12 and CCR5) from identified DEGs
and hub genes have been reported to be associated with PNI
(18–22). Of these genes, CXCL12 and CCR5 were
found to be involved in the ‘chemokine signaling pathway’. The
CXCL12/CXCR4 axis is a widely studied chemokine signaling pathway
in cancer (23). It has been
reported (20) that CXCL12 is
associated with PNI in pancreatic cancer; CXCL12 is secreted by
peripheral nerves and stimulates chemotactic migration of CXCR4(+)
cancer cells in a paracrine manner, which results in PNI.
Similarly, CXCR4(+) breast cancer cells migrate toward distant
organs, such as lung and liver, in response to a CXCL12 gradient
(24). CCR5 is the chemokine
receptor for C-C motif chemokine ligand 5 (CCL5), which is an
inflammatory chemokine (25). A
previous study (22) demonstrated
that exogenous CCL5 significantly facilitated PNI activity in human
salivary adenoid cystic carcinoma, which could be blocked by a CCR5
inhibitor (e.g., maraviroc). In addition, CCL5 is secreted by
Schwann and dorsal root ganglia cells (26). These studies demonstrate that the
‘chemokine signaling pathway’ is associated with PNI. Chemokine
receptors, which are aberrantly expressed (increased or decreased)
on the cancer cell surface, are potential therapeutic targets as
well as a possible method for identification of PNI-associated
genes.
FGF2, also known as basic FGF, is part of the
22-member FGF family (27). It is a
multifunctional growth factor that exerts potent angiogenic effects
and serves a key role in the differentiation and function of the
central nervous system (26). A
number of studies (28,29) have demonstrated that high expression
levels of FGF2 are significant prognostic indicators for patients
with PDAC. However, to the best of our knowledge, there have been
no previous studies regarding the association between FGF2 and PNI.
In the present study, FGF2 was demonstrated to be a hub gene
associated with PNI in pancreatic cancer cell lines, and further
validated by a tissue microarray. It has been reported that high
levels of FGF2 are detected from neurulation onwards during
development. Moreover, developmental expression of FGF2 and its
receptors is temporally and spatially regulated (27). Therefore, an increased FGF2/FGFR1
signaling is a focus of therapeutic development for
neurodegenerative disorders, due to its importance in adult
neurogenesis and neuroinflammation (27), and FGF2 may be a potential target in
the treatment of pancreatic cancer.
In conclusion, the present study identified
PNI-associated genes in pancreatic cancer cell lines and the
‘chemokine signaling pathway’ was found to be associated with PNI,
following KEGG pathway enrichment analysis and the construction of
a PPI network from the identified DEGs. Furthermore, FGF2 was found
to be associated with PNI. The present study provides a potential
method to identify PNI-associated genes. However, further
investigation of PNI-associated genes is required to elucidate the
molecular mechanisms underlying PNI, and to identify potential
therapeutic targets.
Acknowledgements
Not applicable.
Funding
The present study was supported by grants from the
National Natural Science Foundation of China (grant nos. 81401931,
81702739, 81602414 and 81802317), Science and Technology Funds of
the School of Medicine, Shanghai Jiao Tong University (grant no.
14XJ10022), the Scientific Research Project of Shanghai Municipal
Health and Family Planning Commission (grant no. 201740218) and
Shanghai Minhang Science and Technology Committee (grant no.
2018MHZ063).
Availability of data and materials
The datasets used and/or analyzed during the current
study are available from the corresponding author on reasonable
request.
Authors' contributions
JZ, YS, JY and JW conceived and designed the study,
collected and analyzed the data. JZ and DL wrote the original
manuscript and revised it for important intellectual content. XF
and DL performed the experiments and collected and analyzed the
data. RH also analyzed the data. MY performed the experiments and
revised the manuscript. JY, JW and RH revised the manuscript. YH
and WL collected and analyzed the data. All authors read and
approved the final manuscript.
Ethics approval and consent to
participate
The animal studies were performed at East China
Normal University. All animal experiments were performed in
accordance with the NIH Guide for the Care and Use of Laboratory
Animal studies was approved by the Research Ethics Committee of
East China Normal University (approval no. 20141204). The Human
PDAC tissue microarray containing 205 cases of tumor and matched
non-tumor tissues from Renji Hospital, School of Medicine, Shanghai
Jiao Tong University. The follow-up data included postoperative
treatment, tumor marker and imaging examination, such as CT, MRI
and PET-CT. The human experiments of the present study were
approved by the Research Ethics Committee of Renji Hospital, School
of Medicine, Shanghai Jiao Tong University (Shanghai, China).
Patient consent for publication
Written informed consent was provided for
publication by all patients prior to enrolment.
Competing interests
The authors declare that they have no competing
interests.
References
|
1
|
Liebig C, Ayala G, Wilks JA, Berger DH and
Albo D: Perineural invasion in cancer: A review of the literature.
Cancer. 115:3379–3391. 2009. View Article : Google Scholar : PubMed/NCBI
|
|
2
|
Bapat AA, Hostetter G, Von Hoff DD and Han
H: Perineural invasion and associated pain in pancreatic cancer.
Nat Rev Cancer. 11:695–707. 2011. View
Article : Google Scholar : PubMed/NCBI
|
|
3
|
Zhang JF, Hua R, Sun YW, Liu W, Huo YM,
Liu DJ and Li J: Influence of perineural invasion on survival and
recurrence in patients with resected pancreatic cancer. Asian Pac J
Cancer Prev. 14:5133–5139. 2013. View Article : Google Scholar : PubMed/NCBI
|
|
4
|
Zhu Z, Friess H, diMola FF, Zimmermann A,
Graber HU, Korc M and Büchler MW: Nerve growth factor expression
correlates with perineural invasion and pain in human pancreatic
cancer. J Clin Oncol. 17:2419–2428. 1999. View Article : Google Scholar : PubMed/NCBI
|
|
5
|
Stopczynski RE, Normolle DP, Hartman DJ,
Ying H, DeBerry JJ, Bielefeldt K, Rhim AD, DePinho RA, Albers KM
and Davis BM: Neuroplastic changes occur early in the development
of pancreatic ductal adenocarcinoma. Cancer Res. 74:1718–1727.
2014. View Article : Google Scholar : PubMed/NCBI
|
|
6
|
Koide N, Yamada T, Shibata R, Mori T,
Fukuma M, Yamazaki K, Aiura K, Shimazu M, Hirohashi S, Nimura Y and
Sakamoto M: Establishment of perineural invasion models and
analysis of gene expression revealed an invariant chain (CD74) as a
possible molecule involved in perineural invasion in pancreatic
cancer. Clin Cancer Res. 12:2419–2426. 2006. View Article : Google Scholar : PubMed/NCBI
|
|
7
|
Abiatari I, DeOliveira T, Kerkadze V,
Schwager C, Esposito I, Giese NA, Huber P, Bergman F, Abdollahi A,
Friess H and Kleeff J: Consensus transcriptome signature of
perineural invasion in pancreatic carcinoma. Mol Cancer Ther.
8:1494–1504. 2009. View Article : Google Scholar : PubMed/NCBI
|
|
8
|
Gil Z, Cavel O, Kelly K, Brader P, Rein A,
Gao SP, Carlson DL, Shah JP, Fong Y and Wong RJ: Paracrine
regulation of pancreatic cancer cell invasion by peripheral nerves.
J Natl Cancer Inst. 102:107–118. 2010. View Article : Google Scholar : PubMed/NCBI
|
|
9
|
Shain AH, Giacomini CP, Matsukuma K,
Karikari CA, Bashyam MD, Hidalgo M, Maitra A and Pollack JR:
Convergent structural alterations define SWItch/Sucrose
NonFermentable (SWI/SNF) chromatin remodeler as a central tumor
suppressive complex in pancreatic cancer. Proc Natl Acad Sci USA.
109:E252–E259. 2012. View Article : Google Scholar : PubMed/NCBI
|
|
10
|
R Core Team, . R: A language and
environment for statistical computing. R foundation for statistical
computing; Vienna, Austria: ISBN 3-900051-07-0. 2012,
|
|
11
|
Yang MW, Tao LY, Jiang YS, Yang JY, Huo
YM, Liu DJ, Li J, Fu XL, He R, Lin C, et al: Perineural invasion
reprograms the immune microenvironment through cholinergic
signaling in pancreatic ductal adenocarcinoma. Cancer Res.
80:1991–2003. 2020.PubMed/NCBI
|
|
12
|
Xia J, Gill EE and Hancock RE:
NetworkAnalyst for statistical, visual and network-based
meta-analysis of gene expression data. Nat Protoc. 10:823–844.
2015. View Article : Google Scholar : PubMed/NCBI
|
|
13
|
Xia J, Benner MJ and Hancock RE:
NetworkAnalyst-integrative approaches for protein-protein
interaction network analysis and visual exploration. Nucleic Acids
Res. 42((Web Server Issue)): W167–W174. 2014. View Article : Google Scholar : PubMed/NCBI
|
|
14
|
Yang JY, Jiang SH, Liu DJ, Yang XM, Huo
YM, Li J, Hua R, Zhang ZG and Sun YW: Decreased LKB1 predicts poor
prognosis in pancreatic ductal adenocarcinoma. Sci Rep.
5:105752015. View Article : Google Scholar : PubMed/NCBI
|
|
15
|
Amin MB, Edge S, Greene F, et al: AJCC
cancer staging manual. 8th. New York, Springer: 2017, View Article : Google Scholar
|
|
16
|
Yan TT, Fu XL, Li J, Bian YN, Liu DJ, Hua
R, Ren LL, Li CT, Sun YW, Chen HY, et al: Downregulation of RPL15
may predict poor survival and associate with tumor progression in
pancreatic ductal adenocarcinoma. Oncotarget. 6:37028–37042. 2015.
View Article : Google Scholar : PubMed/NCBI
|
|
17
|
Livak KJ and Schmittgen TD: Analysis of
relative gene expression data using real-time quantitative PCR and
the 2(-Delta Delta C(T)) method. Methods. 25:402–408. 2001.
View Article : Google Scholar : PubMed/NCBI
|
|
18
|
Alhasan SF, Haugk B, Ogle LF, Beale GS,
Long A, Burt AD, Tiniakos D, Televantou D, Coxon F, Newell DR, et
al: Sulfatase-2: A prognostic biomarker and candidate therapeutic
target in patients with pancreatic ductal adenocarcinoma. Br J
Cancer. 115:797–804. 2016. View Article : Google Scholar : PubMed/NCBI
|
|
19
|
Kemik O, Kemik AS, Sümer A, Dulger AC,
Adas M, Begenik H, Hasirci I, Yilmaz O, Purisa S, Kisli E, et al:
Levels of matrix metalloproteinase-1 and tissue inhibitors of
metalloproteinase-1 in gastric cancer. World J Gastroenterol.
17:2109–2112. 2011. View Article : Google Scholar : PubMed/NCBI
|
|
20
|
Xu Q, Wang Z, Chen X, Duan W, Lei J, Zong
L, Li X, Sheng L, Ma J, Han L, et al: Stromal-derived
factor-1α/CXCL12-CXCR4 chemotactic pathway promotes perineural
invasion in pancreatic cancer. Oncotarget. 6:4717–4732. 2015.
View Article : Google Scholar : PubMed/NCBI
|
|
21
|
Zhang S, Qi L, Li M, Zhang D, Xu S, Wang N
and Sun B: Chemokine CXCL12 and its receptor CXCR4 expression are
associated with perineural invasion of prostate cancer. J Exp Clin
Cancer Res. 27:622008. View Article : Google Scholar : PubMed/NCBI
|
|
22
|
Shen Z, Li T, Chen D, Jia S, Yang X, Liang
L, Chai J, Cheng X, Yang X and Sun M: The CCL5/CCR5 axis
contributes to the perineural invasion of human salivary adenoid
cystic carcinoma. Oncol Rep. 31:800–806. 2014. View Article : Google Scholar : PubMed/NCBI
|
|
23
|
Teicher BA and Fricker SP: CXCL12
(SDF-1)/CXCR4 pathway in cancer. Clin Cancer Res. 16:2927–2931.
2010. View Article : Google Scholar : PubMed/NCBI
|
|
24
|
Müller A, Homey B, Soto H, Ge N, Catron D,
Buchanan ME, McClanahan T, Murphy E, Yuan W, Wagner SN, et al:
Involvement of chemokine receptors in breast cancer metastasis.
Nature. 410:50–56. 2001. View
Article : Google Scholar : PubMed/NCBI
|
|
25
|
Aldinucci D and Colombatti A: The
inflammatory chemokine CCL5 and cancer progression. Mediators
Inflamm. 2014:2923762014. View Article : Google Scholar : PubMed/NCBI
|
|
26
|
Bolin LM, Murray R, Lukacs NW, Strieter
RM, Kunkel SL, Schall TJ and Bacon KB: Primary sensory neurons
migrate in response to the chemokine RANTES. J Neuroimmunol.
81:49–57. 1998. View Article : Google Scholar : PubMed/NCBI
|
|
27
|
Woodbury ME and Ikezu T: Fibroblast growth
factor-2 signaling in neurogenesis and neurodegeneration. J
Neuroimmune Pharmacol. 9:92–101. 2014. View Article : Google Scholar : PubMed/NCBI
|
|
28
|
Kuwahara K, Sasaki T, Kuwada Y, Murakami
M, Yamasaki S and Chayama K: Expressions of angiogenic factors in
pancreatic ductal carcinoma: A correlative study with
clinicopathologic parameters and patient survival. Pancreas.
26:344–349. 2003. View Article : Google Scholar : PubMed/NCBI
|
|
29
|
Ohta T, Yamamoto M, Numata M, Iseki S,
Tsukioka Y, Miyashita T, Kayahara M, Nagakawa T, Miyazaki I,
Nishikawa K and Yoshitake Y: Expression of basic fibroblast growth
factor and its receptor in human pancreatic carcinomas. Br J
Cancer. 72:824–831. 1995. View Article : Google Scholar : PubMed/NCBI
|