Introduction
Currently, lung cancer is the most prevalent
malignancy worldwide, with an estimated 1.76 million deaths in 2018
(1). Non-small cell lung cancer
(NSCLC) accounts for 85% of primary lung cancer cases (2). The majority of patients with lung
cancer are at an advanced stage when diagnosed, and the 5-year
survival rate is <18% (3).
NSCLC is a highly complex and heterogeneous disease
(4). Currently, molecular testing,
often by next-generation sequencing, is routinely used at the time
of diagnosis to guide treatment decisions for patients with NSCLC
(1). Several genes mutations have
been identified in patients with NSCLC, such as KRAS
(25-35%), EGFR (10%), ALK (3-7%), ROS1 (1-2%)
(5). Inhibition of these mutations
through targeted small molecule drugs or antibody-based strategies
has emerged as an effective approach to NSCLC therapy (6–8).
However, a number of patients with NSCLC lack an identifiable
driver oncogene, thus targeted therapies are not effective for
these patients (2). The 5-year
survival rate for these patients remain low (3). Thus, only mutation features cannot
completely characterize the cancer genome or precisely pinpoint the
cancer-driving mechanism. The Cancer Genome Atlas (TCGA) project
proposed the concept of multi-platform integrative molecular
subtyping in 2012 (9), which
provides a paradigm for the discovery of novel cancer subtypes by
integrating different omics data. Utilizing iCluster algorithm
(10), TCGA Research Network divided
patients into different subtypes by integrating different omics
data. Each subtype is called iCluster, for example iCluster 1,
iCluster 2. By comparing the omics data in different iClusters,
researchers can identify the distinctive omics features of each
iCluster. In hepatocellular carcinoma, TCGA Research Network
identified three iClusters for 196 patients (11). iCluster 2 and iCluster 3 exhibited a
high frequency of CDKN2A silencing by DNA hypermethylation
and high frequency of mutations of TERT, CTNNB1 and
HNF1A. iCluster 1 had a low frequency of CDKN2A
silencing and low frequency of mutations of CTNNB1 and
TERT. Furthermore, in lung adenocarcinoma (LUAD), TCGA
Research Network also identified six iClusters for 230 patients
(12). iClusters 1–3 frequently
harbor TP53 mutations. Copy number associated gene
expression changes on 3q in iCluster 1, 8q in iCluster 2, 15q in
iCluster 3, 6q in iCluster 4 and 19p in iCluster 5 were observed.
In summary, the different omics features of cancer can be
characterized more accurately based on the multi-omics subtypes.
Understanding the different characteristics of each multi-omics
subtype may promote effective individualized therapy for lung
cancer; however, further integrated analyses should be performed to
investigate the associations between different omics features and
to elucidate the association of these features with clinical
features.
With respect to epigenetic alterations, DNA
methylation serves an important role in cancer development. Yue
et al (13) revealed that
PTEN methylation inhibits cell apoptosis in NSCLC, while
Shahabi et al (14) found
that FOXA2 was hypermethylated in LUAD leading to low
LINC00261 expression levels, and Yun et al (15) reported that overexpression of
IL-32γ decreases lung tumor growth by inducing TIMP-3
hypomethylation. Hypermethylation of the CACNA2D2 promoter
can promote proliferation and invasion of NSCLC (16). However, few studies have conducted
methylation analysis of NSCLC from the perspective of a survival
risk model and these models have been constructed based on mRNA
profiles (17–19).
The present study primarily focused on the
association between mRNA, methylation, miRNA, copy number
variation, mutations and patient survival. The performance of the
methylation survival risk model in multi-platform integrative
molecular subtypes was investigated, while the aim was to also
identify copy number variations and mutations, which were
associated with survival risk.
Materials and methods
Multi-platform integrative clustering
using iCluster
To reveal the subtypes formed by integrating various
molecular platforms of NSCLC, the present study utilized the
iCluster package (version 2.1.0) in R (10,20).
Clinical data and the data of four molecular platforms, including
DNA copy number, DNA methylation, mRNA expression and microRNA
(miRNA) expression levels of NSCLC, were downloaded from TCGA using
TCGAbiolinks (21). Four molecular
platforms were provided as input to iCluster: DNA copy number, DNA
methylation, mRNA expression and miRNA expression. Copy number
variation data were derived from circular binary segmentation data
from the Affymetrix SNP 6.0 platform (Thermo Fisher Scientific,
Inc.), and further decreased to a set of non-redundant regions as
previously described (22). Probes
in the methylation data (Illumina Infinium 450k arrays) with
>20% missing values were removed and methylation probes
corresponding to SNP and sex chromosomes were also removed. In
addition, for mRNA and miRNA data, probes with >25% missing
values were removed. mRNA and miRNA expression matrices were log2
transformed and normalized. The probes were then merged with the
corresponding gene and their average value was selected as the gene
expression level. The remaining probes of methylation data, mRNA
and miRNA expression levels with no available values were uploaded
into the CancerSubtypes (version 1.6.0) R package (23). The mRNA and miRNA set were filtered
to remove genes with a standard deviation <1.0 across all tumor
samples. DNA CN, DNA methylation, mRNA and miRNA expression levels
were subsequently uploaded into the iCluster algorithm. The optimal
combination of clusters was determined using the Bayesian
Information Criterion (BIC) method (24). The iCluster algorithm was used, with
a different number of clusters (from 1 to 6). According to the
iCluster algorithm manual, the heatmap of the outcome was compared
with the different number of clusters to determine the optimal
number of clusters based on the features pattern. Survival analysis
of all subtypes was performed using the survminer (version 0.4.3) R
package (25) and survMisc (version
0.5.5) R package (26). For patients
in different iClusters, the Renyi test was used to compare
patients' survival at the beginning, the middle and the end of the
study, respectively. P-values between each two iClusters were
calculated using the Renyi test. Patients without iCluster
information were excluded from the survival analysis.
Constructing the DNA methylation
prognosis prediction model
Patients with NSCLC, without definite survival time
or survival status were screened out. The summary of patients'
clinical data that were selected are presented in Table SI. The methylation data was used
which removed probes with >20% missing value or corresponding to
SNP and sex chromosomes. The NA values were imputed using
CancerSubtypes (version 1.6.0) R package (23), based on k-Nearest Neighbor algorithm.
The preprocess Core R package (version 1.44.0) (27) was used to remove batch effects for
the methylation dataset. Univariate Cox proportional risk
regression model with the threshold of P<0.001 was used to
screen the methylation level of each CpG site associated with the
overall survival (OS) of patients using the survival R package
(version 2.44-1.1) (28). Least
absolute shrinkage and selection operator (LASSO) regression was
used to identity the most powerful methylation prognostic markers
from survival related CpG sites using the glmnet R package (version
2.0-16) (29). Coefficients of
certain CpG sites were reduced to zero by forcing the sum of the
absolute value of the regression coefficients to be less than a
fixed value. The following steps were repeated ten thousand times:
(1) Patients were randomly divided
into training set and test set. The training set was composed of
70% patients and the test set was composed of 30% patients.
(2) The methylation prognostic model
was assessed on the on the training set and the performance of the
model was assessed on the test set. (3) Utilizing Hmisc package (version 4.4-0)
(30) in R, the concordance index (c
index) of prognostic model in the training set and the test set
were calculated, respectively. Subsequently, the performance score
of the model was calculated using the following formula:
performance score= c index(training set)2 + c index(test
set)2.
The risk score for each patient was calculated by
combining the relative methylation levels of the prognostic CpG
sites and LASSO coefficients. Multivariate Cox regression analysis
was performed for the survival data to determine if the methylation
score was independently predictive of survival. The performance of
methylation score was assessed using time-dependent survival ROC
curve. The present study identified the optimal cut-off risk score
based on the optimum sensitivity and specificity of the 5-year
survival ROC curve. Patients were divided into high- and low-risk
groups according to the optimal cut-off score (−11.707).
Kaplan-Meier survival analysis was used to estimate the survival of
patients between the high- and low-risk groups. The correlation
between all CpG sites and risk score, all mRNA and risk scores and
all miRNA and risk scores were calculated using the cor.test
function in R. P-values were generated using a two-sided t-test.
According to the correlations and P-values, the most closely
associated CpG sites, mRNA and miRNA were selected. Bonferroni's
method was used to adjust the significance level of multiple
comparisons, using the following formula:
α′=αk(k−1)/2
Survival risk associations between
somatic variation and germline variation
All loss of heterozygosity (LOH), aneuploidy,
homologous repair deficiency (HRD) scores, copy number burden and
mutation burden used in the present study were derived from the
Genomic Data Commons website (https://gdc.cancer.gov/node/998) (31). Copy number burden scores are for
fractions of segments altered and the number of segments. These two
scores represent the fraction of bases deviating from baseline
ploidy (defined as >0.1 or <-0.1 in log2 relative copy number
space), and the total number of segments in the copy number profile
of each sample. LOH means the irreversible loss of one of the
parental alleles. The number of segments with LOH represents the
number of segments with LOH events. The fraction of segments with
LOH refers to the fraction of bases with LOH events. HRD score
measures defects in homologous recombination. HRD score is the sum
of three separate metrics of genomic scarring: Large (>15 Mb)
non-arm-level regions with LOH, large-scale state transitions
(breaks between adjacent segments of >10 Mb) and subtelomeric
regions with allelic imbalance. Aneuploidy scores were calculated
as the sum total of altered (amplified or deleted) arms (32).
Copy number variation data, which uses GISTIC 2.0
(http://software.broadinstitute.org/cancer/cga/gistic)
to define amplification and deletion, were downloaded from
cBioPortal (33,34). To identify the effects of genes copy
number amplification and deletion on survival risk, the significant
differences between the risk scores of patients with and without
copy number variation were assessed. For each gene, the risk scores
between patients with gene amplification and patients without gene
alterations were compared. Subsequently, the risk scores between
patients with gene deletions and patients without gene alterations
were compared. Welch's two-sample t-tests were used to assess
significant differences. The present study then analyzed whether
the mRNA level of these survival-associated genes can be influenced
by copy number amplification or deletion using Kruskal-Wallis tests
in ggpubr package (version 0.2) (35) in R. All P-values to compare
differences between two groups were calculated using Wilcoxon rank
sum tests. Bonferroni's method was used to adjust the significance
level of multiple comparisons, using the following formula:
α′=αk(k−1)/2
Mutation data were downloaded from cBioPortal. A
two-sample t-test was used to screen genes in which mutations were
significantly associated with risk score. Genes with P<0.01 were
selected. The co-occurrence and exclusivity of risk-related genes
were compared using maftools R package (version 1.6.15) (36). P-values were calculated using
pair-wise Fisher's exact tests. P-values were adjusted using the
FDR method.
Results
Multi-platform integrative molecular
subtyping
A total of 423 patients had complete omics data,
thus iCluster algorithm analysis was performed on these patients.
An overview of the analytical strategy is shown in Fig. S1. Joint multivariate regression of
the four platforms (DNA copy number, DNA methylation, mRNA
expression and miRNA expression) calculated the BIC from two
iClusters to six iClusters (Fig.
S2). The BIC of the different number of iClusters did not show
an inflection point, suggesting that the data generated were noisy.
According to the of iCluster algorithm manual, the heatmaps from
two iClusters to six iClusters were compared (Fig. S3). We considered that six iClusters
can reflect the features of different omics data most detailed.
Thus, we selected six the optimal number of iClusters.
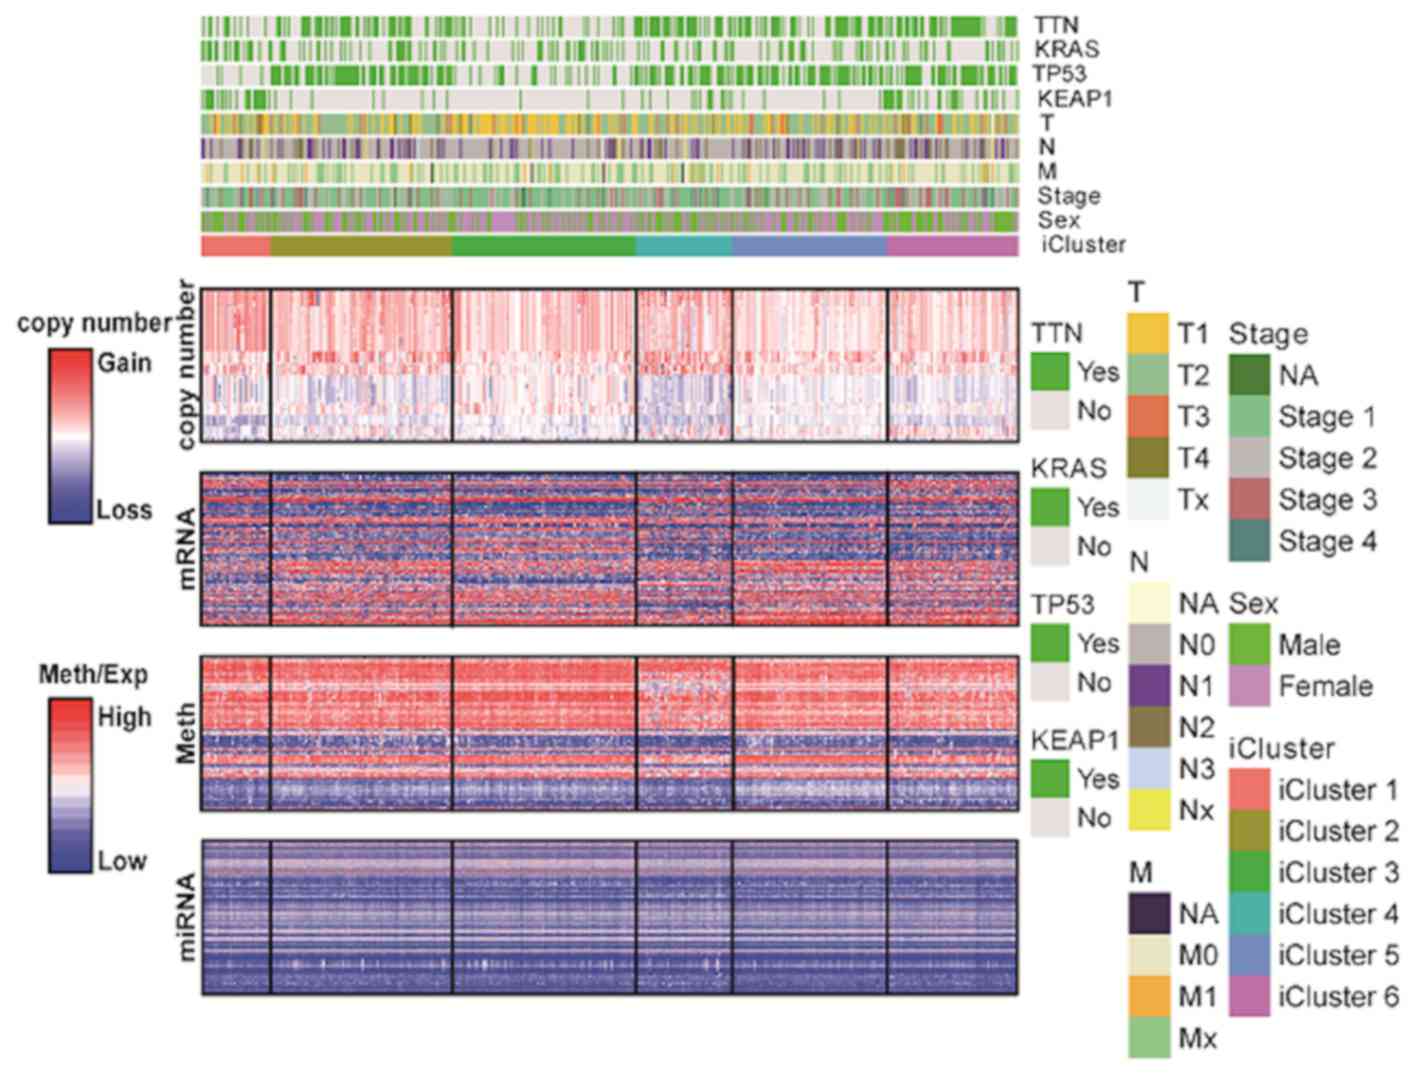
Subsequently, the features of omics data in different iClusters
were analyzed (Fig. 1 and Table SII). Among the six iClusters, copy
number variation is the most variable omics data while miRNA
converse. iCluster 1 (n=36), was characterized by a high frequency
of KEAP1 mutations (63.89%) and low frequency of TP53
mutations (11.11%). iCluster 2 (n=94), iCluster 4 (n=50), iCluster
5 (n=80) and iCluster 6 (n=68) were characterized by high
frequencies of TP53 mutations (75.53, 64, 68.75 and 66.18%,
respectively). iCluster 6 (n=68) was characterized by clinical
associations with higher AJCC stage (37). iCluster 1 and iCluster 6 had more
male patients, while iCluster 3 and iCluster 5 were reversed.
TTN mutations were observed in iCluster 2, iCluster 4,
iCluster 5 and iCluster 6 (56.9, 70, 57.5 and 67.1% respectively).
The distribution of TTN mutations was similar to
TP53. iCluster 3 was associated with 30.5% KRAS
mutations, which was the most frequent mutation in this molecular
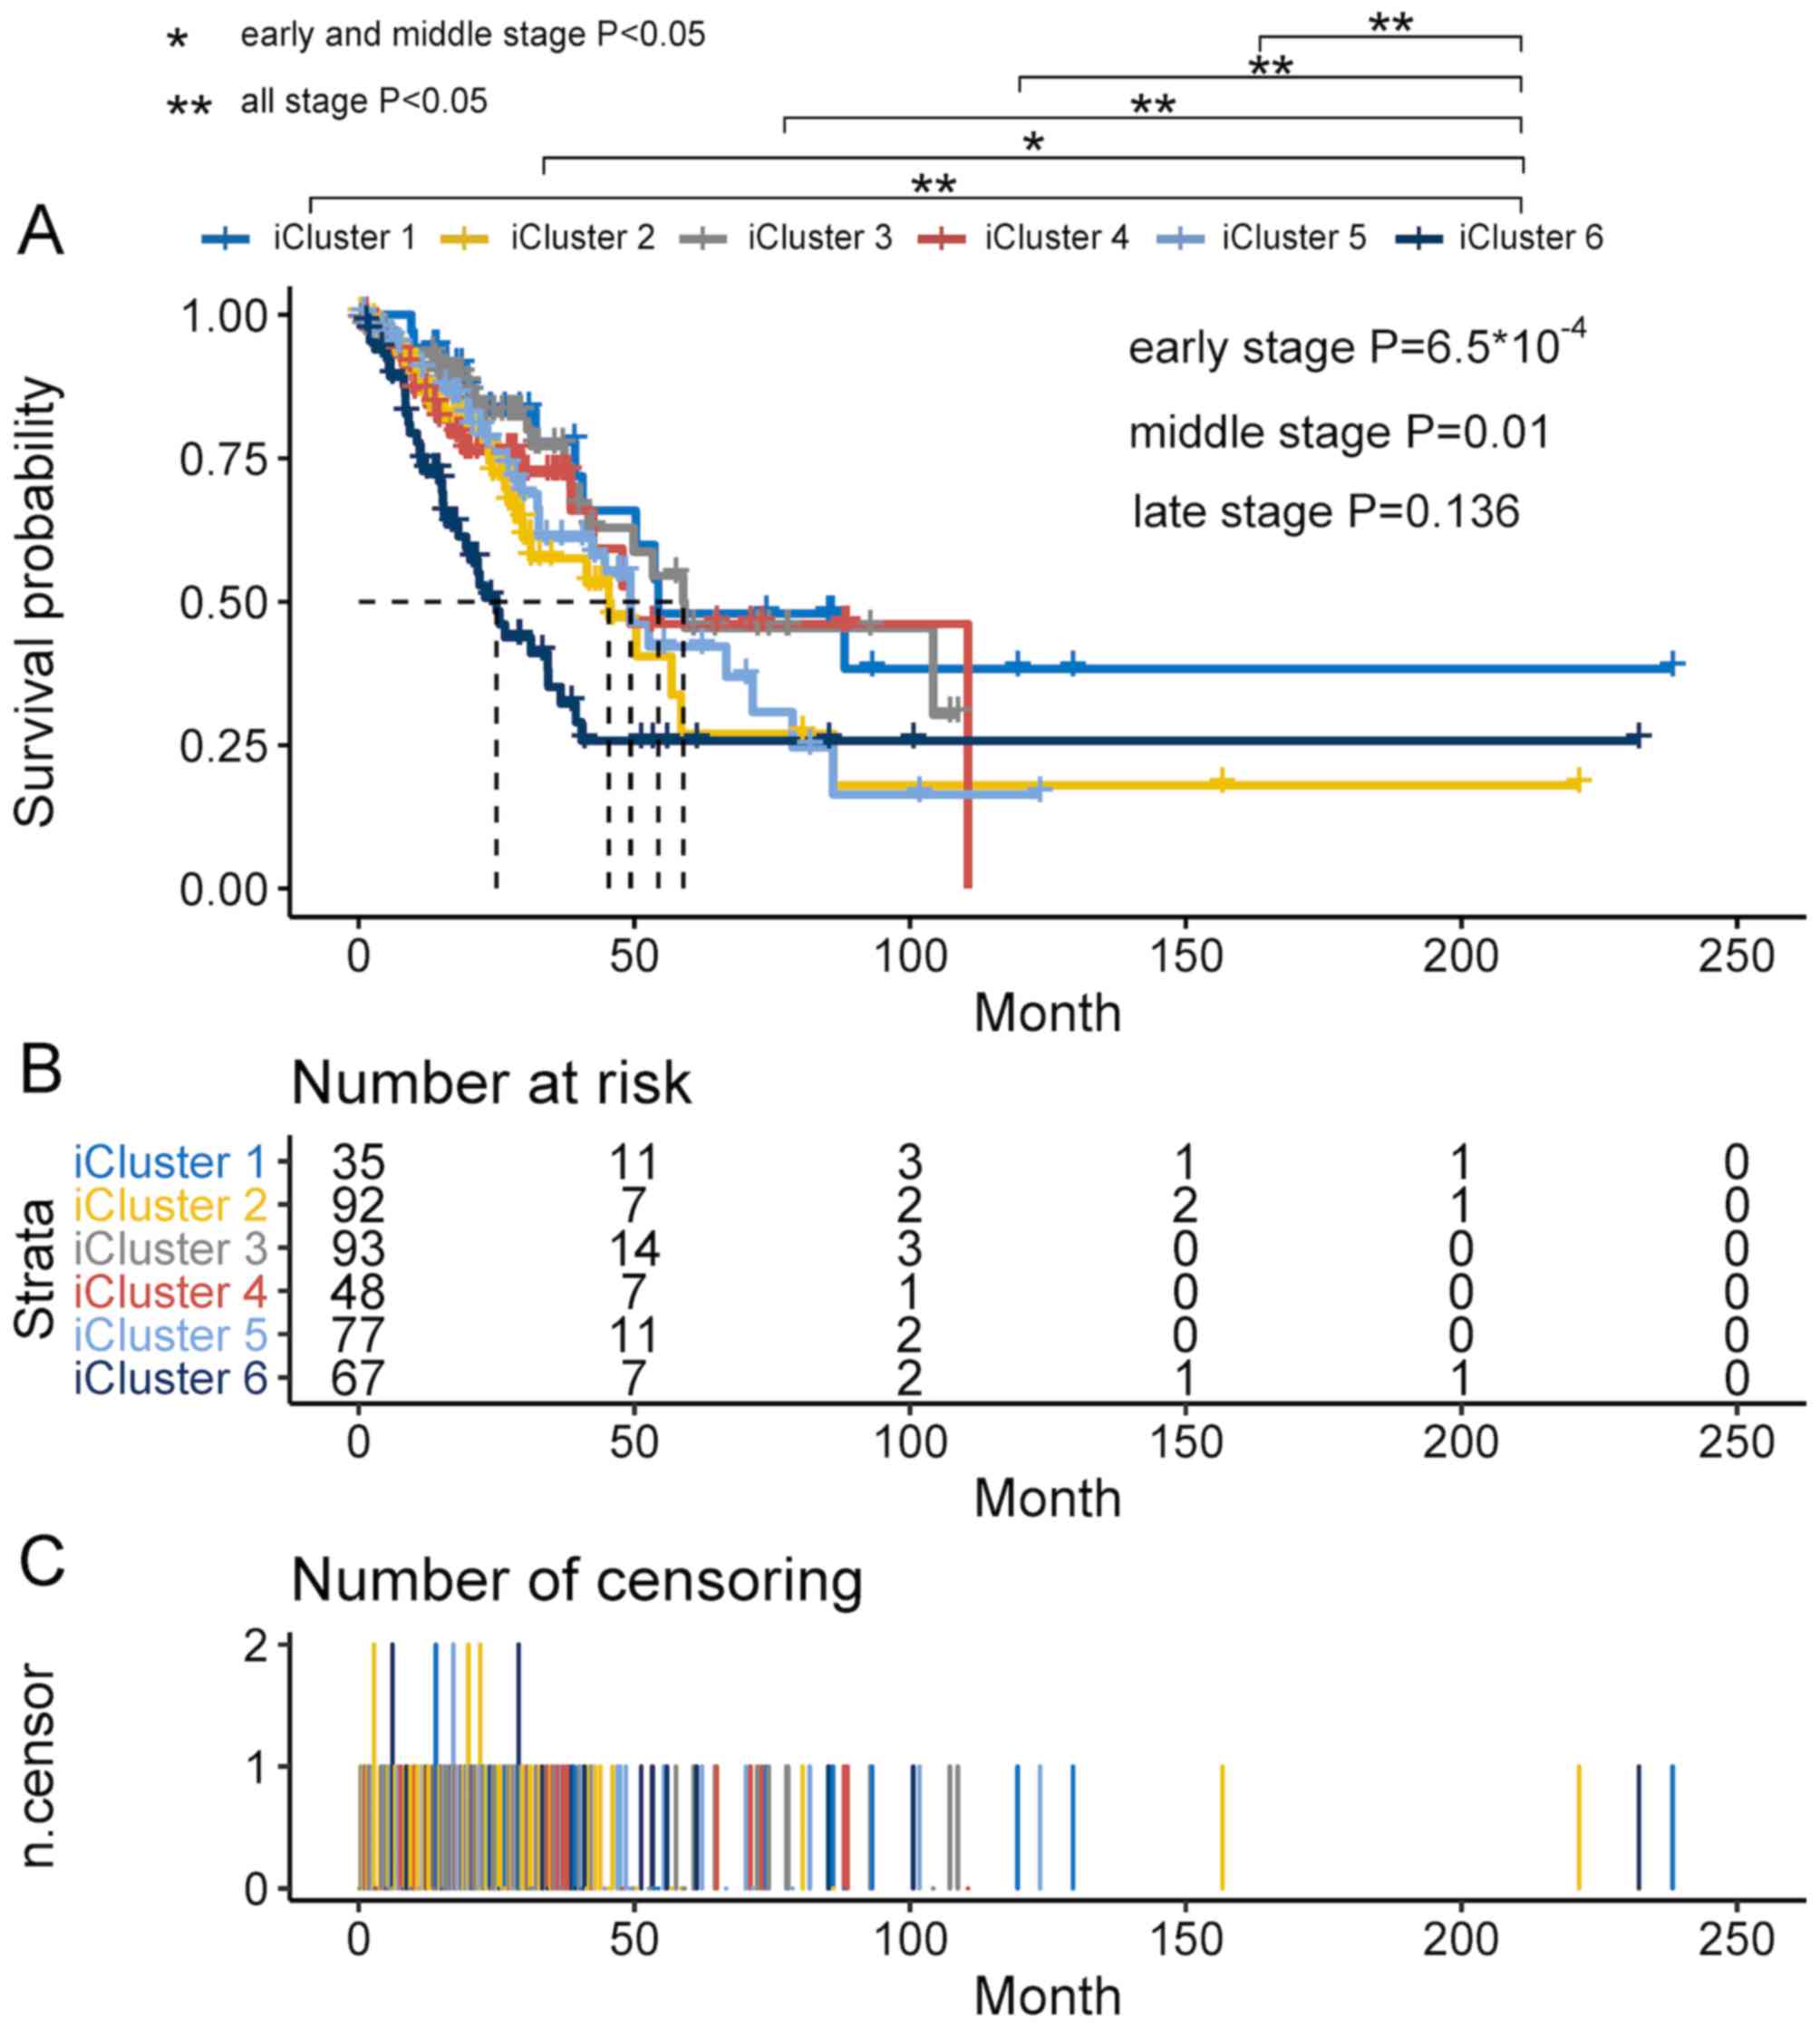
subtype. Multi-platform integrative molecular subtyping was
associated with OS (Fig. 2). A total
of 27 patients without iCluster information were excluded from the
survival analysis. The Renyi test demonstrated significant
differences for the beginning (P<0.001) and middle of the study
(P<0.05) but not for the later stage (P>0.1). Survival
analysis was implemented for a total of 412 patients. Patients had
better prognosis in iCluster 1, iCluster 3, iCluster 4 and iCluster
5 compared with iCluster 6. For different iClusters, the number of
patients at risk in different times are presented in Fig. 2B. For different iClusters, the number
of patient deaths in different times are presented in Fig. 2C.
Constructing the DNA methylation
prognosis prediction model
A total of 439 patients with survival times and
survival status were selected to construct the DNA methylation
prognosis prediction model. First, the present study removed the
probes in the methylation data with >20% missing values. The
probes corresponding to SNP and sex chromosomes were also removed.
After the pre-processing steps, univariate Cox proportional risk
regression model analyses were performed with the threshold of
P<0.001 on the DNA methylation dataset. A total of 4,534 CpG
sites associated with OS were initially identified.
The relative regression coefficients of
survival-associated CpG sites were then calculated using a LASSO
analysis. Coefficients of certain CpG sites were reduced to zero by
forcing the sum of the absolute value of the regression
coefficients to be less than a fixed value. A total of 21 CpG sites
were selected as the most powerful prognostic marker (Table I). The detailed information of these
21 CpG sites are presented in Table
SIII.
 | Table I.Overall, 21 CpG sites were selected
as the most powerful prognostic markers using LASSO regression in
patients with non-small cell lung cancer. |
Table I.
Overall, 21 CpG sites were selected
as the most powerful prognostic markers using LASSO regression in
patients with non-small cell lung cancer.
|
|
| Univariate cox
regression analysis |
|
|---|
|
|
|
|
|
|---|
| CpG site | Position | HR | 95% CI | P-value | LASSO
coefficient |
|---|
|
cg01467592 | chr8:
144424051-144424331 | 0.02 | 0.01-0.08 |
<10−16 | −0.23727154 |
|
cg02967813 | chr2:
3635439-3635700 | 0.04 | 0.01-0.23 |
3×10⁻⁴ | −1.215714791 |
|
cg04391569 | chr10:
132781789-132782190 | 0.01 | 0-0.04 |
<10−16 | −1.105381717 |
|
cg05406101 | chr21:
29018943-29019437 | 0.14 | 0.05-0.37 |
1.2×10⁻⁴ | −0.527102271 |
|
cg06860998 | chr4:
4385866-4388192 | 0.03 | 0.01-0.21 |
3.3×10⁻⁴ | −1.509305485 |
|
cg06933711 | chr10:
30058670-30059719 | 0.03 | 0.01-0.11 |
<10−16 | −0.966075621 |
|
cg12193943 | chr12:
1796111-1797599 | 0.02 | 0-0.07 |
<10−16 | −0.305762883 |
|
cg13372811 | chr1:
110083906-110084862 | 6.43 | 2.2-18.77 |
6.7×10⁻⁴ | 0.524860897 |
|
cg19160958 | chr17:
37406724-37406967 | 0.04 | 0.01-0.15 |
<10−16 | −0.469969803 |
|
cg21749275 | chr4:
109559671-109560904 | 0.03 | 0-0.21 |
4×10⁻⁴ | −1.227936552 |
|
cg22697853 | chr1:
148264740-148265029 | 0.06 | 0.01-0.22 |
4×10⁻⁵ | −0.065212053 |
|
cg27018309 | chr16:
8868332-8869080 | 0.01 | 0-0.03 |
<10−16 | −1.016454431 |
|
cg27529004 | chr2:
236567668-236568620 | 0.02 | 0-0.1 |
1×10⁻⁵ | −0.319014839 |
|
cg00278107 | chr5:
1060924-1061607 | 0 | 0-0.01 |
1×10⁻⁵ | −0.283330883 |
|
cg03723506 | chr5:
38556120-38557461 | 0 | 0-0.01 |
8.9×10⁻⁴ | −1.663229849 |
|
cg04973915 | chr5:
172006000-172007078 | 0 | 0-0.01 |
<10−16 | −0.286595288 |
|
cg06720244 | chr13:
46052319-46052884 | 0 | 0-0.02 |
6.7×10⁻⁴ | −3.055164476 |
|
cg11302293 | chr4:
3772124-3772335 | 0 | 0-0.08 |
5.2×10⁻⁴ | −0.045241836 |
|
cg13354228 | chr18:
657401-658745 | 0 | 0-0 |
2×10⁻⁵ | −8.258933249 |
|
cg17510645 | chr1:
243254439-243255473 | 0 | 0-0 |
<10−16 | −0.017156936 |
|
cg20981791 | chr8:
23288015-23288493 | 0 | 0-0.08 |
4.4×10⁻⁴ | −1.539966176 |
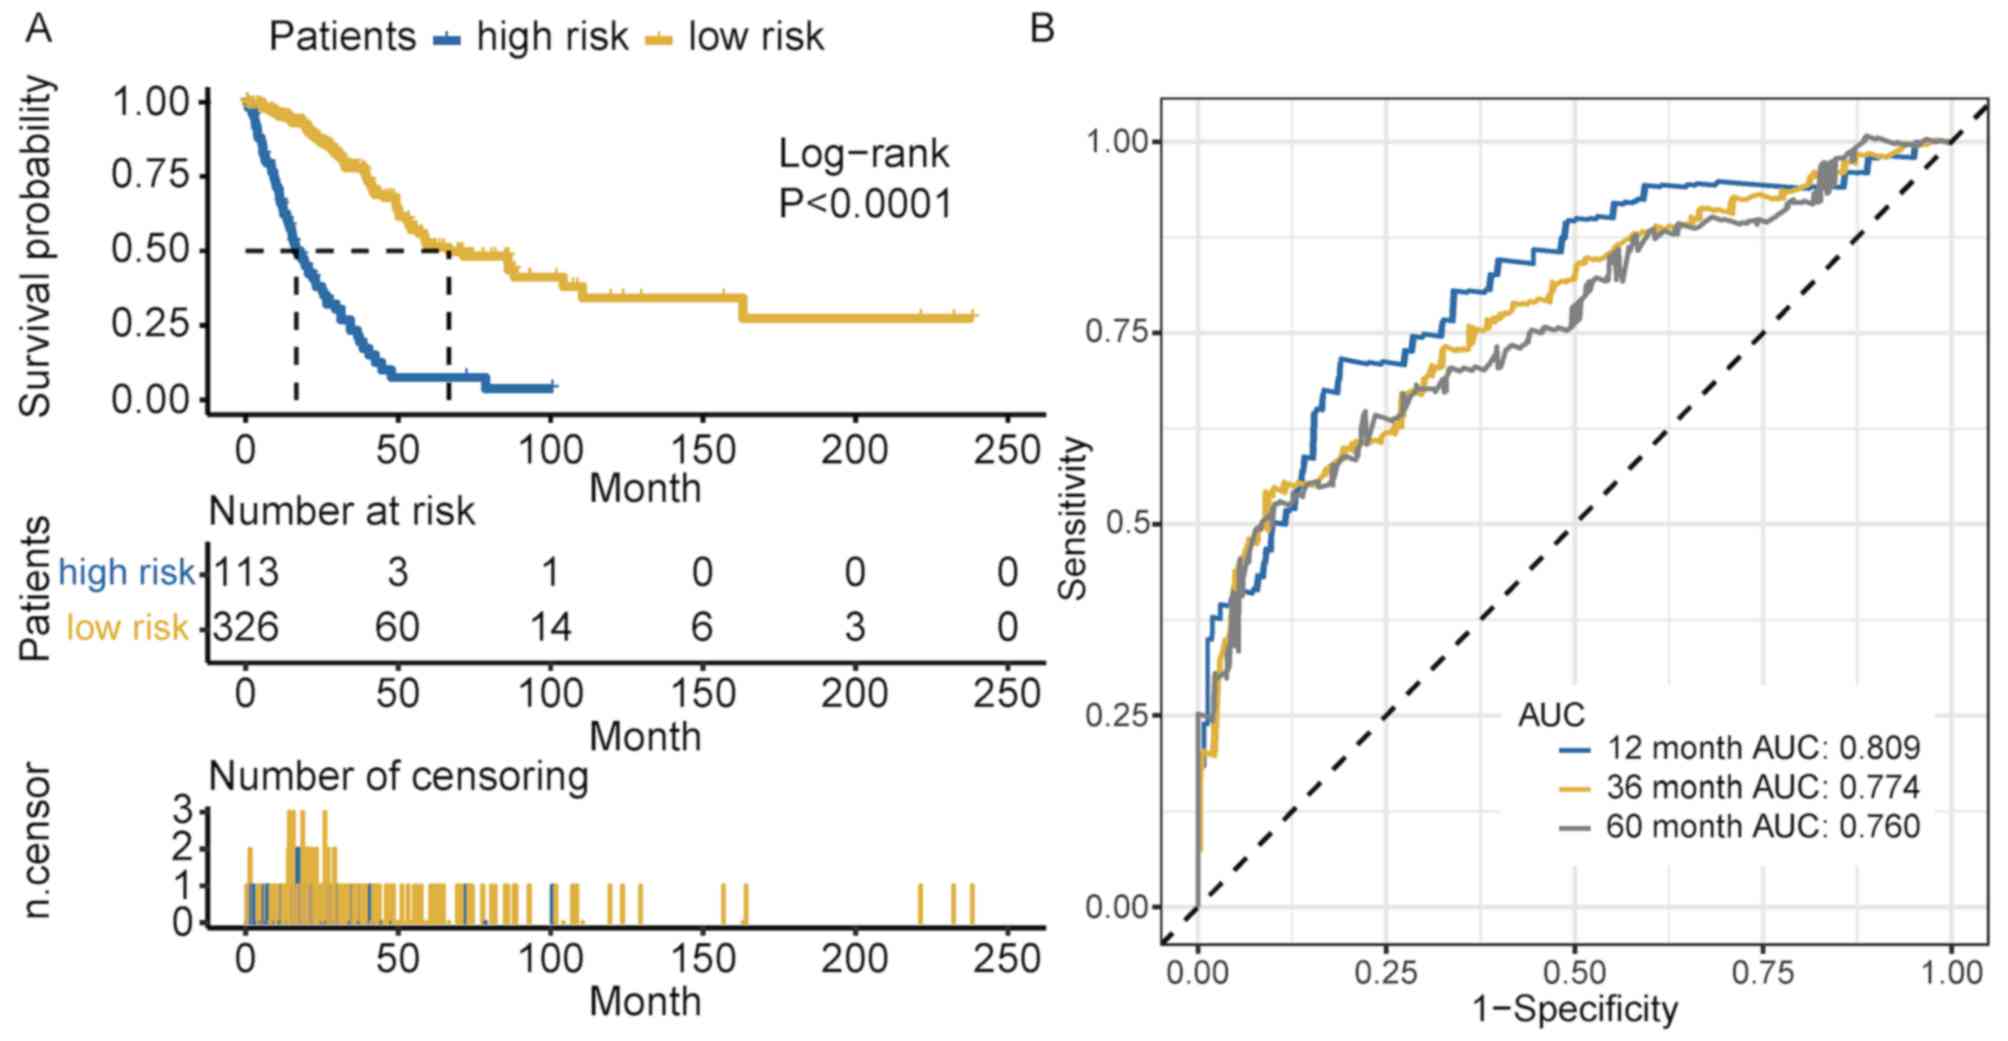
The risk score for each patient was calculated by
combining the methylation levels of the prognostic CpG sites with
the corresponding LASSO coefficients. The outcome of multivariate
Cox regression analysis for the survival data showed that the
methylation score independently predicted survival (Table SIV). Cross-validated time-dependent
ROC curves demonstrated that the 12 months AUC was 0.809 (Fig. 3B). Both AUC of 36 months and AUC of
60 months were more >0.7. These reflect that our model had good
ability of prognosis prediction in short term and long term.
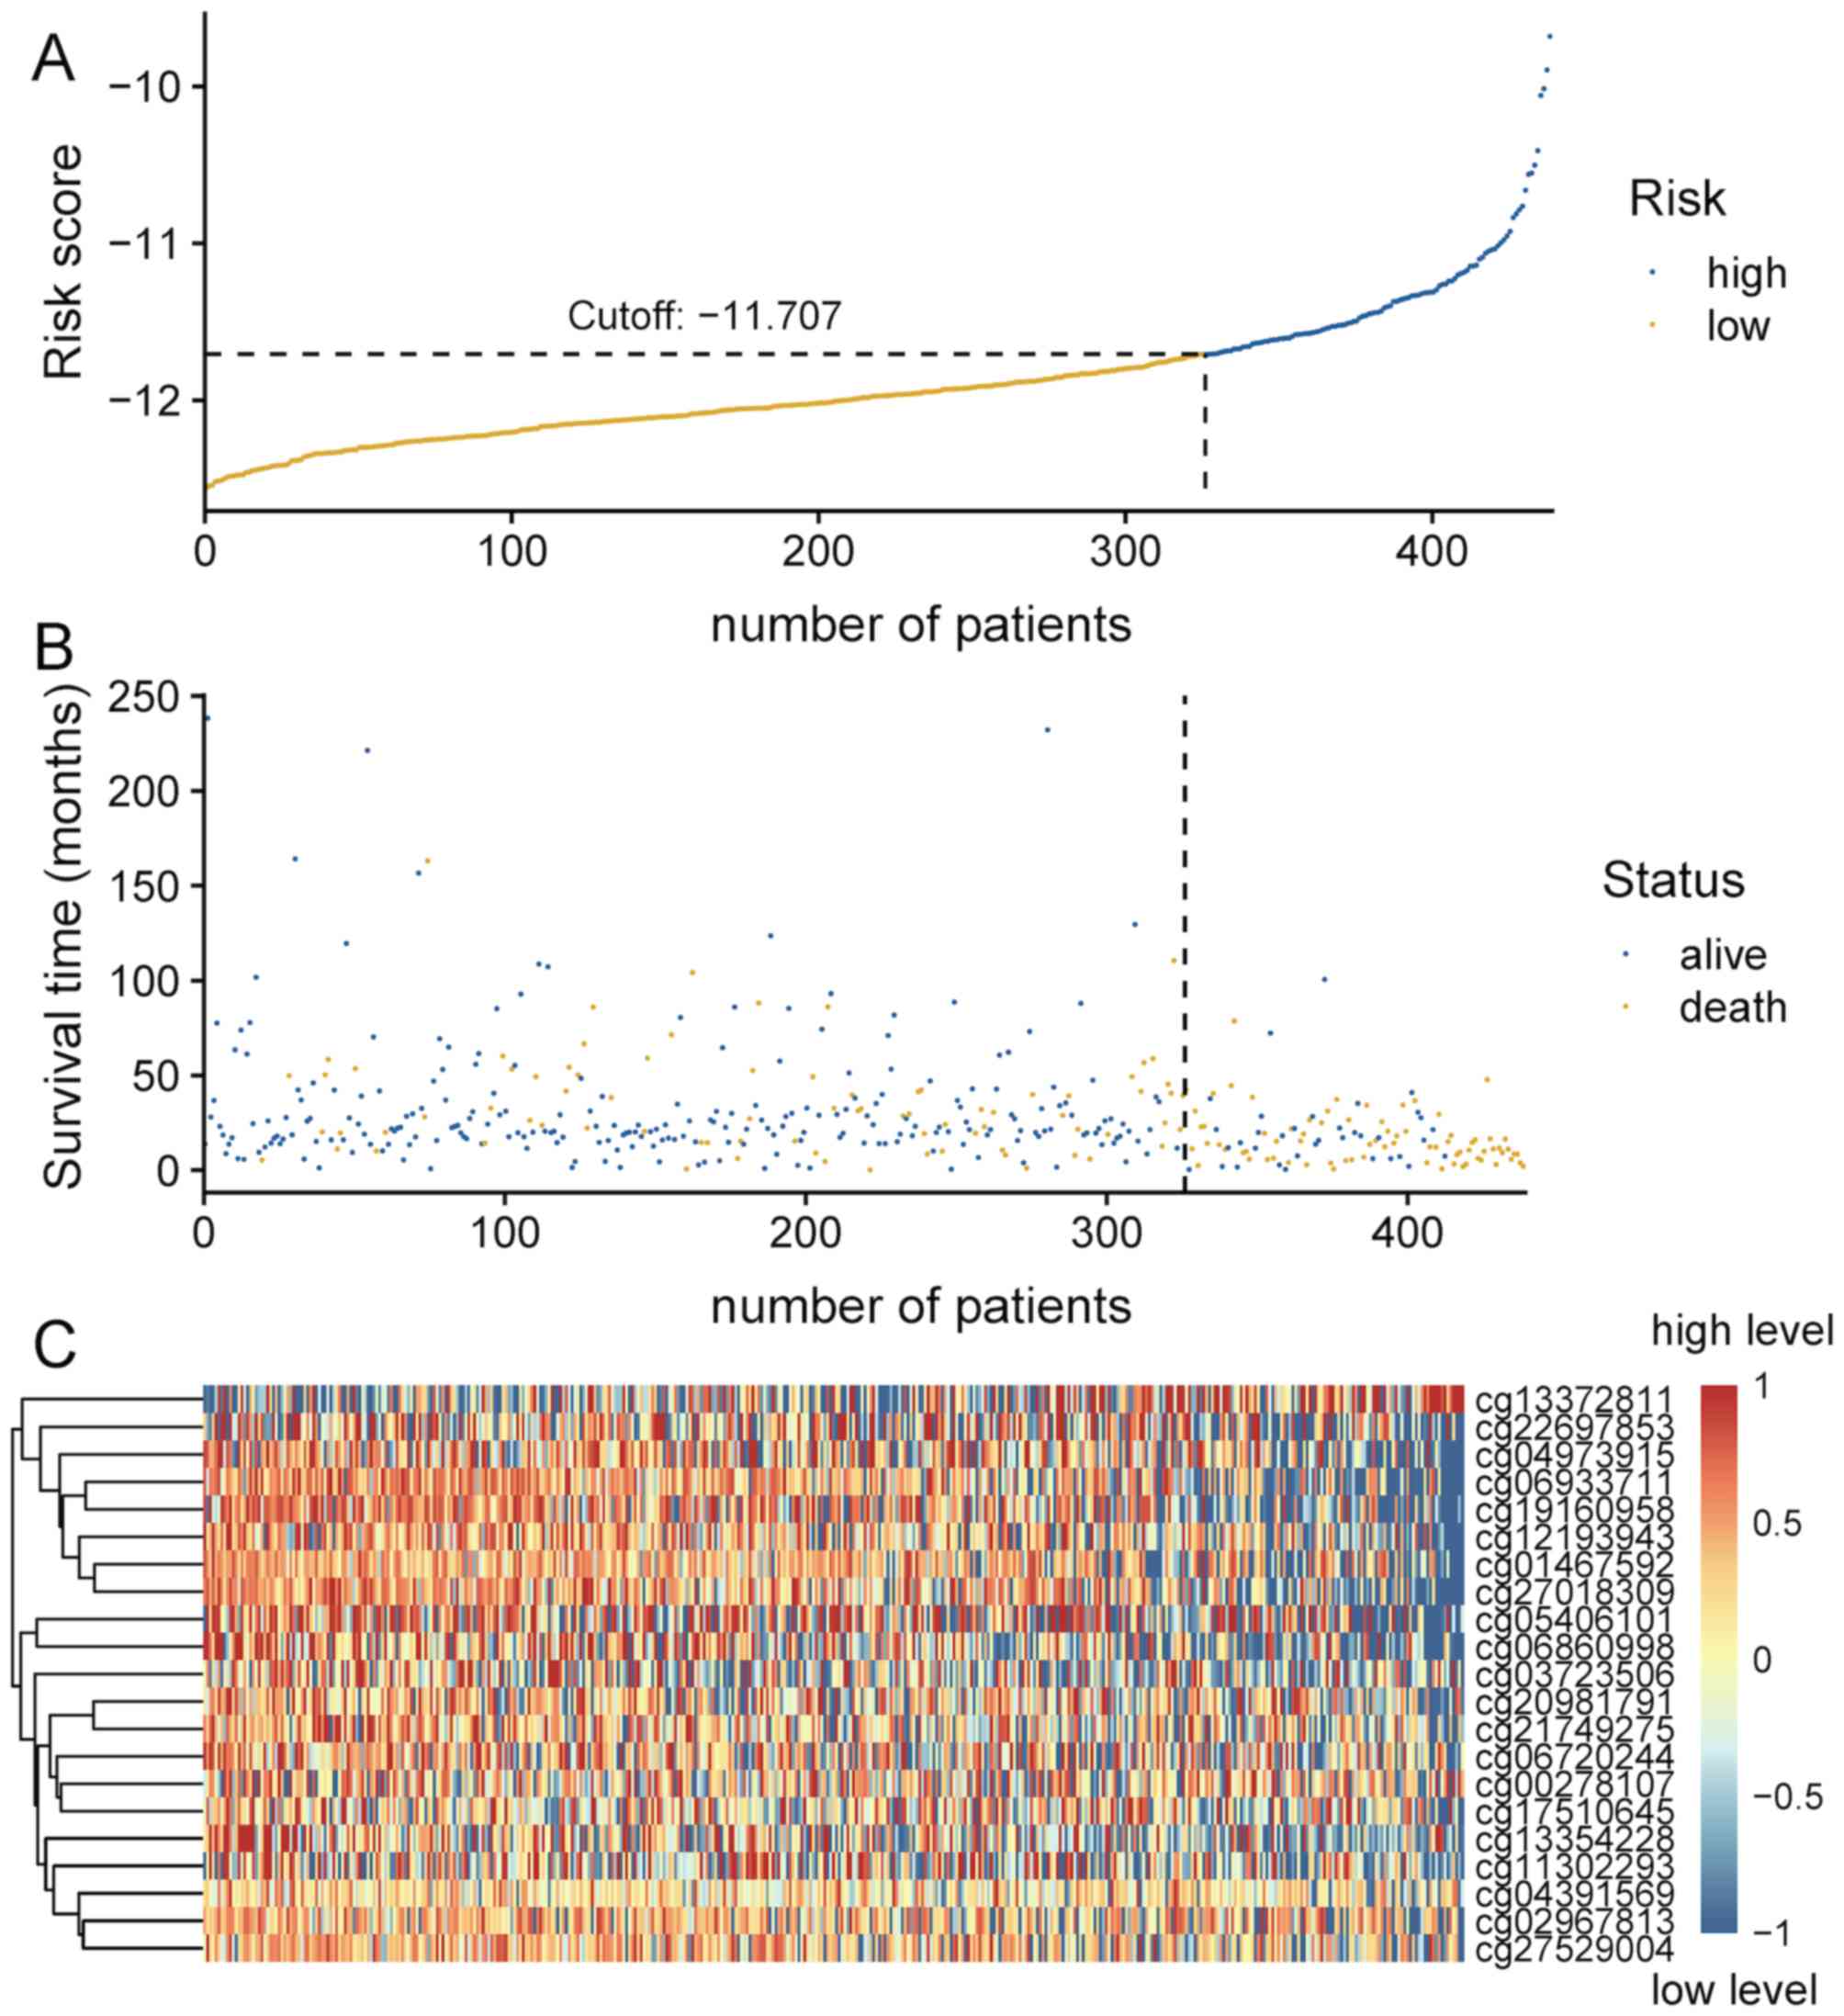
Patients were divided into high- and low-risk groups based on the
cut-off value, which was generated according to the optimum
sensitivity and specificity of the 5-year survival ROC curve.
Patients with a risk score ≥-11.707 were assigned to the high-risk
group, and the remaining patients into the low-risk group (Fig. 4A). The number of deaths in the
high-risk group was significantly greater compared with that in the
low-risk group (Fig. 4B). The
survival time of patients in the low-risk score group was
significantly longer compared with that of patients in the
high-risk group (P<0.001; Fig.
3A). As presented in Fig. 4C,
the majority of these 21 CpG sites in patients in the high-risk
group exhibited low methylation levels.
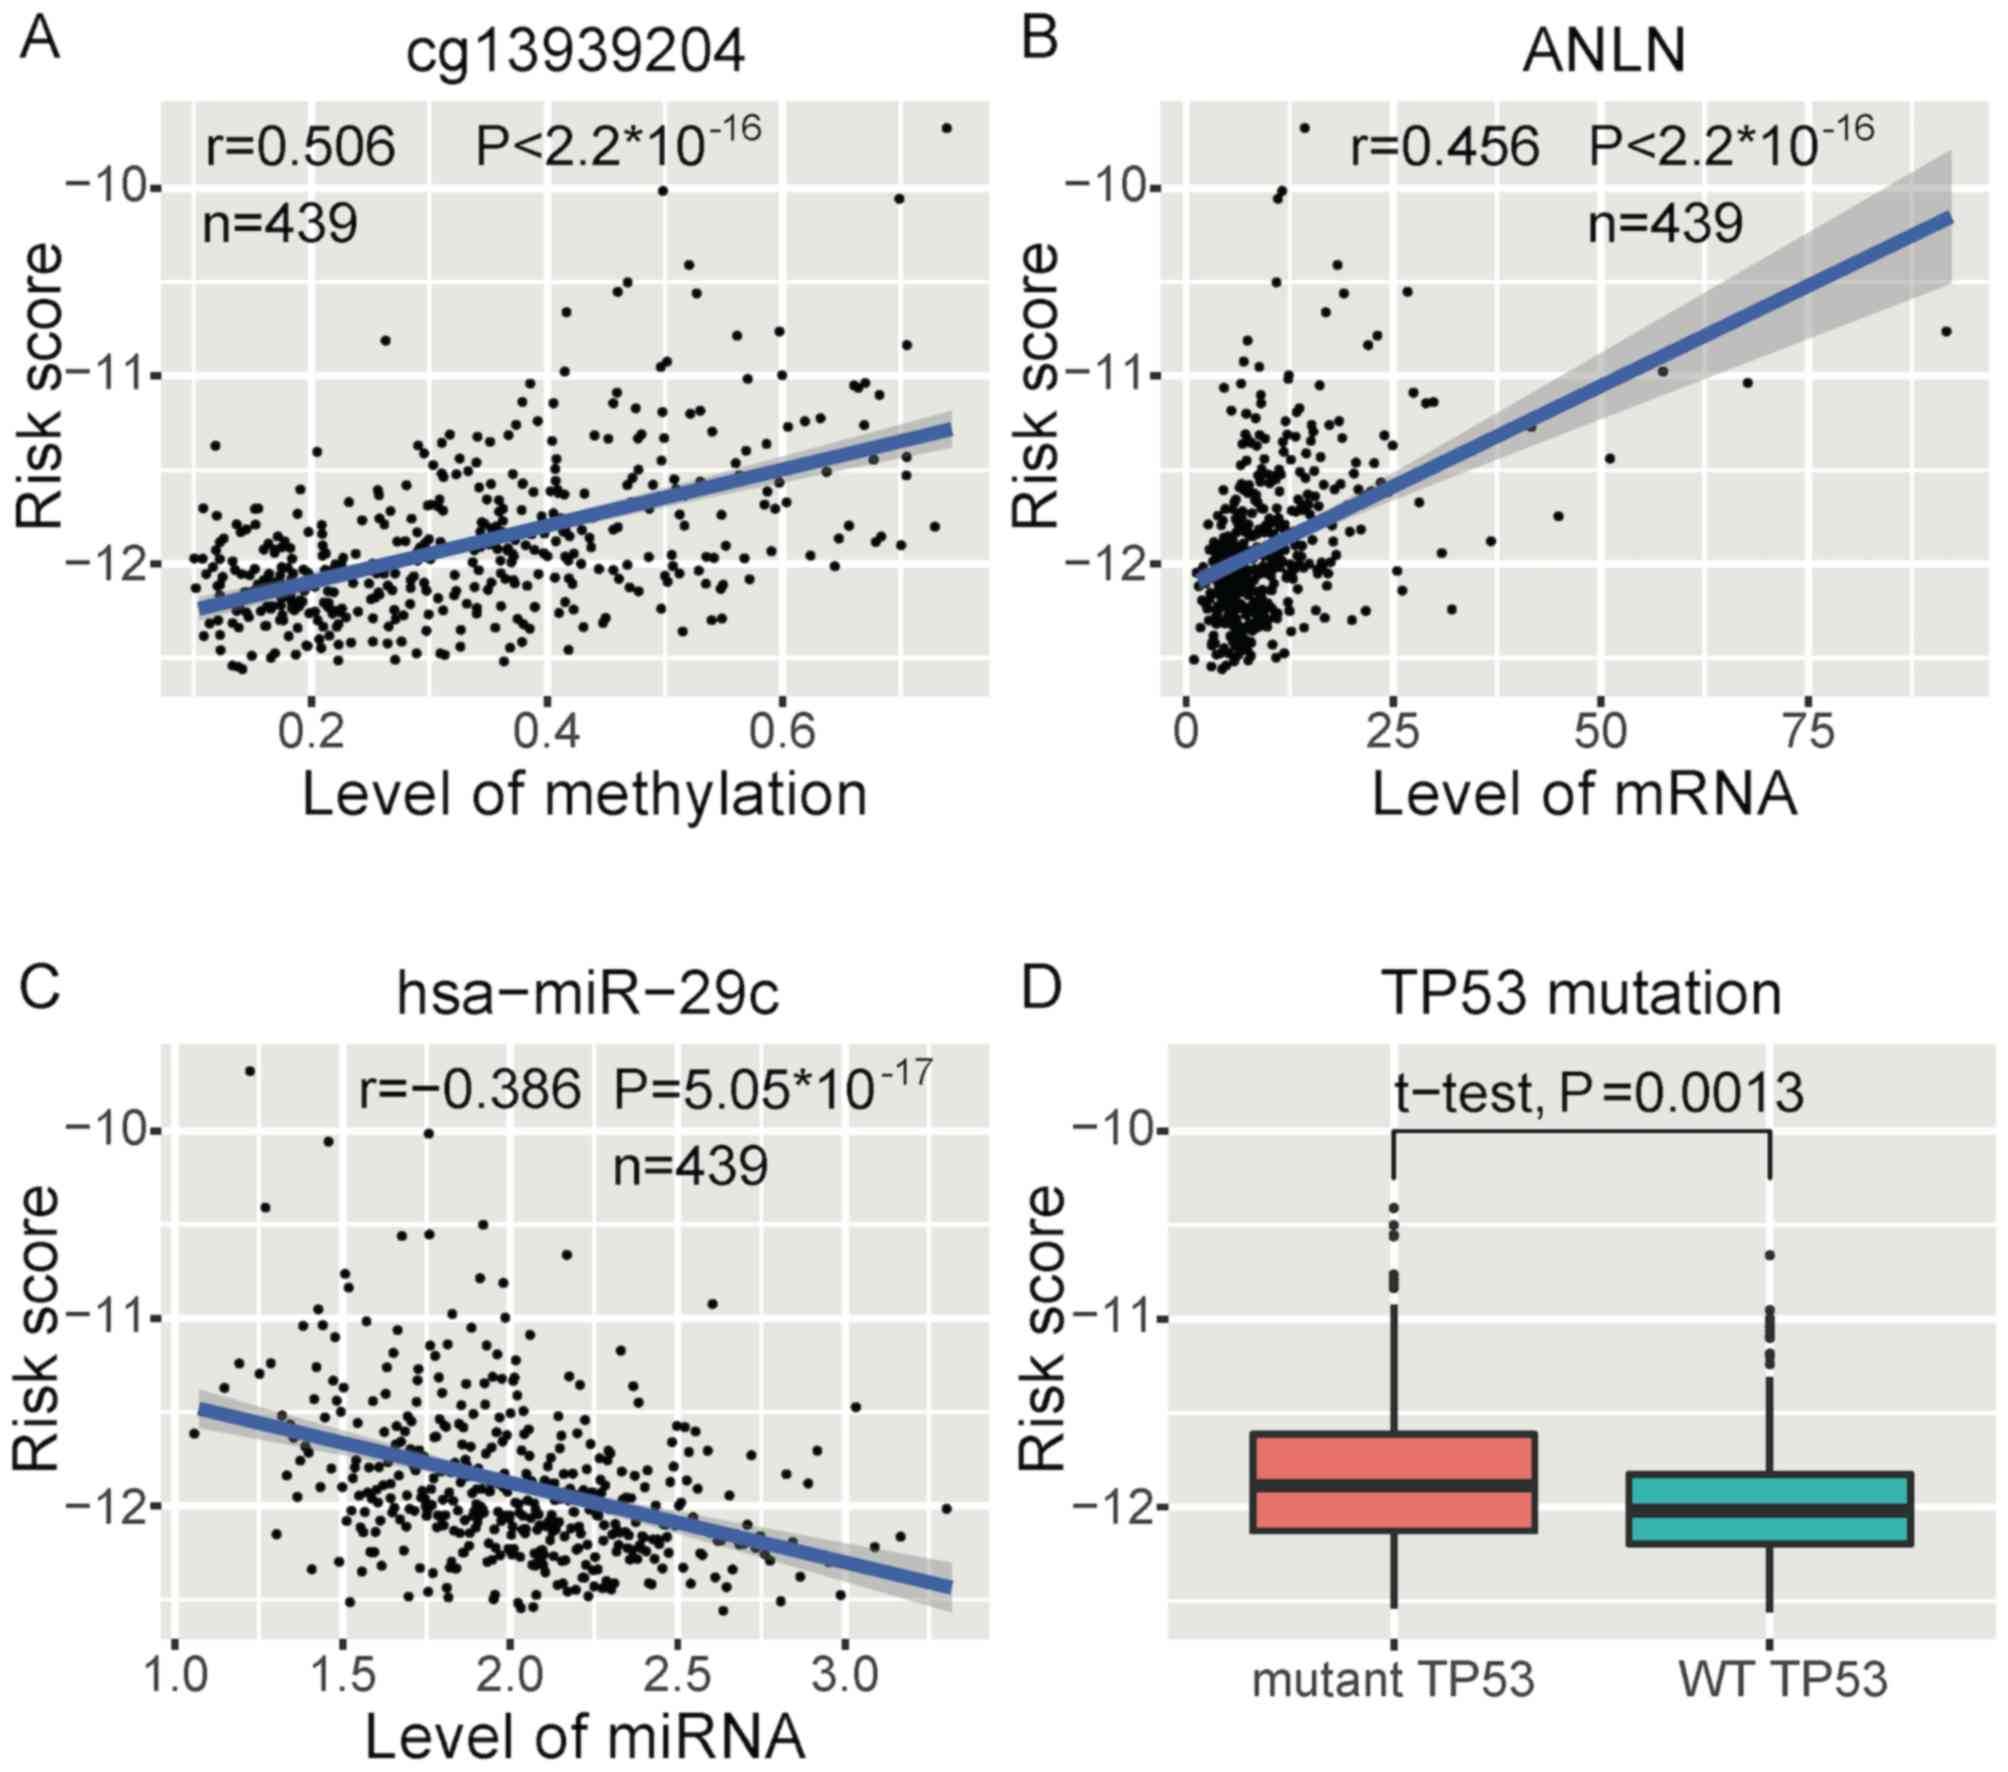
The correlations between all CpG sites and risk
score, all mRNAs and risk score, and all miRNAs and risk score were
calculated using the cor.test function in R. Next, we screened the
most related CpG sites, mRNA and miRNA based on correlation scores.
High-risk scores were most significantly associated with higher
methylation levels of ST6GALNAC6 (cg13939204)
(Fig. 5A), as well as higher
ANLN expression (Fig. 5B) and
lower hsa-miR-29c expression levels (Fig. 5C) in methylation, mRNA and miRNA,
respectively. In addition, a similar significant association
between risk score and stage was observed (Fig. S4A). Patients in stage 2 and stage 3
had higher risk scores compared with that in patients in stage 1.
The significance level was adjusted using Bonferroni's correction
(α′=8.3×10⁻³). The P-values of comparisons between each
two group are displayed in Fig.
S4A. The mutation of TP53 was significantly associated
with high risk (Fig. 5D). Risk
scores in different molecular subtypes were significantly different
(Fig. S4B). Risk scores in iCluster
4, iCluster 5 and iCluster 6 were significantly higher than
iCluster 3. Risk scores in iCluster 6 were significantly higher
than iCluster 1, iCluster 2, iCluster 3 and iCluster 5. The
significance level was adjusted using Bonferroni's correction
(α′=3.3×10⁻³). The P-values of comparisons between each
two group are displayed in Fig.
S4.
Survival risk associations between
somatic variation and germline variation
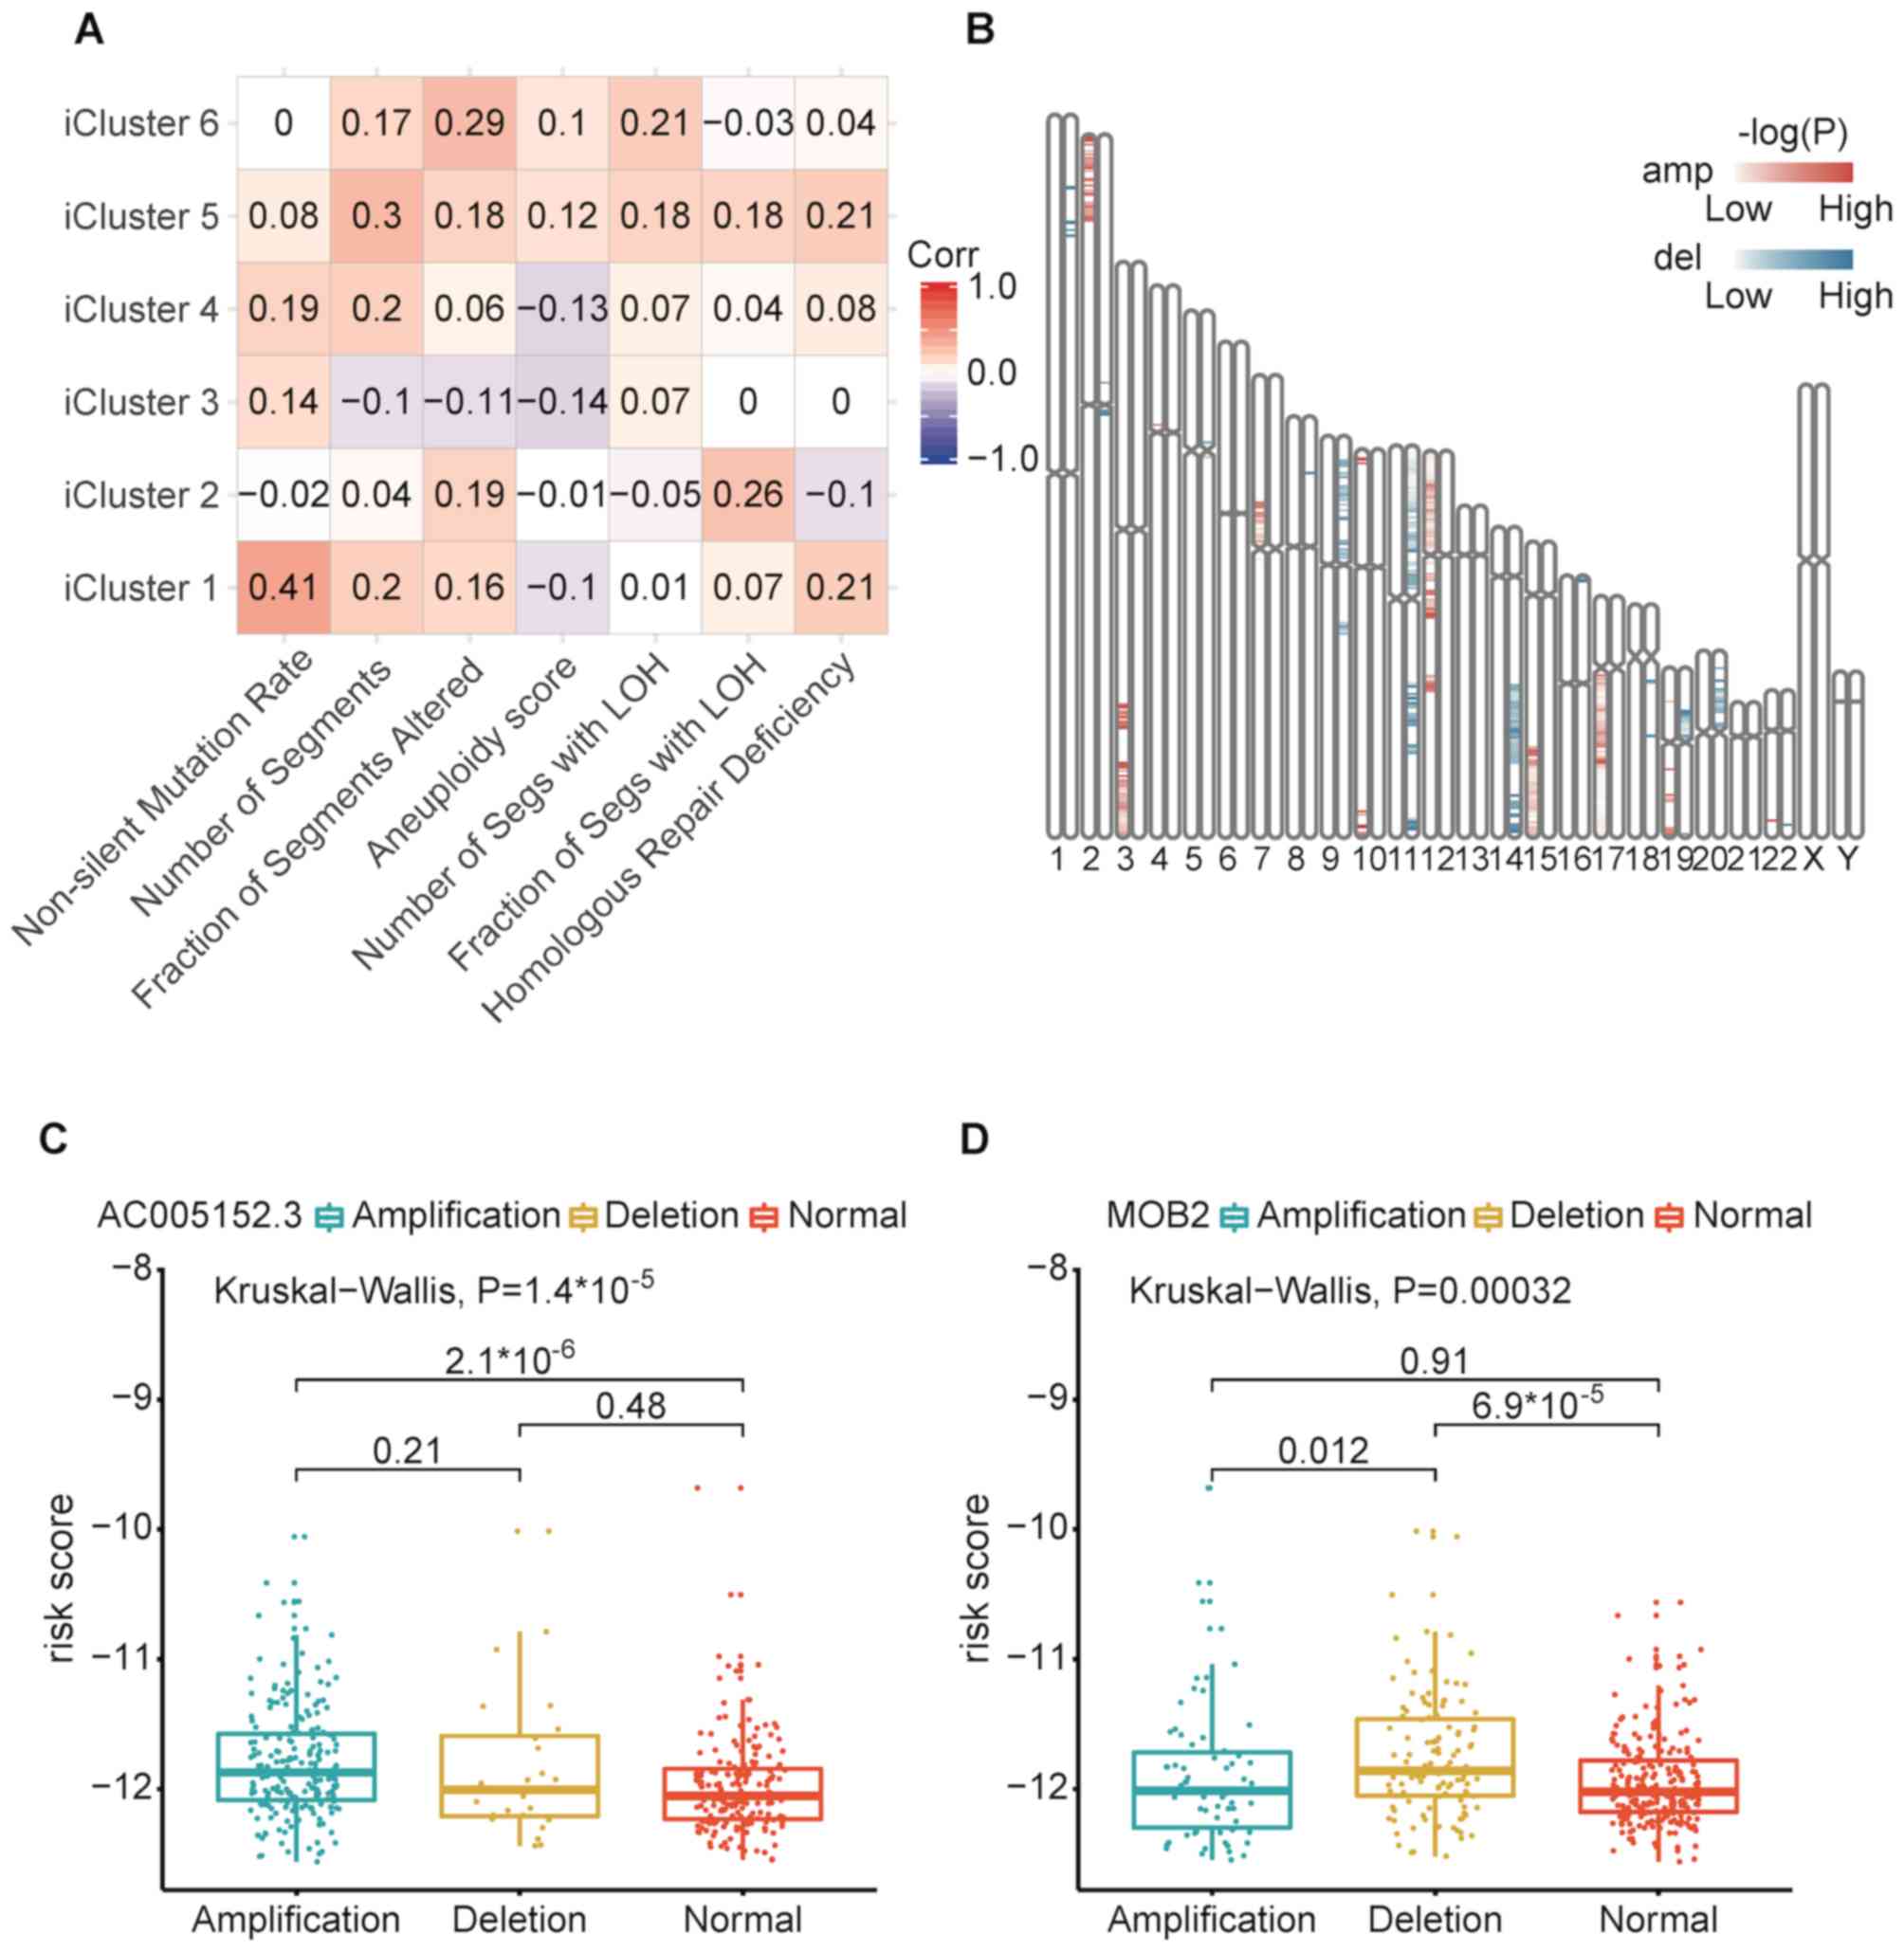
Risk scores were positively correlated with
non-silent mutation rate with the strongest correlation in iCluster
1. Risk scores were associated with copy number variation burden
(number of segments and fraction of genome alterations) in iCluster
5 and iCluster 6 (Fig. 6A). Risk
scores were also positively correlated with the number of segments
with LOH in iCluster 5 and iCluster 6. In iCluster 2 and iCluster
6, risk scores were positively correlated with the fraction of
segments with LOH. Risk scores were positively correlated with
homologous repair deficiency scores in iClsuter 1 and iCluster 5.
These measures (number of segments, fraction of segments altered,
number of segments with LOH and homologous repair deficiency)
represented smaller focal copy number events and DNA damage. These
results suggested that the alteration of focal copy number may
increase patients' survival risk scores in iCluster 5 and iCluster
6. High number or fraction of LOH events may lead high risk scores
for patients in iCluster 2, iCluster 5 and iCluster 6. Furthermore,
high homologous repair deficiency scores may lead high risk scores
for patients in iCluster 1 and iCluster 5.
Welch's two-sample t-tests were used to investigate
the association between copy number variation and risk scores
(P<0.01; Fig. 6B). The red bars
represent amplified regions and the blue bars indicate deletions.
The darker bar color represents smaller P-values of the
corresponding regions. The present study identified 35 copy number
amplification regions (2p23, 2p24, 2p25, 3q25, 3q26, 3q27, 3q28,
3q29, 4p12, 7p11, 7p12, 7p13, 7q11, 10p15, 10q26, 12p11, 12p12,
12p13, 12q12, 12q13, 12q14, 12q21, 15q23, 15q24, 15q25, 15q26,
17q11, 17q12, 17q21, 17q22, 17q23, 17q24, 17q25, 19q13 and 22q13)
and 40 copy number deletion regions (1p34, 1p36, 2p11, 2q11, 5p12,
5q11, 8p21, 9p11, 9p12, 9p13, 9p21, 9p22, 9p23, 9p24, 9q12, 9q13,
9q21, 11p11, 11p12, 11p13, 11p14, 11p15, 11q14, 11q21, 11q22,
11q24, 11q25, 14q22, 14q23, 14q24, 14q31, 14q32, 16p13, 18q11,
18q12, 19p12, 19p13, 19q13, 20p12 and 22q13) which were
significantly associated with higher risk scores.. 17q24.3
amplification (including AC005152.3, LINC01152, RP11-84E24.2,
SOX9-AS1, AC007461.2, SOX9, KCNJ16 and SLC39A11) and
chromosome 11p15.5 deletion (MOB2, AP2A2, MUC6, MUC2, MUC5B,
MIR6744, TOLLIP and TOLLIP-AS1) were most significantly
associated with higher risk scores. Amplification of
AC005152.3 was most correlated with higher risk scores in
17q24.3 (Fig. 6C and D). Deletion of
MOB2 was most correlated with higher risk scores in 11p15.5.
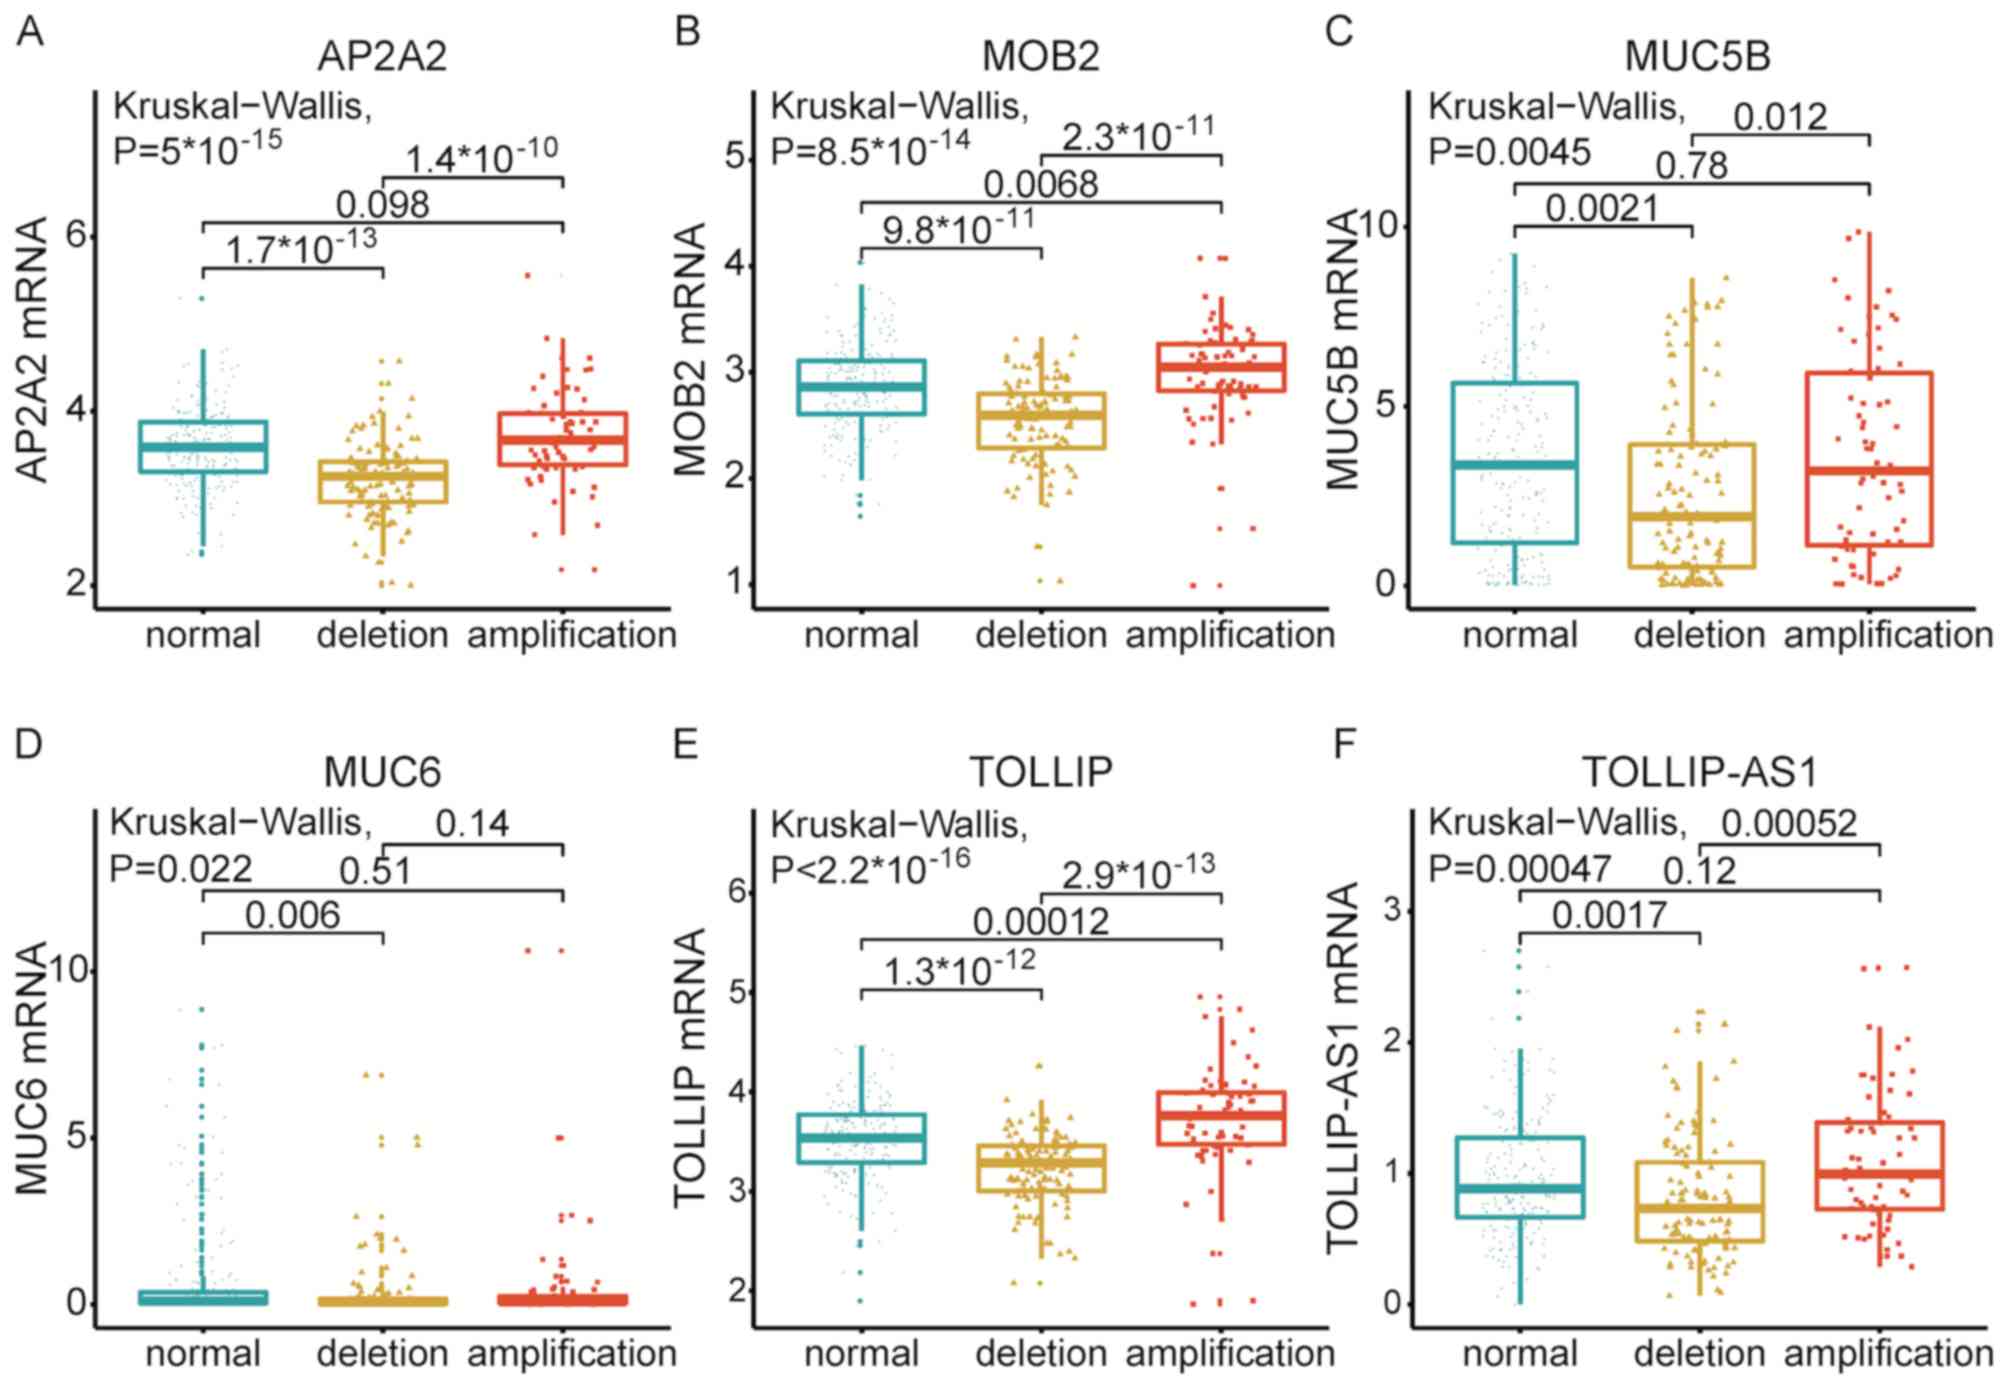
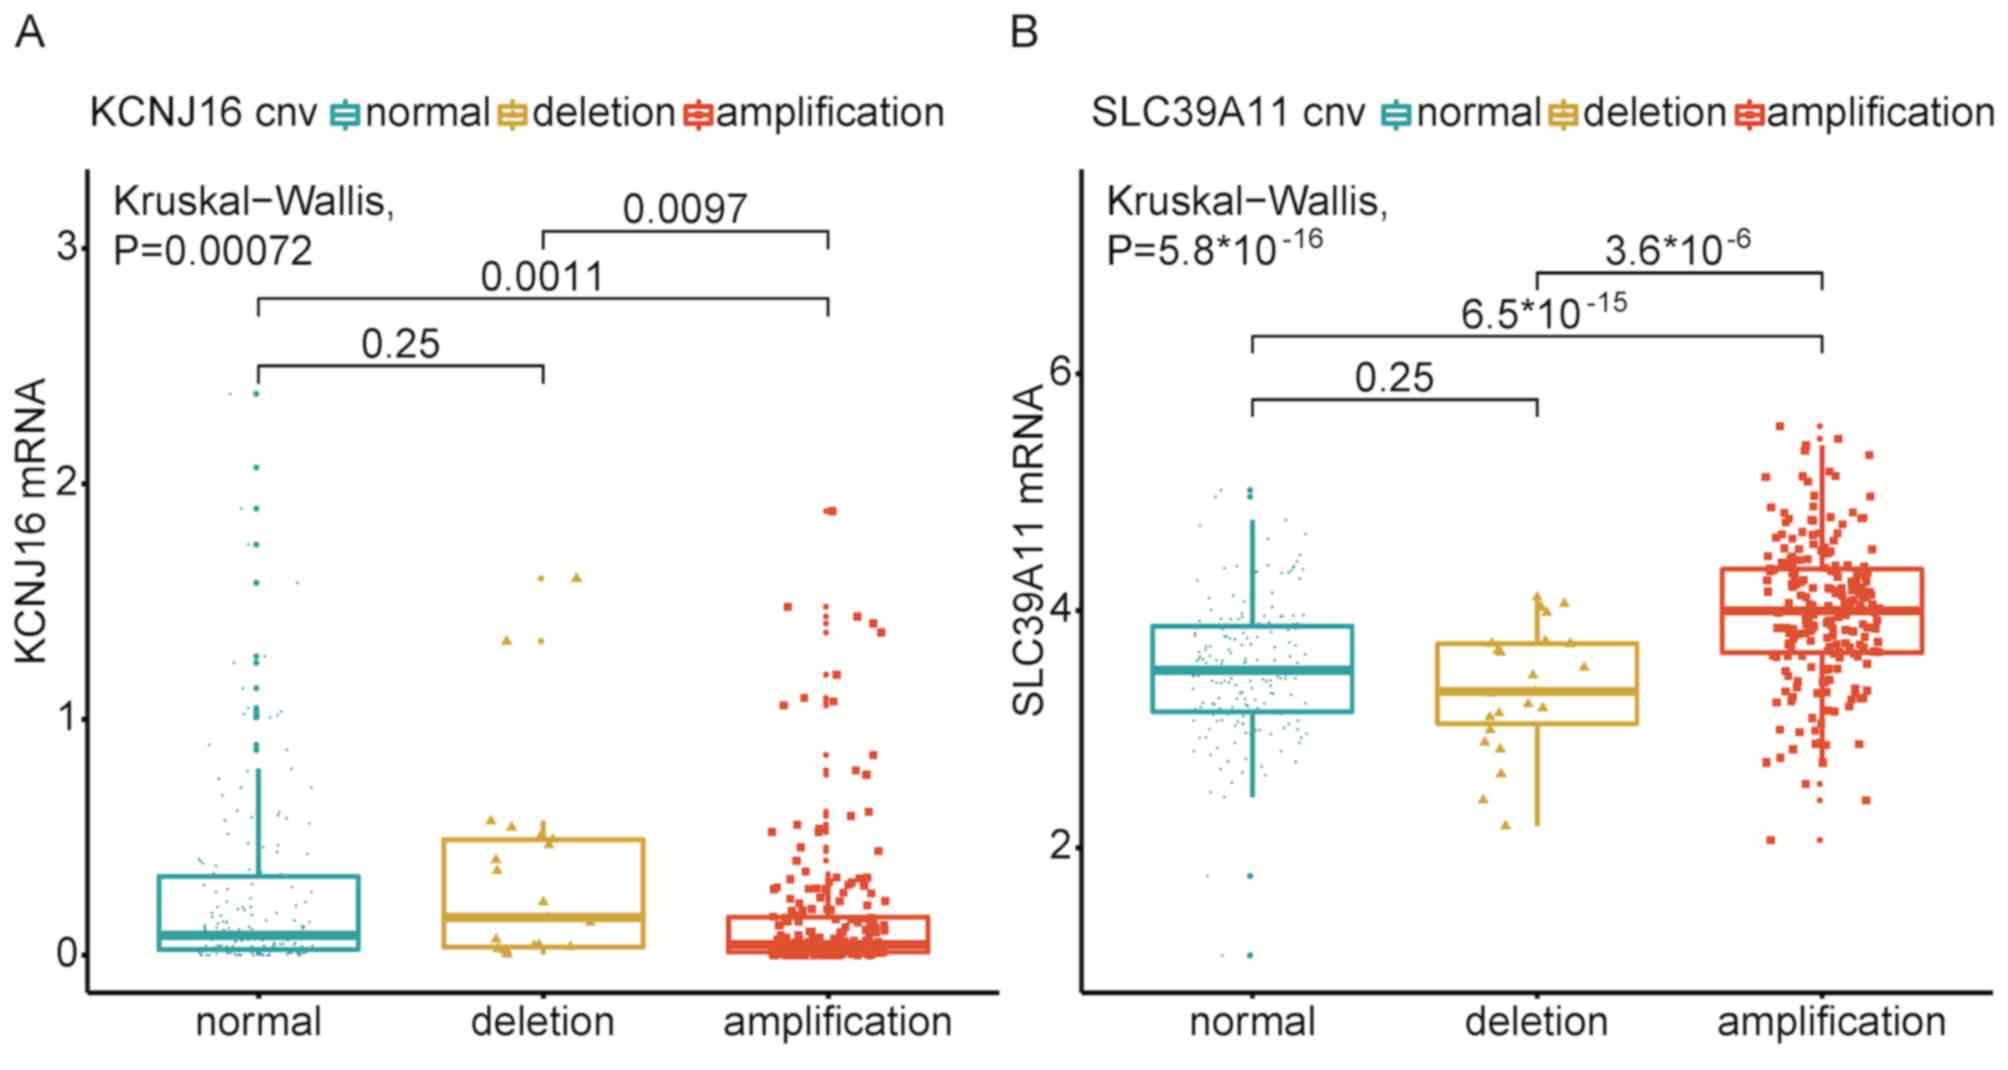
Associations between amplification/deletion and the expression
levels of genes in 17q24.3 and 11p15.5, demonstrating that six
deletion genes (AP2A2, MOB2, MUC5B, MUC6, TOLLIP and
TOLLIP-AS1) significantly influenced the levels of mRNA
(Fig. 7), whereas two amplification
(KCNJ16 and SLC39A11) genes affected the levels of
mRNA (Fig. 8).
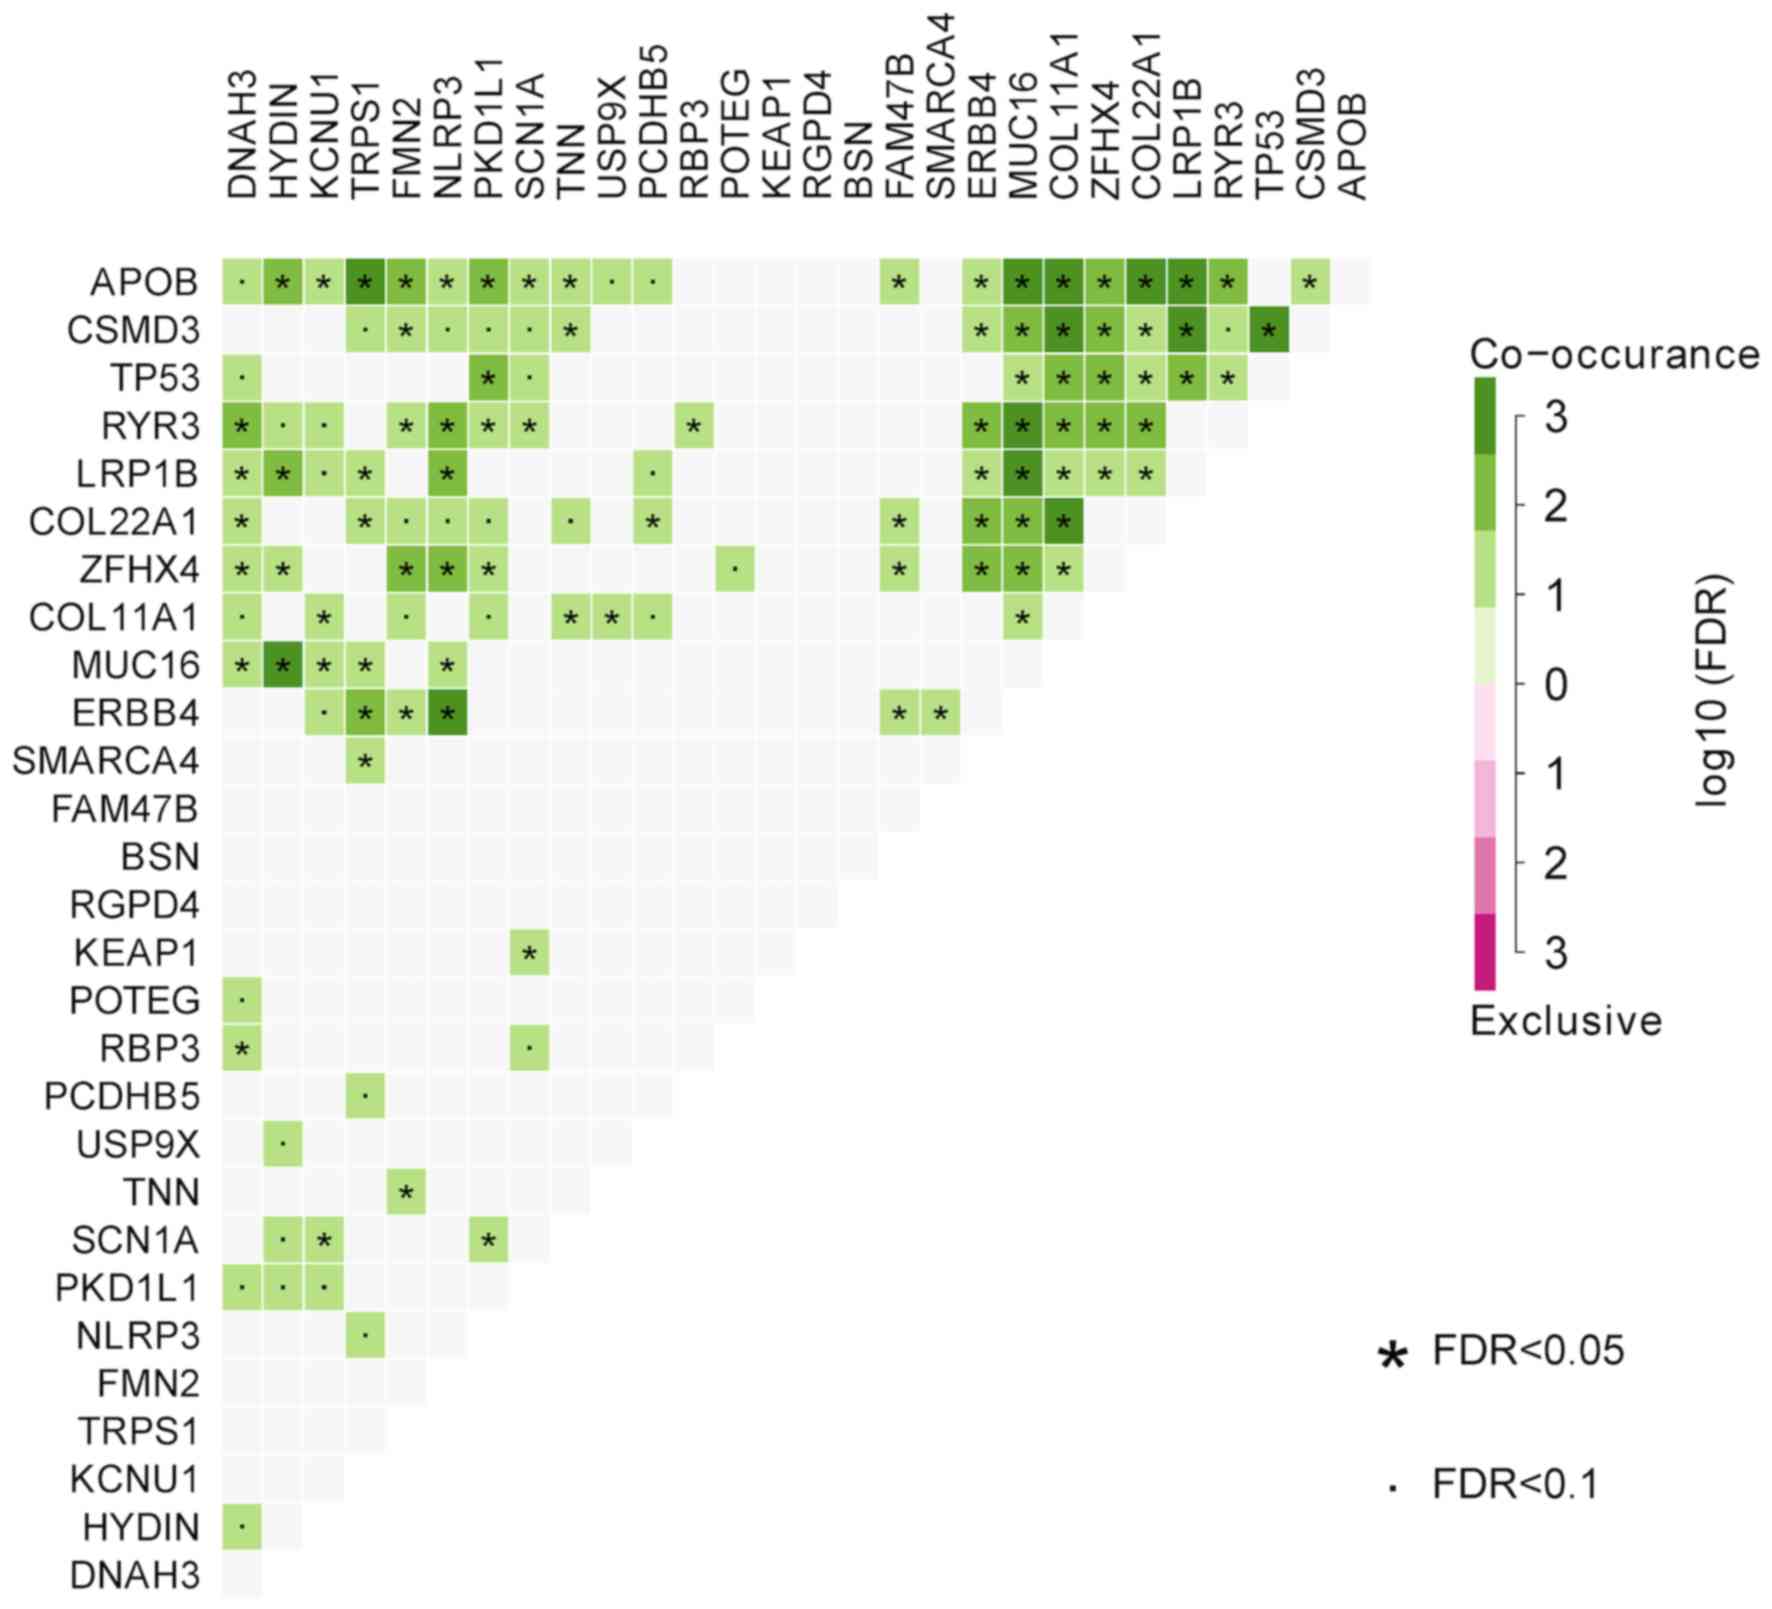
A total of 29 mutant genes were found to be
significantly associated with risk scores (P<0.01; Table II) and TP53 was most
significantly correlated with risk score. Utilizing maftools R
packages, pair-wise Fisher's exact tests were used to identify the
co-occurrence and exclusivity of genes screened in the present
study. We identified that MUC16 significantly co-occurred
with HYDIN, APOB, RYR3 and LRP1B (FDR<0.01 and
co-occurrence≥3; Fig. 9).
APOB significantly co-occurred with TRPS1, MUC16,
COL11A1, COL22A1 and LRP1B (FDR<0.01 and
co-occurrence≥3). CSMD3 significantly co-occurred with
COL11A1, LRP1B and TP53 (FDR<0.01 and
co-occurrence≥3). ERBB4 significantly co-occurred with
NLRP3 (FDR<0.01 and co-occurrence≥3). COL11A1
significantly co-occurred with APOB, CSMD3 and
COL22A1 (FDR<0.01 and co-occurrence≥3).
| Table II.A total of 29 mutant genes are
significantly associated with risk scores in patients with
non-small cell lung cancer. |
Table II.
A total of 29 mutant genes are
significantly associated with risk scores in patients with
non-small cell lung cancer.
| Gene name | Location | P-value |
|---|
| TP53 | 17p13.1 |
1.8×10⁻⁴ |
| SMARCA4 | 19p13.2 |
2.68×10⁻⁴ |
| TRPS1 | 8q23.3 |
2.07×10⁻³ |
| COL22A1 | 8q24.23 |
2.52×10⁻³ |
| SCN1A | 2q24.3 |
2.72×10⁻³ |
| HYDIN | 16q22.2 |
2.99×10⁻³ |
| FAM47B | Xp21.1 |
3.30×10⁻³ |
| POTEG | 14q11.2 |
3.39×10⁻³ |
| NLRP3 | 1q44 |
3.61×10⁻³ |
| LRP1B | 2q22.1 |
3.63×10⁻³ |
| KEAP1 | 19p13.2 |
4.05×10⁻³ |
| KCNU1 | 8p11.23 |
4.43×10⁻³ |
| FMN2 | 1q43 |
5.13×10⁻³ |
| MUC16 | 19p13.2 |
5.22×10⁻³ |
| BSN | 3p21.31 |
5.37×10⁻³ |
| RGPD4 | 2q12.3 |
5.63×10⁻³ |
| PKD1L1 | 7p12.3 |
5.68×10⁻³ |
| RBP3 | 10q11.22 |
5.74×10⁻³ |
| TNN | 1q25.1 |
5.80×10⁻³ |
| CSMD3 | 8q23.3 |
6.52×10⁻³ |
| APOB | 2p24.1 |
6.86×10⁻³ |
| PCDHB5 | 5q31.3 |
7.85×10⁻³ |
| USP9X | Xp11.4 |
7.86×10⁻³ |
| ERBB4 | 2q34 |
8.28×10⁻³ |
| ZFHX4 | 8q21.11 |
8.68×10⁻³ |
| COL11A1 | 1p21.1 |
8.78×10⁻³ |
| DNAH3 | 16p12.3 |
9.10×10⁻³ |
| MTCL1 | 18p11.22 |
9.61×10⁻³ |
| RYR3 | 15q14 |
9.61×10⁻³ |
Discussion
In 2014, TCGA Research Network reported research
regarding the multi-omics integrated analysis of LUAD (38). TCGA Research Network identified that
EGFR mutations were more frequent in women, and RBM10
mutations were more common in men. A total of 4% of cases harbored
exon 14 skipping in MET mRNA. Mutations in NF1, MET,
ERBB2 and RIT1 may play driver roles in LUAD. TCGA
Research Network inferred that phosphorylation of proteins may lead
aberrant activation of MAPK and PI(3)K pathway. TCGA
Research Network identified six integrated multi-omics (CN, DNA
methylation and mRNA expression data) subtypes using iCluster
analysis. Meanwhile, the present study also identified six
molecular subtypes based on integrated analysis of multi-omics data
(copy number variation, mRNA, methylation and miRNA) and
constructed a survival risk model based on NSCLC data. The present
study investigated the role of methylation, copy number variation
and mutation in the survival of patients with NSCLC. The data type
of copy number variation (−2, −1, 0, 1 and 2) and mutation (0 and
1) was a discrete variable. It's hard to fit a precise prognosis
model using discrete variable. Thus, we selected methylation data
(continuous variable) were used to construct the survival risk
model. The outcome of Cox regression analysis showed that
methylation-based survival risk was an independent prediction
factor of survival. The survival risk scores for 439 patients with
NSCLC were obtained by constructing a methylation-based prognosis
model. A total of 35 copy number amplifications regions, 40 copy
number deletion regions and 29 mutation genes were identified,
which were significantly associated with survival risk.
The present study identified various mutation
features in different molecular subtypes. iCluster 2, iCluster 4,
iCluster 5 and iCluster 6 were characterized by a high frequency of
TP53 mutations. Remarkably, TTN also had a high
mutation frequency in iCluster 2, iCluster 4, iCluster 5 and
iCluster 6. The distribution of TTN mutations was similar to
TP53. Thus, TTN may be an important gene in NSCLC;
however, to the best of our knowledge, TTN has not been
investigated in previous lung cancer studies.
iCluster 6 had the least favorable outcome for
overall survival, while iClusters 1–5 had a more favorable
prognosis compared with iCluster 6. In addition, iCluster 6 had
high TTN (66.18%) and TP53 (66.18%) mutation rates.
Thus, TTN and TP53 mutations may lead to unfavorable
survival outcomes for iCluster6.
Based on the methylation datasets, the present study
constructed a survival risk model using LASSO regression. Using
this model, high survival risk was associated with chromosome
17q24.3 amplification and chromosome 11p15.5 deletion. It has
previously been reported that chromosome 17q24.3 is associated with
LUAD (39) and with MGMT
methylation in the lung (40). Among
the amplified genes identified in 17q24.3, AC005152.3,
LINC01152, RP11-84E24.2, SOX9-AS1, AC007461.2, SOX9, KCNJ16 and
SLC39A11 were the most significant genes in the present
study. To the best of our knowledge, RP11-84E24.2 and
AC007461.2 have not been identified in previous studies
investigating lung cancer. The present study revealed that the
deletion of the six survival risk-associated genes (AP2A2, MOB2,
MUC5B, MUC6, TOLLIP and TOLLIP-AS1) in 11p15.5
influenced their mRNA expression levels, whereas the amplification
of two survival risk-associated genes (KCNJ16 and
SLC39A11) in 17q24.3 influenced their mRNA expression
levels. A previous study reported that the chromosome region at
17q24.3 was a novel and frequent LOH region associated with NSCLC
(41). The present study showed that
the survival risks of patients with amplified genes in 17q24.3 were
significantly higher compared with those with deletion or normal
17q24.3 gene status. It was hypothesized that copy number variation
of survival risk-associated genes in 17q24.3 may affect patient
prognosis by LOH. The majority of deletion events in 17q24.3 may
therefore be due to LOH.
Depletion of SOX9-AS1 and AC005152
leads to a decrease in SOX9 mRNA and protein expression
levels (42). However, the
expression levels of LINC01152 had the opposite trend in
contrast to SOX9-AS1, AC005152 and SOX9 (42). As a gene functioning in cartilage
homeostasis, BMP3B has tumor-suppressive functions with
promoter hypermethylation in lung cancer (43). It has been reported that SOX9
can influence the chondrocyte phenotype through regulating the
process of hypoxia (44). Thus, it
was considered that SOX9 may influence the expression of
BMP3B, and SOX9-AS1, AC005152 and LINC01152
may mediate the expression levels of SOX9 and BMP3P
indirectly. Therefore, genes that have been identified in
chromosome 17q24.3 may serve important roles in lung cancer by
regulating the levels of BMP3B expression.
The outcome of the present study indicated that
deletion of chromosome 11p15.5 may lead to high survival risk for
patients with NSCLC. MOB2, AP2A2, MUC6, MUC2, MUC5B, MIR6744,
TOLLIP and TOLLIP-AS1 are located within this region and
were significantly associated with survival risk. A previous study
demonstrated that deletion of TOLLIP can increase the level
of mRNA expression of IL-6 (45), while a decrease in MUC2
protein expression can increase the level of IL-6 expression
(46). It has been reported that
IL-6 can induce the early response of MUC2, MUC5B and
MUC6 (47). IL-6 can
activate the STAT3 signaling pathway, which will stimulate
the progression of cancer (48). It
was proposed that the deletion of genes in 11p15.5 may up-regulate
the level of IL-6 expression and lead to an increase in
survival risk. However, this association was not found in any of
the datasets in the present study.
A total of 29 mutant genes were found to be
significantly correlated with survival risk score. Among these
genes, 12 genes had significant co-occurrence (MUC16
co-occurred with HYDIN, APOB, RYR3 and LRP1B;
APOB co-occurred with TRPS1, MUC16, COL11A1, COL22A1
and LRP1B; CSMD3 co-occurred with COL11A1,
LRP1B and TP53; ERBB4 co-occurred with
NLRP3; COL11A1 co-occurred with APOB, CSMD3
and COL22A1.). A previous study demonstrated that
overexpression of MUC16 can promote tumor cell proliferation
and migration by activating the JAK2/STAT3/GR
axis (49). Overexpression of
TRPS1 leads to multi-drug resistance by inducing MGMT
transcription in lung cancer (50).
It was reported that COL11A1 can promote the proliferation,
migration and invasion of NSCLC cell lines in vitro
(51). Qiu et al (52) reported that mutation of CSMD3
will lead resistance to etoposide in small-cell lung cancer. Teng
et al (53) reported that
activation of NLRP3 may induce pyroptosis in NSCLC. The
second-generation inhibitor of ERBB4 has passed the phase
III clinical trial (54). It was
reported that mutation of LRP1B correlated with better
response of immune therapy and higher tumor mutation load (55). However, the other co-occurrence genes
we identified lacked NSCLC-associated research. The co-occurrence
associations of genes we identified may provide direction for
further clinical and therapy studies.
In conclusion, integrated molecular subtypes of
NSCLC were identified by integrated analytic approaches. The
chromosome regions 17q24.3 and 11p15.5 were identified as
survival-associated copy number variation regions, while a total of
29 mutant genes were found to be significantly associated with
survival. Through assessing the level of methylation sites in the
present model, the survival risk of patients was predicted and this
may be beneficial to estimate the prognosis of patients with lung
cancer. In addition, the CpG sites identified in the present study
require further investigation to understand their functions in lung
cancer. Genes corresponding to these CpG sites may serve as novel
therapeutic targets for lung cancer treatment in the future.
Supplementary Material
Supporting Data
Acknowledgements
Not applicable.
Funding
No funding was received.
Availability of data and materials
The datasets used and/or analyzed during the
present study are available from the corresponding author upon
reasonable request.
Authors' contributions
ML and SQ designed the study. HS, FS, XM, YD, CS
and HZ collected and analyzed the data. JJ downloaded TCGA data.
ML, SQ and JJ performed analysis of data. HS, FS and XM reviewed
the results and interpreted the data. ML and SQ wrote the
manuscript. HS, YD, CS and HZ gave final approval of the version to
be published. All authors read and approved the manuscript and
agreed to be accountable for all aspects of the research in
ensuring that the accuracy or integrity of any part of the work are
appropriately investigated and resolved.
Ethics approval and consent to
participate
Not applicable.
Patient consent for publication
Not applicable.
Competing interests
The authors declare that they have no competing
interests.
Glossary
Abbreviations
Abbreviations:
|
LUAD
|
lung adenocarcinoma
|
|
NSCLC
|
non-small cell lung cancer
|
|
TCGA
|
The Cancer Genome Atlas
|
|
c index
|
concordance index
|
|
OS
|
overall survival
|
|
AUC
|
area under the curve
|
|
LOH
|
loss of heterozygosity
|
|
HRD
|
homologous repair deficiency
|
|
BIC
|
Bayesian Information Criterion
|
References
|
1
|
Bray F, Ferlay J, Soerjomataram I, Siegel
RL, Torre LA and Jemal A: Global cancer statistics 2018: GLOBOCAN
estimates of incidence and mortality worldwide for 36 cancers in
185 countries. CA Cancer J Clin. 68:394–424. 2018. View Article : Google Scholar : PubMed/NCBI
|
|
2
|
Molina JR, Yang P, Cassivi SD, Schild SE
and Adjei AA: Non-small cell lung cancer: Epidemiology, risk
factors, treatment, and survivorship. Mayo Clinic Oroceedings.
83:584–594. 2008. View Article : Google Scholar
|
|
3
|
Miller KD, Siegel RL, Lin CC, Mariotto AB,
Kramer JL, Rowland JH, Stein KD, Alteri R and Jemal A: Cancer
treatment and survivorship statistics, 2016. CA Cancer J Clin.
66:271–289. 2016. View Article : Google Scholar : PubMed/NCBI
|
|
4
|
Chen Z, Fillmore CM, Hammerman PS, Kim CF
and Wong KK: Non-small-cell lung cancers: A heterogeneous set of
diseases. Nat Rev Cancer. 14:535–546. 2014. View Article : Google Scholar : PubMed/NCBI
|
|
5
|
Del Prete C and Azzoli CG: Non-small cell
lung cancer in the Era of personalized medicine: Molecular tests
that matter. R I Med J (2013). 103:28–32. 2020.
|
|
6
|
Muller IB, de Langen AJ, Giovannetti E and
Peters GJ: Anaplastic lymphoma kinase inhibition in metastatic
non-small cell lung cancer: Clinical impact of alectinib. Onco
Targets Ther. 10:4535–4541. 2017. View Article : Google Scholar : PubMed/NCBI
|
|
7
|
Bergethon K, Shaw AT, Ou SH, Katayama R,
Lovly CM, McDonald NT, Massion PP, Siwak-Tapp C, Gonzalez A, Fang
R, et al: ROS1 rearrangements define a unique molecular class of
lung cancers. J Clin Oncol. 30:863–870. 2012. View Article : Google Scholar : PubMed/NCBI
|
|
8
|
Paez JG, Janne PA, Lee JC, Tracy S,
Greulich H, Gabriel S, Herman P, Kaye FJ, Lindeman N, Boggon TJ, et
al: EGFR mutations in lung cancer: Correlation with clinical
response to gefitinib therapy. Science. 304:1497–1500. 2004.
View Article : Google Scholar : PubMed/NCBI
|
|
9
|
Comprehensive molecular characterization
of human colon and rectal cancer. Nature. 487:330–337. 2012.
View Article : Google Scholar : PubMed/NCBI
|
|
10
|
Ronglai S, Olshen AB and Marc L:
Integrative clustering of multiple genomic data types using a joint
latent variable model with application to breast and lung cancer
subtype analysis. Bioinformatics. 25:29062009. View Article : Google Scholar : PubMed/NCBI
|
|
11
|
Cancer Genome Atlas Research Network.
Electronic address, . simplewheeler@bcm.edu; Cancer
Genome Atlas Research Network: Comprehensive and integrative
genomic characterization of hepatocellular carcinoma. Cell.
169:1327–1341.e23. 2017. View Article : Google Scholar : PubMed/NCBI
|
|
12
|
Cancer Genome Atlas Research Network, .
Comprehensive molecular profiling of lung adenocarcinoma. Nature.
511:543–550. 2014. View Article : Google Scholar : PubMed/NCBI
|
|
13
|
Yue QY, Zhao W, Tan Y, Deng XL and Zhang
YH: PLCE1 inhibits apoptosis of non-small cell lung cancer via
promoting PTEN methylation. Eur Rev Med Pharmacol Sci.
23:6211–6216. 2019.PubMed/NCBI
|
|
14
|
Shahabi S, Kumaran V, Castillo J, Cong Z,
Nandagopal G, Mullen DJ, Alvarado A, Correa MR, Saizan A, Goel R,
et al: LINC00261 Is an epigenetically regulated tumor suppressor
essential for activation of the DNA damage response. Cancer Res.
79:3050–3062. 2019. View Article : Google Scholar : PubMed/NCBI
|
|
15
|
Yun J, Mi HP, Dong JS, Nam KT, Moon DB, Ju
JH, Hwang OK, Choi JS, Kim TH, Jung YS, et al: IL-32 gamma reduces
lung tumor development through upregulation of TIMP-3
overexpression and hypomethylation. Cell Death Dis. 9:3062018.
View Article : Google Scholar : PubMed/NCBI
|
|
16
|
Kang X, Kong F, Huang K, Li L, Li Z, Wang
X, Zhang W and Wu X: LncRNA MIR210HG promotes proliferation and
invasion of non-small cell lung cancer by upregulating methylation
of CACNA2D2 promoter via binding to DNMT1. Onco Targets Ther.
12:3779–3790. 2019. View Article : Google Scholar : PubMed/NCBI
|
|
17
|
Wang Y, Zhang Q, Gao Z, Xin S, Zhao Y,
Zhang K, Shi R and Bao X: A novel 4-gene signature for overall
survival prediction in lung adenocarcinoma patients with lymph node
metastasis. Cancer Cell Int. 19:1002019. View Article : Google Scholar : PubMed/NCBI
|
|
18
|
Liu C, Li Y, Wei M, Zhao L, Yu Y and Li G:
Identification of a novel glycolysis-related gene signature that
can predict the survival of patients with lung adenocarcinoma. Cell
Cycle. 18:568–579. 2019. View Article : Google Scholar : PubMed/NCBI
|
|
19
|
Songyang Y, Zhu W, Liu C, Li LL, Hu W,
Zhou Q, Zhang H, Li W and Li D: Large-scale gene expression
analysis reveals robust gene signatures for prognosis prediction in
lung adenocarcinoma. PeerJ. 7:e69802019. View Article : Google Scholar : PubMed/NCBI
|
|
20
|
R Core Team (2019), . R: A language and
environment for statistical computing. R Foundation for Statistical
Computing. (Vienna, Austria). URL https://www.R-project.org/.
|
|
21
|
Colaprico A, Silva TC, Olsen C, Garofano
L, Cava C, Garolini D, Sabedot TS, Malta TM, Pagnotta SM,
Castiglioni I, et al: TCGAbiolinks: An R/Bioconductor package for
integrative analysis of TCGA data. Nucleic Acids Res. 44:e712016.
View Article : Google Scholar : PubMed/NCBI
|
|
22
|
Mo Q, Wang S, Seshan VE, Olshen AB,
Schultz N, Sander C, Powers RS, Ladanyi M and Shen R: Pattern
discovery and cancer gene identification in integrated cancer
genomic data. Proc Natl Acad Sci USA. 110:4245–4250. 2013.
View Article : Google Scholar : PubMed/NCBI
|
|
23
|
Xu T, Duy LT, Liu L, Su N, Wang R, Sun B,
Colaprico A, Bontempi G and Li J: CancerSubtypes: An R/Bioconductor
package for molecular cancer subtype identification, validation,
and visualization. Bioinformatics. 33:3131–3133. 2017. View Article : Google Scholar : PubMed/NCBI
|
|
24
|
Sadanori K and Genshiro K: Bayesian
information Criteria. Information Criteria and Statistical
Modeling. Springer Series in Statistics. Springer. (New York, NY).
2008.
|
|
25
|
Kassambara A and Kosinski M: Survminer:
Drawing Survival Curves using ‘ggplot2’. 2018.
|
|
26
|
Dardis C: survMisc: Miscellaneous
functions for survival data. 2018.
|
|
27
|
Bolstad B: PreprocessCore: A collection of
pre-processing functions. 2018.
|
|
28
|
Therneau TM: A package for survival
analysis in S. 2015.
|
|
29
|
Simon N, Friedman J, Hastie T and
Tibshirani R: Regularization paths for Cox's proportional hazards
model via coordinate descent. J Stat Softw. 39:1–13. 2011.
View Article : Google Scholar : PubMed/NCBI
|
|
30
|
Frank E Harrell Jr; with contributions
from Charles Dupont and many others, . Hmisc: Harrell
Miscellaneous. R package version 4.4-0. 2020.
|
|
31
|
Caesar-Johnson SJ, Demchok JA, Felau I, et
al: The immune landscape of cancer. Immunity. 81:1052018.
|
|
32
|
Taylor AM, Shih J, Ha G, Gao GF, Zhang X,
Berger AC, Schumacher SE, Wang C, Hu H, Liu J, et al: Genomic and
functional approaches to understanding cancer aneuploidy. Cancer
Cell. 33:676–689.e3. 2018. View Article : Google Scholar : PubMed/NCBI
|
|
33
|
Cerami E, Gao J, Dogrusoz U, Gross BE,
Sumer SO, Aksoy BA, Jacobsen A, Byrne CJ, Heuer ML, Larsson E, et
al: The cBio cancer genomics portal: An open platform for exploring
multidimensional cancer genomics data. Cancer Discov. 2:401–404.
2012. View Article : Google Scholar : PubMed/NCBI
|
|
34
|
Gao J, Aksoy BA, Dogrusoz U, Dresdner G,
Gross B, Sumer SO, Sun Y, Jacobsen A, Sinha R, Larsson E, et al:
Integrative analysis of complex cancer genomics and clinical
profiles using the cBioPortal. Sci Signal. 6:pl12013. View Article : Google Scholar : PubMed/NCBI
|
|
35
|
Kassambara A: Ggpubr: ‘Ggplot2’ Based
Publication Ready Plots. 2018.
|
|
36
|
Mayakonda A and Koeffler HP: Maftools:
Efficient analysis, visualization and summarization of MAF files
from large-scale cohort based cancer studies. bioRxiv.
0526622016.doi: https://doi.org/10.1101/052662.
|
|
37
|
Chun YS, Pawlik TM and Vauthey JN: 8th
Edition of the AJCC cancer staging manual: Pancreas and
hepatobiliary cancers. Ann Surg Oncol. 25:845–847. 2018. View Article : Google Scholar : PubMed/NCBI
|
|
38
|
Cancer Genome Atlas Research Network, .
Comprehensive molecular profiling of lung adenocarcinoma. Nature.
511:543–550. 2014. View Article : Google Scholar : PubMed/NCBI
|
|
39
|
Wei JS, Matsuo K, Hsiung CA, Shiraishi K,
Song M, Kim HN, Wong MP, Hong YC, Hosgood HD III, Wang Z, et al:
Association between GWAS-identified lung adenocarcinoma
susceptibility loci and EGFR mutations in never-smoking Asian
women, and comparison with findings from Western populations. Hum
Mol Genet. 26:454–465. 2016.
|
|
40
|
Leng S, Wu G, Collins LB, Thomas CL,
Tellez CS, Jauregui AR, Picchi MA, Zhang X, Juri DE, Desai D, et
al: Implication of a chromosome 15q15.2 locus in regulating UBR1
and predisposing smokers to MGMT methylation in lung. Cancer Res.
75:3108–3117. 2015. View Article : Google Scholar : PubMed/NCBI
|
|
41
|
Tseng RC, Chang JW, Hsien FJ, Chang YH,
Hsiao CF, Chen JT, Chen CY, Jou YS and Wang YC: Genomewide loss of
heterozygosity and its clinical associations in non small cell lung
cancer. Int J Cancer. 117:241–247. 2005. View Article : Google Scholar : PubMed/NCBI
|
|
42
|
Barter MJ, Gomez R, Hyatt S, Cheung K,
Skelton AJ, Xu Y, Clark IM and Young DA: The long non-coding RNA
ROCR contributes to SOX9 expression and chondrogenic
differentiation of human mesenchymal stem cells. Development.
144:4510–4521. 2017. View Article : Google Scholar : PubMed/NCBI
|
|
43
|
Dai Z, Popkie AP, Zhu WG, Timmers CD,
Raval A, Tannehill-Gregg S, Morrison CD, Auer H, Kratzke RA,
Niehans G, et al: Bone morphogenetic protein 3B silencing in
non-small-cell lung cancer. Oncogene. 23:3521–3529. 2004.
View Article : Google Scholar : PubMed/NCBI
|
|
44
|
Lafont J, Talma S, Hopfgarten C and Murphy
CL: Hypoxia promotes the differentiated human articular chondrocyte
phenotype through SOX9-dependent and -independent pathways. J Biol
Chem. 283:4778–4786. 2008. View Article : Google Scholar : PubMed/NCBI
|
|
45
|
Humbert-Claude M, Duc D, Dwir D, Thieren
L, Sandström von Tobel J, Begka C, Legueux F, Velin D, Maillard MH,
Do KQ, et al: Tollip, an early regulator of the acute inflammatory
response in the substantia nigra. J Neuroinflammation. 13:3032016.
View Article : Google Scholar : PubMed/NCBI
|
|
46
|
Hsu HP, Lai MD, Lee JC, Yen MC, Weng TY,
Chen WC, Fang JH and Chen YL: Mucin 2 silencing promotes colon
cancer metastasis through interleukin-6 signaling. Sci Rep.
7:58232017. View Article : Google Scholar : PubMed/NCBI
|
|
47
|
Enss ML, Cornberg M, Wagner S, Gebert A,
Henrichs M, Eisenblätter R, Beil W, Kownatzki R and Hedrich HJ:
Proinflammatory cytokines trigger MUC gene expression and mucin
release in the intestinal cancer cell line LS180. Inflamm Res.
49:162–169. 2000. View Article : Google Scholar : PubMed/NCBI
|
|
48
|
Rebouissou S, Amessou M, Couchy G, Poussin
K, Imbeaud S, Pilati C, Izard T, Balabaud C, Bioulac-Sage P and
Zucman-Rossi J: Frequent in-frame somatic deletions activate gp130
in inflammatory hepatocellular tumours. Nature. 457:200–204. 2008.
View Article : Google Scholar : PubMed/NCBI
|
|
49
|
Lakshmanan I, Salfity S, Seshacharyulu P,
Rachagani S, Thomas A, Das S, Majhi PD, Nimmakayala RK, Vengoji R,
Lele SM, et al: MUC16 regulates TSPYL5 for lung cancer cell growth
and chemoresistance by suppressing p53. Clin Cancer Res.
23:3906–3917. 2017. View Article : Google Scholar : PubMed/NCBI
|
|
50
|
Liu H, Liao Y, Tang M, Wu T, Tan D, Zhang
S and Wang H: Trps1 is associated with the multidrug resistance of
lung cancer cell by regulating MGMT gene expression. Cancer Med.
7:1921–1932. 2018. View Article : Google Scholar : PubMed/NCBI
|
|
51
|
Shen L, Yang M, Lin Q, Zhang Z, Zhu B and
Miao C: COL11A1 is overexpressed in recurrent non-small cell lung
cancer and promotes cell proliferation, migration, invasion and
drug resistance. Oncol Rep. 36:877–885. 2016. View Article : Google Scholar : PubMed/NCBI
|
|
52
|
Qiu Z, Lin A, Li K, Lin W, Wang Q, Wei T,
Zhu W, Luo P and Zhang J: A novel mutation panel for predicting
etoposide resistance in small-cell lung cancer. Drug Des Devel
Ther. 13:2021–2041. 2019. View Article : Google Scholar : PubMed/NCBI
|
|
53
|
Teng JF, Mei QB, Zhou XG, Tang Y, Xiong R,
Qiu WQ, Pan R, Law BY, Wong VK, Yu CL, et al: Polyphyllin VI
induces caspase-1-mediated pyroptosis via the induction of
ROS/NF-κB/NLRP3/GSDMD signal axis in non-small cell lung cancer.
Cancers. 12:1932020. View Article : Google Scholar
|
|
54
|
Sun H and Wu YL: Dacomitinib in
non-small-cell lung cancer: A comprehensive review for clinical
application. Future Oncol. 15:2769–2777. 2019. View Article : Google Scholar : PubMed/NCBI
|
|
55
|
Chen H, Chong W, Wu Q, Yao Y, Mao M and
Wang X: Corrigendum: Association of LRP1B mutation with tumor
mutation burden and outcomes in melanoma and non-small cell lung
cancer patients treated with immune check-point blockades. Front
Immunol. 10:15232019. View Article : Google Scholar : PubMed/NCBI
|