Introduction
Lung cancer is the most common cause of
cancer-associated mortality worldwide in the 2018 global survey
(1–4), and 85% of all lung cancers are
non-small cell lung cancer (NSCLC) (3). As >70% of patients with lung cancer
in the 2018 global survey have metastases to the regional lymph
nodes or to distant sites, systemic therapies such as chemotherapy
and radiotherapy played a major part in the treatment of these
patients (3). The benefit of the
these therapies, however, is modest in terms of controlling the
proliferation of the tumor cells, and the five-year survival rate
is only ~19% in the US (3,5,6). Cancer
cells develop drug resistance during the course of the treatment
and therefore, novel therapies are required based from the
understanding of molecular mechanisms and pathways that contribute
to tumor resistance, and thereby enhancing the clinical efficacy of
the current therapeutic agents.
The epidermal growth factor receptor (EGFR)
signaling pathway plays a critical role in cell proliferation and
survival in NSCLC (7). Drugs, such
as the EGFR tyrosine kinase inhibitors (TKIs), gefitinib and
erlotinib, have demonstrated clinical benefit of reduced tumor size
in patients with NSCLC that harbored sensitizing mutations, such as
L858R and exon 19 deletion in the tyrosine kinase domain of the
EGFR gene (8–10). The overall clinical efficacy from
these drugs in patients with relapsed NSCLC is limited; however,
due to drug resistance.
Analysis of EGFR-TKI clinical data in patients with
NSCLC revealed that the clinical benefits from these types of drugs
are variable. The acquired drug resistance mutation EGFR T790M for
gefitinib or erlotinib was detected in ~50% of patients with
clinical resistance (11–14). The third generation TKI, osimertinib,
was approved for treating patients with sensitizing mutations in
EGFR who are also T790M-positive, which partially alleviated the
problem. The development of TKI resistance by other mechanisms,
such as activating KRAS mutations (for instance, G12D or G12V),
HER2 (15) or MET gene copy number
amplification (16) is still
challenging to overcome in clinical practice (14,17–20).
Therefore, a further understanding of the tumor molecular markers,
which can predict resistance to EGFR-TKIs, is important for the
identification of drugs to overcome resistance (20).
The Hedgehog (Hh) signaling pathway controls
multiple cellular functions, such as embryonic development, tissue
patterning and wound healing (21).
Aberrantly increased Hh pathway activation has been implicated in
various types of inherited and sporadic malignancies (21), including lung cancer (22–25). In
the quiescent state of the Hh signaling pathway, the transmembrane
receptor Patched homolog-1 (PTCH1; which spans the membrane 12
times) restricts the activity of the transmembrane receptor
smoothened, which is a frizzled class receptor (SMO; which spans
the membrane 7 times) (21,26). The binding of the Hh ligands to PTCH1
reverses its inhibitory effect on SMO, and subsequently the
activated SMO produces a complex series of cytoplasmic signal
transductions, which results in the activation of zinc-finger
protein GLI (GLI) family of transcription factors (21,26). The
GLI transcription factors regulate the transcription of specific
genes, which is dependent on the overall stimuli received by the
cells as well as the type of cells (27–30).
There are three members of the GLI protein family in
humans (GLI1, GLI2 and GLI3). GLI1 contains a transactivation
domain and acts as a transcriptional activator (28–30).
GLI2 and GLI3 both contain the transactivation and repressor
domains, and function as either activators or repressors (31). GLI2 and GLI3 are the primary
mediators of signal transduction upon the activation of the
Hedgehog pathway, and regulate the expression of GLI1 (28). GLI1 functions in a positive feedback
manner to reinforce its activity, with its levels reflecting the
activation status of the GLI family proteins (29).
The importance of the Hh signaling pathway in the
development of cancer has provided novel targets for oncological
interventions (25). A majority of
the studies have focused on inhibiting Hh signal transduction at
the cell membrane level, i.e., inhibitors targeting Smo and Hh
(32). For example, the SMO
inhibitor, vismodegib, was approved by the Food and Drug
Administration for the treatment of advanced and metastatic basal
cell carcinoma (BCC) (33,34). Vismodegib and numerous other SMO
inhibitors, such as sonidegib (35–38) and
saridegib (39,40), are currently undergoing clinical
trials in the treatment of BCC and many types of solid tumors
(25).
Previous studies have revealed additional mechanisms
of GLI activation, which are independent of Hh/SMO regulation and
are stimulated by the cross-talk between components downstream of
the Hh/SMO signaling pathway and several other oncogenic signaling
pathways, such as the EGFR pathway (41,42). For
example, EGFR signaling and the stimulation of its downstream
components, such as RAS/MAPK and PI3K/Akt, lead to the activation
of the GLI transcription factors. The importance of this
non-canonical GLI activation is accentuated, as RAS/MAPK and
PI3K/Akt also mediate stimuli from other growth factor pathways
such as ALK (43) and HER2 (44), and both PI3K and Ras are
hyper-activated in tumors (41).
These findings suggest the potential importance of GLI as a key
target for cancer therapeutics (27,30).
Recently, pre-clinical studies have found that GLI inhibitors are
more effective in inhibiting tumor cell growth in vivo and
in reducing tumor growth in animal models when compared with
upstream SMO inhibition (39,45,46).
In the present study, we hypothesize that GLI1,
which functions as an integration point for the canonical
activation from the Hh/SMO signalling pathway (28,29) and
for the non-canonical activation from the EGFR signaling pathway
(25,41), may be a key regulator of TKI
resistance in NSCLC. The association between GLI1 and erlotinib
resistance was determined in NSCLC cell lines and tumor specimens.
The results indcated that GLI1 was critical for TKI sensitivity,
and patients with lung cancer may benefit from the combined
treatment of TK and GLI1 inhibitors.
Materials and methods
Tissue specimens
All the human NSCLC tissue samples used in the
present study were obtained from the University of California, San
Francisco Thoracic Oncology tissue bank, with approval from the
Committee on Human Research (approval number: H8714-11647-10). The
patient samples were collected between February 2011 and October
2016. There were 24 men and 13 women in the study cohort, with a
mean age of 57.7±13.2 years (age range, 27–82 years). The patients
only received erlotinib treatment during the study. When
progression occurred, the patients were switched to other
treatments such as chemotherapy. All specimens were snap-frozen in
liquid nitrogen immediately following resection, and then stored at
−170°C until further use. Formalin-fixed paraffin-embedded (FFPE)
samples from the same patient were fixed in PBS buffer with 10%
formalin for 24–48 h at room temperature and embedded in paraffin.
Formalin-fixed paraffin-embedded (FFPE) samples (3 µm thick) were
used for immunohistochemistry staining.
RNA extraction and reverse
transcription quantitative PCR (RT-PCR)
Total RNA was isolated by using the RNeasy kit
(Qiagen GmbH) according to the manufacturer's protocol. Genomic DNA
contamination was eliminated using DNase I, and RT was performed
using 500 ng RNA and the iScript cDNA synthesis kit (Bio-Rad
Laboratories, Inc.) using random hexamer according to the
manufacturer's protocol. The cDNA was analyzed using RT-qPCR n a
7500 Real-Time PCR machine (Thermo Fisher Scientific, Inc.) using
SYBR-Green qPCR Master Mixes (Thermo Fisher Scientific, Inc.). The
following thermocycling conditions were used: Initial denaturation
96°C for 5 min, followed by 40 cycles at 96°C for 15 sec and 60°C
for 1 min. Gene expression was normalized to GAPDH using the
2−ΔΔCq method (47). The
following primer sequences were used: GLI1 forward,
5′-CTCCCGAAGGACAGGTATGTAAC-3′ and GLI1 reverse,
5′-CCCTACTCTTTAGGCACTAGAGTTG-3′, GAPDH forward,
5′-ACAACAGCCTCAAGATCATCAG-3′ and GAPDH reverse,
5′-TCTTCTGGGTGGCAGTGATG-3′ (48).
Immunohistochemistry (IHC)
staining
The UltraVision LP Detection System HRP DAB kit
(cat. no. TL-060-HD; Thermo Fisher Scientific, Inc.) was used
according to the manufacturer's protocol. All steps were carried
out at room temperature except for the primary antibody incubation.
Briefly, FFPE slides were deparaffinized in xylene and rehydrated
in a descending ethanol series from 100–70%. Heat-mediated antigen
retrieval was performed by boiling the slides for 20 min in a
citrate buffer (pH 6.0). Slides were quenched in UltraVision
Hydrogen Peroxide Block for 10 min at room temperature, washed
three times in PBS, and incubated with UltraVision Protein Block
for 5 min at room temperature. After washing once with PBS, the
slides were incubated with rabbit anti-human GLI1 (1:100 diluted in
PBS; Santa Cruz Biotechnology; cat. no. sc-20687) overnight at 4°C.
The slides were washed three times with PBS and incubated with
Primary Antibody Enhancer for 10 min at room temperature, followed
by an incubation with HRP Polymer for 15 min at room temperature.
The slides were re-washed three times with PBS and the color was
developed following incubation with 1:30 dilution of DAB in DAB
Quanto Substrate for 3 min at room temperature. The slides were
subsequently washed four times with distilled water and
counterstained in Mayer's hematoxylin (Thermo Fisher Scientific,
Inc.) for 1 min at room temperature, washed in running tap water
for 10 min and mounted. Images from representative fields were
obtained using an Olympus BX43 light microscope (magnification,
×200; Olympus Corporation) and examined for positive nuclear
staining. IHC staining was blindly scored by two independent
pathologists. IHC score was determined using staining intensity for
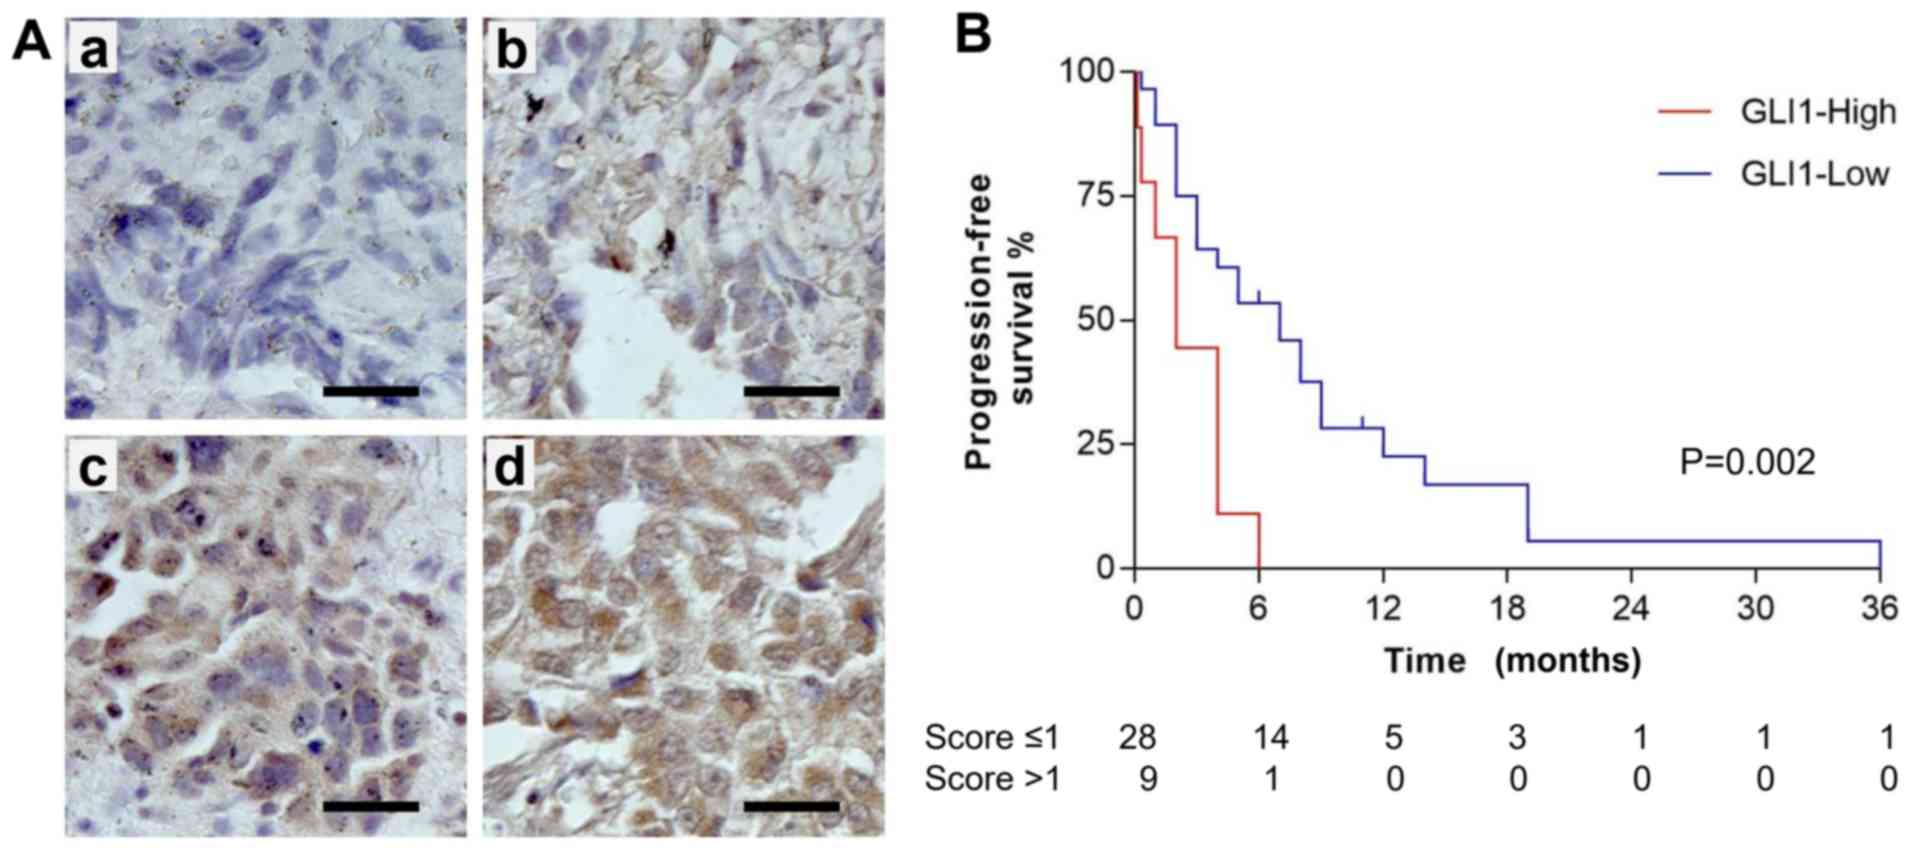
the majority (≥50%) of the tumor cells as shown in Fig. 5A: No staining, 0; light yellow
staining, 1; yellowish/brown staining, 2; strong brown staining,
3.
Western blotting
Cell lysates were prepared by adding 300 ml of M-PER
Mammalian Protein Extraction Reagent (Thermo Fisher Scientific,
Inc.) to 6-well plates. After shaking gently for 5 min at room
temperature, the cell lysates were centrifuged at 14,000 × g for 5
min at 4°C. Total protein concentration was determined using a
Bradford protein assay (Bio-Rad Laboratories, Inc.), 40 µg
protein/lane was separated via 10% SDS-PAGE and the separated
proteins were subsequently transferred onto polyvinylidene
membranes (Sigma-Aldrich; Merck KGaA). The membranes were blocked
with 5% non-fat dry milk for 30 min at room temperature, washed
twice with TBST, and sliced right above the 50 kDa pre-stained
molecular weight markers (Bio-Rad Laboratories, Inc.). The
membranes were incubated with primary antibodies at room
temperature for 2 h (top half: Anti-GLI1 antibody, 1:150 dilution
in 5% BSA, Santa Cruz Biotechnology, sc-20687; bottom half:
Anti-β-actin antibody, 1:500 dilution in 5% BSA, Sigma-Aldrich;
Merck KGaA, A5441). Membranes were washed three times with TBST and
subsequently incubated with secondary antibodies at room
temperature for 1 h (top half: Goat anti-mouse IgG, 1:2,000 in 5%
BSA, Santa Cruz Biotechnology, sc-2005; bottom half: HRP-conjugated
rabbit anti-mouse IgG, 1:100,000 in 5% BSA, Sigma-Aldrich, A9044).
Membranes were re-washed three times with TBST and incubated with
Immobilon ECL Ultra Western HRP Substrate (Sigma-Aldrich; Merck
KGaA) for 5 min at room temperature. The substrate solution was
drained, and the membranes were exposed to X-ray film.
Cell cultures
The following human lung cancer cell lines were
purchased from American Type Culture Collection: A549 (cat. no.
CCL-185), A427 (cat. no. HTB-53), H1299 (cat. no. CRL-5803), H2170
(cat. no. CRL-5928), H1703 (cat. no. CRL-5889), H522 (cat. no.
CRL-5810), H838 (cat. no. CRL-5844), H322 (cat. no. CRL-5806),
H1650 (cat. no. CRL-5883), H1975 (cat. no. CRL-5908), H820 (cat.
no. HTB-181), H441 (cat. no. HTB-174), H460 (cat. no. HTB-177),
H1666 (cat. no. CRL-5885), HCC2935 (cat. no. CRL-2869). All the
cell lines were cultured in RPMI-1640 supplemented with 10% fetal
bovine serum, penicillin (100 IU/ml) and streptomycin (100 µg/ml)
(all purchased from Thermo Fisher Scientific, Inc.) at 37°C in a
humidified incubator with 5% CO2.
RNA interference and cDNA
transfection
For each well of the 6-well plates, 3×10⁵
cells were plated in fresh media without antibiotics for 24 h prior
to transfection. Cells were transfected with either 2 mg pcDNA3.1
vector containing GLI1 cDNA or pcDNA3.1 vector control (Thermo
Fisher Scientific, Inc.) using Lipofectamine® 2000
transfection reagent (Thermo Fisher Scientific, Inc.) according to
the manufacturer's protocol. For RNA interference, cells in 6-well
plates were transfected with 100 pmole of synthesized GLI1 small
interfering (si)RNA (siRNA-1, Assay ID 107670; siRNA-2, Assay ID
115641, Thermo Fisher Scientific, Inc.) or scrambled siRNA using
Lipofectamine® 2000 transfection reagent (Thermo Fisher
Scientific, Inc.) according to the manufacturer's protocol. After
the transfection, the cells were cultured for 48 h before further
analysis with drug treatment.
Cell survival assays and
IC50 determination
Cells were seeded in 96-well plates at a density of
500–1,000 cells/well, and the medium was changed daily.
Logarithmically growing cells were treated with increasing doses
(0.01 µM to 1 mM) of erlotinib and/or with GLI inhibitor
(0.01-10.00 µM), or DMSO control for 3 days. Cells were
subsequently assessed for viability using CellTiter-Glo Luminescent
Cell Viability Assay reagent (Promega Corporation) according to
manufacturer's instructions. Luminescence was measured using a
GloMax-96 Microplate Luminometer (Promega Corporation), and the
percent of cell survival was calculated with the DMSO treated cells
set as 100%. GraphPad Prism v6.0 (GraphPad Software, Inc.) was used
to generate dose-response curves and IC50 values.
Combination index (CI)
A549 or H2170 cells were treated with 0.01–10 µM of
erlotinib alone, GLI inhibitor alone, or the 1:1 combination of the
two drugs for 72 h, and assayed for cell viability. The CalcuSyn
software version 2.0 (Biosoft) was used to calculate the CI to
identify synergistic, additive, or antagonistic drug interactions
for the combination treatment as indicated in Fig. 4, where CI <1 indicates synergism,
CI, 1 indicates additive effects, and CI >1 indicates
antagonism. Synergism was further divided into moderate synergism
(CI, 0.7–0.9), synergism (CI, 0.3–0.7) and strong synergism (CI,
0.1–0.3).
Statistical analysis
The comparisons of IC50 values or cell
viabilities under different experimental conditions were analyzed
using the unpaired Student's t test for two groups, or by one-way
ANOVA followed by Tukey's post hoc test for multiple groups. The
data from three experiments were averaged and plotted as the mean ±
standard deviation. The associations between GLI1 mRNA levels and
IC50 for erlotinib were assessed using Pearson's
correlation coefficient. The Cox proportional hazards model was
used to evaluate the risks in progression-free survival (PFS) for
patients with different GLI1 IHC scores. The Kaplan-Meier plot was
used to illustrate the differences in PFS between the low-risk
group (low GLI1 IHC staining) and high-risk group (high GLI1 IHC
staining). The log-rank test was used to evaluate the differences
in PFS between dichotomous groups defined by patient
characteristics. The Fisher's exact test was used to analyze the
association between GLI expression levels and patient
characteristics. P≤0.05 was considered to indicate a statistically
significant difference.
Results
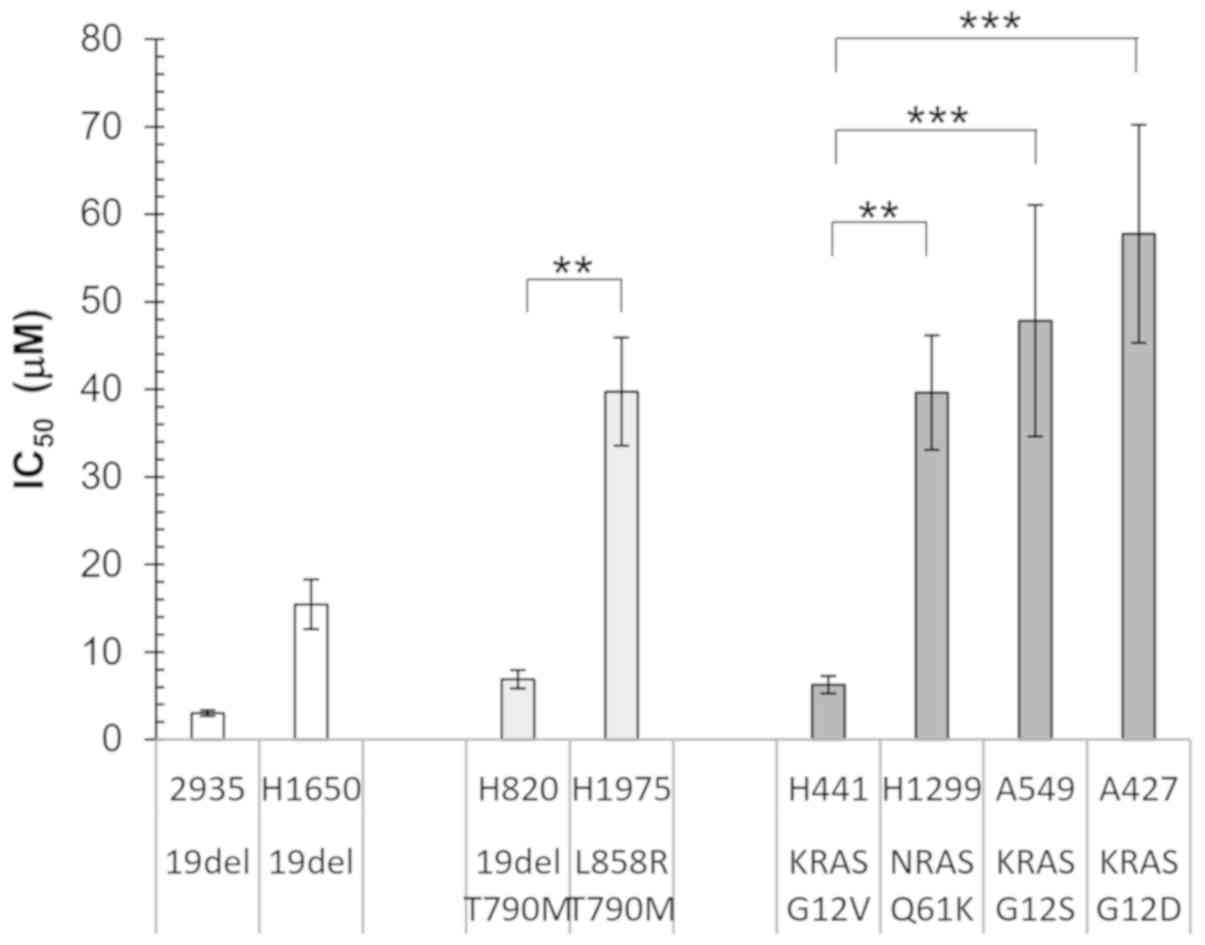
Erlotinib IC50 values are
not associated with driver mutations in NSCLC cell lines
To investigate the association between gene
mutations and erlotinib sensitivity, NSCLC cell lines with
different EGFR and KRAS mutations as reported by COSMIC database
(49,50) were examined (Fig. 1). The HCC2935 and H1650 cell lines
contain the sensitizing exon 19 deletion in EGFR, while the H820
and H1975 cell lines contained both sensitizing EGFR mutation
(E19del and L858R, respectively) and the T790M resistant mutation.
A total of 4 cell lines with mutations in the downstream signaling
protein, RAS were also investigated: A549 with KRAS G12S, H1299
with NRAS Q61K, A427 with KRAS G12D, and H441 with KRAS G12V. It
was hypothesized that the cell lines containing sensitizing EGFR
mutations would have a lower IC50 compared with that
with EGFR T790M or RAS activating mutations.
Unexpectedly, although the cell lines with a double
mutation in EGFR or those with RAS mutations had on average higher
IC50 values, there was a wide range of variability in
the individual cell lines (Fig. 1).
Both the H820 and H1975 cell lines contained the EGFR T790M
mutation, as well as either the sensitizing E19del or L858R
mutation; however, there was a significant difference in the
IC50 values (P<0.01). In addition, for the three cell
lines containing KRAS mutations at the same codon, the
IC50 of H441 (KRAS G12V) was significantly lower
compared with that in A549 (KRAS G12S; P<0.001) and A427 (KRAS
G12D; P<0.001). Furthermore, the H1650 cell line contained the
sensitizing EGFR E19del mutation; however, its IC50 was
not lower compared with that in the H820 (E19del and T790M) and
H441 (KRAS G12V) cell lines. These results indicated that the
analysis of EGFR and RAS hotspot mutations is not sufficient to
predict TKI sensitivity in cell lines, and it is likely that
additional genetic or epigenetic modifications modulate their
response to TKI.
GLI1 expression is associated with
resistance to erlotinib treatment in NSCLC cell lines
During the investigation into GLI1 function, it was
found in a preliminary study that the A549 and A427 cell lines had
high mRNA expression levels GLI1, whereas it was hardly detectable
in H441 cells (data not shown). To investigate whether the mRNA
expression level of GLI1 was correlated with erlotinib sensitivity,
15 NSCLC cell lines with a variety of mutation backgrounds
(Table I) were examined. Among them,
4 cell lines contained EGFR mutations, 7 contained an activating
mutation in the RAS family, and 4 did not contain either of those
mutations (51–57).
 | Table I.Hotspot mutations in non-small cell
lung cancer cell lines. |
Table I.
Hotspot mutations in non-small cell
lung cancer cell lines.
|
| Gene |
|---|
|
|
|
|---|
| Cell line | EGFR (Refs.) | KRAS NRAS HRAS
(Refs.) | BRAF (Refs.) | PIK3CA | ALK/ROS1 MET/RET
(Refs.) | TP53 | Hh/GLI signal
pathway | Other mutation
(Refs.) |
|---|
| H522 | – | – | – | – | RET
A281Va |
P191fs*b | GLI2
E538Ga |
|
| H1703 | – | – | – |
| ALK
A518Va |
c.919+1G>Tb |
| PDGFRA
ampb (29) |
| A549 | – | KRAS
G12Sb | – | – | – | – | SMO V270I SUFU
T411Ma |
E2A-PBX1b (30) |
| H838 | – | KRAS
G12Cb | – | – | MET
I638La | p.E62*b | – | KEAP1 |
| H1299 | – | NRAS
Q61Kb | – | – | – | TP53
nullb | – |
p.E444*c |
| H322 | – | – | – | – | ALK S289Y
Y262Ha | R248Lb | – | ERBB2
S310Fc |
| H1650 | E19delb | – | – | – | – |
c.673-2A>Gb | – |
|
| H1975 | L858R
T790Mb | – | – | PIK3CA
G118Dc | – | R273Hc | – |
|
| H460 | – | KRAS
Q61Hb | – | PIK3CA
E545Kb | – | – | – | NEK2
G134Da |
| H820 | E19del
T790Mb (31) | – | – | – | MET
ampb (31) | T284Pc | – |
|
| HCC 2935 | E19delb (32) | – | – | – | – | – | – |
|
| H441 | – | KRAS
G12Vb | – | – | – | R158Lb | – | ERBB4 K1247M,
S1246Ra |
| H2170 | – | RHOA
G17Vb (33) | – | PIK3CG
H693Qa | – | R158Gb | – |
|
| H1666 | – | – | BRAF
G466Vb (34) | – | – | – | – |
E2A-PBX1b (30) |
| A427 | – | KRAS
G12Db | – | – | – | – | SMO
R113Ga |
E2A-PBX1b (30) |
As shown in Fig. 2, a
wide range of IC50 values were observed among the
different cell lines. The highest IC50 values (H522 and
H1703) were ~25 fold higher compared with that for the lowest one
(HCC2935). The Pearson's correlation analysis showed that the mRNA
expression levels of GLI1 was significantly correlated with
IC50 for erlotinib (Pearson's correlation co-efficient
r=0.747; P<0.01).
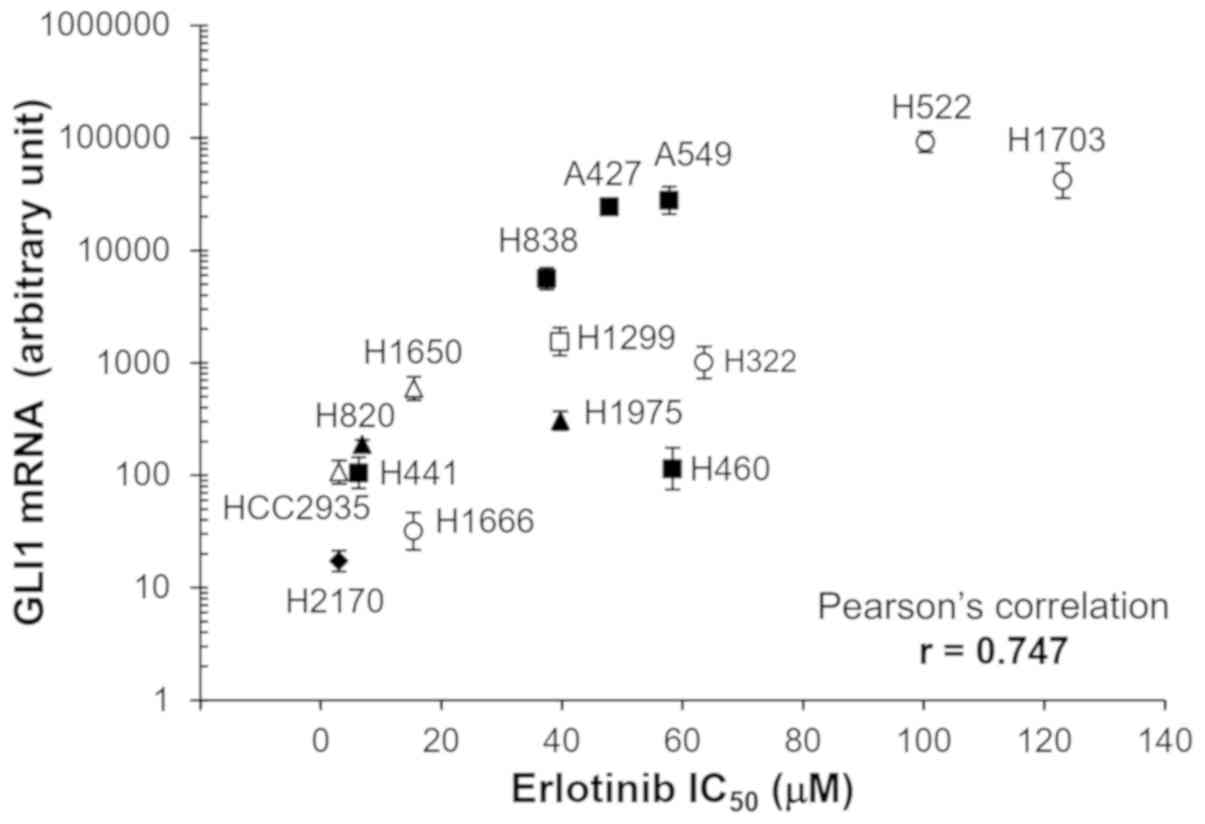 | Figure 2.Correlation between GLI1 mRNA
expression levels and erlotinib sensitivity. GLI1 expression in the
different cell lines were measured using reverse
transcription-quantitative PCR and normalized to GAPDH using
2−ΔΔCq method (47). The
error bars represent SDs from three experiments. Different symbols
represent cell lines with different types of mutations. Open
triangle, cells with EGFR sensitizing mutation (HCC2935 and H1650,
both with E19del); filled triangle, cells with EGFR sensitizing
mutation and resistant mutation (H820, 19del and T790M; H1975,
L858R and T790M); filled square, cells with KRAS mutation (H441,
G12V; H838, G12C; A427, G12D; A549, G12S; H460, Q61H); open square,
cells with NRAS mutation (H1299, Q61K); filled diamond, cells with
RAS family mutation (H2170, RHOA G17V); open circle, cells without
common driver mutations in EGFR and RAS family (H1666, H322, H522,
H1730). |
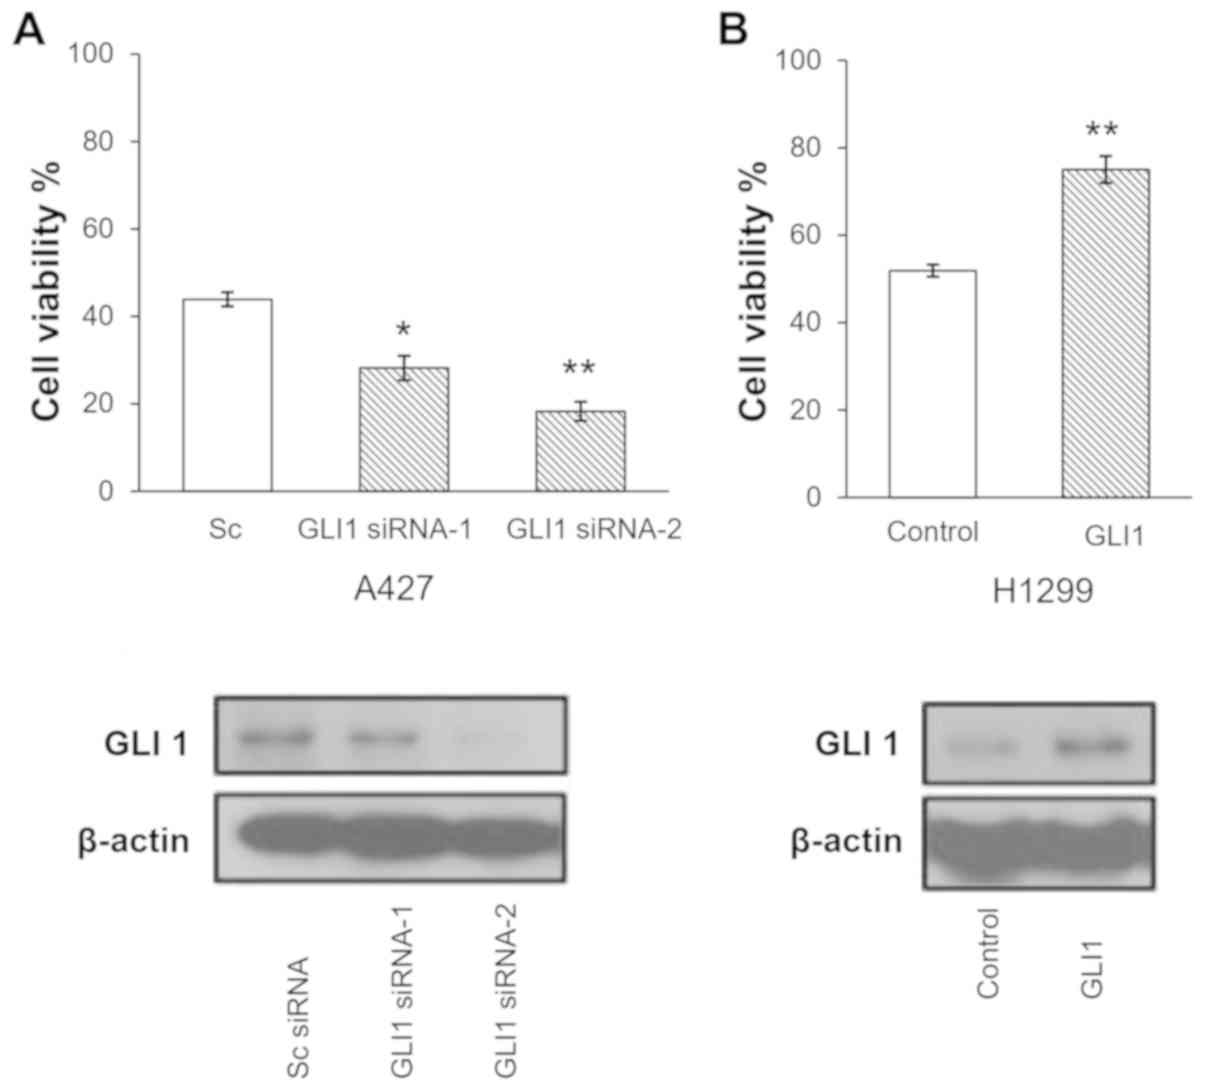
GLI1 expression influences erlotinib
sensitivity in lung cancer cells
To investigate the function of GLI1 expression in
erlotinib sensitivity, A427 cells, which is one of the cell lines
with a high mRNA expression level of GLI1, were transfected with
GLI1 siRNA-1, GLI1 siRNA-2, or scrambled control siRNA,
respectively for 2 days, followed by a treatment with 25 µM
erlotinib for 3 days. A total of two GLI1 siRNAs were used to
ensure that the observed phenomena were due the silencing of GLI1
instead of the off-target effect a certain siRNA. As shown in
Fig. 3A, the downregulation of GLI1
by siRNA sensitized A427 cells to erlotinib treatment (P<0.03
and P<0.008 for siRNA-1 and siRNA-2, respectively).
Subsequently, the effect of GLI1 overexpression on
erlotinib sensitivity was assessed. H1299 cells, which has a
moderate level of GLI1 mRNA expression as shown in Fig. 2, were transfected with GLI1
expression vector or a control vector for 2 days, followed by
treatment with 30 mM erlotinib for 3 days. As shown in Fig. 3B, upon GLI1 overexpression, the cells
exhibited increased viability in the presence of 30 µM
erlotinib.
Taken together, the results suggested that GLI1
modulates erlotinib sensitivity in lung cancer cells, and that high
GLI1 mRNA levels may be a critical and independent mechanism to
confer resistance to erlotinib in lung cancer.
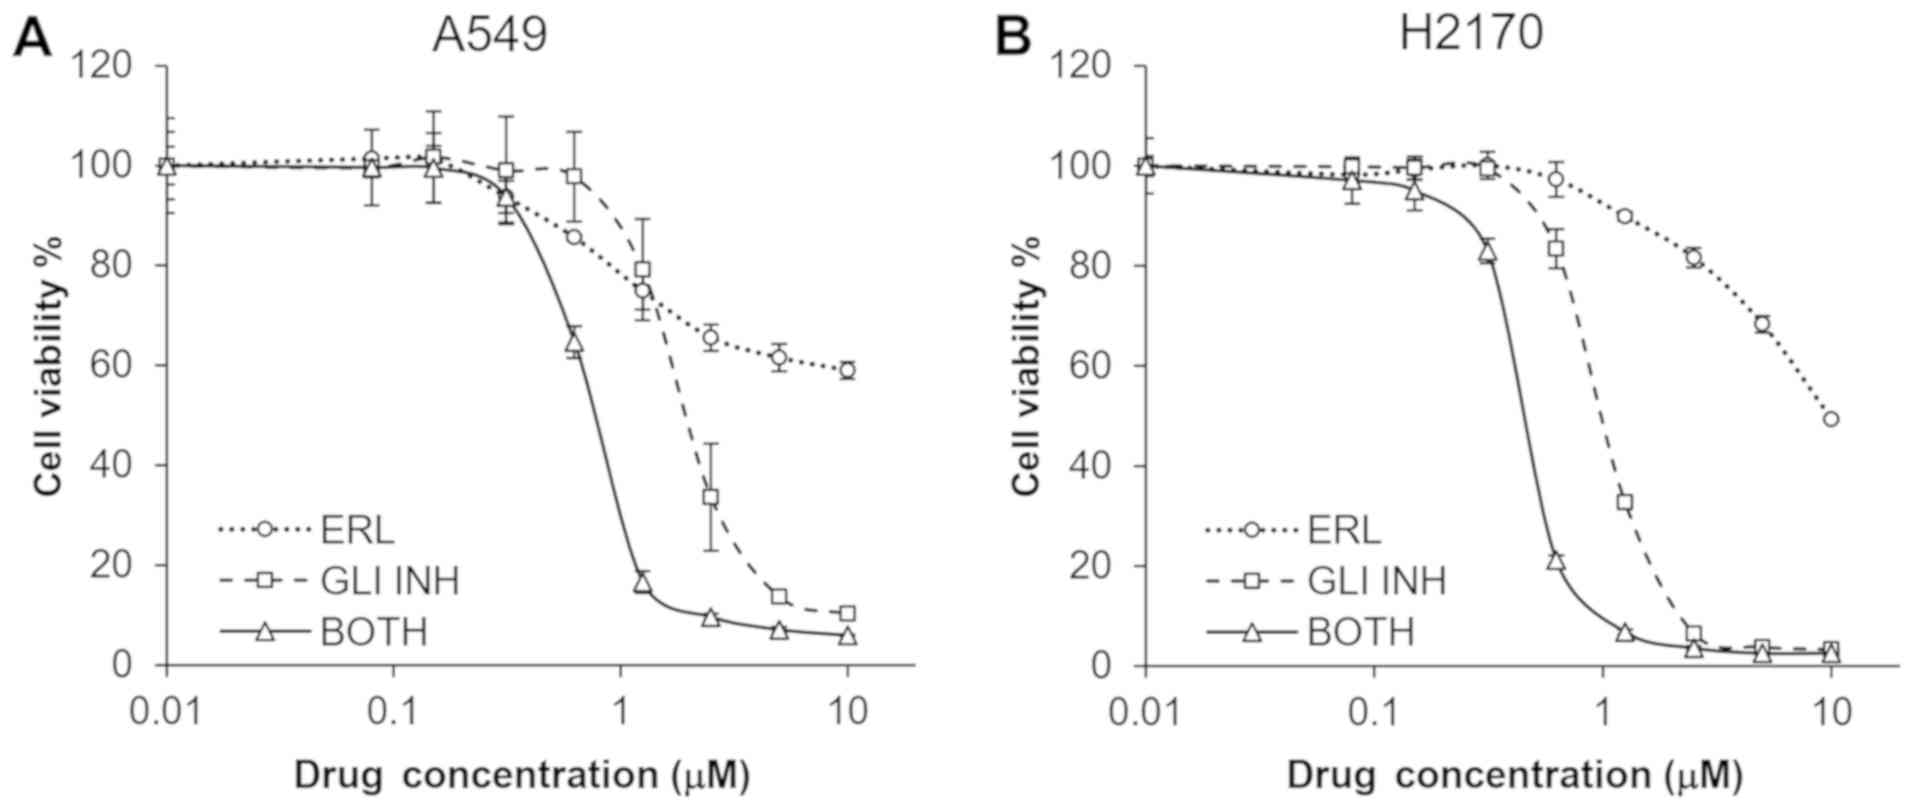
Combination treatment of a GLI1
inhibitor and erlotinib synergistically suppressed proliferation of
lung cell lines
Subsequently, two NSCLC cell lines, H2170 and A549,
were treated with both a small molecule GLI inhibitor (58) and different concentrations of
erlotinib for 72 h. The combination treatment synergistically
suppressed proliferation of both the H2170 and A549 cell lines
(Fig. 4). CalcuSyn analysis showed
that the CI for the two compounds was 0.173 and 0.231 for H2170 and
A549, respectively, suggesting a strong synergism of the two drugs
in both cell lines.
GLI1 expression is associated with
progression-free survival in NSCLC patients receiving erlotinib
treatment
To investigate the clinical relevance of GLI1 as a
predictive biomarker for EGFR-TKI therapy, a retrospective study
was conducted in a cohort of 37 lung cancer patients that received
erlotinib treatment. More than half of the patients progressed
within 6 months of erlotinib treatment. Only one patient was
progression-free for 36 months. The median follow-up time was 4
months, with a range of 0.13 to 36 months. FFPE tissue specimens
were collected in the surgeries before erlotinib treatment and were
analyzed by IHC staining. The slides were scored according to the
standard protocol (Fig. 5A, with
panel a-d showing representative staining of score 0, 1, 2 and 3,
respectively). The mean IHC score (± standard deviation) for the
cohort was 0.95 (±0.76). By using a Cox proportional hazards model,
it was calculated that for every 1-point increase in the IHC score,
patients were 2.1 (95% confidence interval, 1.30–3.32) times more
likely to progress or die.
Subsequently, each case was asigned to either
GLI1-low (IHC score ≤1) or GLI-high (IHC score >1) groups.
Kaplan-Meier curves for progression-free survival (PFS) of GLI1-low
(28 cases) and GLI1-high (9 cases) groups of patients with lung
cancer receiving erlotinib treatment are presented in Fig. 5B, which revealed a significant
difference in PFS by the log-rank test (P=0.0021). The data
indicated that PFS in patients receiving erlotinib treatment was
significantly improved for those with a low GLI1 expression
compared with those with a high GLI1 expression. No statistically
significant differences were observed between the dichotomous
groups defined by other clinicopathological characteristics such as
sex, smoker, age or tumor stage (Table
II). Notably, more GLI1-high cases were observed in the
squamous cell carcinoma subgroup in comparison with the
adenocarcinoma subgroup (P=0.034), although the two pathological
subgroups did not show a significant difference in PFS. When the
PFS of the adenocarcinomas (25 samples) was analyzed, the
association between high GLI1 expression and poor PFS was also
observed (P=0.0020). The squamous cell carcinomas (9 samples) did
not show a significant difference in PFS between the GLI1-high and
GLI1-low groups, probably due to the small number of cases. In
summary, the result suggests that GLI1 may be a predictive
biomarker for patients treated with EGFR-TKI.
| Table II.Analysis of GLII levels and other
clinicopathological variables for patient survival. |
Table II.
Analysis of GLII levels and other
clinicopathological variables for patient survival.
|
| Expression
analysis | Survival
analysis |
|---|
|
|
|
|
|---|
| Clinicopathological
variable | GLI1-high, n
(%) | GLI1-low, n
(%) |
P-valuea |
MeanPFSd,
months |
P-valueb |
|---|
| Sex |
|
|
|
|
|
|
Male | 6 (25.0) | 18 (75.0) | >0.999 | 5.2 | 0.575 |
|
Female | 3 (23.1) | 10 (76.9) |
| 7.1 |
|
| Smoker |
|
|
|
|
|
|
Yes | 6 (35.3) | 11 (64.7) | 0.251 | 7.3 | 0.873 |
| No | 3 (15.0) | 17 (85.0) |
| 4.8 |
|
| Pathological
subtypec |
|
|
|
|
|
|
Adeno | 4 (16.0) | 21 (84.0) | 0.034 | 7.0 | 0.236 |
|
Squamous | 5 (55.6) | 4 (44.4) |
| 4.5 |
|
| Age, years |
|
|
|
|
|
|
<60 | 4 (21.1) | 15 (78.9) | 0.714 | 5.7 | 0.872 |
|
>60 | 5 (27.8) | 13 (72.2) |
| 7.2 |
|
| Stage |
|
|
|
|
|
|
III | 3 (42.9) | 4 (57.1) | 0.327 | 3.8 | 0.241 |
| IV | 6 (20.0) | 24 (80.0) |
| 7.0 |
|
Discussion
The present study found that GLI1 expression was
associated with the resistance to EGFR-TKI treatment in lung cancer
cell lines. To the best of our knowledge, the current study has
also revealed for the first time that erlotinib-treated lung cancer
patients with low GLI1 expression had significantly improved
progression-free survival compared with those with high GLI1
expression.
The association between GLI1 expression and lung
cancer prognosis has been investigated previously. Gialmanidis
et al (59) examined 80 NSCLC
cases using IHC staining of the Hh and Patched pathway proteins,
and found a significant association between lymph node metastases
and nuclear GLI1 immunolocalization in adenocarcinomas. The
survival of patients, however, was not reported. Ishikawa et
al (48) examined the mRNA
expression levels of GLI1 using RT-qPCR in 102 patients with stage
II–IV lung adenocarcinoma following surgical resection, and found
that the top 15% ranked cases according to mRNA expression had a
hazard ratio of 3.1 (95% CI, 1.5–6.2) for tumor progression.
Notably, the prognosis was unrelated to EGFR mutation status, which
had a hazard ratio of 1.1 (95% CI, 0.58–2.0). Bora-Singhal et
al (60) analyzed GLI1 mRNA
levels from a public database with 360 NSCLC cases, which had been
determined using an Affymatrix microarray, and found that high GLI1
mRNA levels was associated with poorer overall survival (P=0.04).
Recently, mesenchyme homeobox 2-dependent GLI1 protein expression
was found to be associated with clinical progression and poorer
overall survival in a cohort of 90 patients with NSCLC undergoing
platinum-based oncological therapy with both EGFR-non-mutated and
EGFR-mutated statuses (61). Taken
together, these studies showed that in general, a higher GLI1
expression has been associated with a poorer prognosis in NSCLC
(62).
To the best of our knowledge, the current study, has
for the first time, investigated the association between GLI1
expression levels and TKI treatment outcome in patients with NSCLC.
It was found that the high level of the IHC staining of the GLI1
protein was significantly associated with poor progression-free
survival in patients treated with erlotinib. The overall survival,
however, did not reach statistical significance (data not shown).
This could be due to several reasons. Firstly, the cohort might
have been not large enough to reach statistical significance. In
future studies, a different cohort with more samples should be
collected from an independent source to further validate the
observed association. Secondly, tumor cells may accumulate
additional mutations during the course of treatment, which might
have affected GLI1 expression levels. It was well-known that
resistance to TKI treatment, such as gefitinib and erlotinib,
develops within a year (20,63) due to different mechanisms, including
EGFR T790M mutation (13), HER2
(15) or MET amplification (16), or mutations in additional oncogenes
(20), such as KRAS (14) or PIK3CA (64). The levels of GLI1 may change
accordingly and differ from those in the original tumors. Thus,
continuously monitoring the expression levels of GLI1 would provide
additional information. However, the tissues are typically
unavailable following the initial surgery or biopsy, which impedes
the IHC analysis. With the development and approval of novel
technology for evaluating mRNA or protein expression levels using
circulating nucleic acid or exosomes, such measurements may become
feasible in the near future.
It had been reported that the squamous cell
carcinomas (SCC) of the lung, which accounts for ~30% of the NSCLC
cases, has a worse prognosis than the adenocarcinoma subtype
(65,66). Notably, in the present study the SCC
subtype had a higher percentage of cases with high GLI1 expression
(Table II), but no significant
difference in the PFS of SCC was observed in comparison with that
of the adenocarcinoma subtype. This may have been due to the small
sample size used in the current study (9 SCC cases). The
contribution of GLI1 in the prognosis of SCC will be investigated
by using a larger cohort in prospective studies.
As further evidence to support the critical role of
GLI1 in resistance to erlotinib, it was found that changes in the
GLI1 levels affected the sensitivity to the erlotinib treatment in
lung cancer cell lines (Fig. 3).
Downregulation of GLI1 expression using siRNA transfection
sensitized lung cancer cells to erlotinib treatment, while
upregulation of GLI1 increased resistance to erlotinib treatment.
Together, the data suggests that a high GLI1 level may be a
critical mechanism for erlotinib resistance, and that GLI1 may
serve as an independent predictive biomarker for the efficacy of
EGFR-TKIs in lung cancer.
If GLI1 is involved in TKI sensitivity, it may be
envisioned that pharmacological inhibition of GLI1 function may
sensitize the cells to TKI treatment. Indeed, the combination
treatment of a GLI inhibitor and erlotinib synergistically
suppressed proliferation of the H2170 and A549 lung cancer cell
lines in vitro compared with that in each single agent alone
(Fig. 4). Similarly, Bai et
al (67) reported that A549 and
H1975 cells, which had high levels of GLI1 expression, were
resistant to another EGFR TKI, gefitinib, and the use of the SMO
inhibitor, SANT-1, showed a synergistic effect with gefitinib in
A549 and H1975 cell lines. Recently, it was reported that the
downregulation of GLI1 using microRNA-873 in the PC9 lung cancer
cell line enhanced its sensitivity to gefitinib (68), which is consistent with the current
study. In the future, with the development of safe and efficient
GLI1 inhibitors, combination treatment of different EGFR-TKIs and
GLI inhibitors may be investigated.
In summary, the present study addressed the critical
role that GLI1 may play in EGFR-TKI resistance in lung cancer and
provides a novel molecular basis to develop novel strategies for
the treatment of lung cancer. As GLI activation has been suggested
to be a putative key control point of both canonical Hh signaling
(29) and non-canonical oncogenic
pathways, such as EGFR (41,42), combinations of GLI inhibitors with
EGFR-TKIs could overcome the ineffectiveness of single agent
treatments and may prolong the duration of clinical benefits from
these agents.
Acknowledgements
The authors would like to acknowledge the
contributions of Ms Pu Xue and Ms Fang Wang regarding the cell
cultures (Zhejiang Provincial Key Laboratory of Applied Enzymology
and Precision medicine Center of the Yangze Delta Region Institute
of Tsinghua University Zhejiang).
Funding
This study was supported by the National Science
Foundation for Young Scientists of China (grant no. 81902910),
Zhejiang Provincial Natural Science Foundation of China (grant no.
LY15H160048), Jiaxing Science and Technology Project (grant no.
2015BZ12001) and Jiaxing Nanhu District Science and Technology
Project (grant no. 2018QC03).
Availability of data and materials
The datasets used and/or analyzed during the current
study are available from the corresponding author upon reasonable
request.
Authors' contributions
ZD, YW and PZ performed IHC staining of clinical
samples and analyzed the IHC data. XY, YW and ZD analyzed clinical
outcome data. VD, MZ, CH, and YL performed experiments involving
cell culture, drug treatments, and viability assays. VD and FZ
performed RT-qPCR. ZD, FD and HS conceived the study, participated
in its design and coordination, and drafted the manuscript. All
authors read and approved the final manuscript.
Ethics approval and consent to
participate
This investigation has been conducted in accordance
to the ethical standards of the Declaration of Helsinki, as well as
national and international guidelines, with the approval of the
institutional review board of the University of California, San
Francisco (UCSF). Studies involving patient tissues were approved
by the Committee on Human Research (approval number:
H8714-11647-10) at UCSF, and written informed consent was obtained
from each patient prior to tissue specimen collection.
Patient consent for publication
Written consent for publishing results of the study
involving tissue specimens was obtained from each patient prior to
the study.
Competing interests
The authors declare that they have no competing
interests.
References
|
1
|
Boloker G, Wang C and Zhang J: Updated
statistics of lung and bronchus cancer in United States (2018). J
Thorac Dis. 10:1158–1161. 2018. View Article : Google Scholar : PubMed/NCBI
|
|
2
|
Bray F, Ferlay J, Soerjomataram I, Siegel
RL, Torre LA and Jemal A: Global cancer statistics 2018: GLOBOCAN
estimates of incidence and mortality worldwide for 36 cancers in
185 countries. CA Cancer J Clin. 68:394–424. 2018. View Article : Google Scholar : PubMed/NCBI
|
|
3
|
Duma N, Santana-Davila R and Molina JR:
Non-small cell lung cancer: Epidemiology, screening, diagnosis, and
treatment. Mayo Clin Proc. 94:1623–1640. 2019. View Article : Google Scholar : PubMed/NCBI
|
|
4
|
Siegel RL, Miller KD and Jemal A: Cancer
statistics, 2018. CA Cancer J Clin. 68:7–30. 2018. View Article : Google Scholar : PubMed/NCBI
|
|
5
|
Cronin KA, Lake AJ, Scott S, Sherman RL,
Noone AM, Howlader N, Henley SJ, Anderson RN, Firth AU, Ma J, et
al: Annual report to the nation on the status of cancer, part I:
National cancer statistics. Cancer. 124:2785–2800. 2018. View Article : Google Scholar : PubMed/NCBI
|
|
6
|
Feng RM, Zong YN, Cao SM and Xu RH:
Current cancer situation in China: Good or bad news from the 2018
global cancer statistics? Cancer Commun (Lond). 39:222019.
View Article : Google Scholar : PubMed/NCBI
|
|
7
|
da Cunha Santos G, Shepherd FA and Tsao
MS: EGFR mutations and lung cancer. Annu Rev Pathol. 6:49–69. 2011.
View Article : Google Scholar : PubMed/NCBI
|
|
8
|
Paez JG, Jänne PA, Lee JC, Tracy S,
Greulich H, Gabriel S, Herman P, Kaye FJ, Lindeman N, Boggon TJ, et
al: EGFR mutations in lung cancer: Correlation with clinical
response to gefitinib therapy. Science. 304:1497–1500. 2004.
View Article : Google Scholar : PubMed/NCBI
|
|
9
|
Selvaggi G, Novello S, Torri V, Leonardo
E, De Giuli P, Borasio P, Mossetti C, Ardissone F, Lausi P and
Scagliotti GV: Epidermal growth factor receptor overexpression
correlates with a poor prognosis in completely resected
non-small-cell lung cancer. Ann Oncol. 15:28–32. 2004. View Article : Google Scholar : PubMed/NCBI
|
|
10
|
Sharma SV, Bell DW, Settleman J and Haber
DA: Epidermal growth factor receptor mutations in lung cancer. Nat
Rev Cancer. 7:169–181. 2007. View
Article : Google Scholar : PubMed/NCBI
|
|
11
|
Pao W, Miller VA, Politi KA, Riely GJ,
Somwar R, Zakowski MF, Kris MG and Varmus H: Acquired resistance of
lung adenocarcinomas to gefitinib or erlotinib is associated with a
second mutation in the EGFR kinase domain. PLoS Med. 2:e732005.
View Article : Google Scholar : PubMed/NCBI
|
|
12
|
Kobayashi S, Boggon TJ, Dayaram T, Jänne
PA, Kocher O, Meyerson M, Johnson BE, Eck MJ, Tenen DG and Halmos
B: EGFR mutation and resistance of non-small-cell lung cancer to
gefitinib. N Engl J Med. 352:786–792. 2005. View Article : Google Scholar : PubMed/NCBI
|
|
13
|
Gazdar AF: Activating and resistance
mutations of EGFR in non-small-cell lung cancer: Role in clinical
response to EGFR tyrosine kinase inhibitors. Oncogene. 28 (Suppl
1):S24–S31. 2009. View Article : Google Scholar : PubMed/NCBI
|
|
14
|
Pao W, Wang TY, Riely GJ, Miller VA, Pan
Q, Ladanyi M, Zakowski MF, Heelan RT, Kris MG and Varmus HE: KRAS
mutations and primary resistance of lung adenocarcinomas to
gefitinib or erlotinib. PLoS Med. 2:e172005. View Article : Google Scholar : PubMed/NCBI
|
|
15
|
Takezawa K, Pirazzoli V, Arcila ME, Nebhan
CA, Song X, de Stanchina E, Ohashi K, Janjigian YY, Spitzler PJ,
Melnick MA, et al: HER2 amplification: A potential mechanism of
acquired resistance to EGFR inhibition in EGFR-mutant lung cancers
that lack the second-site EGFRT790M mutation. Cancer Discov.
2:922–933. 2012. View Article : Google Scholar : PubMed/NCBI
|
|
16
|
Engelman JA, Zejnullahu K, Mitsudomi T,
Song Y, Hyland C, Park JO, Lindeman N, Gale CM, Zhao X, Christensen
J, et al: MET amplification leads to gefitinib resistance in lung
cancer by activating ERBB3 signaling. Science. 316:1039–1043. 2007.
View Article : Google Scholar : PubMed/NCBI
|
|
17
|
Massarelli E, Varella-Garcia M, Tang X,
Xavier AC, Ozburn NC, Liu DD, Bekele BN, Herbst RS and Wistuba II:
KRAS mutation is an important predictor of resistance to therapy
with epidermal growth factor receptor tyrosine kinase inhibitors in
non-small-cell lung cancer. Clin Cancer Res. 13:2890–2896. 2007.
View Article : Google Scholar : PubMed/NCBI
|
|
18
|
Dragnev KH, Ma T, Cyrus J, Galimberti F,
Memoli V, Busch AM, Tsongalis GJ, Seltzer M, Johnstone D, Erkmen
CP, et al: Bexarotene plus erlotinib suppress lung carcinogenesis
independent of KRAS mutations in two clinical trials and transgenic
models. Cancer Prev Res (Phila). 4:818–828. 2011. View Article : Google Scholar : PubMed/NCBI
|
|
19
|
Linardou H, Dahabreh IJ, Kanaloupiti D,
Siannis F, Bafaloukos D, Kosmidis P, Papadimitriou CA and Murray S:
Assessment of somatic k-RAS mutations as a mechanism associated
with resistance to EGFR-targeted agents: A systematic review and
meta-analysis of studies in advanced non-small-cell lung cancer and
metastatic colorectal cancer. Lancet Oncol. 9:962–972. 2008.
View Article : Google Scholar : PubMed/NCBI
|
|
20
|
Wu SG and Shih JY: Management of acquired
resistance to EGFR TKI-targeted therapy in advanced non-small cell
lung cancer. Mol Cancer. 17:382018. View Article : Google Scholar : PubMed/NCBI
|
|
21
|
Merchant AA and Matsui W: Targeting
hedgehog-a cancer stem cell pathway. Clin Cancer Res. 16:3130–3140.
2010. View Article : Google Scholar : PubMed/NCBI
|
|
22
|
Velcheti V and Govindan R: Hedgehog
signaling pathway and lung cancer. J Thorac Oncol. 2:7–10. 2007.
View Article : Google Scholar : PubMed/NCBI
|
|
23
|
Amakye D, Jagani Z and Dorsch M:
Unraveling the therapeutic potential of the hedgehog pathway in
cancer. Nat Med. 19:1410–1422. 2013. View Article : Google Scholar : PubMed/NCBI
|
|
24
|
Yuan Z, Goetz JA, Singh S, Ogden SK, Petty
WJ, Black CC, Memoli VA, Dmitrovsky E and Robbins DJ: Frequent
requirement of hedgehog signaling in non-small cell lung carcinoma.
Oncogene. 26:1046–1055. 2007. View Article : Google Scholar : PubMed/NCBI
|
|
25
|
Giroux-Leprieur E, Costantini A, Ding VW
and He B: Hedgehog signaling in lung cancer: From oncogenesis to
cancer treatment resistance. Int J Mol Sci. 19:28352018. View Article : Google Scholar
|
|
26
|
Niyaz M, Khan MS and Mudassar S: Hedgehog
signaling: An achilles' heel in cancer. Transl Oncol. 12:1334–1344.
2019. View Article : Google Scholar : PubMed/NCBI
|
|
27
|
Sabol M, Trnski D, Musani V, Ozretić P and
Levanat S: Role of GLI transcription factors in pathogenesis and
their potential as new therapeutic targets. Int J Mol Sci.
19:25622018. View Article : Google Scholar
|
|
28
|
Ruiz i Altaba A: Gli proteins encode
context-dependent positive and negative functions: Implications for
development and disease. Development. 126:3205–3216.
1999.PubMed/NCBI
|
|
29
|
Hui CC and Angers S: Gli proteins in
development and disease. Annu Rev Cell Dev Biol. 27:513–537. 2011.
View Article : Google Scholar : PubMed/NCBI
|
|
30
|
Niewiadomski P, Niedziółka SM, Markiewicz
Ł, Uśpieński T, Baran B and Chojnowska K: Gli proteins: Regulation
in development and cancer. Cells. 8:1472019. View Article : Google Scholar
|
|
31
|
Sasaki H, Nishizaki Y, Hui C, Nakafuku M
and Kondoh H: Regulation of Gli2 and Gli3 activities by an
amino-terminal repression domain: Implication of Gli2 and Gli3 as
primary mediators of Shh signaling. Development. 126:3915–3924.
1999.PubMed/NCBI
|
|
32
|
Yang L, Xie G, Fan Q and Xie J: Activation
of the hedgehog-signaling pathway in human cancer and the clinical
implications. Oncogene. 29:469–481. 2010. View Article : Google Scholar : PubMed/NCBI
|
|
33
|
Sekulic A, Migden MR, Oro AE, Dirix L,
Lewis KD, Hainsworth JD, Solomon JA, Yoo S, Arron ST, Friedlander
PA, et al: Efficacy and safety of vismodegib in advanced basal-cell
carcinoma. N Engl J Med. 366:2171–2179. 2012. View Article : Google Scholar : PubMed/NCBI
|
|
34
|
Basset-Séguin N, Hauschild A, Kunstfeld R,
Grob J, Dréno B, Mortier L, Ascierto PA, Licitra L, Dutriaux C,
Thomas L, et al: Vismodegib in patients with advanced basal cell
carcinoma: Primary analysis of STEVIE, an international, open-label
trial. Eur J Cancer. 86:334–348. 2017. View Article : Google Scholar : PubMed/NCBI
|
|
35
|
Lear JT, Migden MR, Lewis KD, Chang ALS,
Guminski A, Gutzmer R, Dirix L, Combemale P, Stratigos A, Plummer
R, et al: Long-term efficacy and safety of sonidegib in patients
with locally advanced and metastatic basal cell carcinoma: 30-month
analysis of the randomized phase 2 BOLT study. J Eur Acad Dermatol
Venereol. 32:372–381. 2018. View Article : Google Scholar : PubMed/NCBI
|
|
36
|
Rodon J, Tawbi HA, Thomas AL, Stoller RG,
Turtschi CP, Baselga J, Sarantopoulos J, Mahalingam D, Shou Y,
Moles MA, et al: A phase I, multicenter, open-label,
first-in-human, dose-escalation study of the oral smoothened
inhibitor Sonidegib (LDE225) in patients with advanced solid
tumors. Clin Cancer Res. 20:1900–1909. 2014. View Article : Google Scholar : PubMed/NCBI
|
|
37
|
Kieran MW, Chisholm J, Casanova M, Brandes
AA, Aerts I, Bouffet E, Bailey S, Leary S, MacDonald TJ, Mechinaud
F, et al: Phase I study of oral sonidegib (LDE225) in pediatric
brain and solid tumors and a phase II study in children and adults
with relapsed medulloblastoma. Neuro Oncol. 19:1542–1552. 2017.
View Article : Google Scholar : PubMed/NCBI
|
|
38
|
Minami H, Ando Y, Ma BB, Hsiang Lee J,
Momota H, Fujiwara Y, Li L, Fukino K, Ito K, Tajima T, et al: Phase
I, multicenter, open-label, dose-escalation study of sonidegib in
Asian patients with advanced solid tumors. Cancer Sci.
107:1477–1483. 2016. View Article : Google Scholar : PubMed/NCBI
|
|
39
|
Ko AH, LoConte N, Tempero MA, Walker EJ,
Kate Kelley R, Lewis S, Chang WC, Kantoff E, Vannier MW, Catenacci
DV, et al: A Phase I study of FOLFIRINOX plus IPI-926, a hedgehog
pathway inhibitor, for advanced pancreatic adenocarcinoma.
Pancreas. 45:370–375. 2016. View Article : Google Scholar : PubMed/NCBI
|
|
40
|
Jimeno A, Weiss GJ, Miller WH Jr,
Gettinger S, Eigl BJ, Chang AL, Dunbar J, Devens S, Faia K, Skliris
G, et al: Phase I study of the hedgehog pathway inhibitor IPI-926
in adult patients with solid tumors. Clin Cancer Res. 19:2766–2774.
2013. View Article : Google Scholar : PubMed/NCBI
|
|
41
|
Lauth M and Toftgård R: Non-canonical
activation of GLI transcription factors: Implications for targeted
anti-cancer therapy. Cell Cycle. 6:2458–2463. 2007. View Article : Google Scholar : PubMed/NCBI
|
|
42
|
Mimeault M and Batra SK: Frequent
deregulations in the hedgehog signaling network and cross-talks
with the epidermal growth factor receptor pathway involved in
cancer progression and targeted therapies. Pharmacol Rev.
62:497–524. 2010. View Article : Google Scholar : PubMed/NCBI
|
|
43
|
Ou SI and Shirai K: Anaplastic lymphoma
kinase (ALK) signaling in lung cancer. Adv Exp Med Biol.
893:179–187. 2016. View Article : Google Scholar : PubMed/NCBI
|
|
44
|
Garrido-Castro AC and Felip E: HER2 driven
non-small cell lung cancer (NSCLC): Potential therapeutic
approaches. Transl Lung Cancer Res. 2:122–127. 2013.PubMed/NCBI
|
|
45
|
Benvenuto M, Masuelli L, De Smaele E,
Fantini M, Mattera R, Cucchi D, Bonanno E, Di Stefano E, Frajese
GV, Orlandi A, et al: In vitro and in vivo inhibition of breast
cancer cell growth by targeting the Hedgehog/GLI pathway with SMO
(GDC-0449) or GLI (GANT-61) inhibitors. Oncotarget. 7:9250–9270.
2016. View Article : Google Scholar : PubMed/NCBI
|
|
46
|
Srivastava RK, Kaylani SZ, Edrees N, Li C,
Talwelkar SS, Xu J, Palle K, Pressey JG and Athar M: GLI inhibitor
GANT-61 diminishes embryonal and alveolar rhabdomyosarcoma growth
by inhibiting Shh/AKT-mTOR axis. Oncotarget. 5:12151–12165. 2014.
View Article : Google Scholar : PubMed/NCBI
|
|
47
|
Livak KJ and Schmittgen TD: Analysis of
relative gene expression data using real-time quantitative PCR and
the 2(-Delta Delta C(T)) method. Methods. 25:402–408. 2001.
View Article : Google Scholar : PubMed/NCBI
|
|
48
|
Ishikawa M, Sonobe M, Imamura N, Sowa T,
Shikuma K and Date H: Expression of the GLI family genes is
associated with tumor progression in advanced lung adenocarcinoma.
World J Surg Oncol. 12:2532014. View Article : Google Scholar : PubMed/NCBI
|
|
49
|
Tate JG, Bamford S, Jubb HC, Sondka Z,
Beare DM, Bindal N, Boutselakis H, Cole CG, Creatore C, Dawson E,
et al: COSMIC: The catalogue of somatic mutations in cancer.
Nucleic Acids Res. 47:D941–D947. 2019. View Article : Google Scholar : PubMed/NCBI
|
|
50
|
Forbes SA, Tang G, Bindal N, Bamford S,
Dawson E, Cole C, Kok CY, Jia M, Ewing R, Menzies A, et al: COSMIC
(the Catalogue of Somatic Mutations in Cancer): A resource to
investigate acquired mutations in human cancer. Nucleic Acids Res.
38:D652–D657. 2010. View Article : Google Scholar : PubMed/NCBI
|
|
51
|
Ramos AH, Dutt A, Mermel C, Perner S, Cho
J, Lafargue CJ, Johnson LA, Stiedl AC, Tanaka KE, Bass AJ, et al:
Amplification of chromosomal segment 4q12 in non-small cell lung
cancer. Cancer Biol Ther. 8:2042–2050. 2009. View Article : Google Scholar : PubMed/NCBI
|
|
52
|
Mo ML, Chen Z, Zhou HM, Li H, Hirata T,
Jablons DM and He B: Detection of E2A-PBX1 fusion transcripts in
human non-small-cell lung cancer. J Exp Clin Cancer Res. 32:292013.
View Article : Google Scholar : PubMed/NCBI
|
|
53
|
Bean J, Brennan C, Shih JY, Riely G, Viale
A, Wang L, Chitale D, Motoi N, Szoke J, Broderick S, et al: MET
amplification occurs with or without T790M mutations in EGFR mutant
lung tumors with acquired resistance to gefitinib or erlotinib.
Proc Natl Acad Sci USA. 104:20932–20937. 2007. View Article : Google Scholar : PubMed/NCBI
|
|
54
|
Minakata K, Takahashi F, Nara T, Hashimoto
M, Tajima K, Murakami A, Nurwidya F, Yae S, Koizumi F, Moriyama H,
et al: Hypoxia induces gefitinib resistance in non-small-cell lung
cancer with both mutant and wild-type epidermal growth factor
receptors. Cancer Sci. 103:1946–1954. 2012. View Article : Google Scholar : PubMed/NCBI
|
|
55
|
Cortes JR, Ambesi-Impiombato A, Couronné
L, Quinn SA, Kim CS, da Silva Almeida AC, West Z, Belver L, Martin
MS, Scourzic L, et al: RHOA G17V induces T follicular helper cell
specification and promotes lymphomagenesis. Cancer Cell.
33:259–273.e7. 2018. View Article : Google Scholar : PubMed/NCBI
|
|
56
|
Pratilas CA, Hanrahan AJ, Halilovic E,
Persaud Y, Soh J, Chitale D, Shigematsu H, Yamamoto H, Sawai A,
Janakiraman M, et al: Genetic predictors of MEK dependence in
non-small cell lung cancer. Cancer Res. 68:9375–9383. 2008.
View Article : Google Scholar : PubMed/NCBI
|
|
57
|
Landrum MJ, Lee JM, Riley GR, Jang W,
Rubinstein WS, Church DM and Maglott DR: ClinVar: Public archive of
relationships among sequence variation and human phenotype. Nucleic
Acids Res. 42:D980–D985. 2014. View Article : Google Scholar : PubMed/NCBI
|
|
58
|
Bosco-Clément G, Zhang F, Chen Z, Zhou HM,
Li H, Mikami I, Hirata T, Yagui-Beltran A, Lui N, Do HT, et al:
Targeting Gli transcription activation by small molecule suppresses
tumor growth. Oncogene. 33:2087–2097. 2014. View Article : Google Scholar : PubMed/NCBI
|
|
59
|
Gialmanidis IP, Bravou V, Amanetopoulou
SG, Varakis J, Kourea H and Papadaki H: Overexpression of hedgehog
pathway molecules and FOXM1 in non-small cell lung carcinomas. Lung
Cancer. 66:64–74. 2009. View Article : Google Scholar : PubMed/NCBI
|
|
60
|
Bora-Singhal N, Perumal D, Nguyen J and
Chellappan S: Gli1-mediated regulation of Sox2 facilitates
self-renewal of stem-like cells and confers resistance to EGFR
inhibitors in non-small cell lung cancer. Neoplasia. 17:538–551.
2015. View Article : Google Scholar : PubMed/NCBI
|
|
61
|
Armas-López L, Piña-Sánchez P, Arrieta O,
de Alba EG, Ortiz-Quintero B, Santillán-Doherty P, Christiani DC,
Zúñiga J and Ávila-Moreno F: Epigenomic study identifies a novel
mesenchyme homeobox2-GLI1 transcription axis involved in cancer
drug resistance, overall survival and therapy prognosis in lung
cancer patients. Oncotarget. 8:67056–67081. 2017. View Article : Google Scholar : PubMed/NCBI
|
|
62
|
Dimou A, Bamias A, Gogas H and Syrigos K:
Inhibition of the hedgehog pathway in lung cancer. Lung Cancer.
133:56–61. 2019. View Article : Google Scholar : PubMed/NCBI
|
|
63
|
Nguyen KS, Kobayashi S and Costa DB:
Acquired resistance to epidermal growth factor receptor tyrosine
kinase inhibitors in non-small-cell lung cancers dependent on the
epidermal growth factor receptor pathway. Clin Lung Cancer.
10:281–289. 2009. View Article : Google Scholar : PubMed/NCBI
|
|
64
|
Sequist LV, Waltman BA, Dias-Santagata D,
Digumarthy S, Turke AB, Fidias P, Bergethon K, Shaw AT, Gettinger
S, Cosper AK, et al: Genotypic and histological evolution of lung
cancers acquiring resistance to EGFR inhibitors. Sci Transl Med.
3:75ra262011. View Article : Google Scholar : PubMed/NCBI
|
|
65
|
Cooke DT, Nguyen DV, Yang Y, Chen SL, Yu C
and Calhoun RF: Survival comparison of adenosquamous, squamous
cell, and adenocarcinoma of the lung after lobectomy. Ann Thorac
Surg. 90:943–948. 2010. View Article : Google Scholar : PubMed/NCBI
|
|
66
|
Kawase A, Yoshida J, Ishii G, Nakao M,
Aokage K, Hishida T, Nishimura M and Nagai K: Differences between
squamous cell carcinoma and adenocarcinoma of the lung: Are
adenocarcinoma and squamous cell carcinoma prognostically equal?
Jpn J Clin Oncol. 42:189–195. 2012. View Article : Google Scholar : PubMed/NCBI
|
|
67
|
Bai XY, Zhang XC, Yang SQ, An SJ, Chen ZH,
Su J, Xie Z, Gou LY and Wu YL: Blockade of hedgehog signaling
synergistically increases sensitivity to epidermal growth factor
receptor tyrosine kinase inhibitors in non-small-cell lung cancer
cell lines. PLoS One. 11:e01493702016. View Article : Google Scholar : PubMed/NCBI
|
|
68
|
Jin S, He J, Li J, Guo R, Shu Y and Liu P:
MiR-873 inhibition enhances gefitinib resistance in non-small cell
lung cancer cells by targeting glioma-associated oncogene homolog
1. Thorac Cancer. 9:1262–1270. 2018. View Article : Google Scholar : PubMed/NCBI
|