Introduction
According to Global Cancer Statistics for 2018,
gastric cancer (GC) is the fifth most prevalent cancer type and the
third leading cause of cancer-associated mortality worldwide
(1). Of note, its prevalence is
markedly elevated in Eastern Asia. The number of newly diagnosed GC
cases in 2018 was 1,033,701 worldwide and the estimated number of
deaths was 782,685, translating to 1 in every 12 deaths globally
(1). Risk factors commonly
associated with GC include chronic infection with Helicobacter
pylori (H. pylori), environmental factors, low fruit and
vegetable intake, consumption of preserved foods, smoking and
alcohol use (2,3). At present, surgery and chemotherapy are
the major therapeutic strategies used to treat GC (4). However, only a limited number of
patients with GC are diagnosed at early stage, whereas the majority
of patients are diagnosed at advanced stage (5). The 5-year overall survival (OS) rate
for patients with GC was only 27.4% in China in 2010, and 29% in
the United States in 2009 (6,7).
Therefore, it is important to explore the molecular mechanisms
involved in the tumorigenesis and progression of GC, which may
identify novel prognostic biomarkers and treatment targets.
The glutathione S-transferase Mu (GSTM) gene family
consists of five genes identified in humans that are numbered M1-5.
These genes occur as a cluster on chromosome 1p13, which are
arranged in tandem, spanning a 97-kb region, and encode one of
eight distinct classes of glutathione transferases (8–10). The
GSTM gene family is arranged in a 5′-GSTM4-M2-M1-M5-M3-3′ sequence
(9). These genes share a sequence
homology of 60–80% (11). GSTM genes
are generally recognized as detoxifying enzymes involved in the
deactivating conversion of carcinogenic reactive metabolites,
suggesting that these enzymes may have a role in carcinogenesis
(12). To date, there is a lack of
studies focusing on the value of the GSTM family of genes as
prognostic biomarkers in GC.
To investigate the prognostic value and potential
functions of GSTM genes in patients with GC, gene expression data
and survival information from The Cancer Genome Atlas (TCGA) were
analyzed. Subsequently, the Kaplan-Meier (KM) plotter online
database was used to validate mRNA expression levels and the
prognostic value of individual GSTM genes in patients with GC.
Several bioinformatics tools were also used to explore the
potential functions of GSTM genes.
Materials and methods
Functional and co-expression
analyses
To analyze the Gene Ontology (GO) and Kyoto
Encyclopedia of Genes and Genomes (KEGG) enrichment of GSTM genes,
the Database for Annotation, Visualization and Integrated Discovery
(DAVID) version 6.8; (https://david.ncifcrf.gov/home.jsp; accessed March 1,
2018) was used (13,14). The functional examination based on GO
includes the categories molecular function (MF), biological process
(BP) and cellular component (CC). To evaluate gene-gene networks,
the Gene Multiple Association Network Integration Algorithm
(GeneMANIA) version 3.6.0 (http://www.genemania.org; accessed May 20, 2019),
which predicted gene functions, was used (15,16). The
Search Tool for the Retrieval of Interacting Genes (STRING) version
11.0 (https://string-db.org; accessed May 20,
2019) database was used to search and analyze protein-protein
interaction (PPI) networks (17).
Co-expression matrix
A co-expression matrix of GSTM genes was constructed
using mRNA expression data from TCGA cohort of GC tumor tissues.
Pearson's correlation coefficient analysis was used to analyze mRNA
co-expression correlations. The co-expression matrix was
constructed using the corrplot package in the R 3.4.4 platform
(18). P<0.05 was considered to
indicate a statistically significant difference.
TCGA
RNA sequencing and clinical information (including
tumor stage, age of patient and sex) linked with GC were downloaded
from TCGA (https://portal.gdc.cancer.gov; accessed August 22,
2018). The TCGA data portal contained 407 patients diagnosed with
GC, which included 375 tumor tissues and 32 adjacent normal
tissues. After removing cases with missing follow-up profiles, a
total of 351 patients with GC from TCGA were analyzed. Clinical
data including clinical tumor-node-metastasis (TNM) stage (19), Lauren classification (20), differentiation grade, human epidermal
growth factor receptor 2 (HER2) status and clinical treatment were
also collected.
Survival analysis
KM survival analyses and log-rank tests were used to
calculate the OS rate and significance. Patients with GC were
separated into high- and low-expression groups of GSTM based on the
median values of expression. To perform univariate and multivariate
survival analyses, the Cox proportional hazards regression model
was used to calculate the hazard ratio (HR), 95% confidence
interval (CI) and log-rank P-values. P<0.05 was considered to
indicate a statistically significant difference.
KM plotter online database
The associations between the mRNA levels of
individual GSTM genes and OS rates were calculated using the KM
plotter online database (http://kmplot.com/analysis/index.php?p=service&cancer=gastric)
(21) based on gene expression data
and survival information of 875 patients with GC downloaded from
the Gene Expression Omnibus (datasets GSE14210, GSE15459, GSE22377,
GSE29272, GSE51105 and GSE62254) (22). This tool was used for the
identification and validation of survival biomarkers. In brief,
GSTM1-5 were entered into the KM plotter online database and
analyzed. Based on the median of mRNA expression for each GSTM
according to the Gene Expression Omnibus, all GC patients were
separated into two groups (high vs. low). Statistical parameters
such as survival plot, HRs, 95% CIs and log-rank P-values were
obtained from KM plotter. P<0.05 was considered to indicate a
statistically significant difference.
Nomogram and stratified analyses
Based on the survival analysis of TCGA and KM
plotter, only GSTM5 was significantly associated with prognosis. A
nomogram was developed and used to evaluate the contribution of
GSTM5 expression and prognostic clinical parameters, including sex,
age and tumor stage, in GC OS. Based on prognostic clinical
indicators and the survival analysis of the Cox regression model,
sex, age, stage and GSTM5 levels were entered into the risk model.
The points against each factor were counted, and 1-, 3- and 5-year
survival rates were also calculated (23). The nomogram was constructed using the
rms package (https://CRAN.R-project.org/package=rms) (24).
To assess the prognostic value of GSTM5 in different
GC strata, a stratified analysis method was performed. The
association between GSTM5 and OS in TCGA and KM plotter online
database were stratified in the GC cohort for sex, age, clinical
stage, Lauren classification, differentiation grade, clinical
treatment and HER2 status.
Gene Set Enrichment Analysis
(GSEA)
To investigate how the prognostic GSTM5 gene
participates in GC, GSEA v.3.0 software (http://software.broadinstitute.org/gsea/msigdb/index.jsp)
was used to identify the potential biological functions and
signaling pathways associated with low vs. high expression levels
of GSTM5. The Molecular Signatures Database of GSEA used the c2
(c2.cp.kegg.v6.2.symbols.gmt) and c5 (c5.all.v6.2.symbols.gmt)
reference gene sets (25). A value
of 1,000 was set as the number of permutations. P<0.05,
normalized enrichment score >1 and false discovery rate <0.25
were considered to indicate a statistically significant
difference.
Genome-wide co-expression analysis of
the prognostic GSTM5 gene and functional enrichment
To assess gene-gene co-expression interaction of
prognostic genes at the mRNA level, Pearson's correlation
coefficient was calculated using the cor function on the R 3.4.4
platform. Significant differences were defined as |r|>0.6 and
P<0.05. In addition, DAVID version 6.8 was used to determine the
GO functional term and KEGG pathway enrichment of GSTM and its
co-expressed genes.
Statistical analyses
All data were analyzed using SPSS version 25.0
software (IBM, Corp.). Vertical scatterplots and survival curves
were generated using GraphPad Prism 7.0 software (GraphPad
Software, Inc.). Vertical scatterplots were analyzed using
independent t-tests. In addition, nomograms and correlation plots
were generated using R software.
Results
GSTM family functional enrichment and
co-expression analysis
To evaluate the biological functions of GSTM genes,
GO functional terms were determined in the categories BP, MF and CC
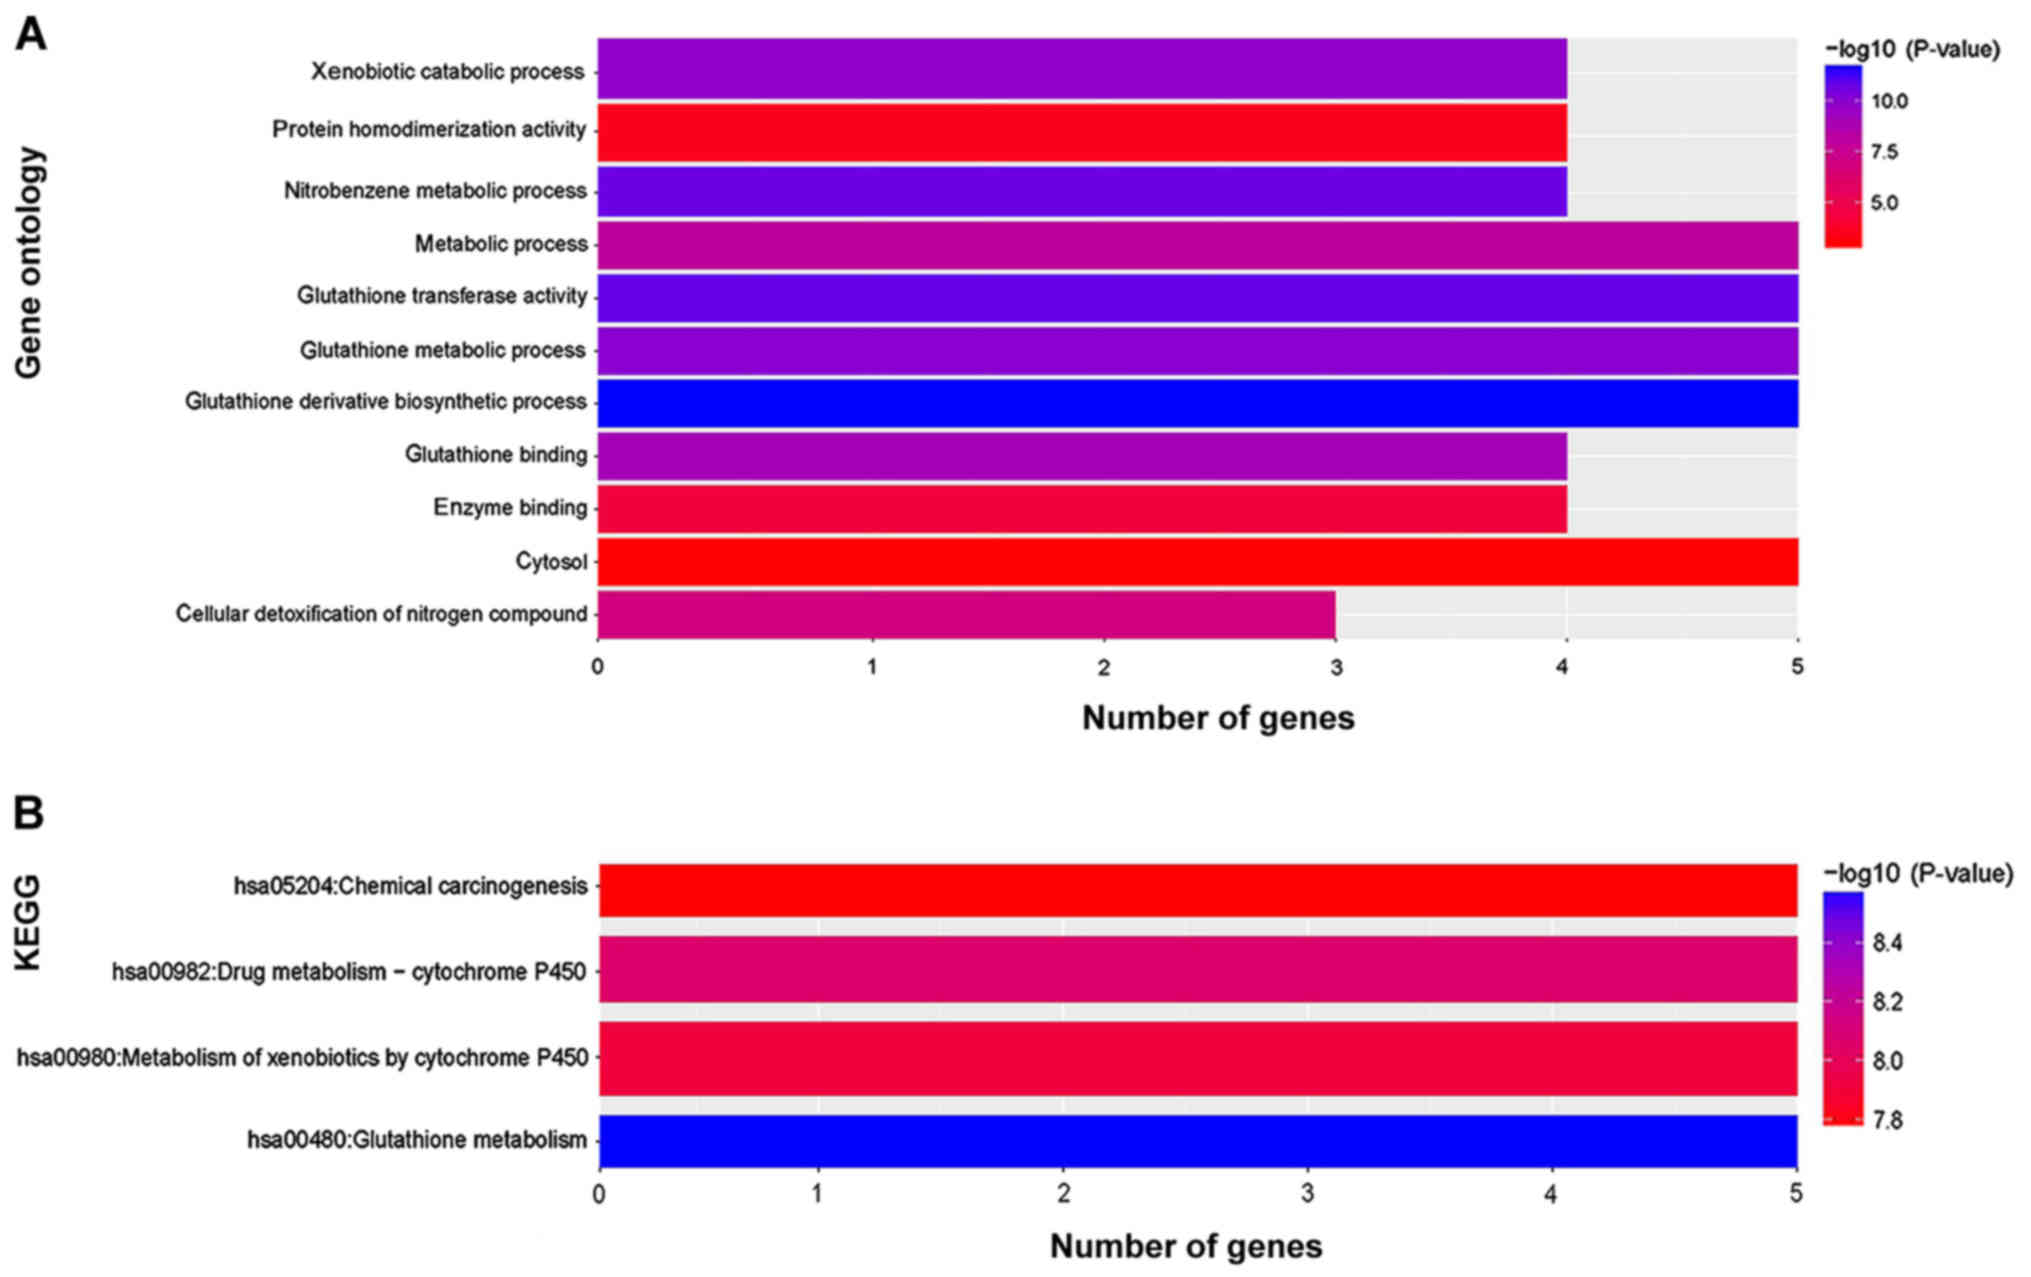
and a KEGG pathway analysis was performed using DAVID (Fig. 1). GO analysis indicated that genes of
the GSTM family were enriched in ‘protein homodimerization
activity’, ‘enzyme binding’ and in the ‘cytosol’ (Fig. 1A). The results from the KEGG analysis
suggested that the functions of the GSTM gene family were enriched
in ‘chemical carcinogenesis’, ‘metabolism of xenobiotics by
cytochrome P450’ and ‘drug metabolism-cytochrome P450’ (Fig. 1B). Gene-gene interaction networks of
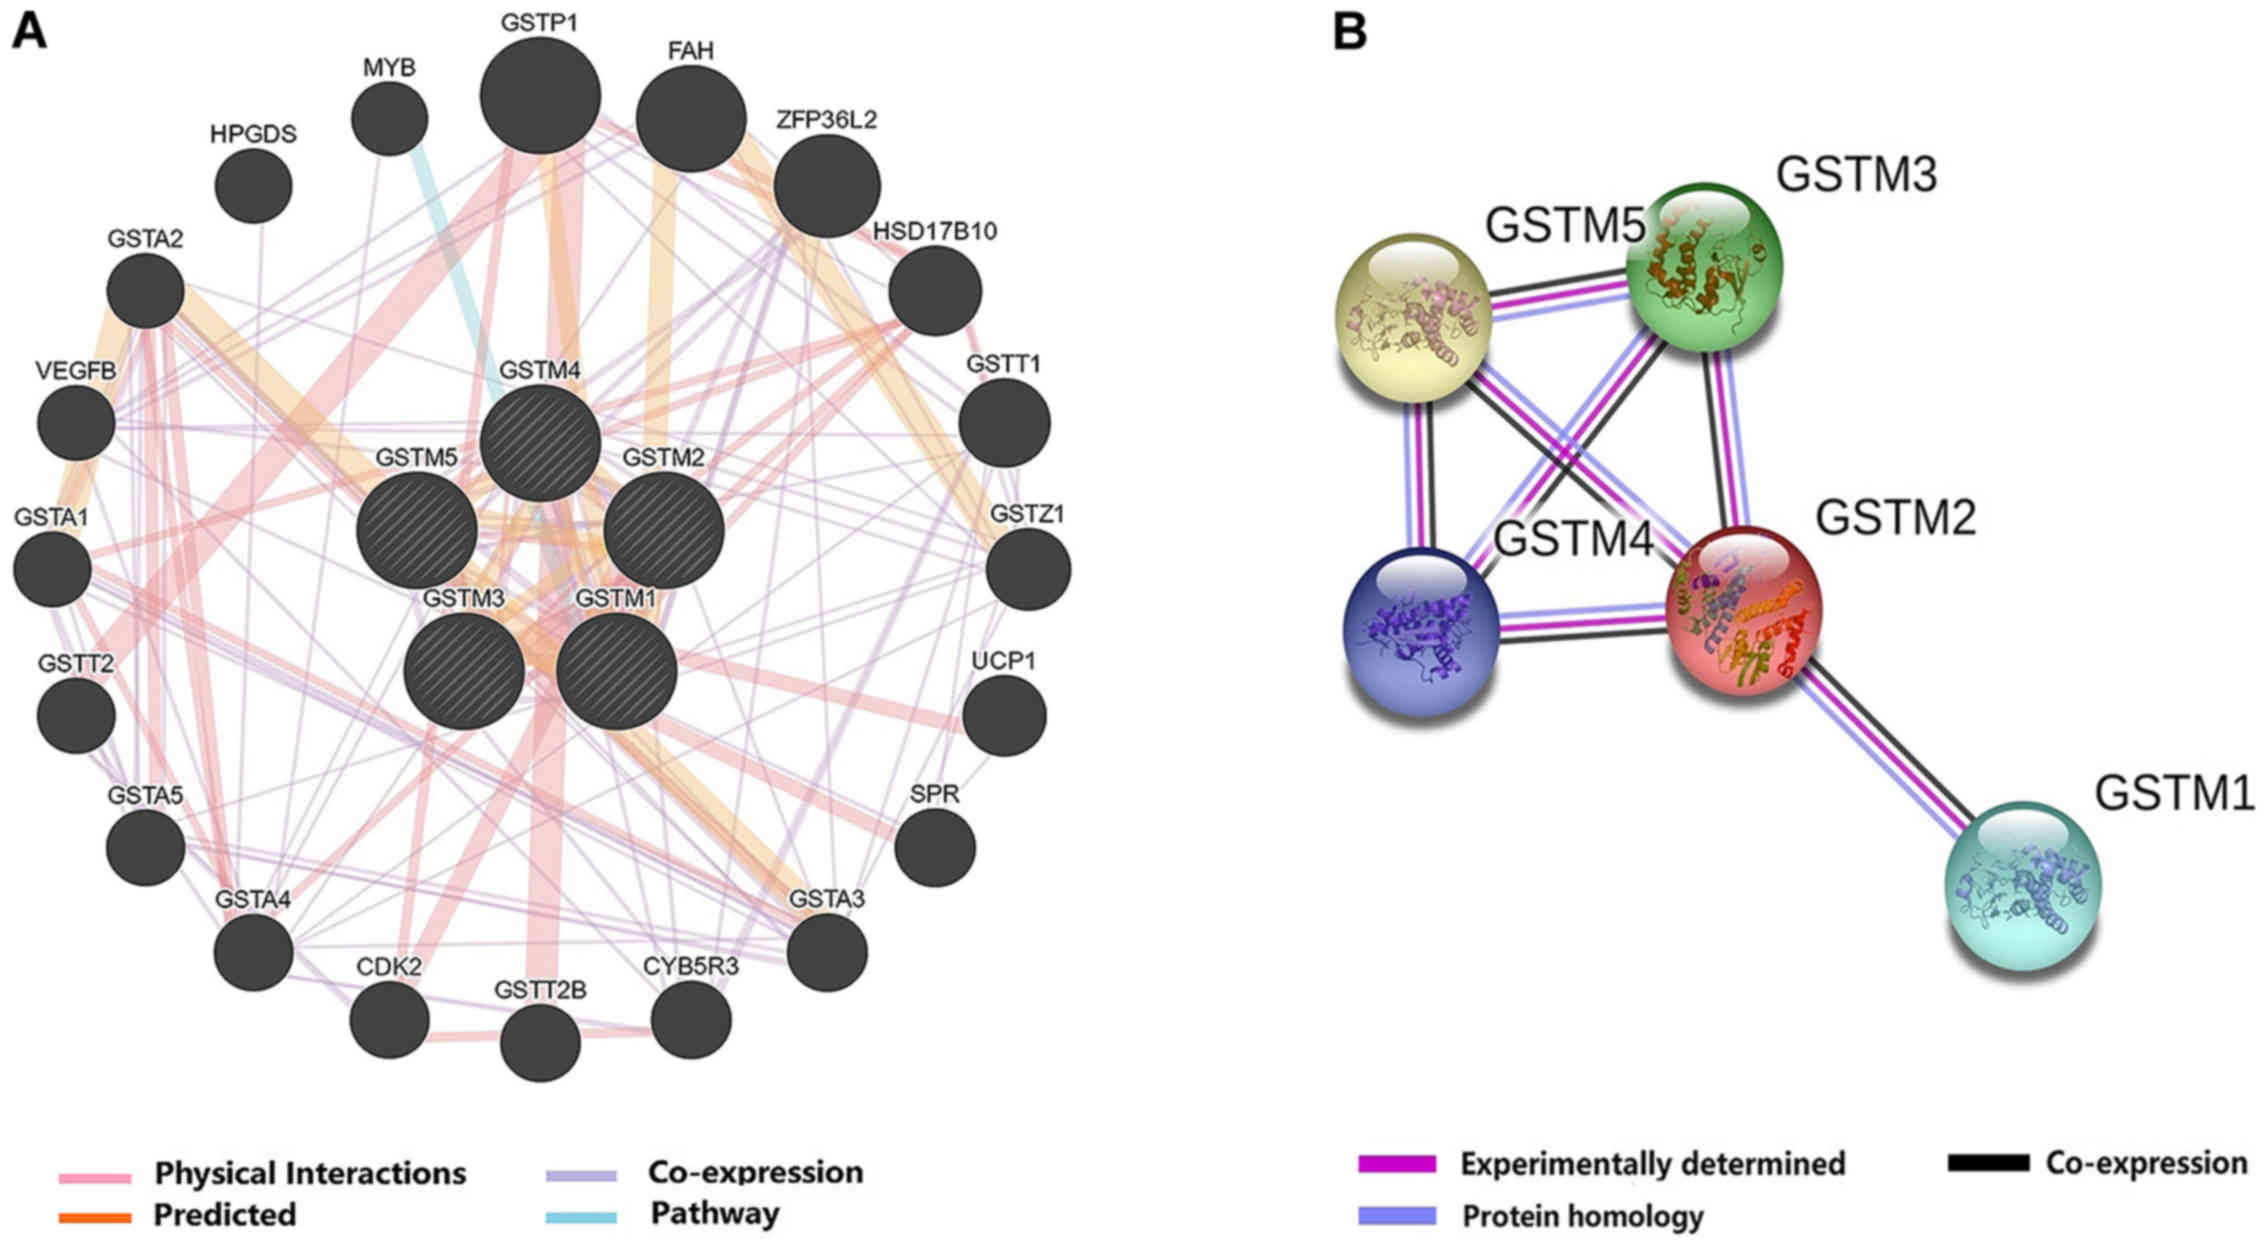
GSTM genes are presented in Fig. 2A,
which revealed that GSTM1-5 were co-expressed. In addition, the
GSTM genes were associated with other genes with the relationship
of predicted interactions, physical interactions, co-expression,
and shared pathway. Based on the information in the STRING
database, PPI interaction networks revealed that GSTM family
members were directly and indirectly connected to one another
(Fig. 2B). The PPI network revealed
that GSTM1 was only associated with GSTM2, and GSTM2 was the only
gene that associated with all other family members. In addition,
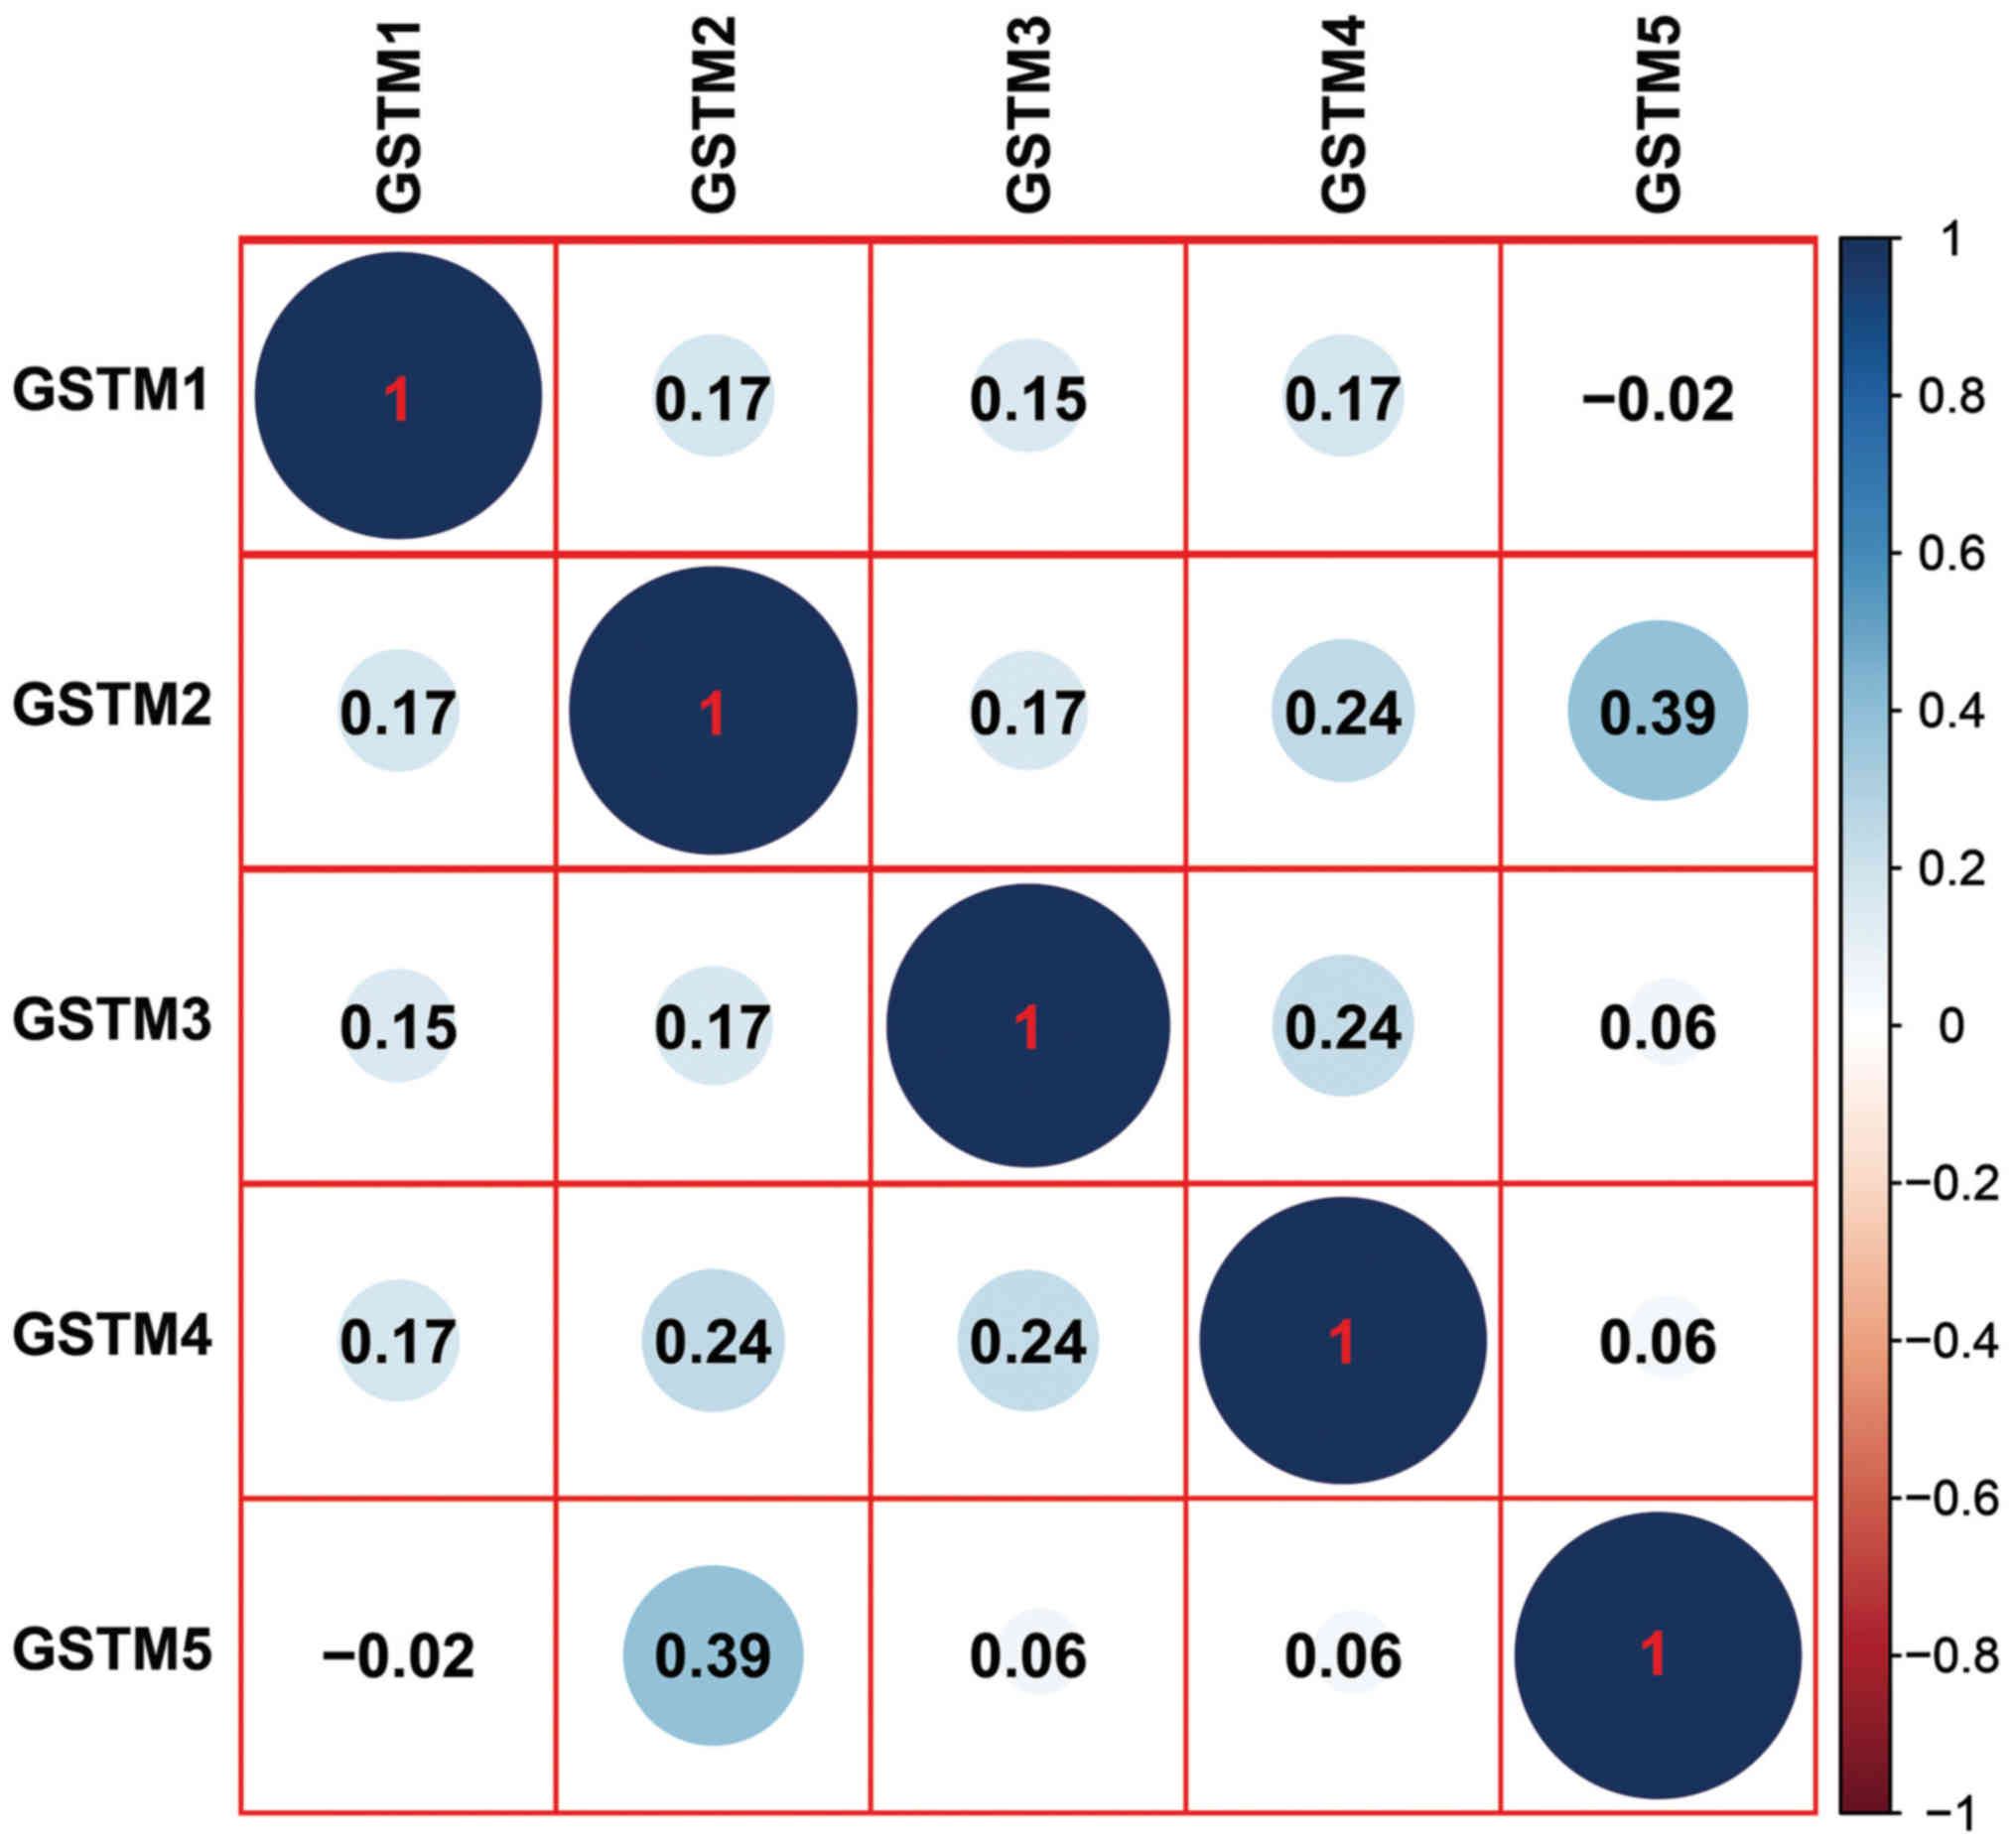
co-expression of the GSTM genes was observed in GC tissues,
although the correlation coefficients appear to be weak (<0.4)
(Fig. 3).
Survival analysis
Significant differences were obtained in the
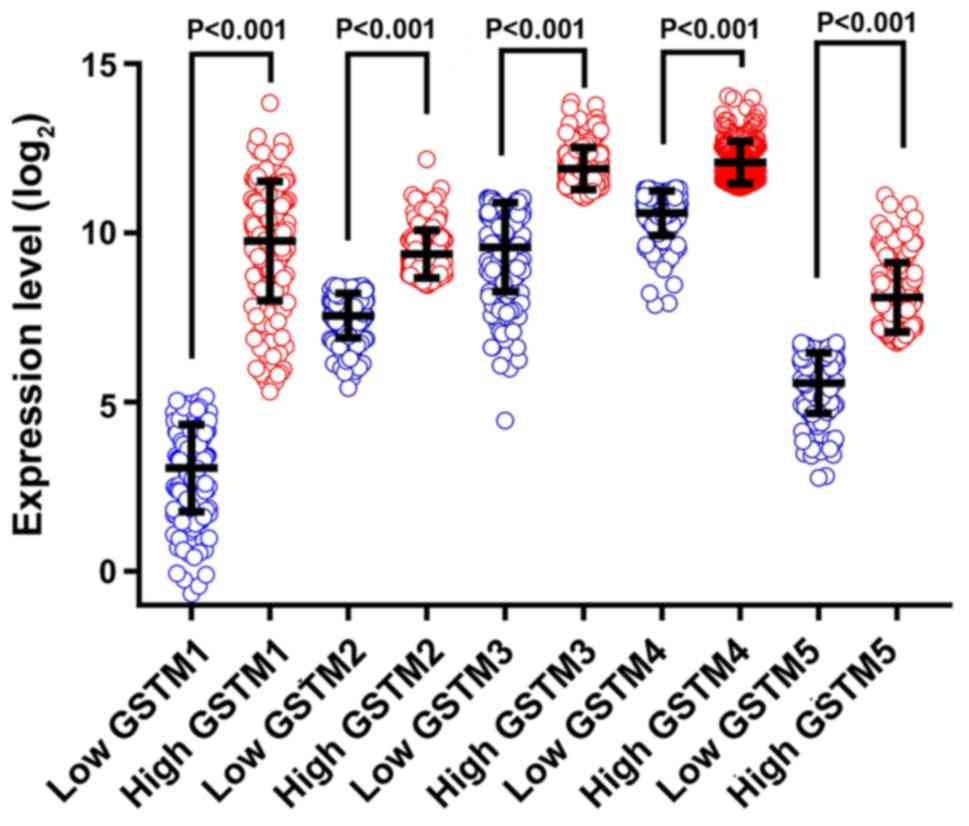
vertical scatterplots between high and low expression of GSTM genes
obtained from TCGA (all P<0.001; Fig.
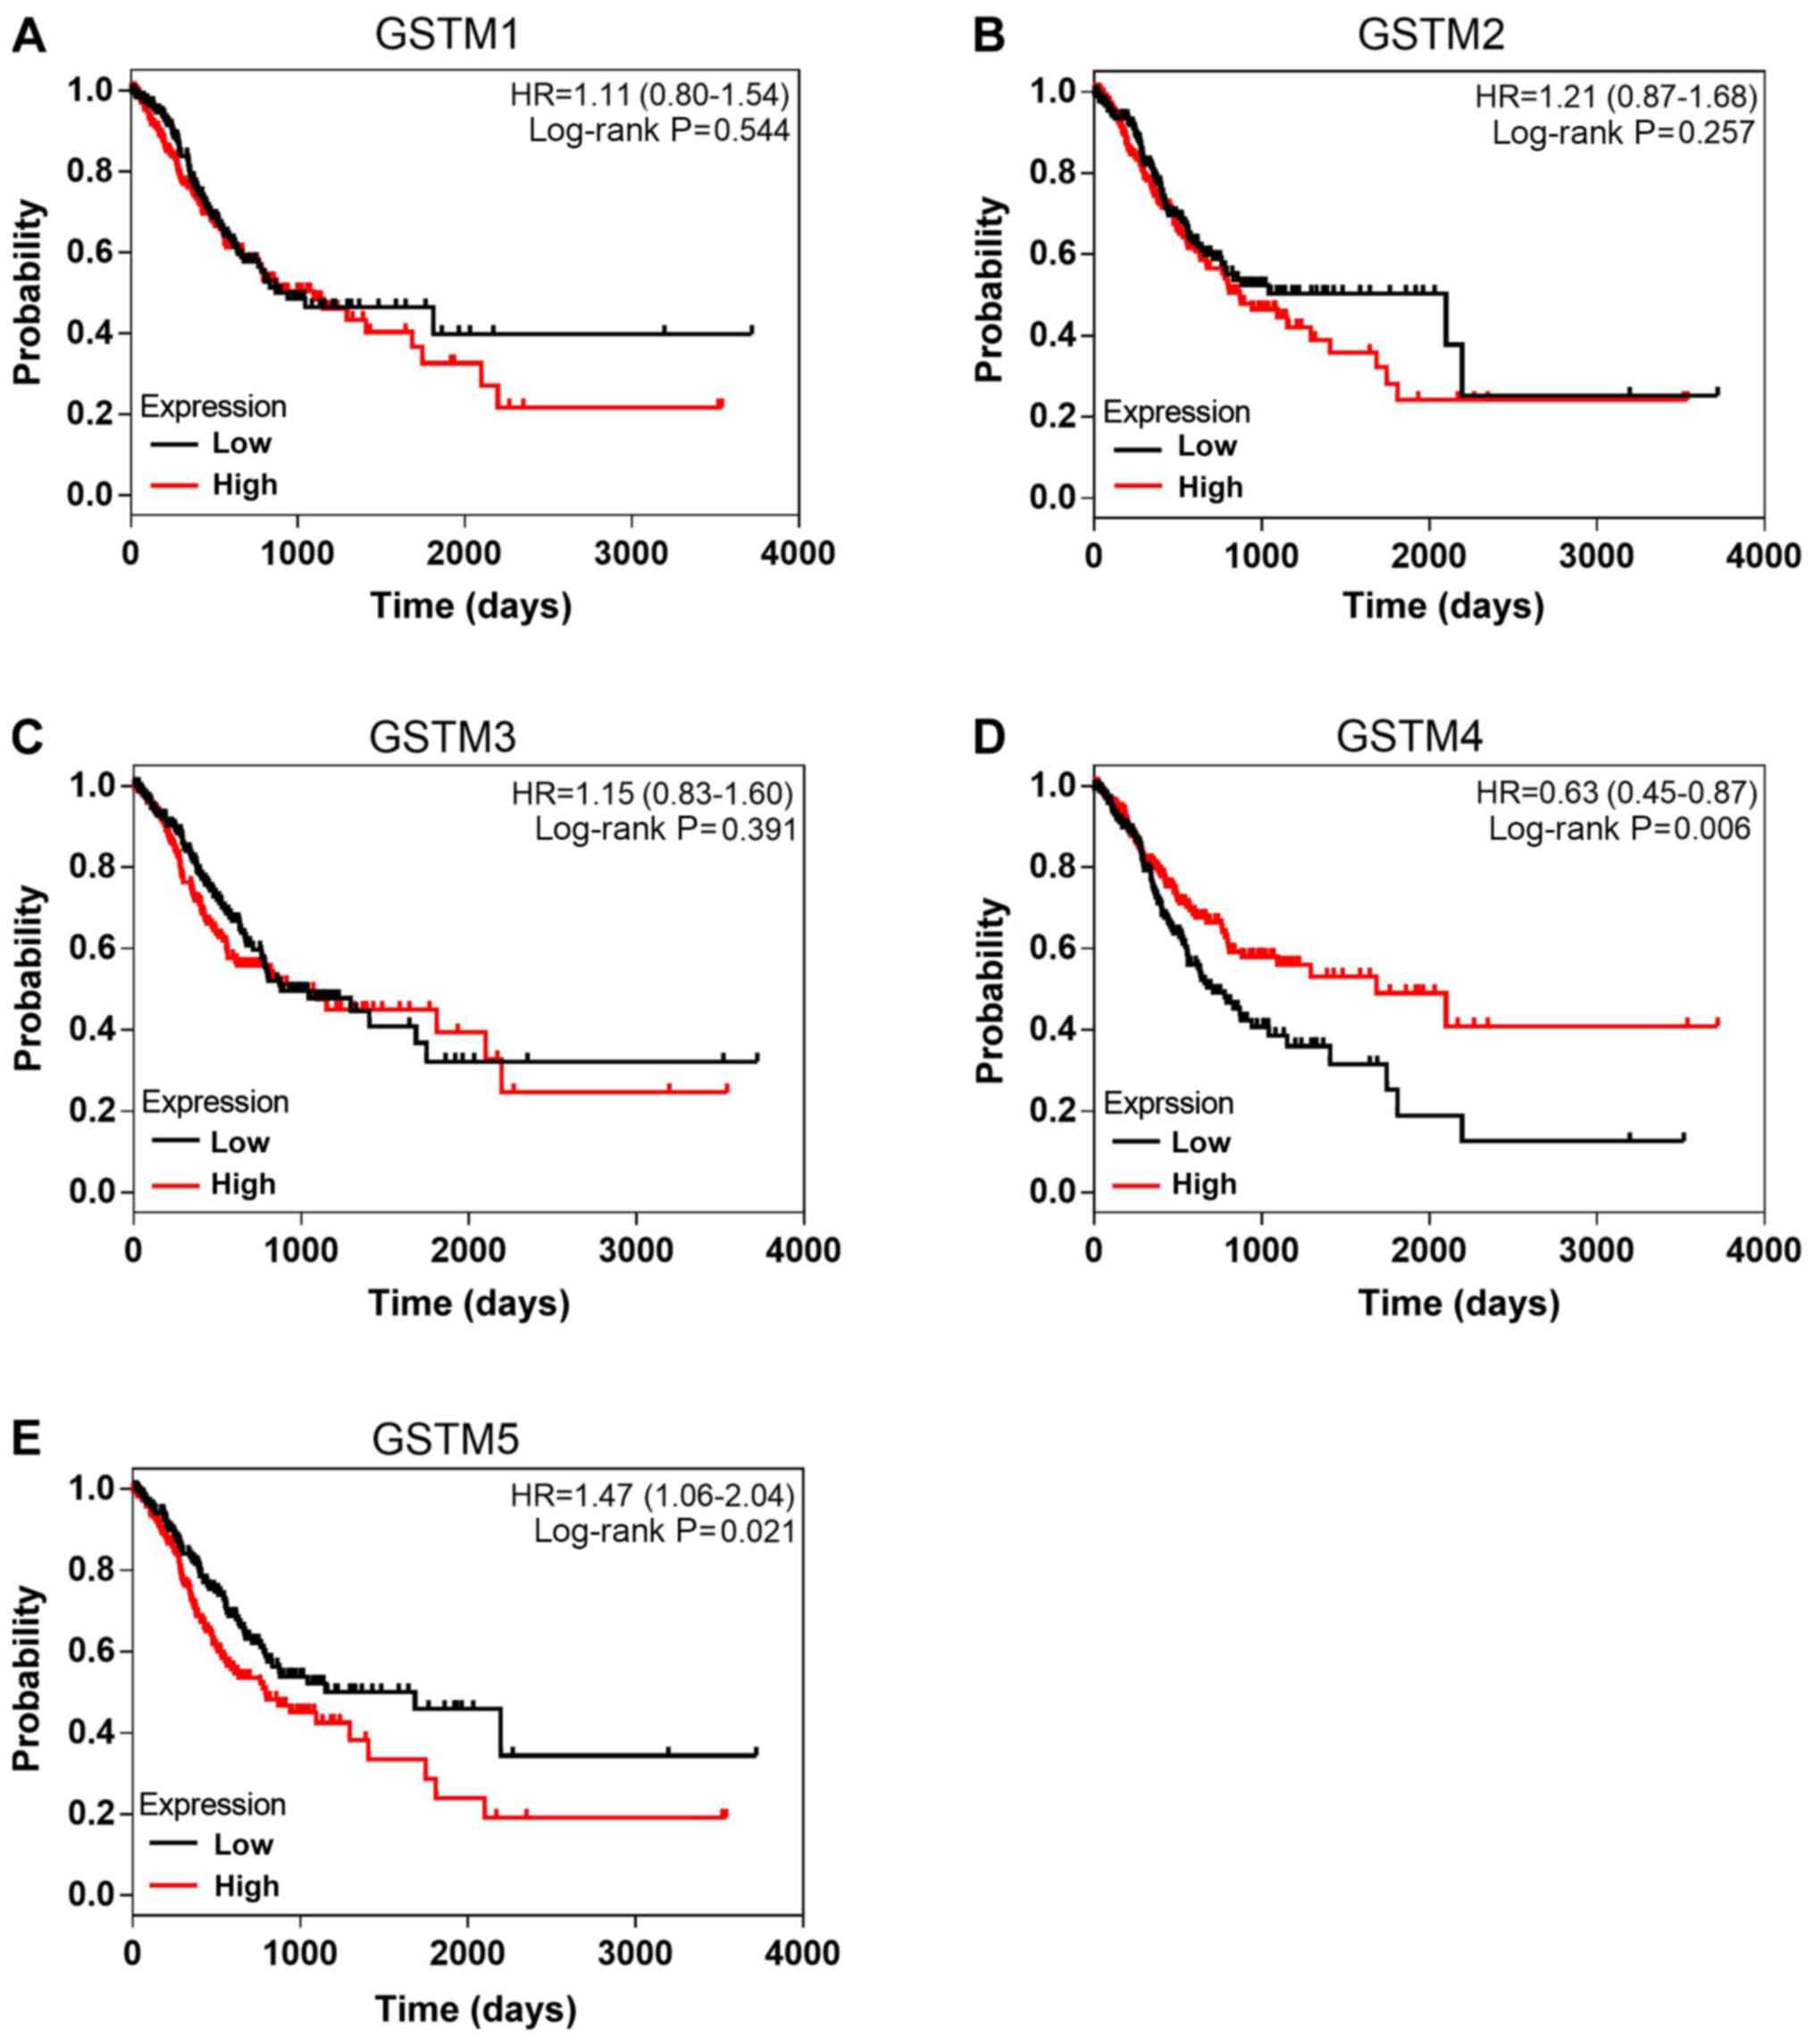
4). A survival analysis comparing patients with GC with
different expression levels of GSTM is presented in Fig. 5. High GSTM5 expression was
significantly associated with a worse prognosis for patients with
GC (HR=1.47, 95% CI: 1.06-2.04, P=0.021). A significant association
between high GSTM4 expression and favorable OS was observed
(HR=0.63, 95% CI: 0.45-0.87, P=0.006).
Multivariate survival analysis was also performed to
investigate the prognostic value of GSTM in GC. Age and tumor stage
were two factors identified to be significantly associated with
prognosis, as an age of ≥65 years and advanced stages were
significantly associated with a worse OS (HR=1.56, 95% CI:
1.12-2.17, P=0.011; HR=1.92, 95% CI: 1.37-2.70, P<0.001,
respectively; Table I). To examine
survival, tumor stage and age were analyzed using the multivariate
Cox proportional hazards regression model. These analyses revealed
that high GSTM5 expression was significantly associated with worse
OS (HR=1.48, 95% CI: 1.05-2.08, adjusted P=0.027; Table II). These results were consistent
with those of the univariate survival analysis (Table II). However, no significant
differences were identified for GSTM4 in the multivariate survival
analysis (Table II), which was not
consistent with the results obtained in the univariate survival
analysis (HR=0.63, 95% CI: 0.45-0.87, P=0.006; Table II and Fig. 5D).
 | Table I.Demographic and clinical data in The
Cancer Genome Atlas gastric cancer cohort (n=351). |
Table I.
Demographic and clinical data in The
Cancer Genome Atlas gastric cancer cohort (n=351).
| Variable | N | Events, n (%) | MST, days | HR (95% CI) | Log-rank
P-value |
|---|
| Sex |
|
|
|
| 0.152 |
|
Male | 226 | 99 (43.8) | 869 | Ref. |
|
|
Female | 125 | 44 (35.2) | 1,043 | 0.77
(0.55-1.09) |
|
| Age (years) |
|
|
|
| 0.011 |
|
<65 | 148 | 50 (33.8) | 1,811 | Ref. |
|
|
≥65 | 197 | 92 (46.7) | 779 | 1.56
(1.12-2.17) |
|
| NA | 6 |
|
|
|
|
| Tumor stage |
|
|
|
| <0.001 |
| Early
(I+II) | 156 | 44 (28.2) | 1,811 | Ref. |
|
|
Advanced (III+IV) | 180 | 89 (49.4) | 675 | 1.92
(1.37-2.70) |
|
| NA | 15 |
|
|
|
|
| Tumor stage |
|
|
|
| <0.001 |
| I | 47 | 11 (23.4) | 2,197 | Ref. |
|
| II | 109 | 33 (30.3) | 1,686 | 1.55
(0.78-3.08) |
|
|
III | 145 | 67 (46.2) | 782 | 2.38
(1.26-4.51) |
|
| IV | 35 | 22 (62.9) | 476 | 3.81
(1.85-7.86) |
|
| NA | 15 |
|
|
|
|
| Table II.Analysis of the association between
GSTM genes and the risk of death in The Cancer Genome Atlas gastric
cancer cohort (n=351). |
Table II.
Analysis of the association between
GSTM genes and the risk of death in The Cancer Genome Atlas gastric
cancer cohort (n=351).
| Gene expression
status | Median
expression | N | Events, n (%) | MST, days | Crude HR (95%
CI) | Crude P-value | Adjusted
HRa (95% CI) | Adjusted P-value
a |
|---|
| GSTM1 | 36.0 |
|
|
|
| 0.544 |
| 0.877 |
|
Low |
| 176 | 68 (38.6) | 869 | Ref. |
| Ref. |
|
|
High |
| 175 | 75 (42.9) | 1,095 | 1.11
(0.80-1.54) |
| 0.97
(0.69-1.38) |
|
| GSTM2 | 349.7 |
|
|
|
| 0.257 |
| 0.263 |
|
Low |
| 176 | 66 (37.5) | 2,100 | Ref. |
| Ref. |
|
|
High |
| 175 | 77 (44.0) | 869 | 1.2
(0.87-1.68) |
| 1.22
(0.86-1.71) |
|
| GSTM3 | 2105.3 |
|
|
|
| 0.391 |
| 0.247 |
|
Low |
| 176 | 70 (39.8) | 881 | Ref. |
| Ref. |
|
|
High |
| 175 | 73 (41.7) | 940 | 1.15
(0.83-1.60) |
| 1.23
(0.87-1.74) |
|
| GSTM4 | 2570.1 |
|
|
|
| 0.006 |
| 0.067 |
|
Low |
| 176 | 84 (47.7) | 712 | Ref. |
| Ref. |
|
|
High |
| 175 | 59 (33.7) | 1,686 | 0.63
(0.45-0.87) |
| 0.72
(0.50-1.02) |
|
| GSTM5 | 107.5 |
|
|
|
| 0.021 |
| 0.027 |
|
Low |
| 176 | 64 (36.4) | 1,153 | Ref. |
| Ref. |
|
|
High |
| 175 | 79 (45.9) | 794 | 1.47
(1.06-2.04) |
| 1.48
(1.05-2.08) |
|
Validation of the GSTM cohort using
the KM plotter online database
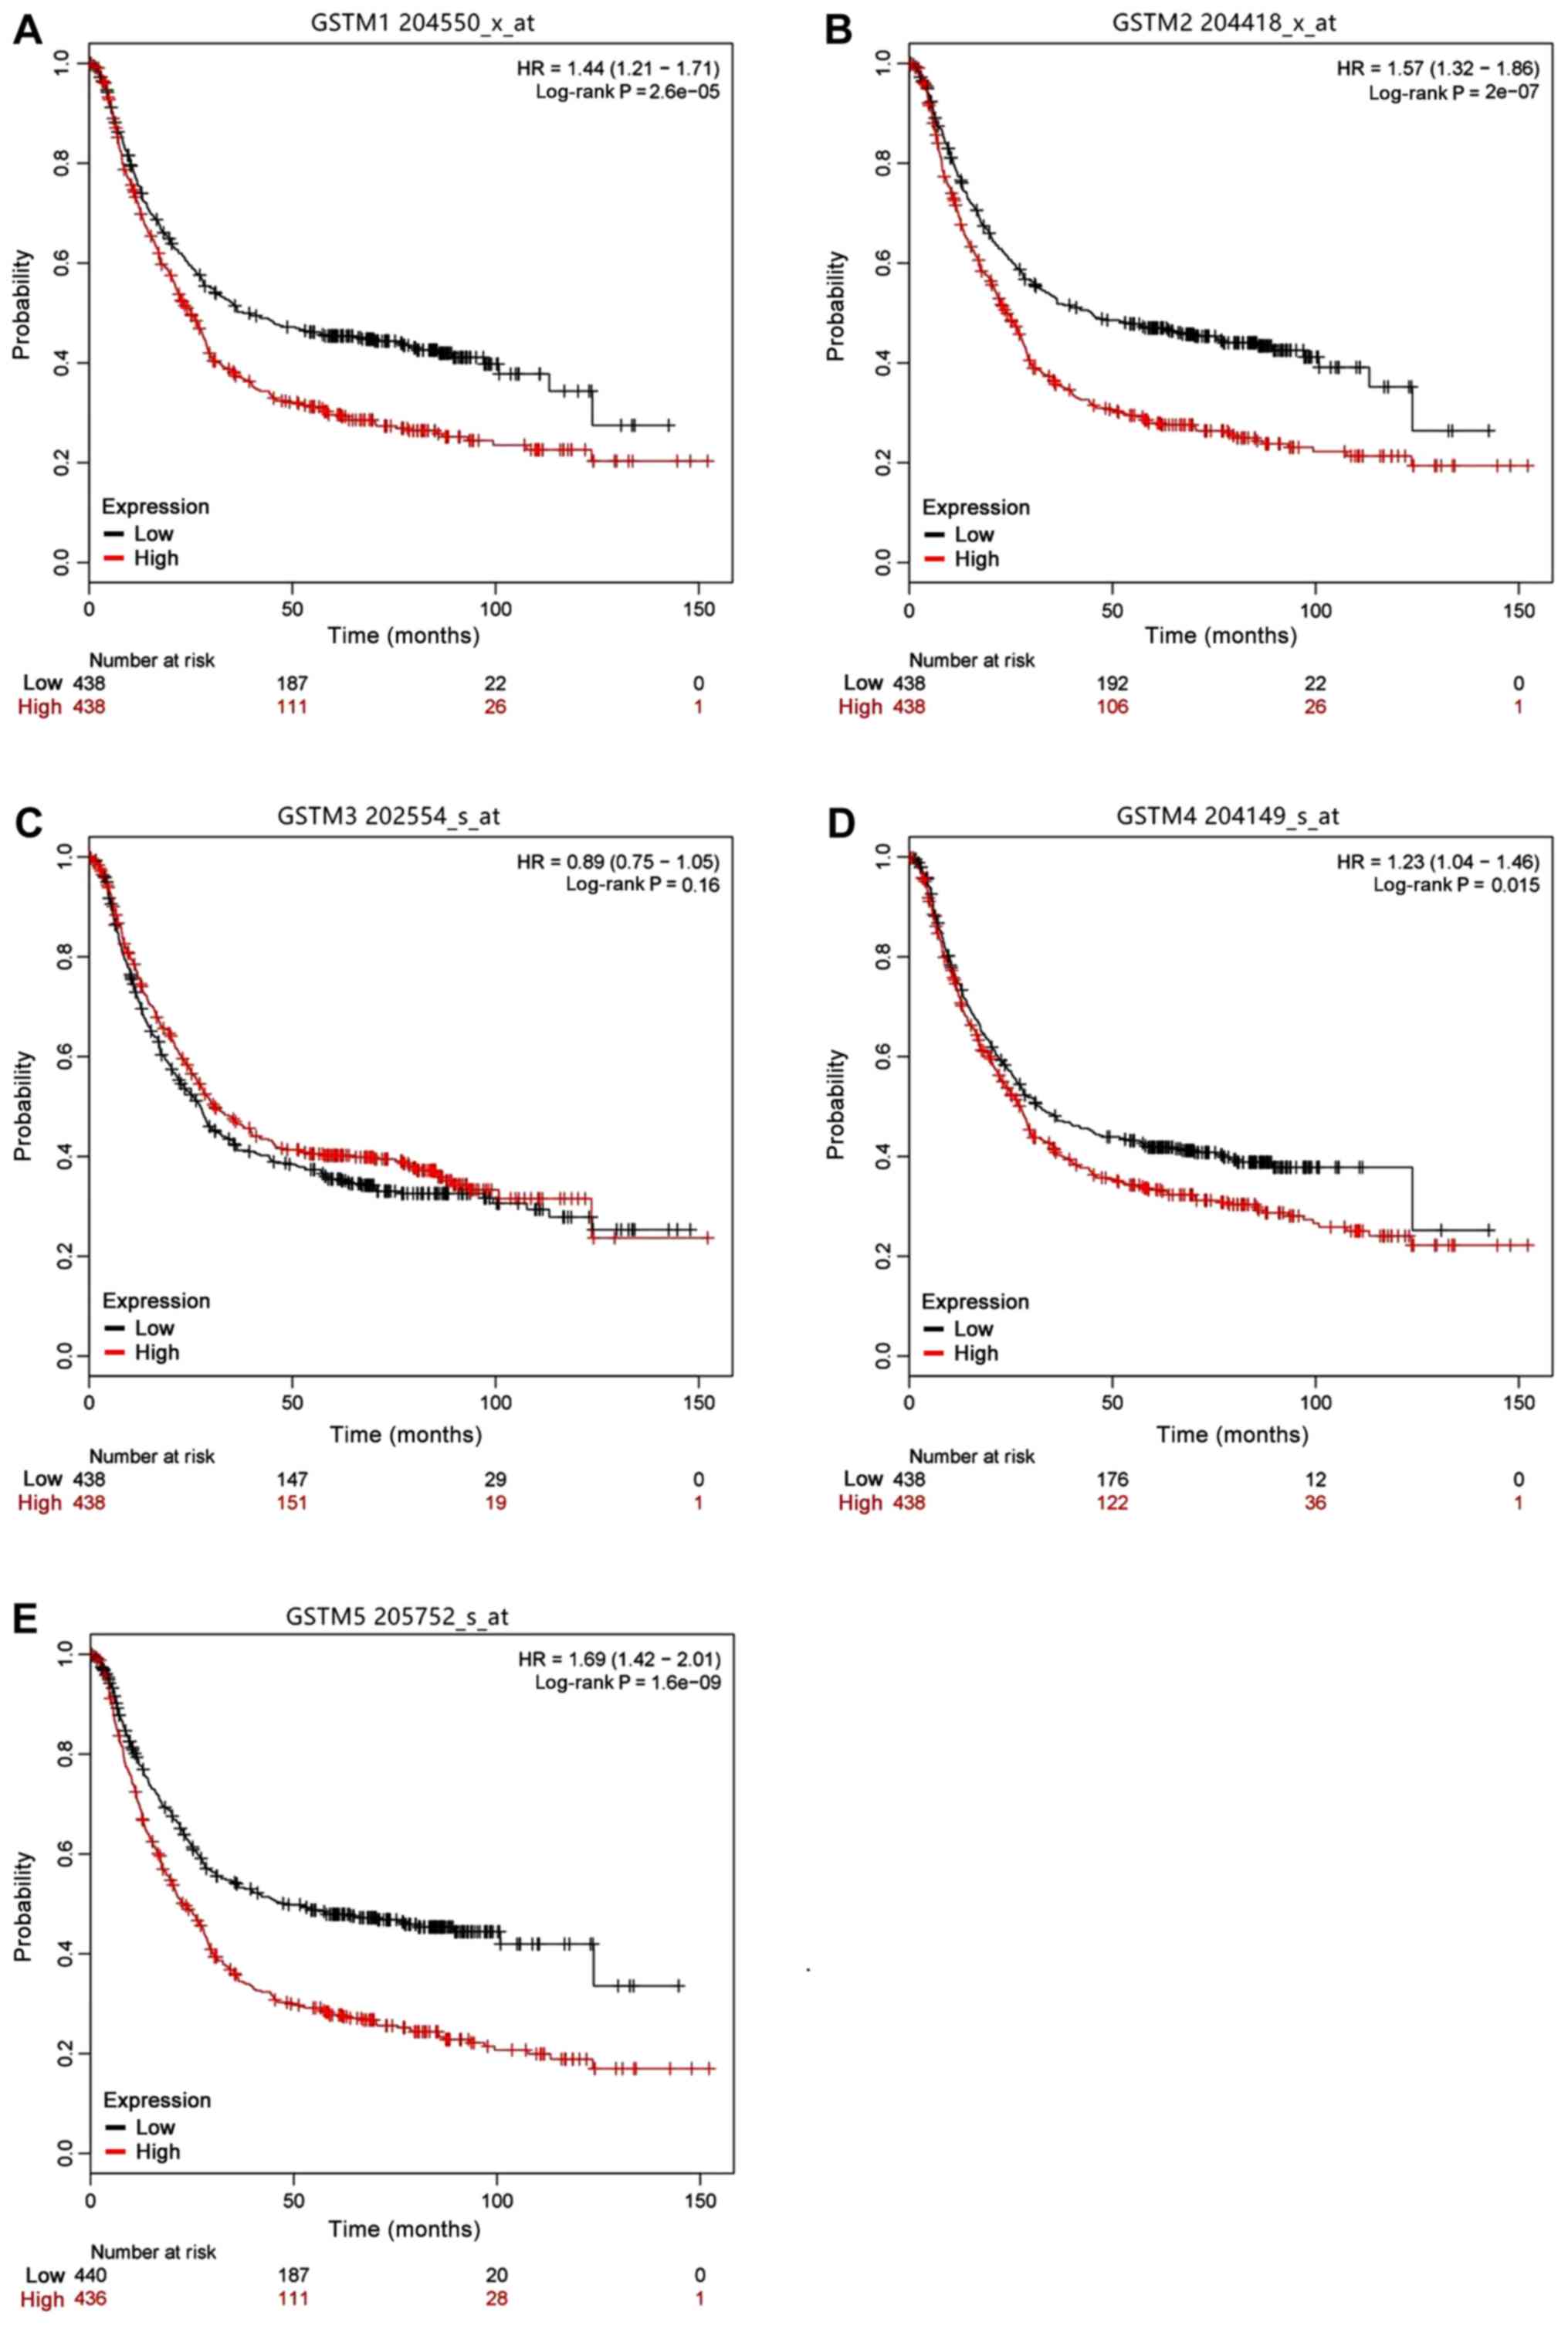
The GSTM cohort was validated using the KM plotter
online database. KM curves of GSTM genes are presented in Fig. 6. These analyses revealed that high
GSTM1, GSTM2, GSTM4 and GSTM5 mRNA levels were associated with a
significantly worse OS for patients with GC (HR=1.44, 95% CI:
1.21-1.71, P=2.6×10⁻⁵; HR=1.57, 95% CI: 1.32-1.86,
P=2×10⁻⁷; HR=1.23, 95% CI: 1.04-1.46, P=0.015; and
HR=1.69, 95% CI: 1.42-2.01, P=1.6×10⁻⁹, respectively).
The only result consistent with the TCGA analyses was that GSTM5
was significantly associated with a worse prognosis (HR=1.47, 95%
CI: 1.06-2.04, P=0.021; Table II
and Fig. 5E).
Nomogram and stratified analysis
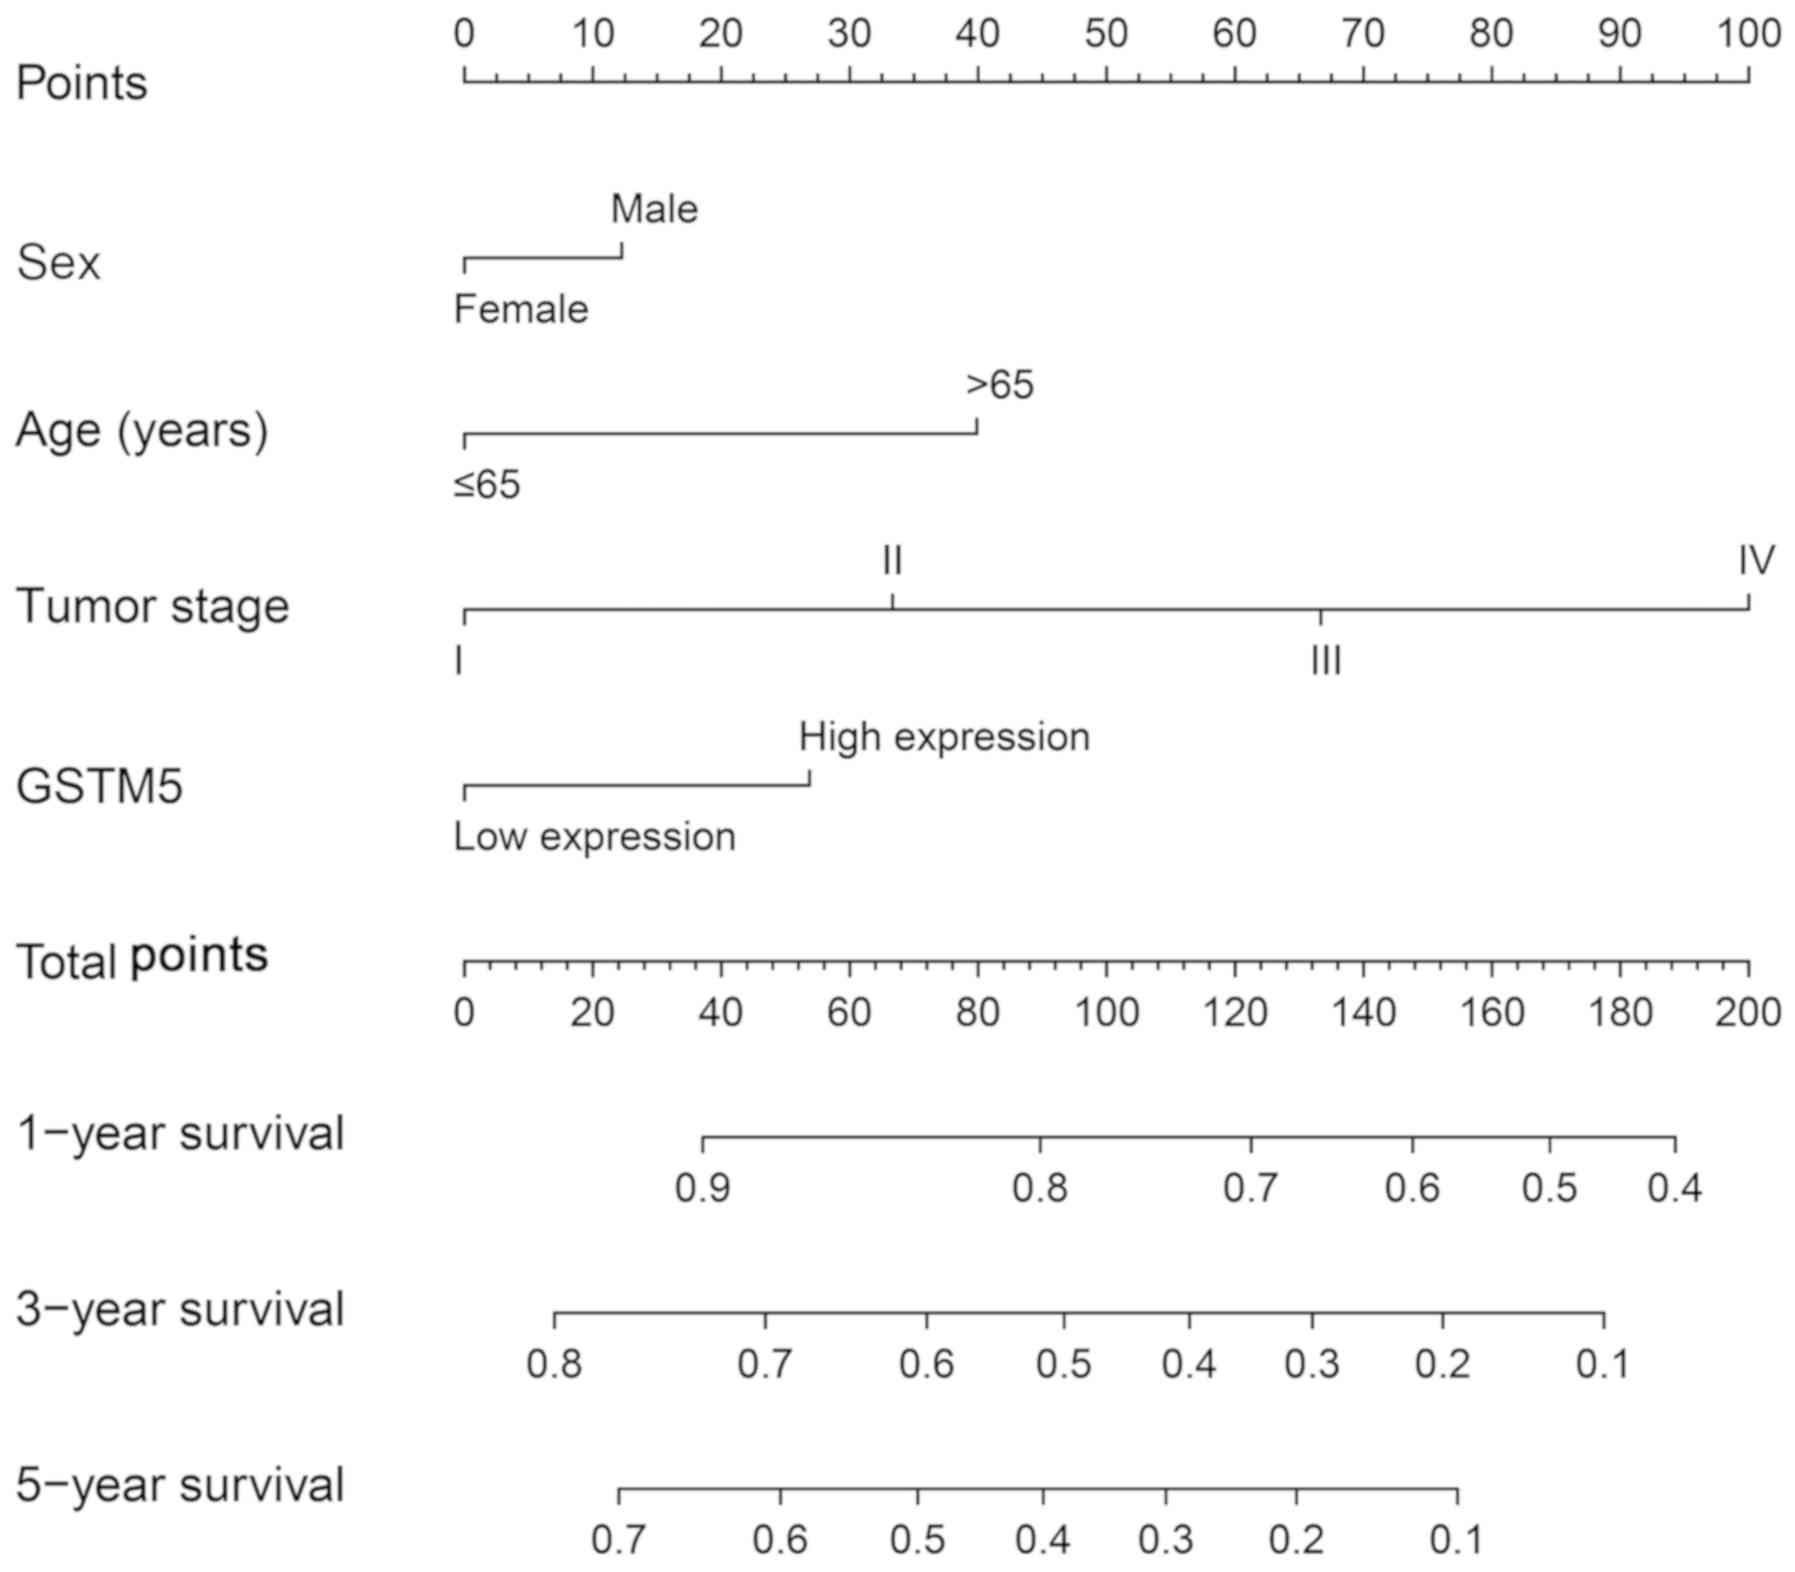
A nomogram for GC was developed based on GSTM5
expression levels, sex, age, tumor stage and 1-, 3- and 5-year
survival rate (Fig. 7). The 1-, 3-
and 5-year survival rates were higher for patients with a lower
number of total points compared with those with a higher number of
total points. In accordance with the nomogram, it was observed that
the contribution of GSTM5 expression in prognosis prediction was
lower compared with that of age and tumor stage, but higher
compared with that of sex. The nomogram analyses revealed that
GSTM5 contributes to the prognosis prediction for patients with GC.
In addition, the prognostic value of GSTM5 in GC was analyzed using
stratification analysis and the association between GSTM5 and OS
was analyzed using the TCGA (Table
III) and KM plotter online database (Table IV) GC cohorts, which included
analyses for sex, age, clinical stage, Lauren classification,
differentiation grade, clinical treatment and HER2 status. As
presented in Table III, high GSTM5
mRNA levels were significantly associated with poor prognosis in
patients with GC who were males and <65 years old based on the
TCGA GC cohort (HR=1.59, 95% CI: 1.07-2.36, P=0.020; HR=1.86, 95%
CI: 1.07-3.25, P=0.030, respectively). As presented in Table IV, high GSTM5 mRNA levels were
significantly associated with worse survival for both female and
male patients with GC, clinical stages I, II and III, all Lauren
classifications, treatment by surgery and other adjuvant therapies,
as well as a negative HER2 status, according to the KM plotter
analysis.
| Table III.Stratified analysis of the
association between GSTM5 expression levels and overall survival in
The Cancer Genome Atlas gastric cancer cohort (n=351). |
Table III.
Stratified analysis of the
association between GSTM5 expression levels and overall survival in
The Cancer Genome Atlas gastric cancer cohort (n=351).
| Variable | Total, n | Low GSTM5, n | High GSTM5, n | HR (95% CI) | Log-rank
P-value |
|---|
| Sex |
|
|
|
|
|
|
Male | 226 | 113 | 113 | 1.59
(1.07-2.36) | 0.020 |
|
Female | 125 | 63 | 62 | 1.06
(0.58-1.91) | 0.860 |
| Age, years |
|
|
|
|
|
|
<65 | 148 | 74 | 74 | 1.86
(1.07-3.25) | 0.030 |
|
≥65 | 197 | 99 | 98 | 1.11
(0.74-1.688) | 0.603 |
| NA | 6 |
|
|
|
|
| Stage |
|
|
|
|
|
|
Early | 156 | 78 | 78 | 1.48
(0.82-2.68) | 0.189 |
|
Advanced | 180 | 90 | 90 | 1.34
(0.88-2.04) | 0.164 |
| NA | 15 |
|
|
|
|
| Stage |
|
|
|
|
|
| I | 47 | 24 | 23 | 1.31
(0.40-4.29) | 0.651 |
| II | 109 | 55 | 54 | 1.52
(0.77-3.02) | 0.217 |
|
III | 145 | 73 | 72 | 1.49
(0.92-2.42) | 0.098 |
| IV | 35 | 18 | 17 | 1.15
(0.49-2.68) | 0.744 |
| NA | 15 |
|
|
|
|
| Table IV.Stratified analysis of the
association between GSTM5 expression levels and overall survival in
the Kaplan-Meier plotter gastric cancer cohort (n=875). |
Table IV.
Stratified analysis of the
association between GSTM5 expression levels and overall survival in
the Kaplan-Meier plotter gastric cancer cohort (n=875).
| Variable | Total, n | Low GSTM5, n | High GSTM5, n | HR (95% CI) | Log-rank
P-value |
|---|
| Sex |
|
|
|
|
|
|
Female | 236 | 120 | 116 | 1.87
(1.31-2.68) | <0.001 |
|
Male | 544 | 275 | 269 | 1.84
(1.48-2.29) |
2.4×10⁻⁸ |
| NA | 95 |
|
|
|
|
| Stage |
|
|
|
|
|
| I | 67 | 34 | 33 | 3.02
(0.96-9.55) | 0.048 |
| II | 140 | 71 | 69 | 2.20
(1.17-4.15) | 0.012 |
|
III | 305 | 152 | 153 | 1.47
(1.11-1.96) | 0.008 |
| IV | 148 | 74 | 74 | 1.41
(0.96-2.08) | 0.075 |
| NA | 215 |
|
|
|
|
| Lauren
classification |
|
|
|
|
|
|
Intestinal | 320 | 161 | 159 | 2.42
(1.74-3.36) |
7.1×10⁻⁸ |
|
Diffuse | 241 | 121 | 120 | 1.95
(1.37-2.76) | <0.001 |
|
Mixed | 32 | 16 | 16 | 4.26
(1.34-13.55) | 0.007 |
| NA | 282 |
|
|
|
|
|
Differentiation |
|
|
|
|
|
|
Poor | 165 | 82 | 83 | 0.71
(0.47-1.05) | 0.085 |
|
Moderate | 67 | 34 | 33 | 1.01
(0.52-1.94) | 0.978 |
|
Well | 32 | 16 | 16 | 2.04
(0.84-4.94) | 0.106 |
| NA | 611 |
|
|
|
|
| Treatment |
|
|
|
|
|
| Surgery
alone | 380 | 190 | 190 | 1.81
(1.35-2.43) |
5.9×10⁻⁵ |
| 5-Fu
based adjuvant | 152 | 76 | 76 | 0.86
(0.61-1.22) | 0.389 |
| Other
adjuvant | 76 | 38 | 38 | 7.37
(2.15-25.21) | <0.001 |
| NA | 267 |
|
|
|
|
| HER2 status |
|
|
|
|
|
|
Negative | 532 | 266 | 266 | 1.93
(1.53-2.44) |
1.3×10⁻⁸ |
|
Positive | 343 | 172 | 171 | 1.22
(0.94-1.58) | 0.139 |
GSEA analysis of GSTM5 in GC
cases
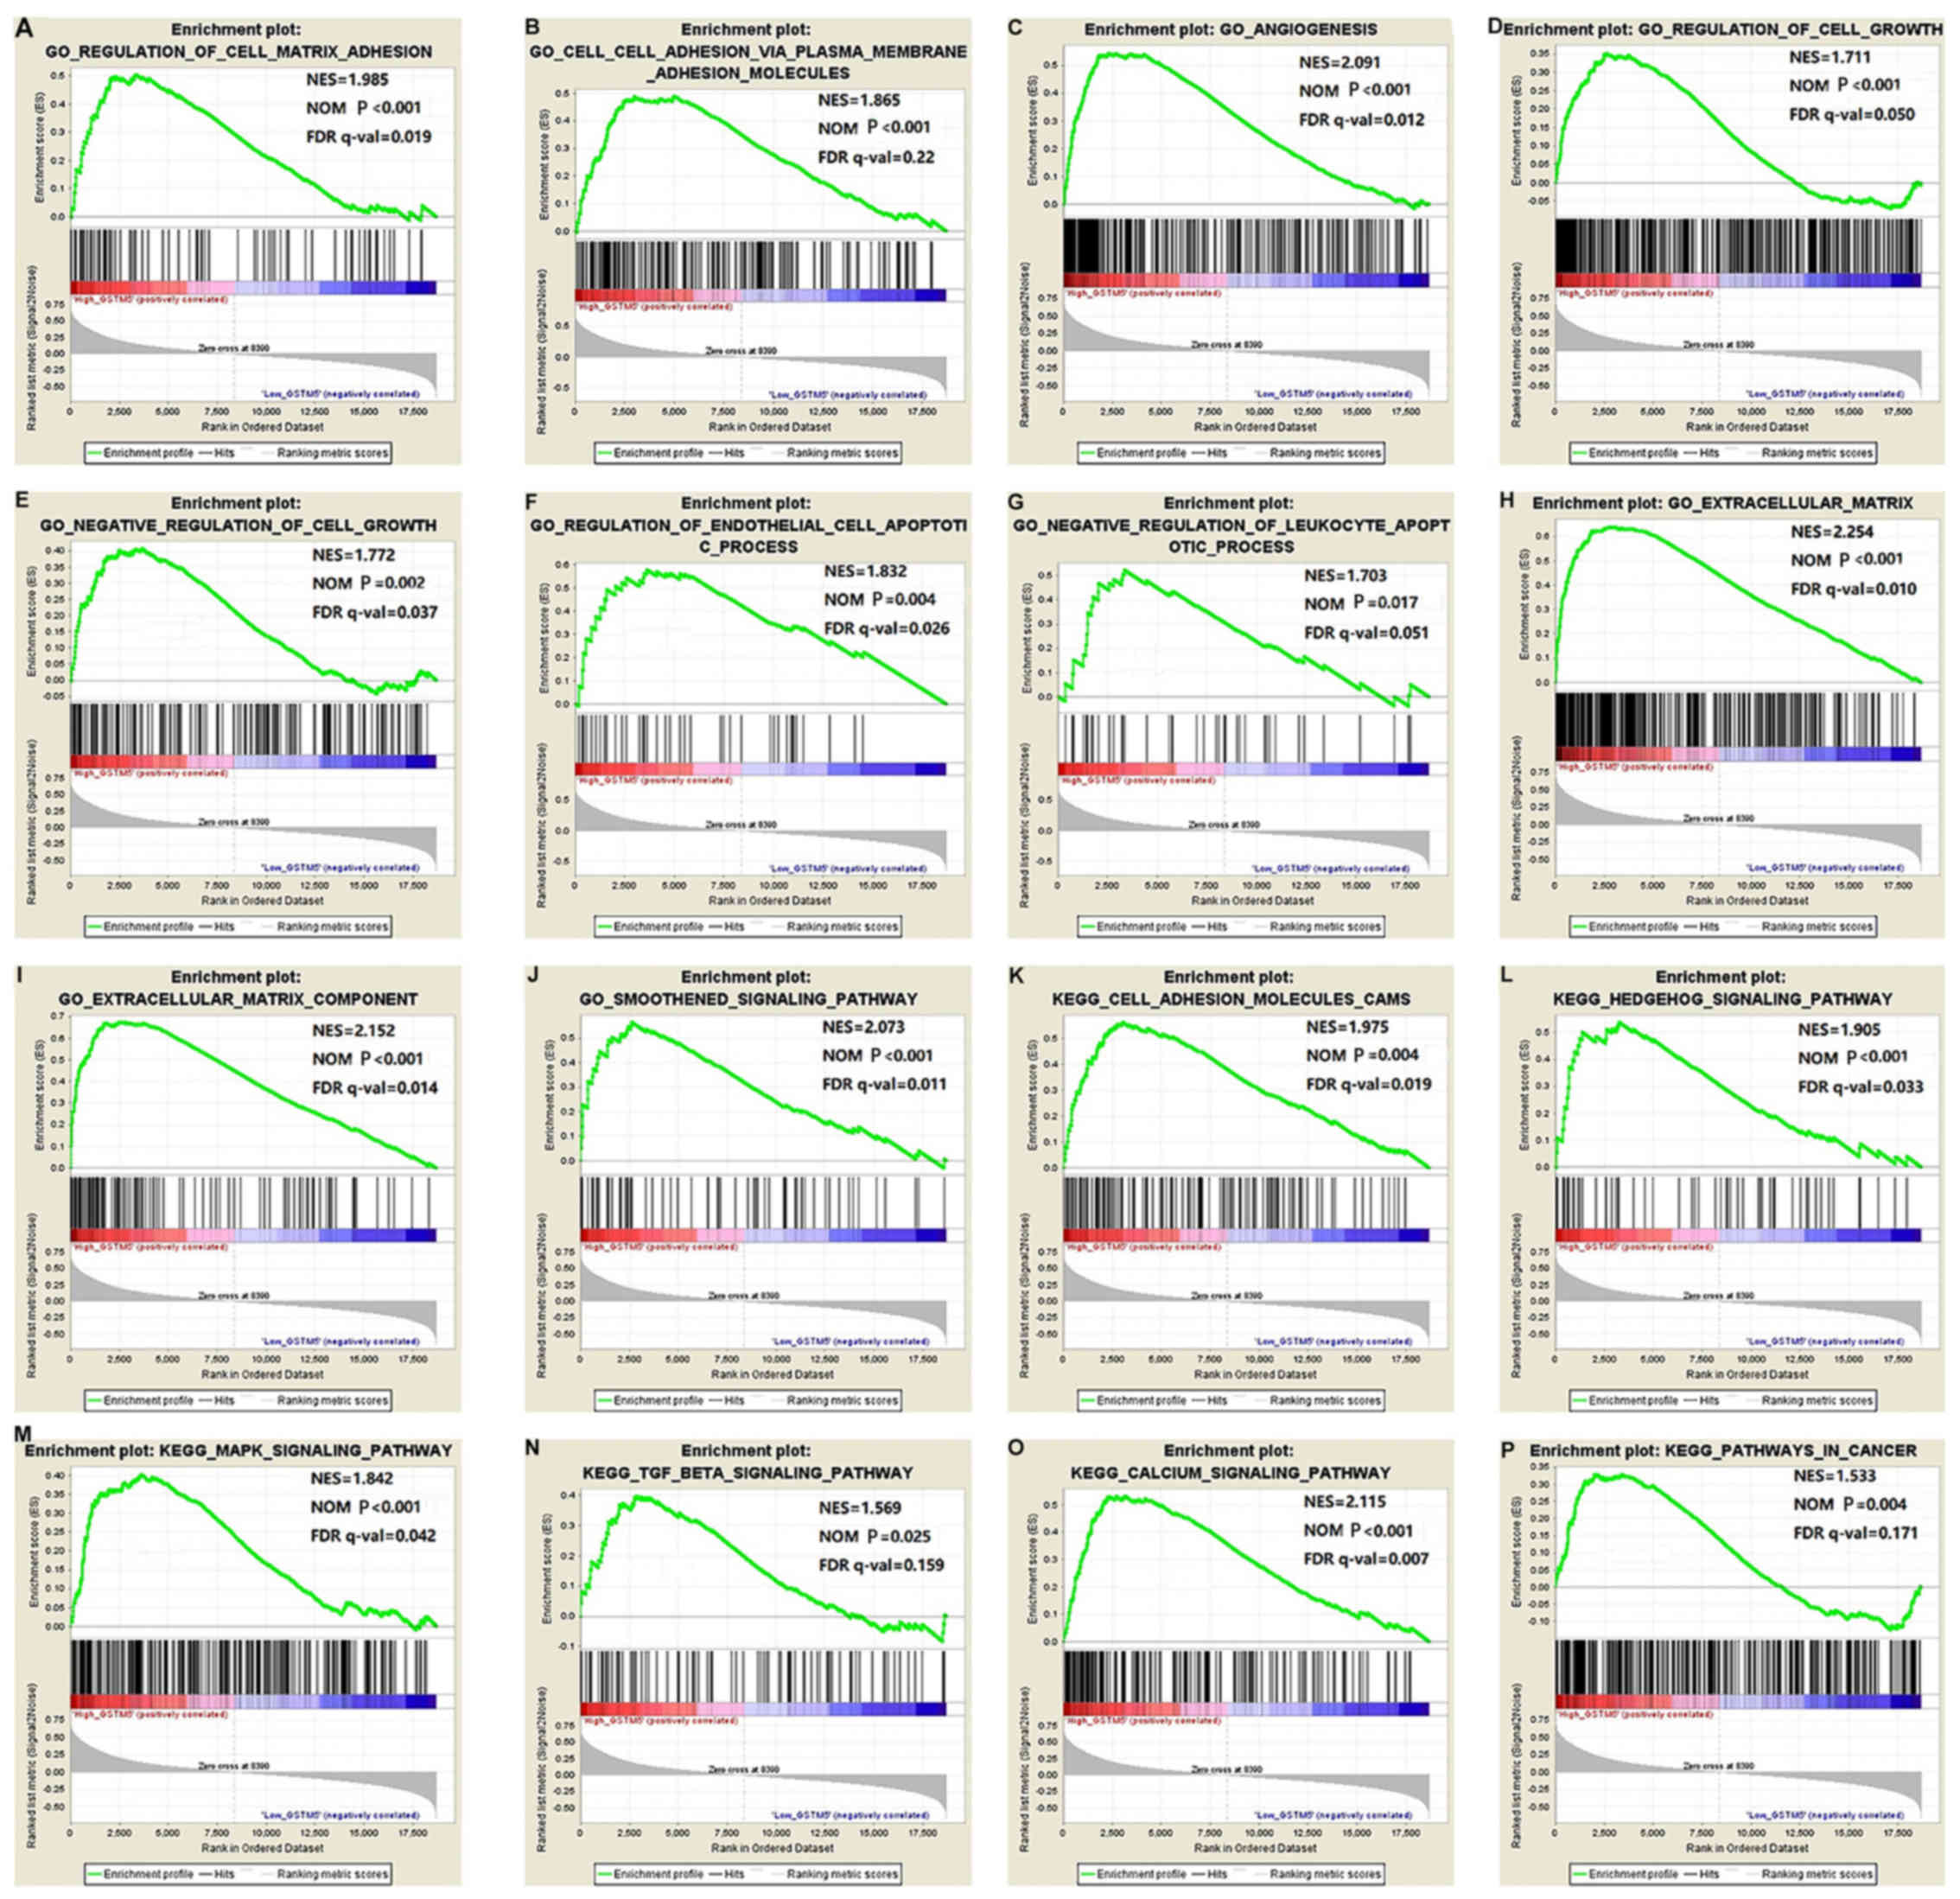
To explore the mechanisms underlying GSTM5 function,
GSEA was used to assess differences in relative GSTM5 expression
levels among TCGA specimens (Fig. 8,
Tables SI and SII). In the GSEA, high levels of GSTM5
were significantly enriched in the following processes: ‘regulation
of cell matrix adhesion’ (P<0.001), ‘angiogenesis’ (P<0.001),
‘regulation of cell growth’ (P<0.001), ‘regulation of
endothelial cell apoptotic process’ (P=0.004), ‘extracellular
matrix’ (P<0.001), ‘smoothened signaling pathway’ (P<0.001),
‘Hedgehog signaling pathway’ (P<0.001), ‘mitogen-activated
protein kinases (MAPK) signaling pathway’ (P<0.001),
‘transforming growth factor (TGF)-β signaling pathway’ (P=0.025),
‘calcium signaling pathway’ (P<0.001) and other KEGG pathways
associated with cancer.
Genome-wide co-expression analysis of
GSTM5 in GC and potential functional enrichment
To determine the potential mechanism underlying
GSTM5 function in GC, genome-wide co-expression analysis was
performed. Regulatory networks of GSTM5 and its co-expressed
correlated genes identified in GC tumor tissues from the TCGA
cohort are presented in Fig. 9 and
Table SIII. GO analysis suggested
that GSTM5 and its co-expressed genes were significantly enriched
in processes including ‘cell adhesion’ (P=1.97×10⁻⁵),
‘single organismal cell-cell adhesion’ (P=3.83×10⁻⁵),
‘focal adhesion’ (P=3.24×10⁻⁴), ‘positive regulation of
cell-substrate adhesion’ (P=0.003), ‘angiogenesis’ (P=0.004),
‘apoptotic process involved in luteolysis’ (P=0.048), ‘negative
regulation of cell growth’ (P=2.75×10⁻⁵), ‘negative
regulation of cell proliferation’ (P=8.51×10⁻⁵),
‘negative regulation of cell migration’ (P=8.89×10⁻⁴)
and ‘negative regulation of Wnt signaling pathway’ (P=0.010).
Enrichment of GSTM5 and its co-expressed genes in the ‘plasma
membrane’ (P=0.002) and ‘extracellular matrix’
(P=1.88×10⁻¹⁰) was observed by GO cell component
analysis (Tables V and SIV). Furthermore, GSTM5 and its
co-expressed genes were enriched in the following KEGG pathways
associated with prognosis: ‘Cyclic guanosine monophosphate-protein
kinase G (cGMP-PKG) signaling pathway’ (P=3.04×10⁻⁹),
cyclic adenosine monophosphate (cAMP) signaling pathway’ (P=0.004),
‘calcium signaling pathway’ (P=0.008), ‘focal adhesion’ (P=0.017)
and ‘cell adhesion molecules (CAMs)’ (P=0.026) (Table VI).
| Table V.GO term enrichments of co-expressed
genes of glutathione S-transferase Mu 5 in gastric cancer. |
Table V.
GO term enrichments of co-expressed
genes of glutathione S-transferase Mu 5 in gastric cancer.
| Term | Count | P-value | Genes |
|---|
| GO:0007155~cell
adhesion | 22 |
1.97×10⁻⁵ | SELP, SVEP1,
CYP1B1, ATP1B2, MPDZ, IGFBP7, MCAM, EMILIN1, ITGA9, PGM5, SRPX,
S1PR1, COL19A1, ITGA7, RHOB, TGFB1I1, MFAP4, BOC, PARVA, FEZ1,
AOC3, SPON1 |
| GO:0016337~single
organismal cell-cell adhesion | 10 |
3.83×10⁻⁵ | COL14A1, LIMS2,
COL19A1, FOXF1, PIP5K1C, NLGN2, JAM2, COL8A2, NTN1, NEGR1 |
| GO:0005925~focal
adhesion | 18 |
3.24×10⁻⁴ | TLN1, LIMS2,
PDLIM7, FHL1, FERMT2, PIP5K1C, CSRP1, MCAM, FLNA, ANXA6, TNS2,
TNS1, PGM5, LAYN, ILK, RHOB, TGFB1I1, PARVA |
| GO:0010811~positive
regulation of cell-substrate adhesion | 5 | 0.003 | SMOC2, FOXF1,
CCDC80, ABI3BP, EMILIN1 |
|
GO:0001525~angiogenesis | 11 | 0.004 | CYP1B1, S1PR1,
MEOX2, RHOB, TMEM100, TNFSF12, MCAM, COL8A2, MEIS1, JAM3,
MMRN2 |
|
GO:0061364~apoptotic process involved in
luteolysis | 2 | 0.048 | SLIT2, SLIT3 |
|
GO:0031012~extracellular matrix | 25 |
1.88×10⁻¹⁰ | LTBP1, IGFBP7, DCN,
ABI3BP, MMRN2, OGN, ILK, COL8A2, MYOC, SPON1, MGP, CPXM2, SOD3,
FLNA, EMILIN1, PRELP, FBLN1, COL14A1, SERPINF1, SFRP1, FBLN5,
TGFB1I1, MFAP4, SSC5D, CLEC14A |
|
GO:0030198~extracellular matrix
organization | 18 |
2.11×10⁻⁸ | RECK, ELN, CCDC80,
DCN, ABI3BP, EMILIN1, ITGA9, SMOC2, FBLN1, COL14A1, COL19A1,
CRISPLD2, FOXF1, FBLN5, ITGA7, JAM2, JAM3, COL8A2 |
|
GO:0005578~proteinaceous extracellular
matrix | 21 |
2.62×10⁻⁸ | LTBP1, PODN,
SPARCL1, ADAMTSL3, ELN, MGP, SLIT2, PRELP, SLIT3, EMILIN1, OGN,
SMOC2, FBLN1, COL14A1, COL19A1, SFRP1, CRISPLD2, FBLN5, COL8A2,
MYOC, SPON1 |
|
GO:0005576~extracellular region | 52 |
6.02×10⁻⁶ | NXPH3, TLN1, A2M,
LTBP1, FGF7, CXORF36, IGFBP7, TNFSF12, OLFML1, OGN, ST3GAL3, RSPO1,
RSPO3, ITIH5, LGI4, GHR, SERPING1, SLIT2, FLNA, SLIT3, PRELP,
CHRDL1, PTGDS, SERPINF1, MFAP4, ELN, C1R, DCN, C1S, C1QTNF7,
METTL24, ANGPTL7, IL17B, CRISPLD2, COL8A2, VSTM4, SVEP1, EFEMP2,
PTGFR, FRZB, NTN1, SOD3, PLAC9, EMILIN1, FBLN1, COL14A1, COL19A1,
CCL14, SFRP1, FAM198A, LCN6, FBLN5 |
|
GO:0005201~extracellular matrix structural
constituent | 8 |
1.02×10⁻⁴ | FBLN1, COL14A1,
COL19A1, EFEMP2, ELN, MGP, COL8A2, PRELP |
|
GO:0050840~extracellular matrix
binding | 4 | 0.008 | SPARCL1, ELN, DCN,
SSC5D |
| GO:0005886~plasma
membrane | 92 | 0.002 | RHOJ, SLC9A9, GYPC,
CADM3, TLN1, JPH2, ATP1B2, TACR2, ADCY5, GRIK5, NCS1, TNFSF12,
FRRS1L, DMPK, EDNRA, ST6GALNAC6, S1PR1, SLC2A4, NMUR1, ILK,
GUCY1A3, RHOB, ATP8B2, TMEM100, FAM129A, NEGR1, BOC, GHR, RAMP3,
KCNMA1, RECK, AR, MAGI2, ACKR1, MRGPRF, COLEC12, FLNA, SLIT2, TNS2,
CHRM2, ROR2, GUCY1B3, CLIP3, JAM2, JAM3, AOC3, PARVA, FXYD1, ABCA8,
LIMS2, CYSLTR1, ARHGEF25, FHL1, GNG11, KCNA5, PLPP1, FXYD6, KCNMB1,
RGMA, FAT3, PLIN4, PKD2, KLHL41, PRIMA1, EHD2, TRPC1, SELP, VSTM4,
GNAO1, KLF9, EPM2A, MAP1B, NPR1, NPR2, ATP1A2, MAPK10, MCAM, PTGFR,
ITPR1, ITGA9, ABCC9, TMEM47, PDE2A, SFRP1, PLSCR4, P2RY14, BNC2,
ITGA7, SCN4B, APBB1, HTR2A, FEZ1 |
| GO:0030308~negative
regulation of cell growth | 11 |
2.75×10⁻⁵ | RERG, SFRP1, DACT3,
CRYAB, FHL1, NPR1, WFDC1, FRZB, APBB1, SLIT2, SLIT3 |
| GO:0008285~negative
regulation of cell proliferation | 19 |
8.51×10⁻⁵ | AR, MAGI2, CYP1B1,
PODN, ADARB1, NDN, IGFBP7, ZEB1, FRZB, PLPP1, KANK2, SLIT3, RERG,
TNS2, SFRP1, SPEG, PKD2, ROR2, TGFB1I1 |
| GO:0030336~negative
regulation of cell migration | 8 |
8.89×10⁻⁴ | RECK, ADARB1, PODN,
CYP1B1, MAGI2, SFRP1, RHOB, SLIT2 |
| GO:0030178~negative
regulation of Wnt signaling pathway | 5 | 0.010 | BARX1, SFRP1,
DACT3, NFATC4, FRZB |
|
GO:0035385~roundabout signaling
pathway | 3 | 0.016 | OGN, SLIT2,
SLIT3 |
|
GO:0007229~integrin-mediated signaling
pathway | 6 | 0.022 | ITGA9, FBLN1,
FERMT2, ITGA7, ILK, ADAM33 |
|
GO:0007224~smoothened signaling
pathway | 5 | 0.026 | EVC, FOXF1, CC2D2A,
ROR2, BOC |
| Table VI.Kyoto Encyclopedia of Genes and
Genomes term enrichments of co-expressed genes of glutathione
S-transferase Mu 5 in gastric cancer. |
Table VI.
Kyoto Encyclopedia of Genes and
Genomes term enrichments of co-expressed genes of glutathione
S-transferase Mu 5 in gastric cancer.
| Term | Count | P-value | Genes |
|---|
| hsa04022: cGMP-PKG
signaling pathway | 17 |
3.04×10⁻⁹ | KCNMA1, ATP1B2,
ADCY5, MRVI1, NPR1, NPR2, ATP1A2, KCNMB1, ITPR1, MYL9, EDNRA,
PDE2A, PLN, PDE5A, GUCY1A3, NFATC4, GUCY1B3 |
| hsa04024: cAMP
signaling pathway | 10 | 0.004 | EDNRA, FXYD1,
ATP1B2, CHRM2, ADCY5, PLN, NPR1, MAPK10, ATP1A2, MYL9 |
| hsa04020: Calcium
signaling pathway | 9 | 0.008 | EDNRA, CYSLTR1,
TACR2, CHRM2, PLN, PDE1A, PTGFR, ITPR1, HTR2A |
| hsa04510: Focal
adhesion | 9 | 0.017 | ITGA9, TLN1, ITGA7,
ILK, PPP1R12C, MAPK10, FLNA, PARVA, MYL9 |
| hsa04514: Cell
adhesion molecules (CAMs) | 7 | 0.026 | ITGA9, SELP, CADM3,
NLGN2, JAM2, NEGR1, JAM3 |
Discussion
In the present study, the expression levels of GSTM
genes and their prognostic value in GC were assessed. A positive
correlation was observed between GSTM5 expression and poor OS in
GC. In addition, GSEA analysis and genome-wide co-expression
analysis were used to predict potential mechanistic roles of GSTM5
in GC.
There are five members of the GSTM class of genes
that encode phase II metabolic enzymes found primarily in the
cytosol that co-operate with phase I enzymes in carcinogen
metabolism (26). These genes are
involved in the detoxification of electrophilic compounds,
including carcinogens, therapeutic drugs, environmental toxins and
products of oxidative stress, by conjugation with glutathione
(27).
Previous studies revealed that the GSTM family of
genes have critical roles in several cancer types. GSTM1 is highly
polymorphic in humans and is associated with multiple cancer types,
such as bladder and breast cancer, metabolic disorders and
autoimmune diseases, as well as anticancer drugs response and
resistance (28) GSTM1 deletion in
humans was indicated to have a key role in bladder (29) and breast cancer (30,31),
multiple sclerosis (32), severe
early-onset mental disorders including schizophrenia-spectrum
disorder, bipolar disorder with psychotic symptoms or first-episode
psychosis (33) and acute myeloid
leukemia (34). Csejtei et al
(35) identified that GSTM1 may be a
prognostic biomarker in clinical diagnostics as well as a potential
therapeutic candidate in colorectal cancer. A recent study detected
null GSTM1 genotypes in the tumor area of GC, in contrast to the
presence of both genes in the proximal and distal margins of the
tumor (36). Therefore, GSTM1
polymorphisms may be a potential prognostic marker for certain
types of cancer. A protective effect of GSTM2 on oxidative stress
was identified in studies performed in hepatic carcinoma, colon
cells and spontaneously hypertensive rat (37–39).
Previous studies have revealed an association between GSTM3 and
certain cancer types, including laryngeal (40), oral (41,42),
esophageal (43), breast (44), bladder (45), multiple cutaneous basal cell
(46) cancer and childhood acute
lymphoblastic leukemia (12). GSTM4
is a less studied member of the GSTM family and has been
demonstrated to recognize the same standard glutathione
S-transferases substrate 1-chloro-2,4-dinitrobenzen as other GSTMs,
only with lower specific activity (47). The possible role of GSTM5 in the
development of cancer warrants further exploration. Peng et
al (48) reported that GSTM5 is
involved in the detoxification of reactive electrophiles and is
associated with Barrett's adenocarcinoma. Pankratz et al
(49) observed that high-risk tag
single-nucleotide polymorphisms in GSTM5 and ATP binding cassette
subfamily C member 4 genes may be a good combined predictor of
mortality in low-stage non-small cell lung cancer. Gene-based
analysis also revealed that the expression of GSTM5 was involved in
the OS of patients diagnosed with low-stage non-small cell lung
cancer (49). Similar results were
observed in a study by Kap et al (50), reporting that GSTM5 was
differentially expressed in colon cancer tissues compared with
normal colon tissues. In addition, high expression of GSTM5 is
associated with poor OS in patients with colorectal cancer treated
with oxaliplatin (HR=1.50, 95% CI: 1.03-2.19) (50). These conclusions suggested that GSTM5
may be an important prognostic biomarker. Despite previous studies
revealing an association between GSTM5 and OS, associations between
GSTM5 and survival of patients with GC have remained to be
determined. The present study revealed that among all GSTM genes,
only GSTM5 was independently associated with poor OS in patients
with GC. According to the present nomogram, it was indicated that
the contribution of the tumor stage increased with more advanced
stages and higher expression levels of GSTM5 were associated with a
less favorable survival prognosis. Compared with the tumor stage,
age, sex and GSTM5 expression, the tumor stage and age were more
significantly associated with GSTM5 expression. Therefore, the OS
rate of patients with GC may be predicted using this model. The
nomogram indicated that the combination of GSTM5 and other
indicators may be considered a novel method to predict the
prognosis for patients with GC.
In the stratified analyses with the KM plotter
online database, higher levels of GSTM5 were associated with worse
OS in female and male patients, clinical stages I–III, all Lauren
classifications, treatment by surgery, administration of other
adjuvant therapies, as well as a negative HER2 status. However, OS
was not associated with female sex, age >65 years or clinical
stage in the TCGA GC cohort. There were 375 cases of GC in the
TCGA, but there were 875 cases of GC in the KM plotter online
database. As TCGA appeared to have a shortage of GC samples,
another prospective study should be performed in the future. The
comprehensive survival analysis with stratification suggested that
GSTM5 has value as an independent prognostic indicator for GC.
The mechanisms underlying the functions of GSTM5 in
GC have remained largely elusive. In the present study, the
outcomes of the GSEA analysis indicated that GSTM5 is involved in
‘regulation of cell matrix adhesion’, ‘angiogenesis’, ‘regulation
of cell growth’, ‘regulation of endothelial cell apoptotic
process’, ‘Hedgehog signaling’, ‘MAPK signaling’, ‘TGF-β signaling’
and other cancer-associated pathways. According to the results of
the genome-wide co-expression matrix, co-expressed genes were
enriched in ‘cell adhesion’, ‘angiogenesis’, ‘apoptotic process
involved in luteolysis’, ‘cGMP-PKG signaling pathway’ and ‘cAMP
signaling pathway’. In the GSEA analysis as well as the genome-wide
co-expression matrix, enrichment in adhesion, angiogenesis and
apoptosis was determined. During tumorigenesis, recurrence,
invasion and metastasis are significantly affected by adhesion
molecules (48). Aberrant expression
of cell adhesion molecules may lead to abnormal proliferation of
normal cells, and aberrant expression of these molecules is
frequently associated with general carcinogenesis (51). Angiogenesis allows the tumor to grow,
infiltrate and metastasize (52). Du
et al (53) demonstrated that
the synthesis of vascular endothelial growth factor is modulated by
the cAMP-protein kinase A-cAMP response element-binding pathway.
Zhang et al (54) reported
that loss of the regulative effect of dimethylarginine
dimethylaminohydrolase 1 in the nitric oxide-cGMP-PKG pathway may
lead to decreased angiogenesis. These studies demonstrated that
cAMP and cGMP biosynthesis are associated with angiogenesis.
The Hedgehog pathway serves a crucial role in cell
proliferation and differentiation in adult organisms, and
dysregulation of this pathway is associated with multiple cancer
types. Saze et al (55)
demonstrated that Hedgehog signaling is a prognostic indicator for
patients with GC. Qin et al (56) revealed that Hedgehog signaling is
associated with the apoptosis of GC cells. The MAPK signaling
pathway serves a vital role in controlling cellular processes,
including proliferation, differentiation and apoptosis (57). As a multifunctional growth factor,
TGF-β regulates several cellular processes, including
proliferation, development, homeostasis of stem cells, enhancing
fibrosis and modulating the immune response through its downstream
targets (58). TGF family of
proteins are involved in tumor initiation and progression, cell
proliferation, angiogenesis, epithelial to mesenchymal transition,
invasion and inflammation (59). The
results of the present GSEA analysis and genome-wide co-expression
matrix demonstrated that high expression of GSTM5 was associated
with the prognosis of GC. However, the exact mechanisms underlying
the function of GSTM5 in the development of GC require to be
elucidated.
The present study has certain limitations. First,
since the clinical parameters were obtained from a public database,
some clinical data were not available such as chemotherapy, smoking
and infection with Helicobacter pylori, and therefore, a
comprehensive analysis was not performed. Furthermore, the results
were obtained with the dataset of the public TCGA database.
Therefore, further experiments such as immunohistochemistry for
GSTM5 should be designed and performed to validate the prognostic
value in GC. In addition, the association between GSTM proteins and
GC prognosis was not investigated, since GSTM protein expression
data were not available. Despite these limitations, the present
study was the first to systematically investigate the association
between the expression of GSTM genes and OS in GC, to the best of
our knowledge. The present results indicated that high expression
of GSTM5 in GC is associated with poor prognosis, suggesting that
GSTM5 may be a novel prognostic indicator for GC.
In conclusion, the present study indicated that
GSTM5 mRNA expression is associated with unfavorable OS in patients
with GC. This suggests that GSTM5 may be a prognostic marker and
potential target for GC therapy. Furthermore, the potential
mechanisms underlying GSTM5 function in GC were also explored using
the GSEA and genome-wide co-expression analyses. To predict the OS
of patients with GC, a nomogram composed of GSTM5 and tumor stage
was also constructed. However, additional studies are required to
further validate the results of the present study.
Supplementary Material
Supporting Data
Acknowledgements
Not applicable.
Funding
The study was supported by the Natural Science
Foundation of Guangxi Zhuang Autonomous Region (grant no.
2017AB45153), the Scientific Research and Technology Development
Program of Guangxi (grant no. 1598011-4), the Natural Science
Foundation of Guangxi (grant no. 2016GXNSFAA380180), the Guangxi
Zhuang Autonomous Region Health and Family Planning Commission
(grant no. Z2015526) and the Youth Science Foundation of Guangxi
Medical University (grant no. GXMUYSF201502).
Availability of data and materials
The datasets generated and analyzed during the
current study are available in TCGA repository, https://portal.gdc.cancer.gov.
Authors' contributions
JC, YC and BL conceived and designed the study. XL
was responsible for the acquisition of data. YM performed the
statistical analysis. JW, JL, ZW and SL, analysed and interpreted
the data, drafted the manuscript and revised it critically for
important intellectual content. All authors read and approved the
final manuscript.
Ethics approval and consent to
participate
Not applicable.
Patient consent for publication
Not applicable.
Competing interests
The authors declare that they have no competing
interests.
References
|
1
|
Bray F, Ferlay J, Soerjomataram I, Siegel
RL, Torre LA and Jemal A: Global cancer statistics 2018: GLOBOCAN
estimates of incidence and mortality worldwide for 36 cancers in
185 countries. CA Cancer J Clin. 68:394–424. 2018. View Article : Google Scholar : PubMed/NCBI
|
|
2
|
Plummer M, Franceschi S, Vignat J, Forman
D and de Martel C: Global burden of gastric cancer attributable to
Helicobacter pylori. Int J Cancer. 136:487–490. 2015.
View Article : Google Scholar : PubMed/NCBI
|
|
3
|
Ramos MFKP, Ribeiro Júnior U, Viscondi
JKY, Zilberstein B, Cecconello I and Eluf-Neto J: Risk factors
associated with the development of gastric cancer-case-control
study. Rev Assoc Med Bras. 64:611–619. 2018. View Article : Google Scholar : PubMed/NCBI
|
|
4
|
Aurello P, Berardi G, Antolino L,
Antonelli G, Rampini A, Moschetta G and Ramacciato G: Is a surgical
approach justified in metachronous krukenberg tumor from gastric
cancer? A systematic review. Oncol Res Treat. 41:644–649. 2018.
View Article : Google Scholar : PubMed/NCBI
|
|
5
|
Wadhwa R, Taketa T, Sudo K, Blum MA and
Ajani JA: Modern oncological approaches to gastric adenocarcinoma.
Gastroenterol Clin North Am. 42:359–369. 2013. View Article : Google Scholar : PubMed/NCBI
|
|
6
|
Zeng H, Zheng R, Guo Y, Zhang S, Zou X,
Wang N, Zhang L, Tang J, Chen J, Wei K, et al: Cancer survival in
China, 2003–2005 : A population-based study. Int J Cancer.
136:1921–1930. 2015. View Article : Google Scholar : PubMed/NCBI
|
|
7
|
Steele CB, Li J, Huang B and Weir HK:
Stomach cancer survival in the United States by race and stage
(2001–2009): Findings from the CONCORD-2 study. Cancer. 123 (Suppl
24):S5160–S5177. 2017. View Article : Google Scholar
|
|
8
|
Taubitz J: Structure, function and
evolution of glutathione transferases: Implications for
classification of non-mammalian members of an ancient enzyme
superfamily. Violence Visibility Mod Hist. 16:199–221. 2001.
|
|
9
|
Pearson WR, Vorachek WR, Xu SJ, Berger R,
Hart I, Vannais D and Patterson D: Identification of class-mu
glutathione transferase genes GSTM1-GSTM5 on human chromosome 1p13.
Am J Hum Genet. 53:220–233. 1993.PubMed/NCBI
|
|
10
|
Hayes JD and Strange RC: Glutathione
S-transferase polymorphisms and their biological consequences.
Pharmacology. 61:154–166. 2000. View Article : Google Scholar : PubMed/NCBI
|
|
11
|
Parl FF: Glutathione S-transferase
genotypes and cancer risk. Cancer Lett. 221:123–129. 2005.
View Article : Google Scholar : PubMed/NCBI
|
|
12
|
Kearns PR, Chrzanowska-Lightowlers ZMA,
Pieters R, Veerman A and Hall AG: Mu class glutathione
S-transferase mRNA isoform expression in acute lymphoblastic
leukaemia. Br J Haematol. 120:80–88. 2003. View Article : Google Scholar : PubMed/NCBI
|
|
13
|
Dennis G Jr, Sherman BT, Hosack DA, Yang
J, Gao W, Lane HC and Lempicki RA: DAVID: Database for annotation,
visualization, and integrated discovery. Genome Biol. 4:P32003.
View Article : Google Scholar : PubMed/NCBI
|
|
14
|
Huang da W, Sherman BT and Lempicki RA:
Systematic and integrative analysis of large gene lists using DAVID
bioinformatics resources. Nat Protoc. 4:44–57. 2009. View Article : Google Scholar : PubMed/NCBI
|
|
15
|
Mostafavi S, Ray D, Warde-Farley D,
Grouios C and Morris Q: GeneMANIA: A real-time multiple association
network integration algorithm for predicting gene function. Genome
Biol. 9 (Suppl 1):S42008. View Article : Google Scholar : PubMed/NCBI
|
|
16
|
Warde-Farley D, Donaldson SL, Comes O,
Zuberi K, Badrawi R, Chao P, Franz M, Grouios C, Kazi F, Lopes CT,
et al: The GeneMANIA prediction server: Biological network
integration for gene prioritization and predicting gene function.
Nucleic Acids Res. 38((Web Server issue)): W214–W220. 2010.
View Article : Google Scholar : PubMed/NCBI
|
|
17
|
Szklarczyk D, Gable AL, Lyon D, Junge A,
Wyder S, Huerta-Cepas J, Simonovic M, Doncheva NT, Morris JH, Bork
P, et al: STRING v11: Protein-protein association networks with
increased coverage, supporting functional discovery in genome-wide
experimental datasets. Nucleic Acids Res. 47:D607–D613. 2019.
View Article : Google Scholar : PubMed/NCBI
|
|
18
|
R Core Team, . R: A language and
environment for statistical computing. R Foundation for Statistical
Computing. (Vienna, Austria). 2012.ISBN 3-900051-07-0, URL
http://www.R-project.org/.
|
|
19
|
Wittekind C: The development of the TNM
classification of gastric cancer. Pathol Int. 65:399–403. 2015.
View Article : Google Scholar : PubMed/NCBI
|
|
20
|
Chen YC, Fang WL, Wang RF, Liu CA, Yang
MH, Lo SS, Wu CW, Li AF, Shyr YM and Huang KH: Clinicopathological
variation of lauren classification in gastric cancer. Pathol Oncol
Res. 22:197–202. 2016. View Article : Google Scholar : PubMed/NCBI
|
|
21
|
Nagy Á, Lánczky A, Menyhárt O and Gyorffy
B: Validation of miRNA prognostic power in hepatocellular carcinoma
using expression data of independent datasets. Sci Rep. 8:92272018.
View Article : Google Scholar : PubMed/NCBI
|
|
22
|
Szász AM, Lánczky A, Nagy Á, Förster S,
Hark K, Green JE, Boussioutas A, Busuttil R, Szabó A and Győrffy B:
Cross-validation of survival associated biomarkers in gastric
cancer using transcriptomic data of 1,065 patients. Oncotarget.
7:49322–49333. 2016. View Article : Google Scholar : PubMed/NCBI
|
|
23
|
Balachandran VP, Gonen M, Smith JJ and
DeMatteo RP: Nomograms in oncology: More than meets the eye. Lancet
Oncol. 16:e173–e180. 2015. View Article : Google Scholar : PubMed/NCBI
|
|
24
|
Liao X, Yang C, Huang R, Han C, Yu T,
Huang K, Liu X, Yu L, Zhu G, Su H, et al: Identification of
potential prognostic long non-coding RNA biomarkers for predicting
survival in patients with hepatocellular carcinoma. Cell Physiol
Biochem. 48:1854–1869. 2018. View Article : Google Scholar : PubMed/NCBI
|
|
25
|
Subramanian A, Tamayo P, Mootha VK,
Mukherjee S, Ebert BL, Gillette MA, Paulovich A, Pomeroy SL, Golub
TR, Lander ES and Mesirov JP: Gene set enrichment analysis: A
knowledge-based approach for interpreting genome-wide expression
profiles. Proc Natl Acad Sci USA. 102:15545–15550. 2005. View Article : Google Scholar : PubMed/NCBI
|
|
26
|
Yager JD and Davidson NE: Estrogen
carcinogenesis in breast cancer. N Engl J Med. 35:270–282. 2006.
View Article : Google Scholar
|
|
27
|
Nebert D and Asilisvasiliou N: Analysis of
the glutathione S-transferase (GST) gene family. Hum Genomics.
1:460–464. 2004. View Article : Google Scholar : PubMed/NCBI
|
|
28
|
Saitou M, Satta Y and Gokcumen O: Complex
haplotypes of GSTM1 gene deletions harbor signatures of a selective
sweep in East Asian populations. G3 (Bethesda). 8:2953–2966. 2018.
View Article : Google Scholar : PubMed/NCBI
|
|
29
|
Rothman N, Garcia-Closas M, Chatterjee N,
Malats N, Wu X, Figueroa JD, Real FX, Van Den Berg D, Matullo G,
Baris D, et al: A multi-stage genome-wide association study of
bladder cancer identifies multiple susceptibility loci. Nat Genet.
42:978–984. 2010. View
Article : Google Scholar : PubMed/NCBI
|
|
30
|
Li S, Lang GT, Zhang YZ, Yu KD, Shao ZM
and Zhang Q: Interaction between glutathione S-transferase
M1-null/present polymorphism and adjuvant chemotherapy influences
the survival of breast cancer. Cancer Med. 7:4202–4207. 2018.
View Article : Google Scholar : PubMed/NCBI
|
|
31
|
Steck SE, Gaudet MM, Britton JA,
Teitelbaum SL, Terry MB, Neugut AI, Santella RM and Gammon MD:
Interactions among GSTM1, GSTT1 and GSTP1 polymorphisms,
cruciferous vegetable intake and breast cancer risk.
Carcinogenesis. 28:1954–1959. 2007. View Article : Google Scholar : PubMed/NCBI
|
|
32
|
Parchami Barjui S, Reiisi S and Bayati A:
Human glutathione s-transferase enzyme gene variations and risk of
multiple sclerosis in Iranian population cohort. Mult Scler Relat
Disord. 17:41–46. 2017. View Article : Google Scholar : PubMed/NCBI
|
|
33
|
Pejovic-Milovancevic MM, Mandic-Maravic
VD, Coric VM, Mitkovic-Voncina MM, Kostic MV, Savic-Radojevic AR,
Ercegovac MD, Matic MG, Peljto AN, Lecic-Tosevski DR, et al:
Glutathione S-transferase deletion polymorphisms in early-onset
psychotic and bipolar disorders: A case-control study. Lab Med.
47:195–204. 2016. View Article : Google Scholar : PubMed/NCBI
|
|
34
|
Nasr A, Sami R, Ibrahim N and Darwish D:
Glutathione S transferase (GSTP 1, GSTM 1, and GSTT 1) gene
polymorphisms in Egyptian patients with acute myeloid leukemia.
Indian J Cancer. 52:490–495. 2015. View Article : Google Scholar : PubMed/NCBI
|
|
35
|
Csejtei A, Tibold A, Varga Z, Koltai K,
Ember A, Orsos Z, Feher G, Horvath OP, Ember I and Kiss I: GSTM,
GSTT and p53 polymorphisms as modifiers of clinical outcome in
colorectal cancer. Anticancer Res. 28:1917–1922. 2008.PubMed/NCBI
|
|
36
|
Maccormick TM, Carvalho CES, Neto GPB and
Carvalho MDGDC: Comparative analysis of glutathione transferase
genetic polymorphism, Helicobacter pylori and Epstein-Barr
virus between the tumor area and the proximal and distal resection
margins of gastric cancer. Rev Col Bras Cir. 46:e20682019.
View Article : Google Scholar : PubMed/NCBI
|
|
37
|
Nishimura J, Dewa Y, Okamura T, Muguruma
M, Jin M, Saegusa Y, Umemura T and Mitsumori K: Possible
involvement of oxidative stress in fenofibrate-induced
hepatocarcinogenesis in rats. Arch Toxicol. 82:641–654. 2008.
View Article : Google Scholar : PubMed/NCBI
|
|
38
|
Zhou SG, Wang P, Pi RB, Gao J, Fu JJ, Fang
J, Qin J, Zhang HJ, Li RF, Chen SR, et al: Reduced expression of
GSTM2 and increased oxidative stress in spontaneously hypertensive
rat. Mol Cell Biochem. 309:99–107. 2008. View Article : Google Scholar : PubMed/NCBI
|
|
39
|
Ebert MN, Klinder A, Peters WHM,
Schäferhenrich A, Sendt W, Scheele J and Pool-Zobel BL: Expression
of glutathione S-transferases (GSTs) in human colon cells and
inducibility of GSTM2 by butyrate. Carcinogenesis. 24:1637–1644.
2003. View Article : Google Scholar : PubMed/NCBI
|
|
40
|
Jourenkova-Mironova N, Voho A, Bouchardy
C, Wikman H, Dayer P, Benhamou S and Hirvonen A: Glutathione
S-transferase GSTM3 and GSTP1 genotypes and larynx cancer risk.
Cancer Epidemiol Biomarkers Prev. 8:185–188. 1999.PubMed/NCBI
|
|
41
|
Park JY, Muscat JE, Kaur T, Schantz SP,
Stern JC, Richie JP and Lazarus P: Comparison of GSTM polymorphisms
and risk for oral cancer between African-Americans and Caucasians.
Pharmacogenetics. 10:123–131. 2000. View Article : Google Scholar : PubMed/NCBI
|
|
42
|
Sikdar N, Paul RR and Roy B: Glutathione
S-transferase M3 (A/A) genotype as a risk factor for oral cancer
and leukoplakia among Indian tobacco smokers. Int J Cancer.
109:95–101. 2004. View Article : Google Scholar : PubMed/NCBI
|
|
43
|
Jain M, Kumar S, Lal P, Tiwari A, Ghoshal
UC and Mittal B: Role of GSTM3 polymorphism in the risk of
developing esophageal cancer. Cancer Epidemiol Biomarkers Prev.
16:178–181. 2007. View Article : Google Scholar : PubMed/NCBI
|
|
44
|
Yu KD, Fan L, Di GH, Yuan WT, Zheng Y,
Huang W, Chen AX, Yang C, Wu J, Shen ZZ and Shao ZM: Genetic
variants in GSTM3 gene within GSTM4-GSTM2-GSTM1-GSTM5-GSTM3 cluster
influence breast cancer susceptibility depending on GSTM1. Breast
Cancer Res Treat. 121:485–496. 2010. View Article : Google Scholar : PubMed/NCBI
|
|
45
|
Schnakenberg E, Breuer R, Werdin R,
Dreikorn K and Schloot W: Susceptibility genes: GSTM1 and GSTM3 as
genetic risk factors in bladder cancer. Cytogenet Cell Genet.
91:234–238. 2000. View Article : Google Scholar : PubMed/NCBI
|
|
46
|
Yengi L, Inskip A, Gilford J, Alldersea J,
Bailey L, Smith A, Lear JT, Heagerty AH, Bowers B, Hand P, et al:
Polymorphism at the glutathione S-transferase locus GSTM3:
Interactions with cytochrome P450 and glutathione S-transferase
genotypes as risk factors for multiple cutaneous basal cell
carcinoma. Cancer Res. 56:1974–1977. 1996.PubMed/NCBI
|
|
47
|
Comstock KE, Widersten M, Hao XY, David
Henner W and Mannervik B: A comparison of the enzymatic and
physicochemical properties of human glutathione transferase M4-4
and three other human Mu class enzymes. Arch Biochem Biophys.
311:487–495. 1994. View Article : Google Scholar : PubMed/NCBI
|
|
48
|
Peng D, Razvi M, Chen H, Washington K,
Roessner A, Schneider-Stock R and El-Rifai W: DNA hypermethylation
regulates the expression of members of the Mu-class
Glutathione-S-Transferases and glutathione peroxidases in Barrett's
adenocarcinoma. Gut. 58:5–15. 2007. View Article : Google Scholar
|
|
49
|
Pankratz VS, Sun Z, Aakre J, Li Y, Johnson
C, Garces YI, Aubry MC, Molina JR, Wigle DA and Yang P: Systematic
evaluation of genetic variants in three biological pathways on
patient survival in low-stage non-small cell lung cancer. J Thorac
Oncol. 6:1488–1495. 2011. View Article : Google Scholar : PubMed/NCBI
|
|
50
|
Kap EJ, Seibold P, Scherer D, Habermann N,
Balavarca Y, Jansen L, Zucknick M, Becker N, Hoffmeister M, Ulrich
A, et al: SNPs in transporter and metabolizing genes as predictive
markers for oxaliplatin treatment in colorectal cancer patients.
Int J Cancer. 138:2993–3001. 2016. View Article : Google Scholar : PubMed/NCBI
|
|
51
|
Okegawa T, Pong RC, Li Y and Hsieh JT: The
role of cell adhesion molecule in cancer progression and its
application in cancer therapy. Acta Biochim Pol. 51:445–457. 2004.
View Article : Google Scholar : PubMed/NCBI
|
|
52
|
Carmeliet P and Jain RK: Angiogenesis in
cancer and other diseases. Nature. 407:249–257. 2000. View Article : Google Scholar : PubMed/NCBI
|
|
53
|
Du X, Ou X, Song T, Zhang W, Cong F, Zhang
S and Xiong Y: Adenosine A2B receptor stimulates angiogenesis by
inducing VEGF and eNOS in human microvascular endothelial cells.
Exp Biol Med. 240:1472–1479. 2015. View Article : Google Scholar
|
|
54
|
Zhang P, Xu X, Hu X, Wang H, Fassett J,
Huo Y, Chen Y and Bache RJ: DDAH1 deficiency attenuates endothelial
cell cycle progression and angiogenesis. PLoS One. 8:e794442013.
View Article : Google Scholar : PubMed/NCBI
|
|
55
|
Saze Z, Terashima M, Kogure M, Ohsuka F,
Suzuki H and Gotoh M: Activation of the sonic hedgehog pathway and
its prognostic impact in patients with gastric cancer. Dig Surg.
29:115–123. 2012. View Article : Google Scholar : PubMed/NCBI
|
|
56
|
Qin H, Cai A, Xi H, Yuan J and Chen L:
ZnRF3 induces apoptosis of gastric cancer cells by antagonizing Wnt
and Hedgehog signaling. Cell Biochem Biophys. 73:361–367. 2015.
View Article : Google Scholar : PubMed/NCBI
|
|
57
|
Kim EK and Choi EJ: Compromised MAPK
signaling in human diseases: An update. Arch Toxicol. 89:867–882.
2015. View Article : Google Scholar : PubMed/NCBI
|
|
58
|
Katz LH, Likhter M, Jogunoori W, Belkin M,
Ohshiro K and Mishra L: TGF-β signaling in liver and
gastrointestinal cancers. Cancer Lett. 379:166–172. 2016.
View Article : Google Scholar : PubMed/NCBI
|
|
59
|
Liu S, Chen S and Zeng J: TGF-β signaling:
A complex role in tumorigenesis (Review). Mol Med Rep. 17:699–704.
2018.PubMed/NCBI
|