Introduction
There were 1,000,000 new cases of gastric cancer
(GC) and an estimated 783,000 deaths worldwide in 2018 (1). Surgery has always been the main method
of treating advanced GC. However, the effect of surgery alone is
unsatisfactory and adjuvant chemotherapy is indispensable for the
comprehensive treatment of GC (2).
Chemotherapeutic regimens based on 5-fluorouracil
(5-Fu) and platinum are widely used in the adjuvant treatment of GC
(3). Among these regimens, the
capecitabine and oxaliplatin (CapeOX) regimen is one of the most
commonly used regimens for adjuvant chemotherapy following GC
surgery (3). Capecitabine is an oral
preparation of antimetabolites that act specifically on tumor
cells. After oral administration, capecitabine is rapidly absorbed
through the intestinal mucosa and converted into 5-Fu through a
three-step enzyme chain reaction in vivo (4). Capecitabine blocks the intracellular
thymidine synthase from deoxyribonucleotide uridine and interferes
with DNA synthesis (4). Oxaliplatin
has stronger cytotoxic effect and fewer side effects compared with
cisplatin and can bind to DNA after entering the nucleus (5). This phenomenon results in the formation
of a variety of intra- and interstrand crosslinking structures,
thereby leading to DNA damage and initiating apoptosis through a
variety of damage mechanisms (5).
Although the effect of the CapeOX regimen on GC is
clear, the clinical response of patients with GC differs and some
patients have a poor response to chemotherapy (6). Sensitization strategies for effective
GC CapeOX regimens remain to be found. Studies on genome-wide
research have revealed the diversity and the complex genetic
alterations of patients with GC, which can explain the differing
responses of different patients during chemotherapy (7,8).
Currently, few biomarkers for the prediction of CapeOX chemotherapy
have been validated for clinical use. Therefore, establishing a
multibiomarker prediction tool is required.
In the present study, the genes associated with
capecitabine and oxaliplatin drug response were explored using The
Cancer Genome Atlas (TCGA) database and further validated in
clinical samples. A model was established to analyze the
probability of the treatment resistance of patients with GC and
predict their outcomes. The present study may help physicians to
administer the appropriate chemotherapy regimens and provide a
theoretical basis for further intervention and the reversal of drug
resistance in GC treatment.
Materials and methods
TCGA database and CapeOX-related gene
analysis
Datasets were downloaded from TCGA database
(https://www.cancer.gov/about-nci/organization/ccg/research/structural-genomics/tcga).
The data on patient survival, history of medication and mRNA
expression profiles were downloaded from the TCGA-Stomach
Adenocarcinoma data (STAD) repository (https://portal.gdc.cancer.gov/). Subsequently, two
expression profiles were established for further analysis. One
profile contained 29 cases previously treated with capecitabine and
the other profile included 17 cases treated with oxaliplatin. The
genes that met the cut-off criteria (fold-change >2 and adjusted
P<0.1) were considered differentially expressed genes (DEGs).
The integrative analysis of the two sets of DEGs was performed
using cross analysis. Clustering analyses were performed to show
the expression patterns of the DEGs. Online biological tools were
used to investigate the functions and pathways of the candidate
DEGs. Gene Ontology (GO) enrichment analysis (http://www.geneontology.org/) was used to explore the
biological functions associated with the DEGs.
Identification of survival-related
DEGs
The TCGA-STAD dataset included 279 patients with GC
and newly updated survival information and gene expression arrays.
The patients were assigned to high- or low-gene expression groups
in accordance with the median of the RNA expression level data.
Patient information and tissue
samples
A total of 74 GC tissue samples were obtained from
patients in the Affiliated Suzhou Hospital of Nanjing Medical
University. The inclusion criteria for patients were: i) At least
18 years of age and signed written informed consent and ii) radical
gastrectomy for GC and adjuvant CapeOX chemotherapy. Patients who
received any chemoradiotherapy or immunotherapy before surgery were
excluded. The patients included 45 males and 29 females with a
median age of 63 years. All fresh tissues were collected between
December 2017 and May 2019. The tissue samples were immediately
frozen and stored at −80°C for gene expression analysis. All
patients were diagnosed consistently by clinicians and pathologists
and followed up from the time of surgery to death or last contact.
The follow-up was mainly conducted over the phone. The protocols of
the study were approved by The Ethics Committee of the Affiliated
Suzhou Hospital of Nanjing Medical University (Suzhou, China).
Written informed consent was obtained from each patient.
Reverse transcription-quantitative
(RT-q) PCR
Frozen tissues were homogenized and TRIzol reagent
(Takara Bio, Inc.) was used to exact total tissue RNA following the
manufacturer's instruction at 4°C and the total extraction time was
~1 h. Individual RNA was subjected to RT-qPCR by using the titanium
one-step RT-PCR detection kit (Takara Bio, Inc.) and the HT7500
system (Applied Biosystems; Thermo Fisher Scientific, Inc.)
according to the manufacturer's protocols. Tissue (~10 mg) was used
for RNA extraction in each reaction. The reaction volume was 20 µg.
The PCR thermocycling conditions were as follows: 95°C
pre-denaturation for 3 min; then 35 cycles of denaturation at 95°C
for 30 sec followed by annealing and extension at 55°C for 45 sec.
Each experiment was repeated 3 times. The 2−ΔΔCq method
was used for gene quantification (9). The sequences of the primers were:
Uroplakin-1b (UPK1B), forward: 5′-GTGGGCCTCGATTCTACAGG-3′
and reverse: 5′-GATGTCACGTATCCAGCAAATCT-3′; fatty acid-binding
protein, heart (FABP3), forward: 5′-GGCACCTGGAAGCTAGTGG-3′
and reverse: 5′-CTGCCTGGTAGCAAAACCC-3′; cystatin-M (CST6),
forward: 5′-TACTTCCTGACGATGGAGATGG-3′ and reverse:
5′-GAGTTCTGCCAGGGAACCAC-3′; caspase-5 (CASP5), forward:
5′-TCACCTGCCTGCAAGGAATG-3′ and reverse:
5′-TCTTTTCGTCAACCACAGTGTAG-3′; corticosteroid 11-β-dehydrogenase
isozyme 2 (HSD11B2), forward: 5′-ATTAGCCGCGTGCTAGAGTTC-3′
and reverse: 5′-CCGCATCAGCAACTACTTCAT-3′; cytochrome P450 4X1
(CYP4X1), forward: 5′-TGAGCAGAACAGATCCCAAGT-3′ and reverse:
5′-CAGAATGAGCCATCACCTCAAT-3′; epidermal growth factor receptor
kinase substrate 8-like protein 3 (EPS8L3), forward:
5′-AGCCATTTACTTGCACCGGAA-3′, and reverse:
5′-CTCCCCTGCTTGCATGTCAT-3′; GADPH, forward:
5′-GAAGGTGAAGGTCGGAGTC-3′ and reverse: 5′-GAAGATGGTGATGGGATTTC-3′.
GADPH served as an endogenous control to normalize gene expression.
The comparative cycle threshold method was used to calculate the
relative abundance of RNA compared with the expression of GADPH,
hence the fold difference relative to GADPH was determined.
DEG validation and predictive model
construction
All patients were divided into the recurrence and
the non--recurrence groups through follow-up. A t-test was applied
to validate the DEGs between the recurrence and the nonrecurrence
groups. The genes that met the cut-off criteria (fold-change >2
and adjusted P<0.05) were validated DEGs. A predictive
regression model was constructed using the four validated DEGs
(UPK1B, FABP3, CASP5 and CYP4X1). Subsequently, a
nomogram was constructed to visualize the results. For each
patient, the nomogram helped calculate the total score and then
predict the probability of the result.
Statistical analysis
For TCGA database analysis, the Deseq2 method was
applied to standardize the data and eliminate the influence of the
platform effect using R language version 3.6.3 (R Core Team,
Vienna, Austria) (10). A unpaired
t-test was applied to identify the DEGs between complete response
(CR) and non-CR GC tissues. For GO enrichment analysis, P<0.1
was set as the threshold. For identification of survival-related
DEGs, univariate Cox regression was performed. Statistical
significance was assessed using the Tarone-Ware test and P<0.05
was set as the threshold. For the survival analysis of a single
gene, Kaplan-Meier survival analysis was performed for patients
with high/low differential gene expression. A Multivariate Cox
regression model was used to evaluate the weight of the effect of
genes on survival.
Receiver operating characteristic (ROC) curve
analysis was performed to evaluate the sensitivity and the
specificity of the DEGs and the model for GC CapeOX treatment
response prediction was evaluated using the SPSS software version
20.0 (IBM Corp.). An area under the curve (AUC) value was
calculated and used to designate the ROC effect. The nomogram was
built with R language version 3.6.3 (10). In the nomogram, the regression
coefficients of all independent variables were used to determine
the proportion of scores. P<0.05 was considered to indicate a
statistically significant difference.
Results
DEG identification and data
integration
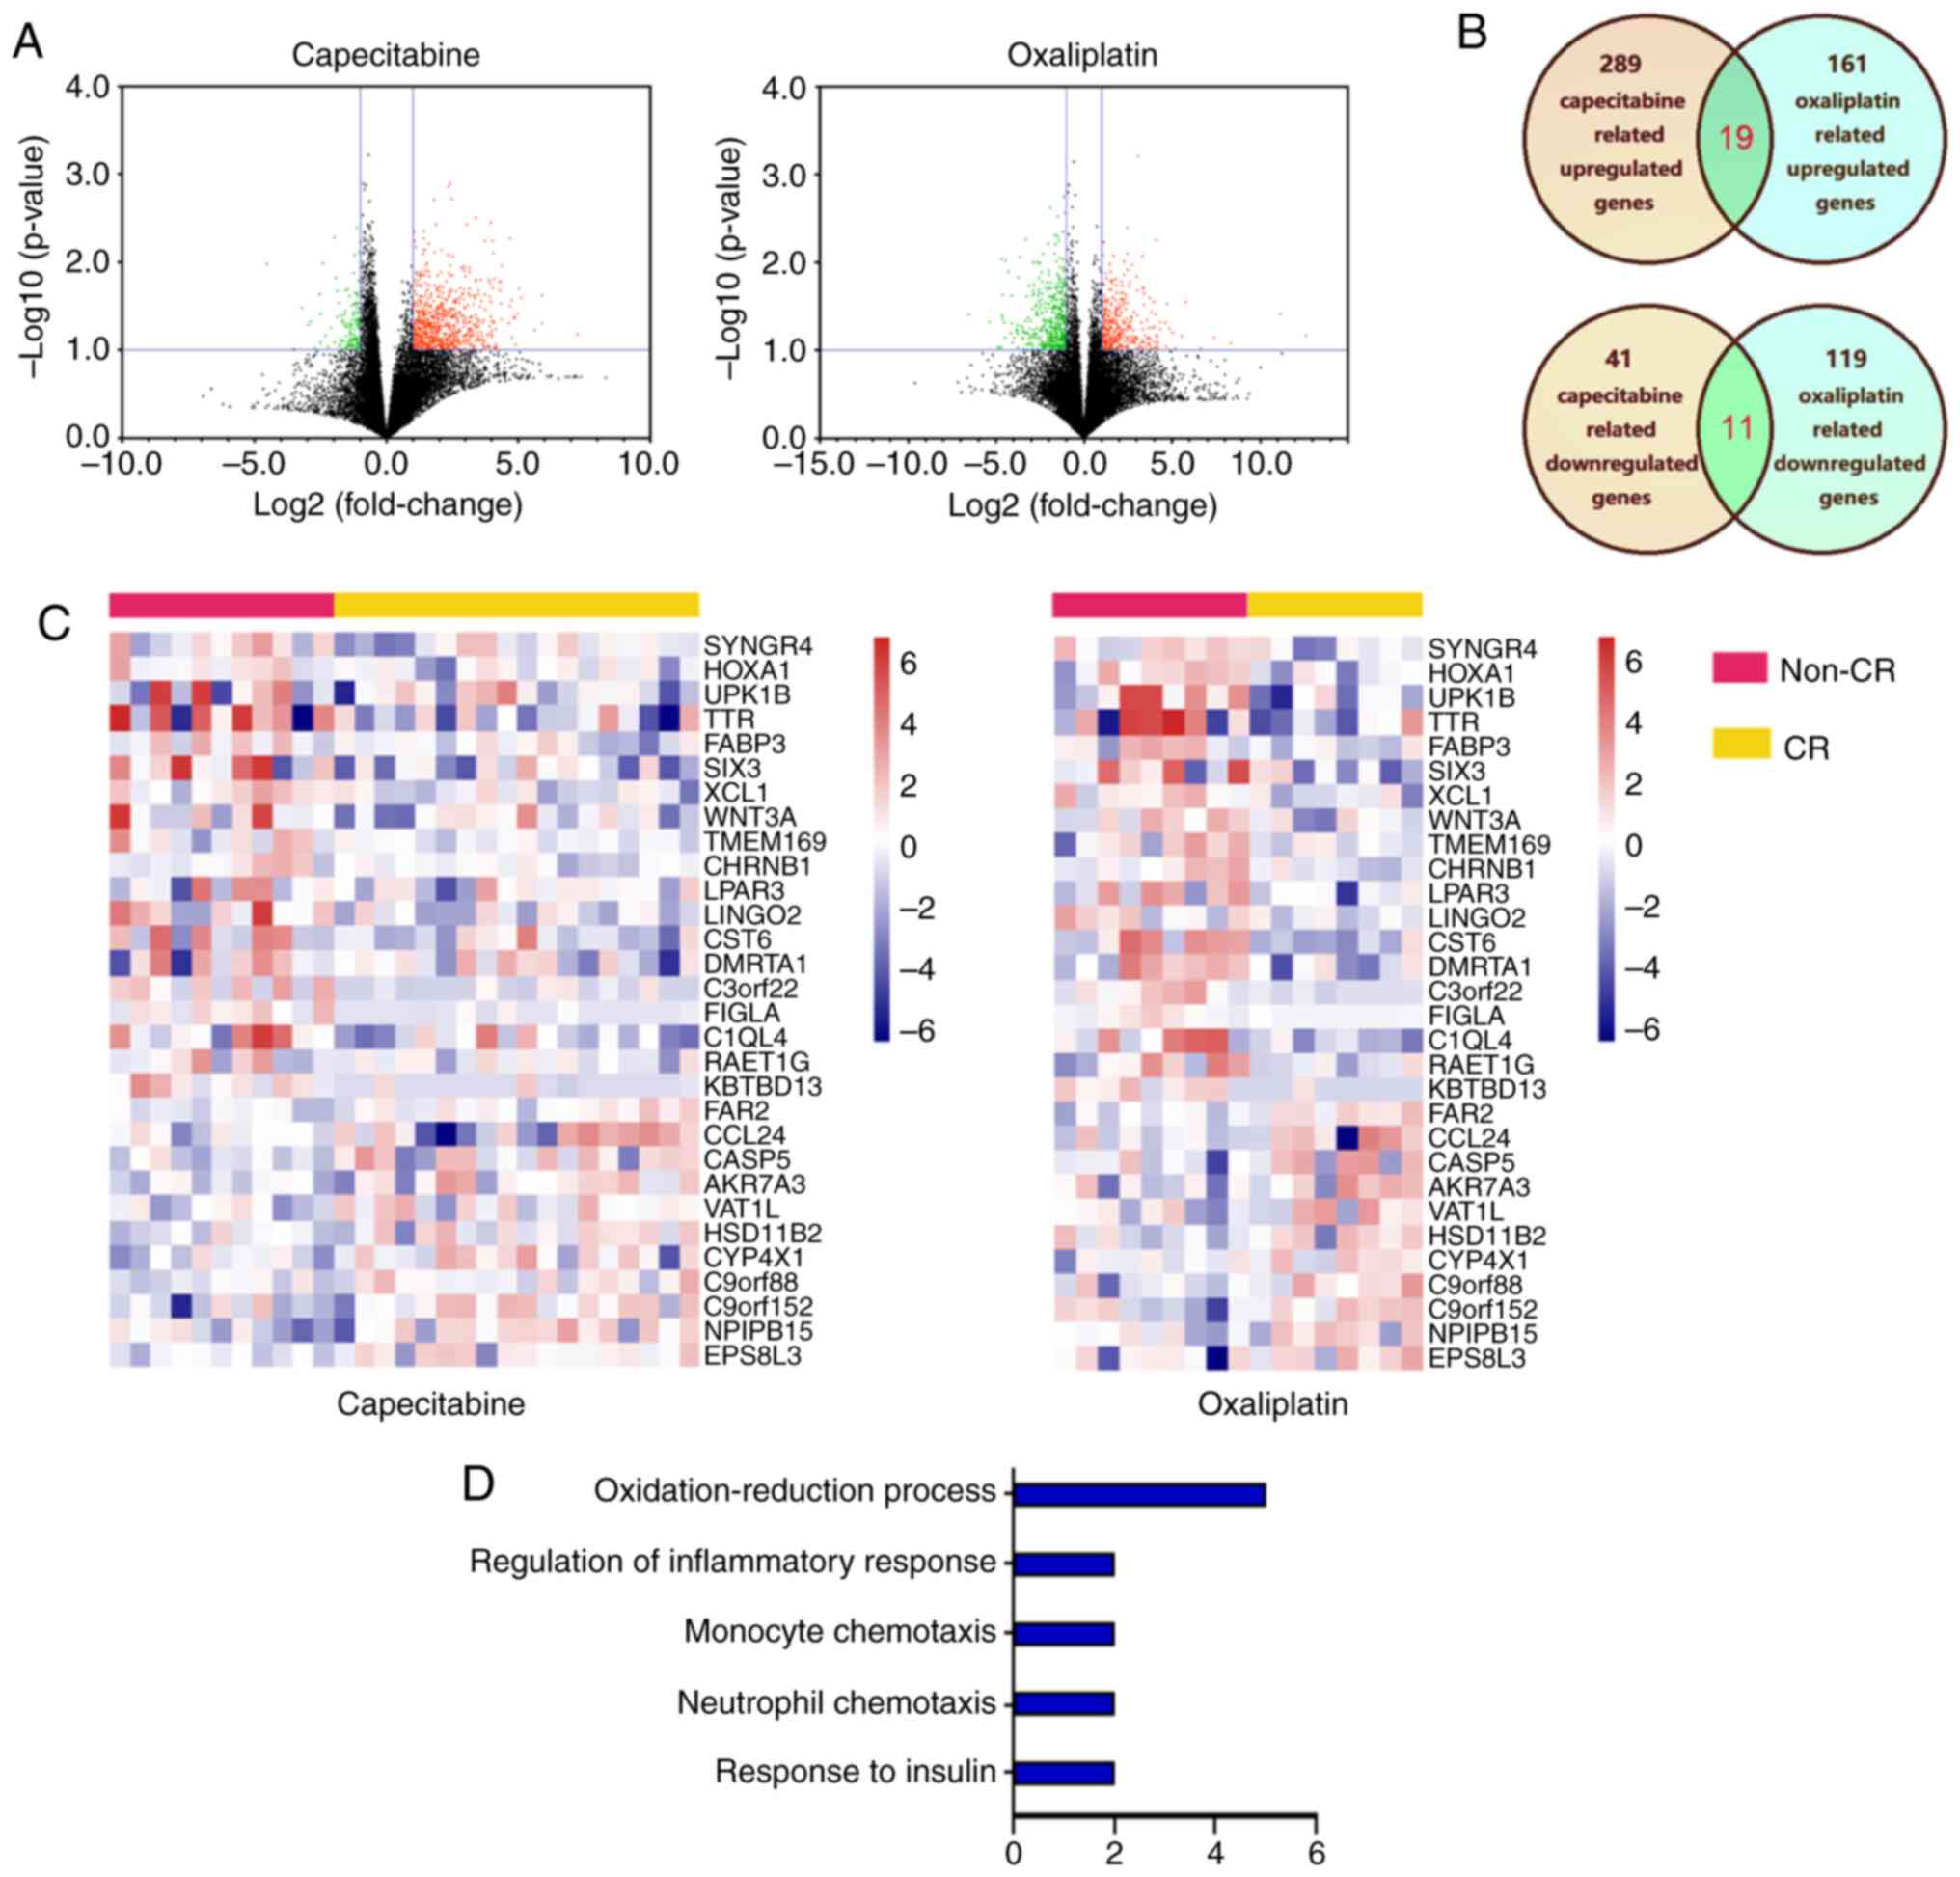
The datasets of GC were downloaded from TCGA
database. Among the cases, 17 oxaliplatin (including eight CR and
nine non-CR) and 29 capecitabine (including 18 CR and 11 non-CR)
treatment cases were obtained. The gene expression profiles from
the capecitabine treatment cases identified 330 DEGs (289
upregulated genes and 41 downregulated genes) between non-CR and CR
cases (Fig. 1A). The gene expression
profiles from the oxaliplatin treatment cases identified 280 DEGs
(161 upregulated genes and 119 downregulated genes) between non-CR
and CR cases. Through cross analysis, 30 consistent DEGs were
identified from the aforementioned profiles (Fig. 1B) and the hierarchical cluster
heatmap of the integrated data demonstrated that these genes can
distinguish between patients with CR and non-CR significantly
(P<0.05) (Fig. 1C). GO functional
analysis was performed to characterize the function of the DEGs and
identify the key candidate pathways. The GO analysis demonstrated
that the DEGs were enriched in processes such as
‘oxidation-reduction process’, ‘regulation of inflammatory
response’, ‘monocyte chemotaxis’, ‘neutrophil chemotaxis’ and
‘response to insulin’ (Fig. 1D). The
results of GO enrichment indicated that the DEGs in the network
serve an important role in GC treatment with capecitabine and
oxaliplatin.
Identification of key DEGs associated
with GC survival
The TCGA-STAD dataset contained the transcriptome
sequencing data and the latest follow-up clinical data of 279
cases. The Cox univariate regression analysis of the 30 DEGs was
performed using these data. As shown in Table I, seven genes were independent risk
factors for patient prognosis. The high expression of UPK1B
(P=0.002), FABP3 (P=0.006) and CST6 (P=0.041) and the
low expression of CASP5 (P=0.022), HSD11B2 (P=0.045),
CYP4X1 (P=0.026) and EPS8L3 (P=0.013) were
significantly associated with poor prognosis. The survival curves
of all the above genes also showed significant differences between
the high expression and low expression groups (P<0.05; Fig. 2). These results suggested that the
expression of these seven genes can reflect the short-term response
of patients to chemotherapeutic drugs and may be associated with
the long-term survival of patients.
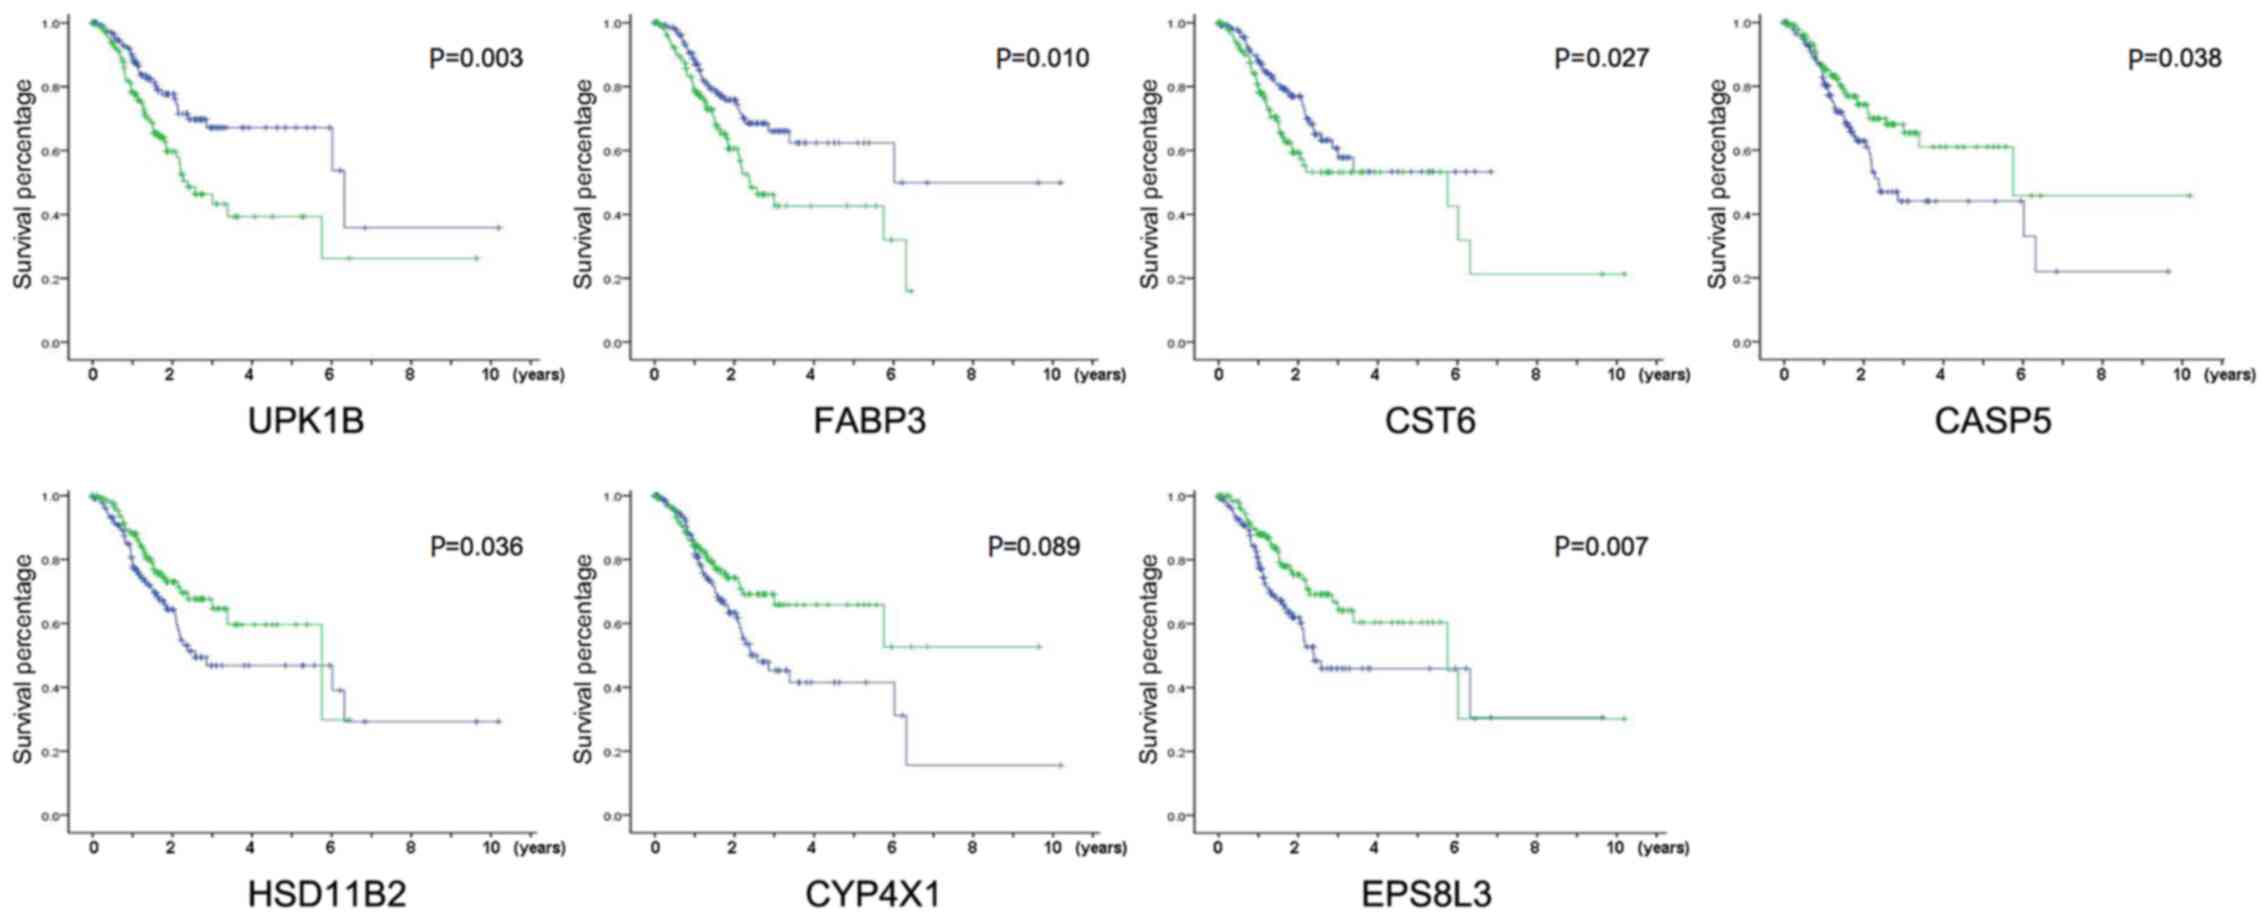 | Figure 2.Identification of key DEGs associated
with GC survival. Kaplan-Meier survival curves for patients of GC
with high and low indicated gene expression in TCGA-STAD dataset,
P-values were calculated using the Tarone-Ware test, green line
represented high expression group and blue line represented low
expression group. DEGs, differentially expressed genes; GC, gastric
cancer; TCGA-STAD, The Cancer Genome Atlas Stomach Adenocarcinoma
data; UPK1B, uroplakin-1b; FABP3, fatty acid-binding protein,
heart; CST6, cystatin-M; CASP5, caspase-5; HSD11B2, corticosteroid
11-β-dehydrogenase isozyme 2; CYP4X1, cytochrome P450 4X1; EPS8L3,
epidermal growth factor receptor kinase substrate 8-like protein
3. |
 | Table I.Seven genes are significant
independent risk factors for the prognosis of patients with CR and
non-CR gastric cancer. |
Table I.
Seven genes are significant
independent risk factors for the prognosis of patients with CR and
non-CR gastric cancer.
| Gene | Regulation | Hazard ratio | P-value |
|---|
| SYNGR4 | Up | −0.103 | 0.633 |
| HOXA1 | Up | −0.277 | 0.208 |
| UPK1B | Up | 0.681 | 0.002b |
| TTR | Up | 0.128 | 0.552 |
| FABP3 | Up | 0.609 | 0.006b |
| SIX3 | Up | 0.116 | 0.593 |
| XCL1 | Up | −0.010 | 0.962 |
| WNT3A | Up | −0.144 | 0.511 |
| TMEM169 | Up | 0.332 | 0.126 |
| CHRNB1 | Up | 0.037 | 0.866 |
| LPAR3 | Up | 0.241 | 0.266 |
| LINGO2 | Up | 0.125 | 0.563 |
| CST6 | Up | 0.446 | 0.041a |
| DMRTA1 | Up | 0.072 | 0.741 |
| C3orf22 | Up | −0.093 | 0.668 |
| FIGLA | Up | 0.276 | 0.204 |
| C1QL4 | Up | 0.144 | 0.506 |
| RAET1G | Up | 0.248 | 0.252 |
| KBTBD13 | Up | 0.136 | 0.555 |
| FAR2 | Down | −0.254 | 0.248 |
| CCL24 | Down | −0.113 | 0.601 |
| CASP5 | Down | −0.504 | 0.022a |
| AKR7A3 | Down | −0.278 | 0.207 |
| VAT1L | Down | 0.036 | 0.868 |
| HSD11B2 | Down | −0.442 | 0.045a |
| CYP4X1 | Down | −0.490 | 0.026a |
| C2orf88 | Down | −0.044 | 0.838 |
|
C9orf152 | Down | −0.116 | 0.594 |
| NPIPB15 | Down | −0.304 | 0.164 |
| EPS8L3 | Down | −0.545 | 0.013a |
Validation of the DEGs in clinical
tissue samples
The mRNA expression of the seven genes in 74
clinical GC tissues with adjuvant CapeOX treatment was detected
using RT-qPCR to confirm the reliability of the identified DEGs.
Through follow-up, 31 patients with recurrence and 43 patients
without recurrence were found. Results demonstrated a significant
upregulation of UPK1B and FABP3 and a significant
downregulation of CASP5 and CYP4X1 in the recurrence
group compared with those in the non-recurrence group (Fig. 3A). The Kaplan-Meier survival analysis
demonstrated that patients with high or low expression of UPK1B,
FABP3, CASP5 and CYP4X1 had significantly different
overall survival times (Fig. 3B).
Each gene expression was divided into high or low expression by
using the median as the cut-off.
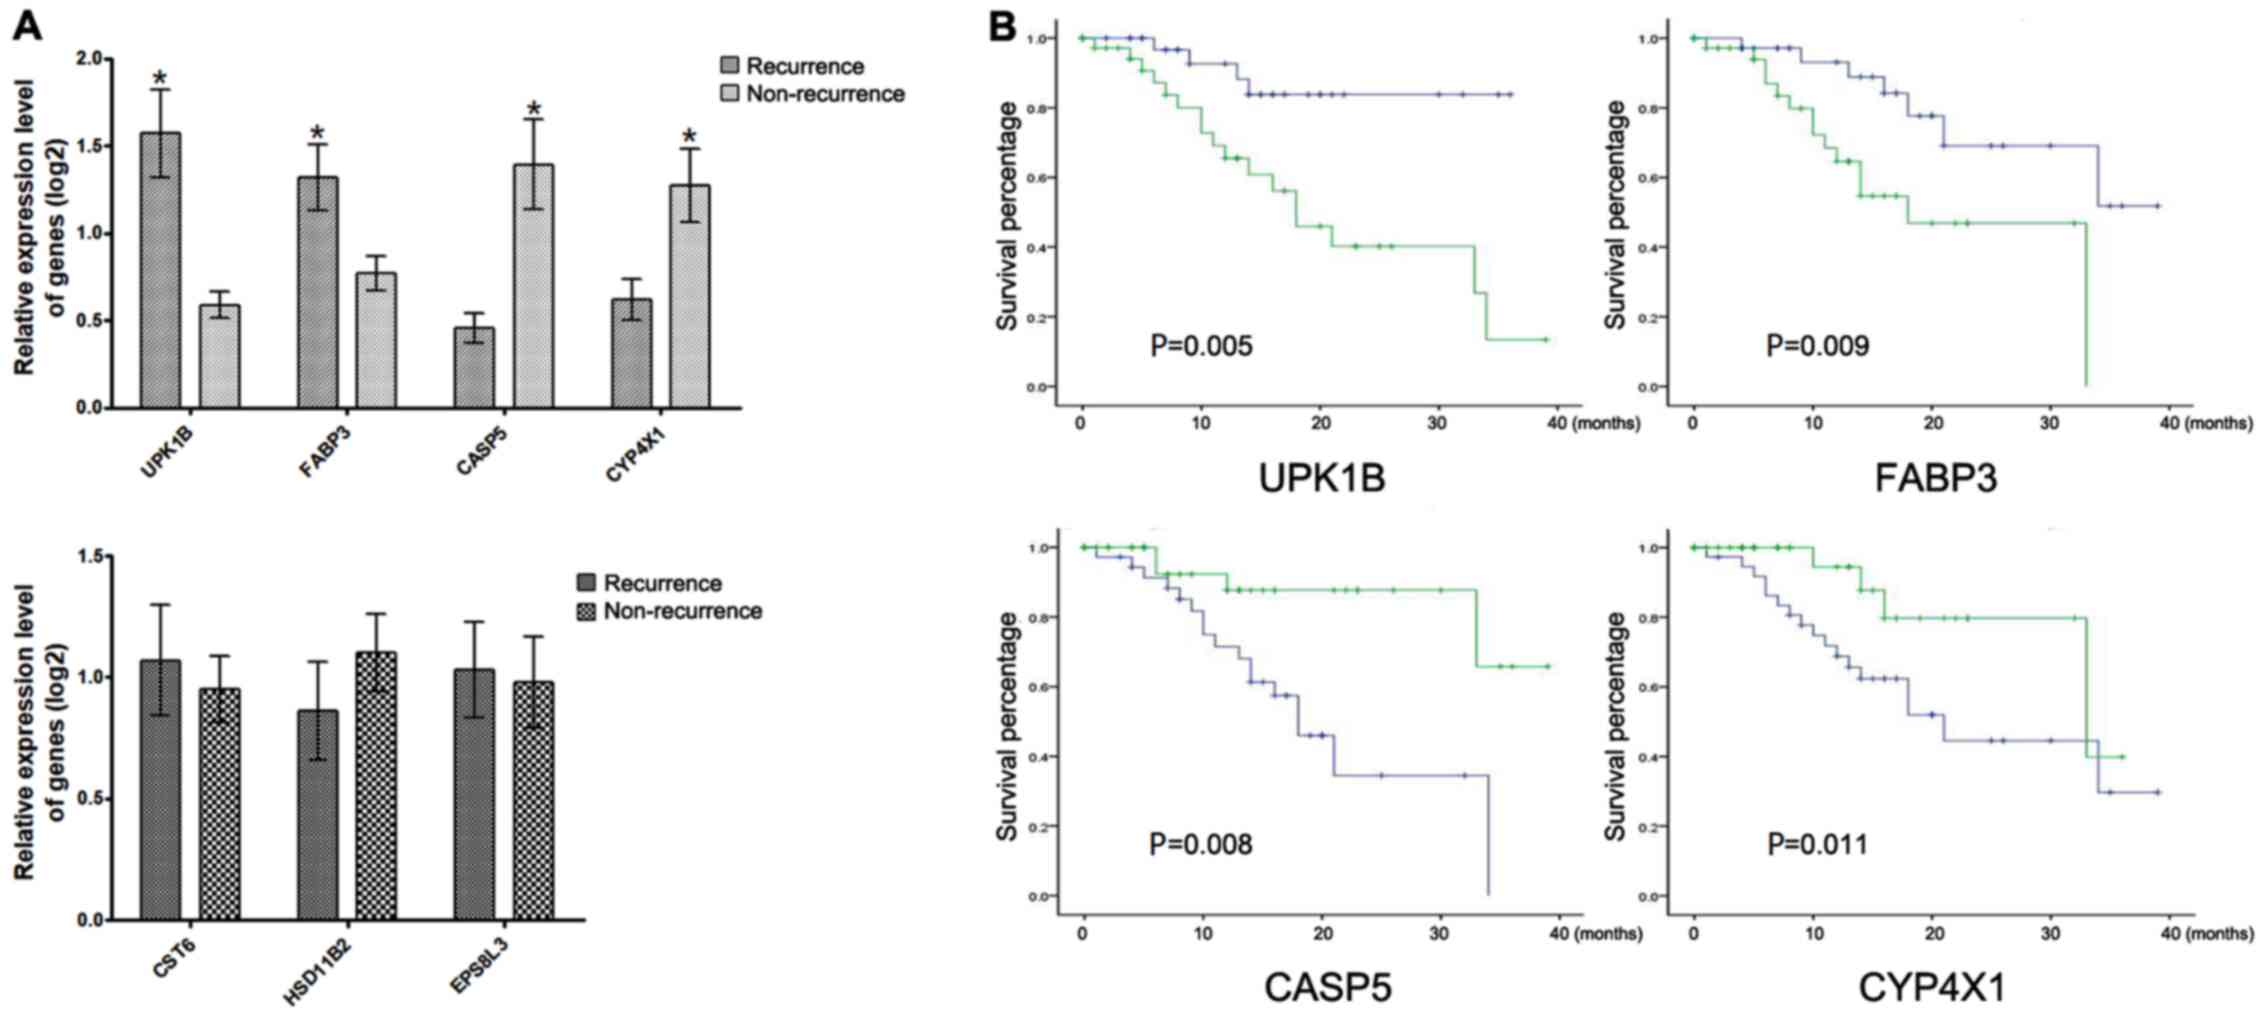 | Figure 3.Validation of the DEGs in clinical
tissue samples. (A) The DEGs with and without significantly
differential expression in patients with recurrence compared with
non-recurrence patients, P-values were calculated using the t-test.
(B) Kaplan-Meier survival curves for patients of GC with high/low
indicated gene expression in clinical GC tissues, P-values were
calculated using the Tarone-Ware test. *P<0.05, green line
represented high expression group and blue line represented low
expression group. DEGs, differentially expressed genes; GC, gastric
cancer; UPK1B, uroplakin-1b; FABP3, fatty acid-binding protein,
heart; CASP5, caspase-5; CYP4X1, cytochrome P450 4X1. |
Role of UPK1B, FABP3, CASP5 and CYP4X1
in the prediction of the GC CapeOX treatment outcomes
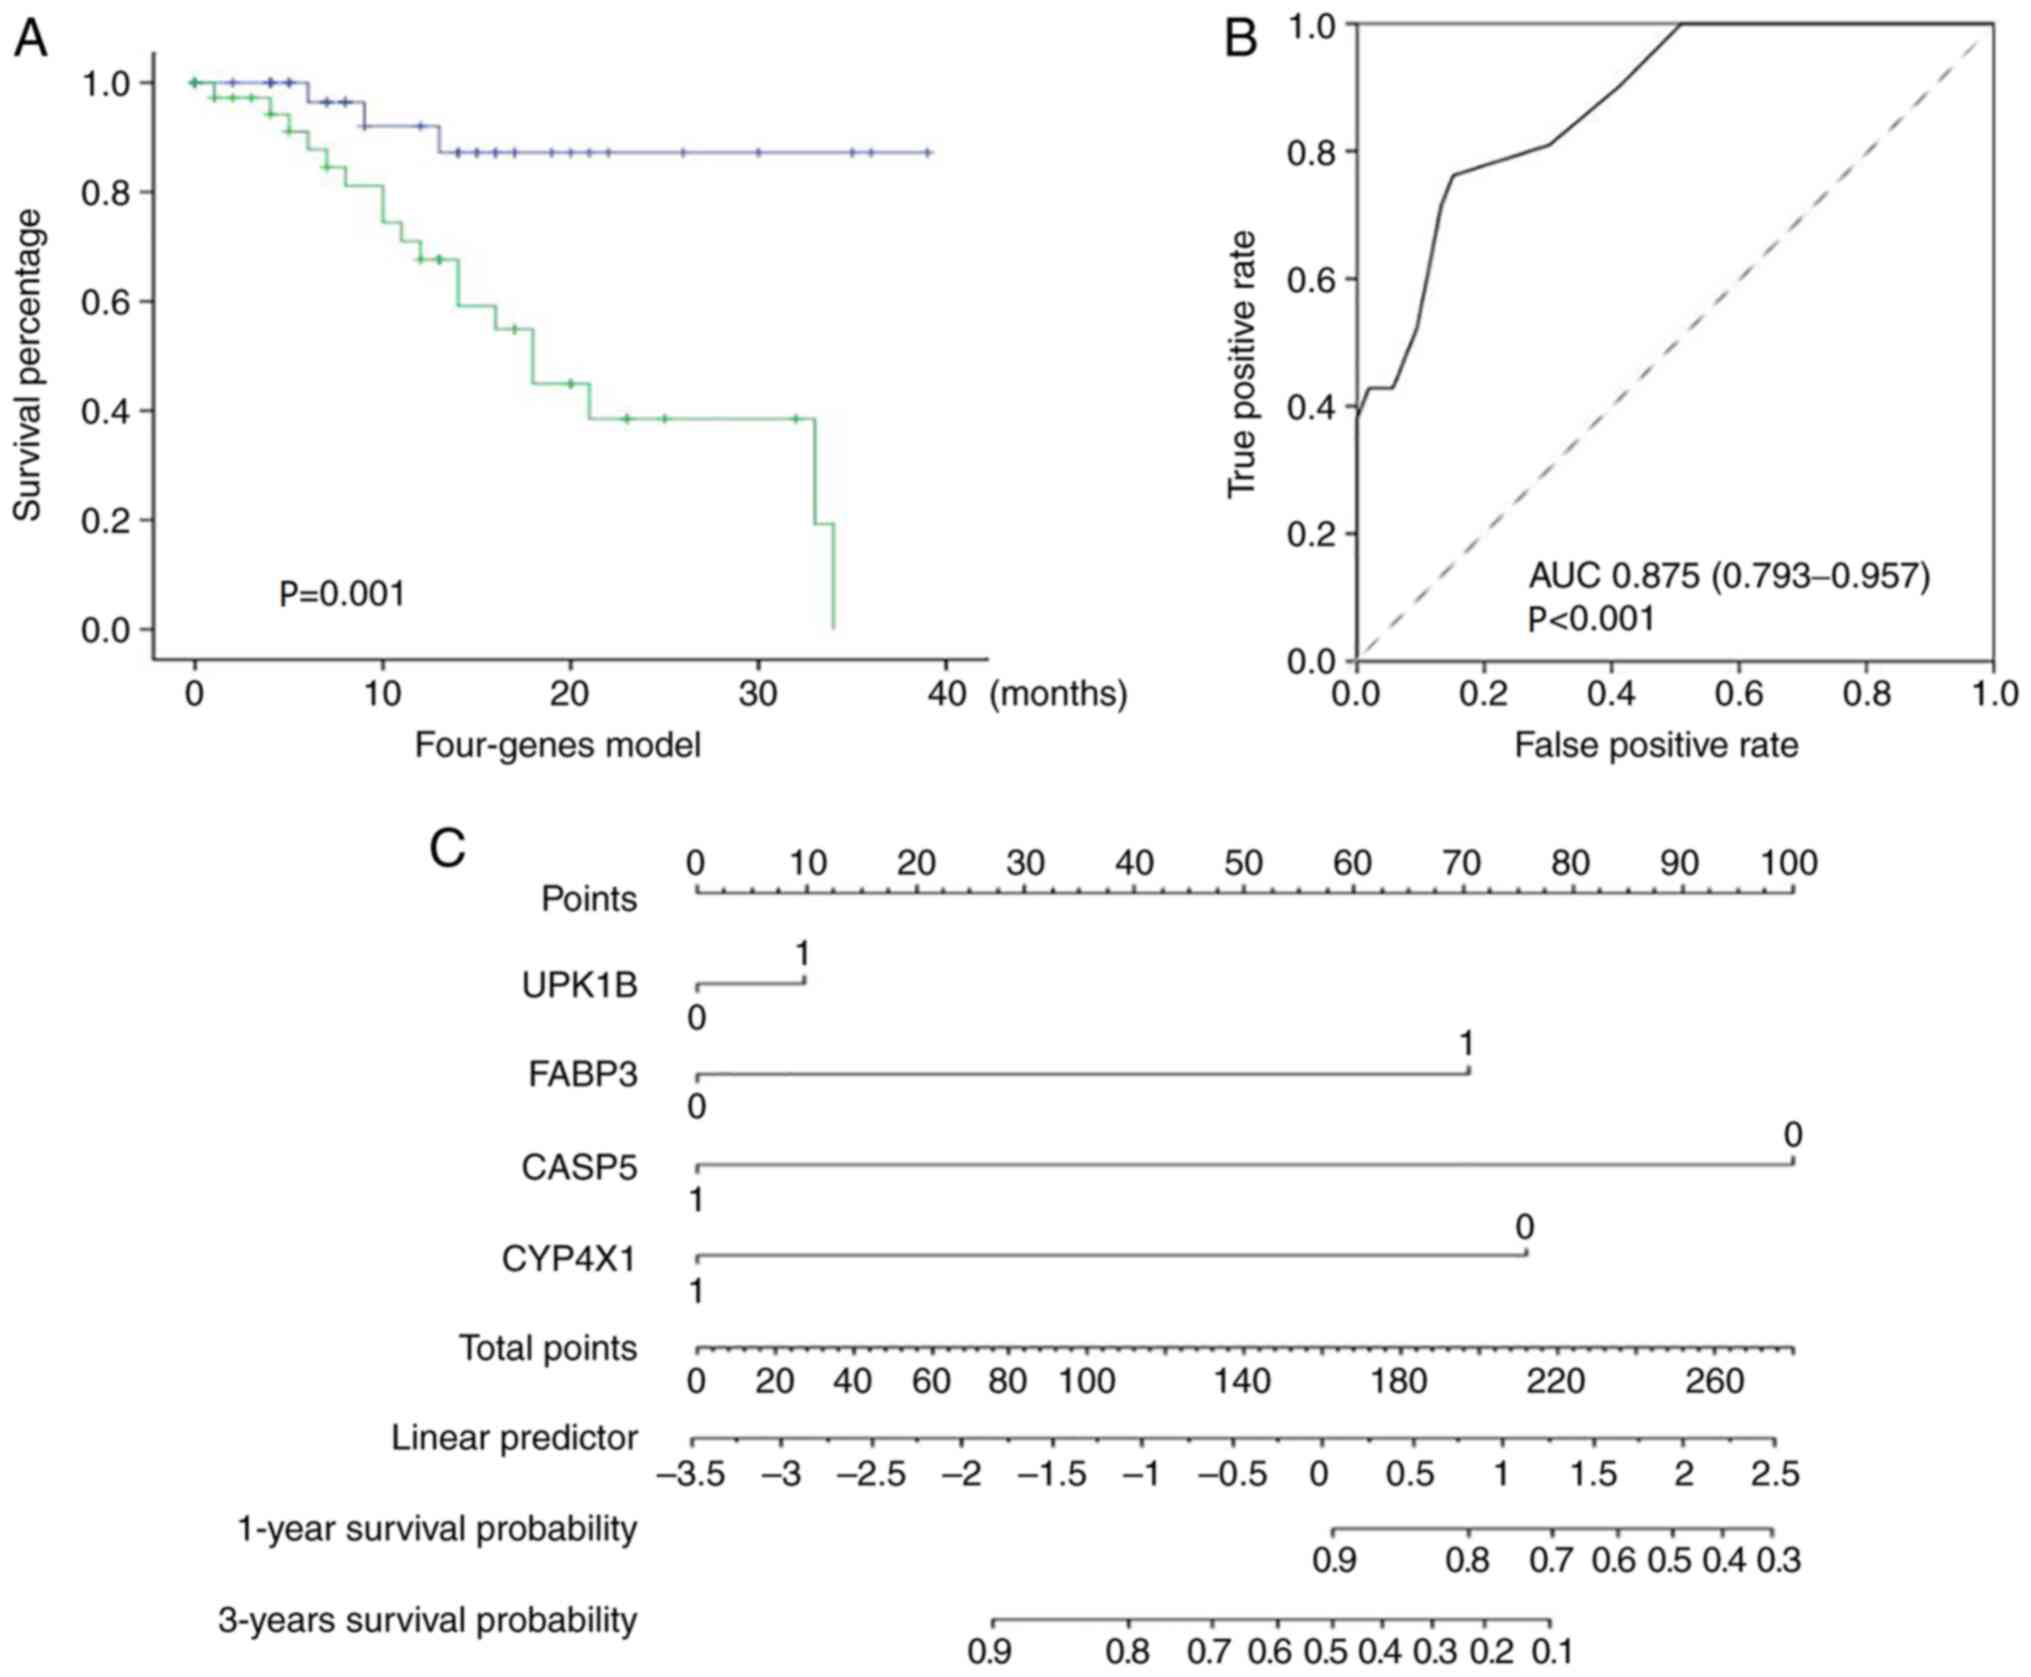
The combination of different markers as prognostic
indices appeared encouraging. Therefore, the prediction value of
the combination of the validated genes was further evaluated. A
multivariate Cox regression model was implemented using the four
genes UPK1B, FABP3, CASP5 and CYP4X1. The patients
were classified into high- or low-risk group by using the
regression model. The estimated risk was calculated using the
following formula: Risk = (1.209 × the status of UPK1B) +
(1.601 × the status of FABP3) - (1.517 × the status of
CASP5) - (0.786 × the status of CYP4X1). The gene
status was marked 1 if the expression was high. Otherwise, the gene
status was marked 0. The Kaplan-Meier survival analysis
demonstrated that patients in the high-risk group exhibited
significantly shorter survival rates compared with those in the
low-risk group (P<0.001; Fig.
4A). ROC curve analysis was also performed. The AUC of ROC
reached 0.875 (95% CI, 0.793–0.957; P<0.001), indicating that
the model had good sensitivity and specificity (Fig. 4B). A new nomogram was constructed to
facilitate clinical use in predicting 1-year and 3-year survival
rates (Fig. 4C). The comprehensive
analysis indicated that the combination of the four genes could
predict the outcome of GC CapeOX treatment.
Discussion
Chemotherapy resistance, whether primary or
acquired, is common (6). The
differences in molecular expression between tumors have resulted in
different responses of patients with cancer to chemotherapeutic
drugs (4–5). The accurate selection of
chemotherapeutic drugs, which maximize the effectiveness of
chemotherapy and reduce the toxic and side effects, is one of the
most critical issues in the clinical application of chemotherapy
(4–5).
In GC, platinum- and 5-Fu-based CapeOX therapy is
one of the common postoperative adjuvant chemotherapy regimens for
GC (3). Literature has reported that
various genes serve an important role in the occurrence of
resistance to capecitabine and oxaliplatin (8,11–14). Low
levels of tubulin β-3 chain and AMBP in serum can predict an
improved response and survival rates for patients with advanced GC
receiving capecitabine (11,12). When the proline rich 13 (PRR13) gene
is silenced, tumor suppressor region 1 (TSP1) expression is
increased and oxaliplatin resistance is significantly decreased in
GC cells (13). Consistently, the
therapeutic resistance to oxaliplatin of GC is significantly
weakened when gap junction α-1 protein is transfected (14). In addition, a variety of noncoding
RNAs are associated with capecitabine and oxaliplatin resistance in
GC cells (8,15).
To predict the sensitivity of chemotherapy, a
multiple genes panel can obtain higher sensitivity and specificity
compared with a single gene. However, in order to facilitate a
practical application, the number of genes in the majority of
panels is >100. For example, a tumor microenvironment risk score
prediction panel could predict whether patients with colon cancer
benefit from adjuvant chemotherapy (16). Thus far, no study has reported a
model of multiple gene combinations to predict the response of GC
to the CapeOX chemotherapy regimens, to the best of our knowledge.
Therefore, the introduction of new biomarkers could expand the
clinical options currently available to physicians.
In the present study, four genes associated with
CapeOX chemotherapy outcomes were finally identified through
multilevel screening and a prediction model was established. The
high expression of UPK1B and FABP3 and the low
expression of CASP5 and CYP4X1 in adjuvant
CapeOX-treated patients with GC were associated with poor
outcomes.
Studies have shown that UPK1B is closely
associated with the occurrence and development of malignant tumors
(17–20). The differential expression of
UPK1B in multiple tumors, including GC, has been
demonstrated and can predict the OS rates of patients (17,18).
However, the molecular mechanism underlying UPK1B function
in tumors has yet to be fully elucidated. UPK1B-knockdown
significantly reduces the expression of key genes in the
Wnt/β-catenin signaling pathway in cancer cells (19). The Wnt pathway is the key pathway for
the development of oxaliplatin resistance in tumors (20). Thus, UPK1B may regulate the
drug sensitivity of oxaliplatin through the Wnt signaling
pathway.
FABP3 belongs to the FABP family of proteins, which
control the metabolism and transport of long-chain fatty acids
(21–26). Studies have shown that fatty acid
metabolism is involved in tumorigenesis and tumor progression in
numerous types of cancer by affecting tumor proliferation and tumor
migration (21,22). Recent studies have demonstrated FABP3
abnormal expression in various types of cancer, including breast
cancer and brain tumors (23,24).
Elevated FABP3 expression is associated with tumor progression,
invasiveness and poor prognosis in GC and non-small cell lung
cancer (25,26). The findings of the present study
suggested that fatty acid metabolism may also serve an important
role in chemotherapy drugs.
CASP5 is an inflammatory caspase that serves a role
in the immune system (27–29). Inflammation and cancer development
are closely associated and a distinct inflammatory environment
often exists within tumors (27).
Multiple CASPs are abnormally expressed in GC and associated with
the survival rates of GC (28).
CASP5 gene overexpression can significantly promote the
angiogenesis ability of vascular endothelial cells by promoting the
VEGF signaling pathway (29). The
present study indicated that CASP5 could improve the OS
rates of patients with GC following CapeOX chemotherapy, suggesting
that the inflammation level may also serve an important role in the
response of tumors to chemotherapy drugs.
The CYP4X1 gene is located in the cytochrome
P450 ABXZ gene cluster and its function is largely unknown
(30). Cytochrome P450 is a
superfamily of heme-thiolate proteins involved in the oxidative
metabolism of endogenous compounds, including fatty acids and
arachidonic acid derivatives (31).
Arachidonic acid and its derivatives can be found widely in human
tissues and serve an important role as signaling mediators in the
nerve, immune and cardiovascular systems (31). CYP4X1 has also been reported
to be abnormally expressed in oral squamous cell cancer or breast
cancer (32,33). A previous study reported that
CYP4X1 is involved in important physiological processes in
the metabolism of arachidonic acid derivatives (34). As such, CYP4X1 has been
suggested as a potential drug target for cancer therapy (34). However, the mechanism of interaction
between CYP4X1 and chemotherapy drugs remains to be
elucidated.
The present study suggested that a variety of
different action pathways and different types of genes may serve a
role in the chemosensitivity of capecitabine and oxaliplatin. The
present study had limitations and further verification of the
results in a prospective and multicenter study is needed.
Evidently, validating the roles of UPK1B, FABP3, CASP5 and
CYP4X1 in GC and the CapeOX chemotherapy process through
further in vitro and in vivo experiments is
necessary. The current established model requires more samples for
the validation of its reliability.
Acknowledgements
Not applicable.
Funding
This study was funded by The Natural Science
Foundation of Jiangsu (grant no. BK20180215).
Availability of data and materials
All data generated or analyzed during this study are
included in this published article. The datasets generated and/or
analyzed during the current study are available in The Cancer
Genome Atlas repository (https://www.cancer.gov/about-nci/organization/ccg/research/structural-genomics/tcga)
and the Gene Ontology repository (http://www.geneontology.org/).
Authors' contributions
XG and YZ designed the study. ZY, RS, YJ and MG
performed the experiments. YJ, WX and MG analyzed the data. YZ
wrote the manuscript. All authors read and approved the final
manuscript.
Ethics approval and consent to
participate
Specimen collection was approved by The Ethics
Committee of the Affiliated Suzhou Hospital of Nanjing Medical
University (Suzhou, China) (approval no. 20180215). Written
informed consent was obtained from each patient.
Patient consent for publication
Not applicable.
Competing interests
The authors declare that they have no competing
interests.
References
|
1
|
Bray F, Ferlay J, Soerjomataram I, Siegel
RL, Torre LA and Jemal A: Global cancer statistics 2018: GLOBOCAN
estimates of incidence and mortality worldwide for 36 cancers in
185 countries. CA Cancer J Clin. 68:394–424. 2018. View Article : Google Scholar : PubMed/NCBI
|
|
2
|
Cainap C, Vlad C, Seicean A, Balacescu O,
Seicean R, Constantin AM, Balacescu L, Crisan O, Marta MM and
Cainap S: Gastric cancer: Adjuvant chemotherapy versus
chemoradiation. A clinical point of view. J BUON. 24:2209–2219.
2019.PubMed/NCBI
|
|
3
|
Xue K, Ying X, Bu Z, Wu A, Li Z, Tang L,
Zhang L, Zhang Y, Li Z and Ji J: Oxaliplatin plus S-1 or
capecitabine as neoadjuvant or adjuvant chemotherapy for locally
advanced gastric cancer with D2 lymphadenectomy: 5-year follow-up
results of a phase II–III randomized trial. Chin J Cancer Res.
30:516–525. 2018. View Article : Google Scholar : PubMed/NCBI
|
|
4
|
Lu Z, Zhang X, Liu W, Liu T, Hu B, Li W,
Fan Q, Xu J, Xu N, Bai Y, et al: A multicenter, randomized trial
comparing efficacy and safety of paclitaxel/capecitabine and
cisplatin/capecitabine in advanced gastric cancer. Gastric Cancer.
21:782–791. 2018. View Article : Google Scholar : PubMed/NCBI
|
|
5
|
Ahmad S: Platinum-DNA interactions and
subsequent cellular processes controlling sensitivity to anticancer
platinum complexes. Chem Biodivers. 7:543–566. 2010. View Article : Google Scholar : PubMed/NCBI
|
|
6
|
Peng J, Tan C, Zeng X and Liu S:
Cost-effectiveness analysis of capecitabine monotherapy versus
capecitabine plus oxaliplatin in elderly patients with advanced
gastric cancer. PLoS One. 13:e01995532018. View Article : Google Scholar : PubMed/NCBI
|
|
7
|
Kim ST, Ahn S, Lee J, Lee SJ, Park SH,
Park YS, Lim HY, Kang WK, Kim KM and Park JO: Value of FGFR2
expression for advanced gastric cancer patients receiving pazopanib
plus CapeOX (capecitabine and oxaliplatin). J Cancer Res Clin
Oncol. 142:1231–1237. 2016. View Article : Google Scholar : PubMed/NCBI
|
|
8
|
Fan B, Shen C, Wu M, Zhao J, Guo Q and Luo
Y: MiR-17-92 cluster is connected with disease progression and
oxaliplatin/capecitabine chemotherapy efficacy in advanced gastric
cancer patients: A preliminary study. Medicine (Baltimore).
97:e120072018. View Article : Google Scholar : PubMed/NCBI
|
|
9
|
Livak KJ and Schmittgen TD: Analysis of
relative gene expression data using real-time quantitative PCR and
the 2(-Delta Delta C(T)) method. Methods. 25:402–408. 2001.
View Article : Google Scholar : PubMed/NCBI
|
|
10
|
RStudio Team (2015). RStudio. Integrated
Development for R. RStudio, Inc.; Boston, MA: http://www.rstudio.com/
|
|
11
|
Yu J, Gao J, Lu Z, Li Y and Shen L: Serum
levels of TUBB3 correlate with clinical outcome in Chinese patients
with advanced gastric cancer receiving first-line paclitaxel plus
capecitabine. Med Oncol. 29:3029–3034. 2012. View Article : Google Scholar : PubMed/NCBI
|
|
12
|
Huang H, Han Y, Gao J, Feng J, Zhu L, Qu
L, Shen L and Shou C: High level of serum AMBP is associated with
poor response to paclitaxel-capecitabine chemotherapy in advanced
gastric cancer patients. Med Oncol. 30:7482013. View Article : Google Scholar : PubMed/NCBI
|
|
13
|
Bi J, Bai Z, Ma X, Song J, Guo Y, Zhao J,
Yi X, Han S and Zhang Z: Txr1: An important factor in oxaliplatin
resistance in gastric cancer. Med Oncol. 31:8072014. View Article : Google Scholar : PubMed/NCBI
|
|
14
|
Liu D, Zhou H, Wu J, Liu W, Li Y, Shi G,
Yue X, Sun X, Zhao Y, Hu X, et al: Infection by Cx43 adenovirus
increased chemotherapy sensitivity in human gastric cancer BGC-823
cells: Not involving in induction of cell apoptosis. Gene.
574:217–224. 2015. View Article : Google Scholar : PubMed/NCBI
|
|
15
|
Danza K, Silvestris N, Simone G, Signorile
M, Saragoni L, Brunetti O, Monti M, Mazzotta A, De Summa S, Mangia
A and Tommasi S: Role of miR-27a, miR-181a and miR-20b in gastric
cancer hypoxia-induced chemoresistance. Cancer Biol Ther.
17:400–406. 2016. View Article : Google Scholar : PubMed/NCBI
|
|
16
|
Zhou R, Zeng D, Zhang J, Sun H, Wu J, Li
N, Liang L, Shi M, Bin J, Liao Y, et al: A robust panel based on
tumour microenvironment genes for prognostic prediction and
tailoring therapies in stage I–III colon cancer. EBioMedicine.
42:420–430. 2019. View Article : Google Scholar : PubMed/NCBI
|
|
17
|
Pichler R, Fritz J, Tulchiner G,
Klinglmair G, Soleiman A, Horninger W, Klocker H and Heidegger I:
Increased accuracy of a novel mRNA-based urine test for bladder
cancer surveillance. BJU Int. 121:29–37. 2018. View Article : Google Scholar : PubMed/NCBI
|
|
18
|
Dai J, Li ZX, Zhang Y, Ma JL, Zhou T, You
WC, Li WQ and Pan KF: Whole genome messenger RNA profiling
identifies a novel signature to predict gastric cancer survival.
Clin Transl Gastroenterol. 10:e000042019. View Article : Google Scholar : PubMed/NCBI
|
|
19
|
Wang FH, Ma XJ, Xu D and Luo J: UPK1B
promotes the invasion and metastasis of bladder cancer via
regulating the Wnt/β-catenin pathway. Eur Rev Med Pharmacol Sci.
22:5471–5480. 2018.PubMed/NCBI
|
|
20
|
Kukcinaviciute E, Jonusiene V,
Sasnauskiene A, Dabkeviciene D, Eidenaite E and Laurinavicius A:
Significance of Notch and Wnt signaling for chemoresistance of
colorectal cancer cells HCT116. J Cell Biochem. 119:5913–5920.
2018. View Article : Google Scholar : PubMed/NCBI
|
|
21
|
Levi L, Wang Z, Doud MK, Hazen SL and Noy
N: Saturated fatty acids regulate retinoic acid signalling and
suppress tumorigenesis by targeting fatty acid-binding protein 5.
Nat Commun. 6:87942015. View Article : Google Scholar : PubMed/NCBI
|
|
22
|
Yarla NS, Bishayee A, Sethi G, Reddanna P,
Kalle AM, Dhananjaya BL, Dowluru KS, Chintala R and Duddukuri GR:
Targeting arachidonic acid pathway by natural products for cancer
prevention and therapy. Semin Cancer Biol. 40-41:48–81. 2016.
View Article : Google Scholar : PubMed/NCBI
|
|
23
|
Hyvonen M, Enback J, Huhtala T, Lammi J,
Sihto H, Weisell J, Joensuu H, Rosenthal-Aizman K, El-Andaloussi S,
Langel U, et al: Novel target for peptide-based imaging and
treatment of brain tumors. Mol Cancer Ther. 13:996–1007. 2014.
View Article : Google Scholar : PubMed/NCBI
|
|
24
|
Lopes-Coelho F, Andre S, Felix A and Serpa
J: Breast cancer metabolic cross-talk: Fibroblasts are hubs and
breast cancer cells are gatherers of lipids. Mol Cell Endocrinol.
462:93–106. 2018. View Article : Google Scholar : PubMed/NCBI
|
|
25
|
Hashimoto T, Kusakabe T, Sugino T, Fukuda
T, Watanabe K, Sato Y, Nashimoto A, Honma K, Kimura H, Fujii H and
Suzuki T: Expression of heart-type fatty acid-binding protein in
human gastric carcinoma and its association with tumor
aggressiveness, metastasis and poor prognosis. Pathobiology.
71:267–273. 2004. View Article : Google Scholar : PubMed/NCBI
|
|
26
|
Tang Z, Shen Q, Xie H, Zhou X, Li J, Feng
J, Liu H, Wang W, Zhang S and Ni S: Elevated expression of FABP3
and FABP4 cooperatively correlates with poor prognosis in non-small
cell lung cancer (NSCLC). Oncotarget. 7:46253–46262. 2016.
View Article : Google Scholar : PubMed/NCBI
|
|
27
|
Deshmukh SK, Srivastava SK, Poosarla T,
Dyess DL, Holliday NP, Singh AP and Singh S: Inflammation,
immunosuppressive microenvironment and breast cancer: Opportunities
for cancer prevention and therapy. Ann Transl Med. 7:5932019.
View Article : Google Scholar : PubMed/NCBI
|
|
28
|
Wang Z, Ni F, Yu F, Cui Z, Zhu X and Chen
J: Prognostic significance of mRNA expression of CASPs in gastric
cancer. Oncol Lett. 18:4535–4554. 2019.PubMed/NCBI
|
|
29
|
Li H, Li Y, Cai L, Bai B and Wang Y:
Effects of CASP5 gene overexpression on angiogenesis of HMEC-1
cells. Int J Clin Exp Pathol. 8:15794–15800. 2015.PubMed/NCBI
|
|
30
|
Carver KA, Lourim D, Tryba AK and Harder
DR: Rhythmic expression of cytochrome P450 epoxygenases CYP4×1 and
CYP2c11 in the rat brain and vasculature. Am J Physiol Cell
Physiol. 307:C989–C998. 2014. View Article : Google Scholar : PubMed/NCBI
|
|
31
|
Manikandan P and Nagini S: Cytochrome P450
structure, function and clinical significance: A review. Curr Drug
Targets. 19:38–54. 2018. View Article : Google Scholar : PubMed/NCBI
|
|
32
|
Russo A, Biselli-Chicote PM,
Kawasaki-Oyama RS, Castanhole-Nunes MMU, Maniglia JV, de Santi Neto
D, Pavarino ÉC and Goloni-Bertollo EM: Differential expression of
prostaglandin i2 synthase associated with arachidonic acid pathway
in the oral squamous cell carcinoma. J Oncol. 2018:63019802018.
View Article : Google Scholar : PubMed/NCBI
|
|
33
|
Murray GI, Patimalla S, Stewart KN, Miller
ID and Heys SD: Profiling the expression of cytochrome P450 in
breast cancer. Histopathology. 57:202–211. 2010. View Article : Google Scholar : PubMed/NCBI
|
|
34
|
Kumar S: Computational identification and
binding analysis of orphan human cytochrome P450 4X1 enzyme with
substrates. BMC Res Notes. 8:92015. View Article : Google Scholar : PubMed/NCBI
|